Embed Size (px)
Citation preview

Copyright © 2010 Pearson Addison-Wesley. All rights reserved.
Chapter 15
2k Factorial Experiments and Fractions

Copyright © 2010 Pearson Addison-Wesley. All rights reserved.
Section 15.1
Introduction

Copyright © 2010 Pearson Addison-Wesley. All rights reserved.
Section 15.2
The 2k Factorial: Calculation of Effects and Analysis of Variance

Copyright © 2010 Pearson Addison-Wesley. All rights reserved. 15 - 4
Table 15.1 A 22 Factorial Experiment

Copyright © 2010 Pearson Addison-Wesley. All rights reserved. 15 - 5
Figure 15.1 Response suggesting apparent interaction

Copyright © 2010 Pearson Addison-Wesley. All rights reserved. 15 - 6
Table 15.2 22 Factorial with No Interaction

Copyright © 2010 Pearson Addison-Wesley. All rights reserved. 15 - 7
Table 15.3 22 Factorial with Interaction

Copyright © 2010 Pearson Addison-Wesley. All rights reserved. 15 - 8
Figure 15.2 Interaction plot for data of Table 15.2

Copyright © 2010 Pearson Addison-Wesley. All rights reserved. 15 - 9
Figure 15.3 Interaction plot for data of Table15.3

Copyright © 2010 Pearson Addison-Wesley. All rights reserved. 15 - 10
Table 15.4 Signs for Contrasts in a 22 Factorial Experiments

Copyright © 2010 Pearson Addison-Wesley. All rights reserved. 15 - 11
Table 15.5 Signs for Contrasts in a 23 Factorial Experiment

Copyright © 2010 Pearson Addison-Wesley. All rights reserved. 15 - 12
Figure 15.4 Geometric view of 23

Copyright © 2010 Pearson Addison-Wesley. All rights reserved.
Section 15.3
Nonreplicated 2k Factorial Experiment

Copyright © 2010 Pearson Addison-Wesley. All rights reserved. 15 - 14
Table 15.6 Data for Case Study 15.1

Copyright © 2010 Pearson Addison-Wesley. All rights reserved. 15 - 15
Figure 15.5 Normal quantile-quantile plot of effects for Case Study 15.1

Copyright © 2010 Pearson Addison-Wesley. All rights reserved. 15 - 16
Table 15.7 Illustration of Two-Factor Interaction

Copyright © 2010 Pearson Addison-Wesley. All rights reserved. 15 - 17
Figure 15.6 Interaction plot for Case Study 15.1

Copyright © 2010 Pearson Addison-Wesley. All rights reserved. 15 - 18
Figure 15.7 SAS printout for data of Case Study 15.1

Copyright © 2010 Pearson Addison-Wesley. All rights reserved. 15 - 19
Figure 15.8 ANOVA table for Exercise 15.3

Copyright © 2010 Pearson Addison-Wesley. All rights reserved.
Section 15.4
Factorial Experiments in a Regression Setting

Copyright © 2010 Pearson Addison-Wesley. All rights reserved. 15 - 21
Table 15.8 Data for Example 15.2

Copyright © 2010 Pearson Addison-Wesley. All rights reserved. 15 - 22
Figure 15.9 SAS printout for data of Case Study 15.2
continued on next slide

Copyright © 2010 Pearson Addison-Wesley. All rights reserved. 15 - 23
Figure 15.9 SAS printout for data of Case Study 15.2 (cont’d)

Copyright © 2010 Pearson Addison-Wesley. All rights reserved.
Section 15.5
The Orthogonal Design

Copyright © 2010 Pearson Addison-Wesley. All rights reserved. 15 - 25
Figure 15.10a Geometric presentation of contrast for the 23 factorial design
continued on next slide

Copyright © 2010 Pearson Addison-Wesley. All rights reserved. 15 - 26
Figure 15.10b Geometric presentation of contrast for the 23 factorial design (cont’d)
continued on next slide

Copyright © 2010 Pearson Addison-Wesley. All rights reserved. 15 - 27
Figure 15.10c Geometric presentation of contrast for the 23 factorial design (cont’d)

Copyright © 2010 Pearson Addison-Wesley. All rights reserved. 15 - 28
Figure 15.11 A 22 design with center runs

Copyright © 2010 Pearson Addison-Wesley. All rights reserved. 15 - 29
Figure 15.12 22 factorial with 5 center runs

Copyright © 2010 Pearson Addison-Wesley. All rights reserved. 15 - 30
Figure 15.13 22 factorial with runs at (0,0)

Copyright © 2010 Pearson Addison-Wesley. All rights reserved. 15 - 31
Figure 15.14 Graph Exercise 15.17

Copyright © 2010 Pearson Addison-Wesley. All rights reserved.
Section 15.6
Fractional Factorial Experiments

Copyright © 2010 Pearson Addison-Wesley. All rights reserved. 15 - 33
Table 15.9 Contrasts for the Seven Available Effects for a 23 Factorial Experiment

Copyright © 2010 Pearson Addison-Wesley. All rights reserved. 15 - 34
Figure 15.15 The fractions of the 23 factorial
1
2

Copyright © 2010 Pearson Addison-Wesley. All rights reserved. 15 - 35
Table 15.10 Construction of the Two 23 -1 Designs

Copyright © 2010 Pearson Addison-Wesley. All rights reserved. 15 - 36
Table 15.11 Construction of the Two 24-1 Designs

Copyright © 2010 Pearson Addison-Wesley. All rights reserved. 15 - 37
Table 15.12 A 26-2 Design

Copyright © 2010 Pearson Addison-Wesley. All rights reserved.
Section 15.7
Analysis of Fractional Factorial Experiments

Copyright © 2010 Pearson Addison-Wesley. All rights reserved. 15 - 39
Table 15.13 Signs for Contrasts in a Half-Replicate of a 23 Factorial Experiments

Copyright © 2010 Pearson Addison-Wesley. All rights reserved. 15 - 40
Table 15.14 Data for Example 15.6

Copyright © 2010 Pearson Addison-Wesley. All rights reserved. 15 - 41
Table 15.15 Analysis of Variance for the Data of a Half-Replicate of a 25 Factorial Experiment

Copyright © 2010 Pearson Addison-Wesley. All rights reserved.
Section 15.8
Higher Fractions and Screening Designs
Copyright © 2010 Pearson Addison-Wesley. All rights reserved. 15 - 43
Definition 15.1

Copyright © 2010 Pearson Addison-Wesley. All rights reserved.
Section 15.9
Construction of Resolution III and IV Designs with 8,16,and 32 Design Points

Copyright © 2010 Pearson Addison-Wesley. All rights reserved. 15 - 45
Table 15.16 Some Resolution III, IV, V, VI and VII 2k-p Designs

Copyright © 2010 Pearson Addison-Wesley. All rights reserved.
Section 15.10
Other Two-Level Resolutions III Designs; The Plackett-Burman Designs

Copyright © 2010 Pearson Addison-Wesley. All rights reserved.
Section 15.11
Introduction to Response Surface Methodology

Copyright © 2010 Pearson Addison-Wesley. All rights reserved. 15 - 48
Table 15.17 Central Composite Design for Example 15.8

Copyright © 2010 Pearson Addison-Wesley. All rights reserved. 15 - 49
Figure 15.16 Central composite design for Example 15.8

Copyright © 2010 Pearson Addison-Wesley. All rights reserved. 15 - 50
Figure 15.17 Plot for the response surface prediction conversion for Example 15.8

Copyright © 2010 Pearson Addison-Wesley. All rights reserved. 15 - 51
Figure 15.18 Contour plot of predicted conversion for Example 15.8

Copyright © 2010 Pearson Addison-Wesley. All rights reserved.
Section 15.12
Robust Parameter Design
Copyright © 2010 Pearson Addison-Wesley. All rights reserved. 15 - 53
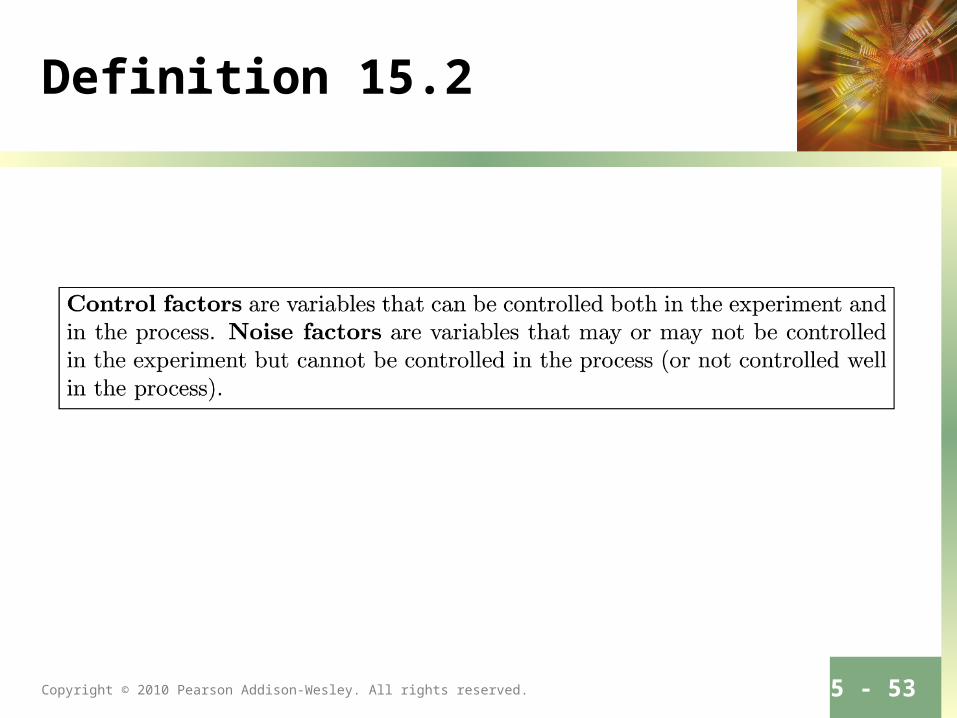
Definition 15.2

Copyright © 2010 Pearson Addison-Wesley. All rights reserved. 15 - 54
Table 15.18 Design for Example 15.9

Copyright © 2010 Pearson Addison-Wesley. All rights reserved. 15 - 55
Table 15.19 Control Factors for Case Study 15.3

Copyright © 2010 Pearson Addison-Wesley. All rights reserved. 15 - 56
Table 15.20 Noise Factors for Case Study 15.3

Copyright © 2010 Pearson Addison-Wesley. All rights reserved. 15 - 57
Table 15.21 Crossed Arrays and Response Values for Case Study 15.3

Copyright © 2010 Pearson Addison-Wesley. All rights reserved. 15 - 58
Figure 15.19 Plot showing the influence of factors on the mean response

Copyright © 2010 Pearson Addison-Wesley. All rights reserved. 15 - 59
Figure 15.20 Mean and standard deviation for Case Study 15.4

Copyright © 2010 Pearson Addison-Wesley. All rights reserved. 15 - 60
Table 15.22 Experimental Data in a Crossed Array

Copyright © 2010 Pearson Addison-Wesley. All rights reserved. 15 - 61
Figure 15.21 Interaction plots for the data in Table 15.22

Copyright © 2010 Pearson Addison-Wesley. All rights reserved. 15 - 62
Figure 15.22 Interaction plots for the data in Exercise 15.31

Copyright © 2010 Pearson Addison-Wesley. All rights reserved.
Potential Misconceptions and Hazards; Relationship to Material in Other Chapters
Section 15.13

![Jacobi-Type Continued Fractions for the Ordinary …arXiv:1610.09691v2 [math.CO] 17 Jan 2017 Jacobi-Type Continued Fractions for the Ordinary Generating Functions of Generalized Factorial](https://img.dokumen.tips/doc/110x75/5e6bd88058bea966f344624e/jacobi-type-continued-fractions-for-the-ordinary-arxiv161009691v2-mathco-17.jpg)