Embed Size (px)
Citation preview

COVER SHEET
This is the author version of article published as:
Ayoko, Godwin and Singh, Kirpal and Balerea, Steven and Kokot, Serge (2007) Exploratory multivariate modeling and prediction of the physico-chemical properties of surface water and groundwater. Journal of Hydrology 336(1-2):pp. 115-124.
Copyright 2007 Elsevier Accessed from http://eprints.qut.edu.au
Exploratory multivariate modeling and prediction of the physico-chemical properties of 1 surface water and groundwater 2 3 4 5 6 7 Godwin A. Ayoko*a, Kirpal Singh b, Steven Balerea b, Serge Kokota 8 9 aSchool of Physical and Chemical Sciences, Queensland University of 10 11 Technology, GPO 2434, Brisbane 4001, Australia. 12 13 bSchool of Natural Sciences, University of Papua New Guinea, P.O. Box 320, 14 15 University Post Office, NCD Papua New Guinea 16 17 . 18 19 20 21 22 23 24
Author to whom correspondence should be addressed. Email: [email protected]; Fax: 25 +61 7 31381804; Tel: +61 7 31381206 26
27 28 29 30 31 32 33 34 35 36 37 38 39 40 41 42 43 44 45 46 47 48 49 50 51

2
Abstract 52 53 Physico-chemical properties of surface water and groundwater samples from some 54
developing countries have been subjected to multivariate analyses by the non-parametric 55
multi-criteria decision-making methods, PROMETHEE and GAIA. Complete ranking 56
information necessary to select one source of water in preference to all others was obtained, 57
and this enabled relationships between the physico-chemical properties and water quality to 58
be assessed. Thus, the ranking of the quality of the water bodies was found to be strongly 59
dependent on the total dissolved solid, phosphate, sulfate, ammonia-nitrogen, calcium, iron, 60
chloride, magnesium, zinc, nitrate and fluoride contents of the waters. However, potassium, 61
manganese and zinc composition showed the least influence in differentiating the water 62
bodies. To model and predict the water quality influencing parameters, partial least square 63
analyses were carried out on a matrix made up of the results of water quality assessment 64
studies carried out in Nigeria, Papua New Guinea, Egypt, Thailand and India/Pakistan. The 65
results showed that the total dissolved solid, calcium, sulfate, sodium and chloride contents 66
can be used to predict a wide range of physico-chemical characteristics of water. The 67
potential implications of these observations on the financial and opportunity costs associated 68
with elaborate water quality monitoring are discussed. 69
Keywords: multivariate modeling and prediction, water quality 70 71 72 73 74 75 76 77 78 79 80 81 82 83 84 85 86

3
Introduction 87 88 Water is vital to health, well-being, food security and socio-economic development of 89
mankind. Therefore, the presence of contaminants in natural freshwater continues to be one 90
of the most important environmental issues in many areas of the world, particularly in 91
developing countries, where several communities are far away from potable water supply 92
(WHO, 1993; WHO, 1996). Low-income communities, which rely on untreated surface 93
water and groundwater supplies for domestic and agricultural uses are the most exposed to 94
the impact of poor water quality. Unfortunately, they are also the ones that do not have 95
adequate infrastructure to monitor water quality regularly and implement control strategies 96
(Ongley and Booty, 1999). Many of such communities abound in developing countries, 97
where irregular supply of electricity for continuous pumping of treated water, absence of 98
piping systems in some areas, variability of rainfall and increased demand for water as the 99
population grows seriously impede access to potable water supply. Drastic changes in 100
climatic conditions make the situation worse. For example, as a result of the 1997 El Nino, it 101
was estimated that over a million people in Papua New Guinea faced acute food shortage and 102
at least 45, 000 people were without fresh water (UNOCHA, 1998). However, the problem of 103
potable water supply is a global issue. Many of the earth’s major rivers and groundwater 104
supplies are either overexploited or polluted due to population growth, agricultural activities, 105
urbanisation and industralisation. In Poland, three quarters of the rivers were thought to be 106
too polluted even for industrial use; two-thirds of China’s rivers were regarded as 107
contaminated; forty rivers in Malaysia were reported as not being able to support aquatic life 108
due to pollution; and in Manila, Philippines, over 60% of the main rivers supposedly contain 109
untreated sewage (IRC, 1995). Thus, it is increasingly desirable to obtain reliable 110
assessments of water quality, which can be used for water resource planning and assessment 111
of policy options in order to sustain human well being, industrial growth and food security. 112

4
Differences in the pollutant loading of freshwaters from different sources may result 113
from differences in the geological background, hydrological systems, anthropogenic 114
activities and transformations of water components by microorganisms (Einax et al, 1997). 115
Therefore, pollutant concentrations from different sampling sites and environmental phases 116
are subject to high variability, which require careful evaluation and interpretation. In 117
addition, water quality depends on a variety of physico-chemical parameters and meaningful 118
prediction, ranking analysis or pattern recognition of the quality of water require multivariate 119
projections methods for simultaneous and systematic interpretation. Thus a wide range of 120
multivariate projection methods has been applied to hydrospheric samples (Einax et al, 121
1997). However, the multi-criteria decision making methods, PROMETHEE (Preference 122
Ranking Organisation METHod for Enrichment Evaluation) and GAIA (Geometrical 123
Analysis for Interactive Aid) (Brans, 1991 and 2002; Brans and Mareschal, 1989 and 2005; 124
Kokot and Phuong, 1999; Epinasse et al, 1997; Ayoko, et al, 2004) have not been employed 125
in the literature for multivariate ranking analysis of the parameters that influence water 126
quality. Similarly, there are relatively few applications of multivariate predictive modeling in 127
environmental problems (Eriksson, 2001). 128
To assess the quality of water for drinking and irrigation purposes, many variables are 129
routinely monitored. This produces a large database but the process of data acquisition can be 130
time-consuming, laborious and expensive while accurate interpretation of the multivariate 131
data can be challenging. 132
This paper reports the physico-chemical properties of some surface - and ground - 133
waters and the interpretation of the data with the aid of Chemometrics methods. To provide 134
scientific data, which can be used for water resource planning and assessment of policy 135
options in countries where availability of potable water supply is a problem, we used data 136
from exploratory water quality studies that were conducted in Nigeria, Papua New Guinea, 137
Egypt, Thailand and India/Pakistan to (i) model and predict the relationships between the 138

5
factors (X) and the water quality influencing responses (Y), (ii) understand which X variables 139
influence particular Y variable(s) and (iii) which X variables can be used as surrogates to 140
provide information about water quality. The work enhances basic knowledge of the physico-141
chemical quality of ground - and surface - waters from developing countries, and provides a 142
guide to the understanding of the relationships between the factors and responses, and the 143
implementation of predictive models for water quality. 144
Materials and methods 145
Samples of surface water from rivers and groundwater from boreholes were collected 146
in Papua New Guinea at a period that coincided with the end of dry season and the beginning 147
of the raining season (November to December). For comparison, the quality indicators for 148
water samples from Hudiara drain which extends over a distance of 44.2 km in India and 54.4 149
km in Pakistan (Afzal et al, 2000), as well as various groundwater and surface waters in 150
Nigeria (Okoye,1991; Olajire et al, 2001; Agbu, 1984 and Alaribe, 1984, Ibe and Njemanze, 151
1999) Chao Praya and Mae Klong rivers in Thailand (Kruawal et al, 2005), groundwater 152
samples from Egypt (El-dars, 2005) and Fly river in Papua New Guinea (Salomons and 153
Eagle, 1990) were used as reported in the literature. 154
High-density polyethylene containers capable of taking up to 1L of water and 155
equipped with screw caps were used for sample collection. Each container was washed with 156
1M HCl and rinsed several times with deionized water before sample collection. The samples 157
were stored in an Esky containing ice and then transported immediately to the laboratory, 158
where they were filtered through 0.45 μm millipore filters. The filtrates were acidified to pH 159
<2 with 6M HNO3 and stored at 4oC in a refrigerator until analysed for the metals by 160
standard methods (APHA, 1989). The pH, temperature, conductivity and Total Dissolved 161
Solid (TDS) measurements were done on site using a Metrohm 620 pH meter for pH 162
measurements and Hach conductivity/Total Dissolved Solid meter for electrical conductivity, 163

6
temperature and total dissolved solid measurements. All other parameters were determined 164
within two days of sample collection. 165
Ammonia-nitrogen was determined by the Nessler method. HACH 5 DR/2000 166
spectrophotometer, digital titrator was used for measurements of physical and inorganic ions 167
( HACH, 1989) and Atomic Absorption Spectrometer (Perkin Elmer 310) was employed for 168
the determination of the metals. Standard calibration curves were obtained by analyzing 169
standards prepared by serial dilution of 1000 ppm stock solutions. Duplicate determinations 170
were made on most samples and the blank and standard curves were checked after every 10 171
determinations. The replicated measurements did not differ by more than 5%. 172
Data processing 173
All analytical data were initially processed using Microsoft Excel 2003 software for 174
Windows (Microsoft Corporation) and then subjected to PROMCALC software and Decision 175
LAB 2000 (Brans, 1991; Decision Lab 2000, 1999) for multi-criteria decision making 176
(MCDM) analysis by the PROMETHEE and GAIA procedures or to SIMCA–P 10.0 177
Umetrics AB for principal component analysis and partial least squares. 178
PROMETHEE and GAIA Procedures 179
PROMETHEE and GAIA procedures have been described by various researchers (Brans, 180
1991 and 2002; Brans and Mareschal, 1989 and 2005; Kokot and Phuong, 1999; Epinasse et 181
al, 1997; Ayoko, et al, 2004). Essentially, they are non-parametric methods based on pairwise 182
comparisons of the objects and variables. PROMETHEE facilitates the ranking or ordering of 183
a number of objects (in this work, the water bodies) according to preference and weighting 184
conditions, which have been pre-selected by the user and are applied to the variables (e.g. 185
concentrations of nutrients, pH, temperature, conductivity, and total dissolved solid). 186
Therefore, the first step was to choose a preference function, which provides the 187
mathematical basis for selecting one object in preference to another. Of the six preference 188
functions available in the procedures, the V-shaped function (P), which required a threshold 189

7
value to be applied to each variable was used in this work. The threshold was set at the WHO 190
Limit for each variable. But when there is no WHO Limit for a variable, the highest value of 191
the variable in a given column was used. Additionally, since a lower value indicates a better 192
water quality, it was specified that lower variable values are preferred by choosing the 193
‘minimise’ function when modeling each variable. 194
To refine the preference selection process, positive and negative outranking flows, φ + 195
and φ - respectively were computed within PROMETHEE. The former expresses how each 196
object outranks all others while the latter indicates how each object is outranked by all the 197
other objects. By applying the set of rules described previously (Brans, 1991 and 2002; Brans 198
and Mareschal, 1989 and 2005; Kokot and Phuong, 1999; Espinasse et al, 1997; Ayoko, et al, 199
2004), PROMETHEE II , which provides a full ranking of all objects from the best to the 200
worst based on their net outranking flow was obtained. 201
GAIA, on the other hand, uses principal component analysis techniques to evaluate 202
and display PROMETHEE results visually. It facilitates the interpretation of the global 203
performance of each object with reference to a decision vector, π, which appears in the 204
biplot. Thus, useful information about the underlying trends in the data matrix such as 205
clustering of objects or variables and characterisation of outliers may be obtained from GAIA 206
biplots. One of the marked advantages of GAIA procedures over other multivariate data 207
analysis methods is that the reduction and standardization of data to unit variance is 208
unnecessary (Massart et al, 1997) since PROMETHEE serves as a data pre-treatment 209
procedure for GAIA. Furthermore, PROMETHEE and GAIA use only two principal 210
components to produce results that are similar to those from principal component analysis. 211
Nevertheless, their outcomes are comparable to those of their common alternatives (Brans 212
and Mareschall, 1989; Geldermann, 2001) and they have been rated as the best among 213
sixteen multi-criteria decision making methods applied to solve a multi-criteria water bodies 214
problem (Al-Shemmeri, 1997). 215

8
Partial Least Squares (PLS) 216
PLS works with two matrices X (e.g. factors) and Y (e.g. responses). The main objectives of 217
this technique are to: (i) well approximate X and Y and (ii) to model the relationship between 218
them (SIMCA P 10.0,UmetricsAB; www.umetrics.com). The response block is represented 219
by the Y scores, U, while the predictive block (X) is described by X scores, T. PLS 220
maximises the covariance between U and T by decomposing Y and X as shown in the 221
equations below. 222
Y= UCT + F (1) 223
X= TPT + E (2) 224
where P and C are loadings or loadings vectors, and E and F are the residuals or errors in X 225
and Y matrices respectively. 226
Validation of PLS Models 227
When data sets that were not originally designed for calibrations are analysed (as in this 228
work), there is a high probability that over-fitting would occur and that chance correlation 229
rather than real correlations are observed. To avoid this, model validation is performed by 230
cross-validation (“leave-one-out” method) or by using a calibration set. In this work, internal 231
validation using cross-validation, external validation and response permutation were used. 232
Cross-validation: This involved keeping out parts of the data during model development, 233
developing the model from the reduced data, predicting the parts kept out by different models 234
and comparing the predicted values with actual values (Wold 1978). A predicted variation, 235
Q2 (the fraction of the total variation of the X’s that can be predicted by a component) is 236
calculated for the optimal number of PLS components and this can be compared with the R2 237
(the fraction of the sum of squares explained by the component). In this work, cross-238
validation was carried out using the software, SIMCA P 10.0,Umetrics AB. 239

9
External validation: The entire data matrix was split into two nearly equals. One half was 240
used as the calibration set and the other as the prediction set. 241
Response permutation: This was performed in order to confirm the significance of the R2Y 242
(fraction of the sum of squares of all the Y’s explained by a component) and Q2Y (fraction of 243
the total variation of Y’s that can be predicted by the component) values obtained from the 244
internal validation process. Detailed results are presented under results and discussion. 245
Results and discussion 246
General description of the five of the ground - and surface - waters 247
The results of the analyses carried out on the surface waters and groundwater from Papua 248
New Guinea are presented in Table 1 (which also describes the abbreviations subsequently 249
used for these water bodies).These results are the means of triplicate measurements, which 250
agreed within ±5% of each other. It is evident that a wide variation exists in the quality of 251
water from the water bodies sampled. 252
The pH of all of the samples is generally within the optimum range of 6.5-9.5 (WHO, 253
1996) with most having pH values less than 7. The pH of surface - and ground-waters usually 254
reflects their humic acid, CO2, CO32- and HCO3
- contents (Olajire and Imeokparia, 2001; Jior 255
et al, 1991) and the observed pH values may suggest the presence of acidic matter such as 256
humic acids and free CO2 in these water samples. The temperature (27.3-28.60C) is also 257
within the international allowable standard. While its value has no direct effect on human 258
health and well-being, it may impact on the rate of chemical and biochemical reactions, the 259
solubility of gases in the water, and in turn the taste and odour. Consequently, strong 260
unpleasant odour from water may reflect the release of dissolved gases at high temperatures. 261
The electrical conductivity of the samples varied widely from 60 to 530 μmho/cm and 262
reflects the amount of charged substances in the water samples. Similarly, the Total 263
Dissolved Solids (TDS), which gives a good indication of the salinity ranged from 30 – 250 264
ppm. WHO recommends that its value should be less than 500 ppm but pegs acceptable limits 265
10
for water potability at 1500 ppm (WHO, 1996). Additionally, TDS in excess of 1000 ppm are 266
objectionable to consumers and have adverse effects on crop production (Pescod, 1977). 267
The concentrations of the inorganic anions (F-, NO3-, NO2
-, PO43- and SO4
2- ) in the 268
waters were generally well within their respective WHO limits. Although there are 269
considerable concerns about the level of fluoride in water (Akher, 1998), the highest 270
observed fluoride level was 0.1 ppm for the Papua New Guinea groundwater 2 (PGG2). Even 271
at this level, it is well below the threshold concentration (14 ppm) for the onset of crippling 272
fluorosis but it is within the limit for the onset of mild dental fluorosis (WHO, 1996). 273
The sodium contents of the samples were within the desirable limit of 200 ppm for 274
drinking water (WHO, 1996). WHO has no limit for potassium, which is usually present in 275
water in lower proportions than sodium. The Ca and Mg contents are generally below 100 276
ppm in these samples. This suggests that they are soft waters, which have high tendencies to 277
be corrosive to water pipes (WHO, 1996). Although these cations are not present at toxic 278
levels in the water samples, the water samples may still be phytotoxic and this could limit 279
their use for agricultural purposes (Pescod, 1992). In contrast to the concentrations of Na, Ca, 280
and Mg, the ammonia concentrations showed little variation from one sample to another but 281
were generally lower than the WHO guideline value limit of 1.5 ppm as were the zinc 282
concentrations. At 0.4 ppm, the concentration of iron in PGG2 was above 0.3 ppm, which is 283
the limit above which iron stains laundry (WHO, 1993;WHO, 1996). The manganese 284
concentrations of two of the Papua New Guinea wells (PGG2 and Papua New Guinea 285
groundwater 4 (PGG4) are above the WHO guideline value of 0.4 ppm and this is a reason 286
for concern since manganese is known to cause adverse neurological effects following 287
exposure from drinking water (WHO, 1996). The Cu, Pb, Cd, Zn and Ni concentrations of 288
these waters were either below the detection limits of the Atomic Absorption Spectrometric 289
method employed for the quantification of the metals or below the WHO guidelines values 290
for the metals (WHO, 1993;WHO, 1996). 291

11
Only a few (fluoride, arsenic, nitrate and lead) of the chemical substances present in 292
drinking water are known to cause widespread health effects in humans. Thus, the health 293
risks posed by chemical substances are not as acute as those posed by microbial contaminants 294
(WHO, 1993; WHO, 1996). Nevertheless, significant health effects may arise from exposure 295
to the chemical constituents of water over a prolonged period. In this respect, it is noteworthy 296
that substances, such as heavy metals, which have cumulative toxic properties, are not found 297
at prohibitory levels in these water samples. 298
Ranking of water quality 299
To rank the water bodies and unearth patterns in the parameters that influence water 300
quality, the data were subjected to PROMETHEE and GAIA analyses. The PROMETHEE II 301
complete ranking results indicated that the net flow for the water bodies are 0.13, 0.07, 0.06, 302
0.03 and -0.02 respectively for PGS1, PGG2, PGS3, PGG5 and PGG4.. Thus, the most 303
preferred source is PGS1 followed by PGG2, PGS3, PGG5 and PGG4 (in this order). The 304
net outranking flow shows the spread of the objects (the water bodies) in such a way that the 305
farther apart the outranking flows of any two water bodies, the larger the preference of the 306
water body with the more positive outranking flow over that with the more negative flow. 307
Exploratory pattern recognition 308
In order to examine the variables that were most important in the ranking of the 309
surface waters and groundwaters, Principal Component Analysis (PCA) of the 5 waters was 310
performed with the aid of SIMCA P 10.0,Umetrics AB software. To minimise the skewness 311
of the data (as a result of missing values) a constant number (100) was added to all variables 312
and the data was log transformed and auto-scaled (mean-centered and scaled to unit variance) 313
before PCA modeling. Approximately 72% of the variance is explained by the first two PCs. 314
A close study of the scores plot displayed in Figure 1a reveals the following instructive 315
details: The water samples were separated on the first principal component (denoted as t[1] 316
in the SIMCA P-10 software). One cluster consisting exclusively of groundwater samples 317

12
from a particular locality (PGG4, and PGG5) had negative t[1] scores while water samples 318
from other locations (PGS1, PGG2, PGS3,) had positive t[1] scores (Figure 1a). The 319
preliminary conclusion from these exploratory PCA was that the principal basis for the 320
discrimination on t[1] is the geographic origin of the water supplies. It is well known that 321
chemical constituents of water may arise from natural sources (e.g rocks and soils) as well as 322
agricultural and industrial activities, which differ from one location to another (WHO, 1993; 323
WHO, 1996). 324
The loadings plot (Figure 1b) showed that the first principal component loading 325
vector (denoted as p[1] in the SIMCA P-10 software) has fairly large positive coefficients for 326
NO2-, NO3
- and NH3-N, and relatively large negative coefficients for conductivity, Cl-, Fe, 327
SO42- and PO4
3-. The second principal component loadings vector (p[2]) has relatively large 328
positive coefficients for Na and K, and large negative coefficients for conductivity. Thus, 329
these are the dominant variables in ranking the water bodies. Five broad groups of such 330
variables are apparent from the loadings plot in Figure 1b. Group A consisted of TDS, PO4 2-331
, Cl- and SO4 2-, group B is made up of conductivity, Mg, F- and Fe; group C consisted of 332
Na and K ; group D is made up of NH3-N, NO2- and NO3
- and group E contained Ca, Zn, pH 333
and Mn. 334
Exploratory comparison of international data 335
Overall PROMETHEE ranking: For the purpose of multivariate data analysis, the primary 336
water quality data in Table 1 was treated as matrix 1, while additional data obtained from 337
previous water quality studies carried out on water samples from Nigeria and Papua New 338
Guinea (Okoye,1991; Olajire et al, 2001; Agbu, 1984 and Alaribe, 1984; Ibe and Njemanze, 339
1999; Salomons and Eagle, 1990) were treated as matrix 2, literature data on similar 340
investigations conducted on Indian/Pakistani waters (Afzal et al, 2000) were treated as 341
matrix 3 and data from Thai and Egyptian studies (Kruawal et al, 2005; El-dars, 2005) were 342
treated as matrix 4. The water sources were compared because they represented examples of 343

13
surface - and ground- waters qualities in developing countries where water resource planning 344
and water quality assessment policy options are most urgently required. In order to compare 345
the results of the multivariate analysis obtained in the current study with those from other 346
similar water quality studies carried out in Nigeria and Papua New Guinea (matrix 2) and 347
India/Pakistan (matrix 3) and Thailand and Egypt (matrix 4), the four matrices were 348
combined into a single matrix, the variables were given equal weights and the matrix 349
analysed by PROMETHEE. A complete PROMETHEE II outranking flow for the combined 350
matrix is presented in Table 2. Sample NGS21 (surface water no.21 from Nigeria (Okoye, 351
1991) has the most positive outranking flow value. Therefore, its quality outranks those of all 352
other water samples. Conversely, sample EGG52 has the lowest net outranking flow value 353
and it is outranked by all other water samples. Generally, based on the physico-chemical 354
properties of the water samples, most Nigerian water samples (Okoye, 1991; Ibe and 355
Njemanze, 1999; Ekpo and Inyang, 2000) are among the best performing water bodies. The 356
Indian/Pakistani water samples are generally amongst the medium and best performing 357
waters, the Papua New Guinean water samples were generally medium performers and the 358
Thai and Egyptian samples were among the least performing. Evidently, the qualities of the 359
water samples are significantly influenced but not solely determined by their geographic 360
origins. It is, however, noteworthy that variables such as PO43-, SO4
2-, NH3-N, TDS, Mn, 361
NO2-, Mg, Cl, Ca, Na, and K, which account for large data variances in the analysis of the 362
combined matrix, contribute significantly to the ranking of the water bodies. 363
Selection of global key variables 364
Overall Principal Component Analysis : Next, using SIMCA P-10 software, we carried out 365
PCA on matrices consisting of (i) matrix 1, (ie results from the current study) (ii) matrix 2 366
(results from published studies conducted in Nigeria (Okoye, 1991; Ibe and Njemanze, 367
1999;;Ekpo and Inyang, 2000) and Papua New Guinea (Salomons and Eagle, 1990) (iii) 368
matrix 3 (data obtained from a study carried out by Afzal et al (Afzal et al, 2000) in 369

14
India/Pakistan, matrix 4 (data obtained from Kruawal et al, 2005; El-dars, 2005 studies) and 370
(iv) a combination of matrices 1, 2, 3 and 4. When variables reported in these literature 371
references were weighted equally, the most important and least important variables identified 372
from each PCA are presented in Table 3. Of these variables TDS, Ca, SO42- , Na and Cl 373
appear among the most important variables in each of the matrices in Table 3. Therefore, they 374
were selected as the most important variables influencing the water qualities. Interestingly, 375
the scores plot for the combined matrix (Figure 2) showed that the water bodies from matrix 376
1 and most from matrix 2 (Agbu, 1984 and Alaribe, 1984 Okoye, 1991; Ibe and Njemanze, 377
1999; Ekpo and Inyang, 2000) had positive t[1] scores (Cluster C) while all of the 378
India/Pakistan water bodies had negative t[1] and t[2] scores (Cluster A). However, some of 379
the objects from matrix 2 (Salomons and Eagle, 1990) had negative t[1] and t[2] scores 380
(Cluster A) while most of the objects from matrix 4 had positive t[2] but negative t[1] scores 381
(Cluster B). 382
The key variables for prediction 383
Overview PLS model: The main conclusions from the above analyses are (i) the water 384
bodies were separated to a large extent on t[1] and t[2] on the basis of their geographic 385
origins, although this is not the only parameter influencing their qualities and (ii) TDS, Ca, 386
SO42- Na and Cl- are the most important variables that influence the water qualities. Kettaneh 387
et al (2005) have suggested that not all variables in a matrix are important. If there are N (26 388
in this case) variables in a matrix, they suggested that the salient feature of the matrix will be 389
dominated by √N variables (about 5 in this case). We therefore set out to test whether the five 390
variables identified as the most important variables could be used as surrogates to predict 391
physico-chemical properties of water in developing countries where, due to lack of the 392
necessary infrastructure and expertise, it is not possible to carry out elaborate water quality 393
studies. Thus, a PLS model in which TDS, Ca, SO42- Na and Cl- were used as X variables 394
was developed for the combined data matrix (N = 57) yielding two significant components 395

15
with the cumulative R2X (sum of squares for the X-block) = 0. 84; cumulative R2Y (sum of 396
squares for the Y block) = 0.34 and cumulative Q2 (fraction of the total variation of the X’s 397
that can be predicted by the components) = 0.30. According to Sun (Sun, 2004), Q2 values 398
equal or higher than 0.3 can be interpreted, Q2 greater than 0.5 is associated with a good 399
model while Q2 is greater than 0.9 for an excellent model. Furthermore, the inner 400
relationship of the Y-block PLS scores (denoted as u[1] in the SIMCA p-10 software) against 401
the X-block scores (t[1]) was linear with the regression equation y = x -7 x 10⁻⁷, R2 = 0.72 402
and N = 57 at 95% confidence level. This indicates that the correlation between the Y block 403
and X block is significant at 95% confidence level and that the X variables can be used to 404
predict the Y variables encountered in this study. 405
To confirm the validity of the model, several parallel models in which the X (factors) 406
data in the calibration set is kept constant and the Y (responses) data randomly reordered 407
were developed [Eriksson et al, 2001]. New values of R2Y and Q2Y computed from the 408
permuted Y data were then compared with the estimates of the R2Y and Q2Y from the parent 409
PLS model in order to appraise the statistical significance of the latter values. In this work, 410
the permutation procedure were repeated two hundred times and if every time lower R2Y and 411
Q2Y values were obtained than those from of the original data, the significance of the “real” 412
PLS model was confirmed (Eriksson, 2001). The result of response permutation obtained in 413
the present work showed that the intercepts obtained for plot of R2Y and Q2Y (Y-axis) 414
against the correlation coefficients between the permuted and original response variables (X-415
axis) for a model in which X = Total Dissolved Solid, Ca, SO42-, Na and Cl- ; Y= 416
Conductivity and number of samples = 57 were R2 = 0.0, 0.04 and Q2 = 0.0, -0.06. Eriksson 417
et al (2001) have shown that when R2 < 0.3-0.4 and Q2 < 0.05 the explanatory and predictive 418
powers of the model are much higher than those obtained from randomly fitted Y data. 419
Therefore the present model is valid. 420

16
When the water bodies with odd sample numbers (N =29) were used for model 421
calibration and those with even sample numbers (N = 28) were used as validation sets, the 422
correlation coefficients (R2) of plots of the observed and predicted variable values together 423
with the root mean square errors of prediction (RMSEP) are presented in Table 4. Given the 424
facts that (i) the water bodies are from widely different origins, (ii) the studies were 425
undertaken under different conditions and (iii) the limit of acceptable R2 at 95% coefficient 426
level is 0.28 for 50 samples (Minium et al, 1993), it is evident that variables like PO4 3-, NH3-427
N, Mg, NO3-, NO2
-, Fe, F-, Mn, As, Se and B can be confidently predicted. The root mean 428
square of the errors of prediction (RMSEP), which might have arisen from (i) errors in the 429
calibration set, (ii) errors in the prediction set, and (iii) errors in the prediction, are generally 430
low (cf Eriksson, 2001). Similarly, the percentage absolute error (defined as 100 X (observed 431
value-calculated value/observed value) is generally below 10% (Haus et al, 2003). Hortwitz 432
(1982) suggested that at 1 ppm level, about 16% error is expected in the interlaboratory 433
comparison measurements. Thus, the prediction efficiency of the model for these variables is 434
comparable to the interlaboratory analysis experience. 435
Implications 436
The paper reported the use of PROMETHEE and GAIA procedures for the systematic 437
interpretation of surface - and ground - waters quality in developing countries. 438
PROMETHEE ranked the water bodies based on 26 water quality-influencing variables. 439
Importantly, apart from the present study, the data used for the modeling and prediction was 440
obtained from various investigations, indicating that globalization of information with the use 441
of chemometrics is a very feasible approach for studying performance and prediction issues 442
in water quality. Information from modest, cost-effective and affordable water quality studies 443
may be brought together for meaningful exploratory (or large) investigations. In this 444
exploratory study, the application of chemometrics techniques to a moderate size data set, 445
consisting of globally diverse samples, has led to the extraction of information, which 446

17
potentially could have significant benefits for lowering water analysis costs, especially in the 447
developing countries. Patterns from PCA plots identified TDS, Ca, SO42-, Na and Cl- as the 448
most important variables influencing the ranking of the water bodies. These variables were 449
subsequently found (by PLS analysis) to be useful for modeling and predicting the levels of 450
the other water pollutants. Available methods for monitoring the variables are comparatively 451
cheap and it is palpable that the chemometrics procedures highlighted in this paper could (i) 452
reduce the financial and opportunity cost associated with extensive monitoring of the 453
chemical and physical qualities of surface water and groundwater and (ii) be used in 454
developing countries to obtain reasonably good estimates of the levels of other pollutants in a 455
water resource from the TDS, Ca, SO42- Na and Cl- contents. Although the modeling 456
described did not produce satisfactory prediction for some water quality indicators 457
,considering the fact that data used for the modeling were obtained for investigations that 458
were not carried out under identical conditions, the results provide a support for the viability 459
of our concept – the possibility of using multivariate data analysis methods to predict water 460
quality from a few easily measured variables. More work is required on this concept in order 461
derive appropriate types of indicators from which water quality can be confidently predicted. 462
Acknowledgements 463
We acknowledge the assistance of Robin Totome during the experimental stage of this work. 464
References 465
Afzal, S., Ahmad, I., Younas, M., Din Zahid, M., Atique Khan, M. H., Ijaz, A. and Ali, K. 466
2000, Study of water quality of Hudiara drain, India-Pakistan, Environmental 467
International, 26, 87-96 468
Agbu, A.A. 1984, Quality of Well Water in Samaru, MSc thesis, Ahmadu Bello University, 469
Zaria, Nigeria 470
Akhter, M. S. 1998, Assessment of toxicity level of fluoride in underground waters used for 471
irrigation in Bahrain, Environmental Toxicology and Water Quality, 13, 111-115. 472

18
Alaribe, H. C. 1984, Quality of Well Water in Old Zaria City, MSc thesis, Ahmadu Bello 473
University, Zaria, Nigeria 474
Al-Shemmeri,T.; Al-Kloub, B. and Pearman, A. 1997, ‘Model choice in multicriteria 475
decision aid’, European Journal of Operational Research, 97, 550-560. 476
APHA Standard methods for examination of water and wastewater; prepared and published 477
jointly by: American Public Health Association (APHA); American Water Works 478
Association (AWWA), and Water Pollution Control Federation (WPCF), New York, 479
17 th Edition, 1989 480
Ayoko, G. A., Morawska, L., Kokot, S., and Gilbert, D. 2004, An application of multicriteria 481
decision making methods to air quality in the microenvironments of residential houses 482
in Brisbane, Australia, Environmental Science and Technology, 38, 2609-2616. 483
Brans, J. P.:1991 PROMCALC (Version 3:1), Centre for Statistics and Operations 484
Research, Free University of Brussels, Brussels. 485
Brans, J.P.: 2002, Ethics and decision European Journal of Operational Research, 136, 340-486
352 487
Brans, J. P., Mareschal, B.: 1989 PROMETHEE-GAIA Visual Interactive Modelling for 488
Multicriteria Location Problems, Internal Report University of Brussels, 489
STOOTW/244 490
Brans, J. P., Mareschal, B.: 2005 PROMETHEE Methods in Figueira, J., Greco,S., and 491
Ehrgott, M., Multiple Criteria Decision Analysis –State of the Art Surveys, 163-195, 492
Springer, New York. 493
Decision Lab 2000 Executive edition, 1999, Getting started guide, Visual Decision Inc., 494
Montreal, Canada, 495
Einax, J. W. Zwanziger, H. and Geiβ, S. 1997, Chemometrics in Environmental Analysis, 496
VCH, Weinheim, pp 284-317 and references therein.. 497

19
Ekpo, N. M. and Inyang, L. E. D. 2000, Radioactivity, Physical and Chemical Parameters of 498
Underground and Surface Waters in Qua Iboe River Estuary, Nigeria, Environmental 499
Monitoring and Assessment, 60, 47-55. 500
El-dars, F. M.S.2005, Evaluation of groundwater quality within a typical Egyptian village, 501
North of Cairo, Egypt, Annali di Chimica, 95, 357-368. 502
Eriksson, L. Hagberg, P., Johansson, E., Rannar, S., Whelehan, O., Astrom, A., and 503
Lindgren, T.2001, Multivariate process monitoring of newsprint mill. Application to 504
modelling and predicting COD load resulting from de-inking of recycled paper, 505
Journal of Chemometrics, 15, 337-352. 506
Espinasse, B., Picolet, G., and Chouraqui, E. 1997,Negotiation support systems: A multi-507
criteria and multi-agent approach’, European Journal of Operational Research,103, 508
389-409. 509
Geldermann J. and Zhang K.: 2001, Software Review: Decision Lab 2000, Journal of multi-510
criteria Decision Analysis, 10, 317-323. 511
HACH Chemical Co. Conductivity/TDS Meter-Model 44600 Manual. Hach Chemical 512
Company, Loveland, Colorado, USA, 1989 ed. 513
Haus, F; Boissel, O. and Junter G. A. 2003, Multiple regression modelling of mineral base oil 514
biodegradability based on their physical properties and overall chemical composition, 515
Chemosphere, 50, 939-948 516
Hortwitz, W. 1982, Evaluation of analytical methods used for regulation of foods and drungs, 517
Analytical Chemistry, 54, 67A-76A 518
Ibe, K. M.(Sr) and Njemanze, G. N., 1999, The impact of urbanization and protection of 519
water in Owerri and environs SE, Nigeria. Environmental Monitoring and 520
Assessment, 58, 337-348 521

20
IRC, Report: 1995, A developing Crisis, Water and Sanitation for all: A world Priority, 522
Prepared by IRC International Water and Sanitation Centre, The Hague, Ministry, 523
Spatial Planning and Environment. 524
Jior, R. S., Saxena, P. K., and Kondal, J. K., 1991, Impact of the Budha Nallah Brook on the 525
river Satluj waters. I - Some physico-chemical parameters, International Journal of 526
Environmental Studies, 39, 101-112. 527
Ketteneh, N., Berglund A.,and Wold S.: 2005, ‘PCA and PLS with very large data sets’, 528
Computational Statistics & Data Analysis, 48, 69-85. 529
Kokot, S. and Phuong, T.D. 1999, Elemental content of Vietnamese rice Part 2. Multivariate 530
data analysis, Analyst, 124, 561-569. 531
Kruawal, K. Sacher, F., Werner, A., Muller, J.and Knepper, T. P. 2005, Chemical water 532
quality in Thailand and its impacts on the drinking water production in Thailand, 533
Science of the Total Environment, 340, 57-70. 534
Massart, D. L., Vandeginste, B. G. M., Buydens, L. M. C., De Jong, S., Lewi, P. J.and 535
Smeyers-verbeke, J.: 1997, ‘Other Optimisation’, Methods In Handbook of 536
Chemometrics and Qualimetrics: Part A, Elsevier, Amsterdam, Chapter 26, pp 771-537
804. 538
Minium, E. W., Kingle, B. M. and Bear, G. 1993 Statistical Reasoning in Psychology and 539
Education, New York, Wiley, 3rd Edition. 540
Okoye, B. C. O.1991, Nutrients and selected chemical analysis in the Lagos Lagoon surface 541
waters, International Journal of Environmental Studies, 38, 131-136 542
Olajire, A. A.and Imeokparia, F. E. 2001, Water quality assessment of Osun river: Studies on 543
inorganic nutrients, Environmental Monitoring and Assessment, 69, 17-28. 544
Ongley E. D. and Booty, W. G. 1999, Pollution remediation planning in developing 545
countries: Conventional modeling versus knowledge based prediction Water 546
International, 21, 31-38. 547
21
Pescod, M. B.1977, Surface water quality Criteria for tropical developing countries’-Editors 548
Feacham, R., MacGarry, M. Mara, D. – Water, Wastes and health in hot climates, 549
John Wiley & Sons, London 53. 550
Pescod, M. B.1992, Wastewater treatment and use in agriculture, Irrigation and drainage 551
paper 47. Rome, Italy: Food and Agriculture Organisation of the United Nations. 552
Salomons, W., and Eagle, A.M. 1990, Hydrology, sedimentology and the fate and 553
distribution of copper in mine related discharges in the fly river system, Papua New 554
Guinea, The Science of the Total Environment, 97/98, 315-334. 555
Sun, H. 2004, A universal molecular descriptor system for prediction of Log P, Log S, LoB 556
and absorption, Journal of Chemical Informatics and Computational Science, 44, 557
748-757 558
UNOCHA :1998, News in Brief, Water Research. Journal., June 559
Wold S.: 1978, Cross-validatory estimation of the number of components in factor and 560
principal component models, Technometrics, 20, 397-405. 561
World Health Organisation. 1993, Guidelines for drinking water quality. 2nd Ed, Vol. 1. 562
Recommendations. WHO, Geneva. 563
World Health Organisation 1996, Guidelines for drinking water quality, 2nd Ed, Vol. 2. 564
Health criteria and other supporting information, Geneva, World Health Organization. 565
566
567
568
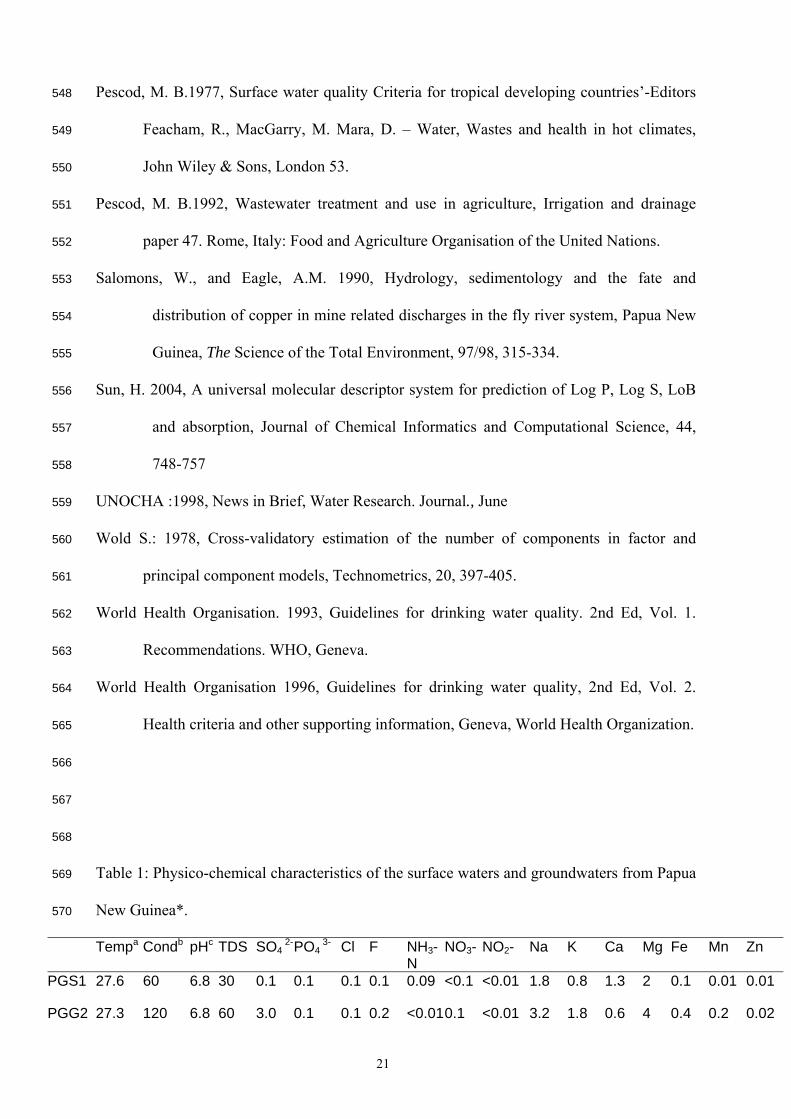
Table 1: Physico-chemical characteristics of the surface waters and groundwaters from Papua 569
New Guinea*. 570
Tempa Condb pHc TDS SO4 2- PO4
3- Cl F NH3-N
NO3- NO2- Na K Ca Mg Fe Mn Zn
PGS1 27.6 60 6.8 30 0.1 0.1 0.1 0.1 0.09 <0.1 <0.01 1.8 0.8 1.3 2 0.1 0.01 0.01
PGG2 27.3 120 6.8 60 3.0 0.1 0.1 0.2 <0.010.1 <0.01 3.2 1.8 0.6 4 0.4 0.2 0.02

22
PGS3 27.5 60 6.8 30 0.1 0.1 0.1 0.1 0.08 0.1 <0.01 8.0 13.5 1.2 2 0.1 0.04 0.01
PGG4 28.6 530 7.0 250 1.0 0.1 0.5 0.1 0.06 <0.1 <0.01 12.5 0.7 24 25 <0.011.2 0.01
PGG5 28.5 410 7.5 220 0.1 0.1 1.8 0.01 0.04 <0.01<0.01 17.0 0.2 48 9 <0.010.04 0.09
571
* The Cu, Cd, Zn and Ni contents of the waters were generally below the detection 572
limit of the atomic absorption spectrometric method used. a in 0C; b in μs cm-1; c in pH 573
unit; all other measurements are in ppm; PGS1 = Papua New Guinea surface water 1; 574
PGG2 = Papua New Guinea groundwater 2; PGS3 = Papua New Guinea surface water 575
3; PGG4 = Papua New Guinea groundwater 4; PGG5 = Papua New Guinea 576
groundwater 5; 577

Table 2: PROMTHEE II complete ranking results for the water bodies from this study as well as other similar studies conducted in Nigeria, Egypt, Thailand, Papua New Guinea and India/Pakistan.
Object*
φ + φ -
Net outranking flow (φ)
Rank Origin* Ref
NGS21 0.0385 0.0035 0.0350 1 NG Ibe and Njemanze, 1999 NGS10 0.0384 0.0036 0.0348 2 NG Ibe and Njemanze, 1999 NGS12 0.0382 0.0040 0.0342 3 NG Ibe and Njemanze, 1999 PGS22 0.0382 0.0043 0.0340 4 NG Salomons and Eagle, 1990 NGS20 0.0381 0.0044 0.0337 5 NG Ibe and Njemanze, 1999 NGS11 0.0382 0.0048 0.0334 6 NG Ibe and Njemanze, 1999 NGS9 0.0377 0.0045 0.0332 7 NG Ibe and Njemanze, 1999 NGG6 0.0375 0.0043 0.0331 8 NG Agbu, 1984 NGG7 0.0373 0.0045 0.0329 9 NG Alaribe, 1984 NGS8 0.0374 0.0046 0.0327 10 NG Ibe and Njemanze, 1999 NGS13 0.0373 0.0056 0.0316 11 NG Ibe and Njemanze, 1999 PGS1 0.0358 0.0060 0.0298 12 PG This work NGS19 0.0335 0.0088 0.0247 13 NG Ekpo and Inyang, 2000 IPG43 0.0238 0.0062 0.0177 14 IP Afzal et al, 2000 IPG45 0.0238 0.0062 0.0177 15 IP Afzal et al, 2000 EGG46 0.0238 0.0061 0.0177 16 EG El-dars, 2005 NGS15 0.0245 0.0079 0.0166 17 NG Ibe and Njemanze, 1999 NGG18 0.0228 0.0079 0.0149 18 NG Ibe and Njemanze, 1999 NGS14 0.0222 0.0102 0.0120 19 NG Ibe and Njemanze, 1999 PGG2 0.0254 0.0148 0.0106 20 PG This work NGG16 0.0203 0.0112 0.0091 21 NG Ekpo and Inyang, 2000 PGS3 0.0258 0.0213 0.0045 22 PG This work IPG32 0.0164 0.0119 0.0045 23 IP Afzal et al, 2000 IPG31 0.0163 0.0128 0.0035 24 IP Afzal et al, 2000 PGG5 0.0234 0.0208 0.0026 25 PG This work IPG29 0.0142 0.0144 -0.0001 26 IP Afzal et al, 2000 PGS23 0.0142 0.0145 -0.0003 27 PG Salomons and Eagle, 1990 IPG40 0.0125 0.0159 -0.0034 28 IP Afzal et al, 2000 IPG44 0.0126 0.0164 -0.0038 29 IP Afzal et al, 2000 PGS24 0.0134 0.0179 -0.0045 30 NG Salomons and Eagle, 2000 IPG39 0.0122 0.0169 -0.0047 31 IP Afzal et al, 2000 EGG46 0.0121 0.0170 -0.0049 32 EG El-dars, 2005 IPG42 0.0121 0.0171 -0.0050 33 IP Afzal et al, 2000 PGG4 0.0157 0.0215 -0.0058 34 PG This work IPG37 0.0119 0.0179 -0.0060 35 IP Afzal et al, 2000 IPG30 0.0110 0.0186 -0.0075 36 IP Afzal et al, 2000 IPG36 0.0121 0.0199 -0.0078 37 IP Afzal et al, 2000 IPG38 0.0107 0.0210 -0.0103 38 IP Afzal et al, 2000 IPG28 0.0104 0.0213 -0.0108 39 IP Afzal et al, 2000 IPG26 0.0102 0.0211 -0.0109 40 IP Afzal et al, 2000 IPG27 0.0102 0.0211 -0.0109 41 IP Afzal et al, 2000 IPG35 0.0098 0.0216 -0.0119 42 IP Afzal et al, 2000 IPG34 0.0098 0.0220 -0.0123 43 IP Afzal et al, 2000 IPG25 0.0099 0.0232 -0.0133 44 IP Afzal et al, 2000 EGG49 0.0126 0.0263 -0.0137 45 EG El-dars, 2005 NGG17 0.0158 0.0304 -0.0145 46 NG Ekpo and Inynag, 2000 IPG33 0.0092 0.0239 -0.0147 47 IP Afzal et al, 2000 EGG48 0.0121 0.0296 -0.0176 48 EG El-dars, 2005

24
IPG41 0.0089 0.0281 -0.0192 49 IP Afzal et al, 2000 EGG51 0.0112 0.0359 -0.0247 50 EG El-dars, 2005 THS57 0.0079 0.0386 -0.0307 51 TH Kruawal et al, 2005 EGG50 0.0055 0.0444 -0.0388 52 EG El-dars, 2005 EGG54 0.0057 0.0450 -0.0392 53 EG El-dars, 2005 THG56 0.0049 0.0488 -0.0439 54 TH Kruawal et al, 2005 EGG53 0.0044 0.0503 -0.0458 55 EG El-dars, 2005 EGG55 0.0036 0.0574 -0.0539 56 EG El-dars, 2005 EGG52 0.0027 0.0660 -0.0633 57 EG El-dars, 2005
*NG =Nigeria; PG = Papua New Guinea; IP= India/Pakistan; EG= Egypt; TH= Thailand; G =groundwater; S =
surface water; and the suffix Arabic numeral the sample numbers.

25
Table 3: The PCA results for the water bodies from Nigeria, Egypt, Thailand, Papua New Guinea and India\Pakistan
Matrix Percent of variance accounted for by p[1] and p[2]
No of Objects
Most important variables (those with p[1] loadings >0.20 or <-0.20 or p[2] loadings >0.35 or < 0.35.)
Least Important variables (those with p[1] loadings >0.20 or <-0.20 or p[2] loadings >0.35 or < 0.35.)
This study 72
5 PO43-, NH3-N,
SO42-, pH, F-, Na,
Ca, Fe, K, Mg, TDS, Conductivity, NO3
-, Cl-, NO2-
Mn, NO2-, K, Zn
Other studies from Papua New Guinea and Nigeria
71 19 Temp, Cl-, pH, TDS, SO4
2-, NH3-N, Zn, Na, K, Mg, NO3
-, Ca,
F-, NO2-, Fe, Mn, Li,
B, PO43-, NO3
-, pH, conductivity.
A study from India/Pakistan
48 21 SO42-, Ca, TDS,,
pH, Na, Cl-, K, NO2
-, Li, NO3-
Fe, B, Cr, Cd, As, P, Se, Hg
Egyptian and Thailand samples
87 12 Cl-, NO3-, Mg,
PO43-, NH3-N,
TDS, SO42-, Ca,
Na, K, Se, As
Entire data 55 57 Temp, Cl-, B, NO3
-, Mg, PO43-,
NH3-N, TDS, Mn, F-, SO4
2-, pH, NO2
-, Na, Ca, Li, Se,
Conductivity, Zn, Cd, Fe, As, Cr, K, P, Hg

26
Table 4: Correlation coefficients and errors of prediction for the validation set. Y Variable Correlation coefficient of observed Vs
predicted value plot Root mean square of root of prediction (RMSEP)
Temperature 0.045 0.032
Conductivity 0.63 0.29
pH 0.13 0.003
Phosphate 0.62 0.01
Fluoride 0.70 0.001
NH3-N 0.60 0.08
NO3- 0.34 0.05
NO2
- 0.69 0.001
K 0.19 0.028
Fe 0.67 0.04 Mn 0.60 0.003
Zn 0.54 0.002
Li 0.18 0.005
B 0.69 0.001
Mg
0.60 0.04
Cd 0.05 0.0000042
Cr 0.26 0.00005
P 0.22 0.0001
As 0.69 0.000034
Se 0.41 0.000035
Hg 0.21 0.000024

27
Figure 1: Scores (a) and loadings (b) plots for the water samples
(a)
PGS3
PGS1
PGG2
PGG5
PGG4
-3
-2
-1
0
1
2
3
-4 -3 -2 -1 0 1 2 3t[1] (50.5%)
t[2] (
21.6
%)
(b)
Nitrite
pH
ZincCalcium
Nitrate
Ammonia
Manganese
Conductivity
Magnesium
Fluoride
Iron
Sulfate
Phosphate
Chloride TDS
Sodium
Potassium
-0.5
-0.4
-0.3
-0.2
-0.1
0
0.1
0.2
0.3
0.4
0.5
-0.4 -0.3 -0.2 -0.1 0 0.1 0.2 0.3 0.4
p1(50.5%)
p2(2
1.7%
)

28
Figure 2: PCA Scores plot for the entire data matrix. Cluster A consists mainly of objects
from India\Pakistan ; Cluster B contains most objects from the Egyptian and Thai studies
and Cluster C contains many objects from the present and previous studies carried out in
Papua New Guinea and Nigeria .
-4
-3
-2
-1
0
1
2
3
4
5
6
-6 -4 -2 0 2 4 6
t[1] (34.2%)
t[2](2
0.1%
)
B
C
A


![Clean Air Act of 1999 [Republic Act No. 8749]](https://img.dokumen.tips/doc/110x75/577cc1a81a28aba711939cd7/clean-air-act-of-1999-republic-act-no-8749.jpg)