Embed Size (px)
Citation preview

Copyright © 2006 Pearson Education Canada
Trading with the World 32CHAPTER

Copyright © 2006 Pearson Education Canada
Objectives
After studying this chapter, you will able to Describe the trends and patterns in international trade
Explain comparative advantage and explain why all countries can gain from international trade
Explain the effects of international trade restrictions
Explain the arguments for trade restrictions and why they are flawed
Describe a country’s balance of payments accounts and explain what determines the current account balance
Describe the North America Free Trade Agreement

Copyright © 2006 Pearson Education Canada
Silk Routes and Sucking Sounds
Since ancient times, people have expanded trading as far as technology allowed—Marco Polo’s silk route between Europe and China is an example.
Many people fear free trade and some predicted a “giant sucking sound” as jobs were transferred from high-wage Michigan and Ontario to low-wage Mexico under the NAFTA.
Why do we trade with other nations?
Do tariffs that restrict trade bring any benefits?

Copyright © 2006 Pearson Education Canada
Patterns and Trends in International Trade
Imports are the good and services that we buy from people in other countries.
Exports are the goods and services we sell to people in other countries.

Copyright © 2006 Pearson Education Canada
Patterns and Trends in International Trade
Trade in Goods
Manufactured goods represent 74 percent of Canadian exports and 84 percent of Canadian imports.
Raw materials and semi-manufactured materials represent 44 percent of Canadian exports and 28 percent of Canadian imports.
Agricultural products account for only 7 percent of Canadian exports and 5 percent of Canadian imports.
Canada’s largest export and import items are capital goods and automobiles.

Copyright © 2006 Pearson Education Canada
Patterns and Trends in International Trade
Trade in ServicesInternational trade in services such as travel, transportation, and insurance is large and growing.
Geographical Patterns of International TradeCanada trades with countries all over the world, but its biggest trading partner is the United States with 82 percent of exports going to the United States and 69 percent of imports coming from the United States.
Other trading partners are Latin America and Japan.
Canadian trade with Japan is only 2 percent of exports and 3 percent of imports.

Copyright © 2006 Pearson Education Canada
Patterns and Trends in International Trade
Trends in the Volume of Trade
In 1978, Canada exported 25 percent of its total output and imported 25 percent of the total amount that Canadians spent on goods and services.
In 2004, Canada exported 44 percent of its total output and imported 39 percent of the total amount that Canadians spent on goods and services.

Copyright © 2006 Pearson Education Canada
Patterns and Trends in International Trade
Net Exports and International Borrowing
The value of exports minus imports is called net exports.
In 2004, net exports were $54 billion.
When a country exports more than it imports, it lends to foreigners or buy some of their assets.
When a country imports more than it exports, it must borrow from foreigners or sell some of its assets.

Copyright © 2006 Pearson Education Canada
The Gains from International Trade
Comparative advantage is the fundamental force that generates trade between nations.
The basis for comparative trade is divergent opportunity costs between countries.
Nations can increase the consumption of goods and services when they allocate resources to the production of those goods and services for which they have a comparative advantage.

Copyright © 2006 Pearson Education Canada
The Gains from International Trade
Opportunity Cost in Farmland
Figure 32.1 shows the production possibilities frontier for an imaginary country called Farmland.

Copyright © 2006 Pearson Education Canada
The Gains from International Trade
Without international trade, Farmland produces and consumes 15 billion tonnes of grain and 8 million cars at point A.
The opportunity cost of a car is 9,000 tonnes of grain.
Copyright © 2006 Pearson Education Canada
The Gains from International Trade
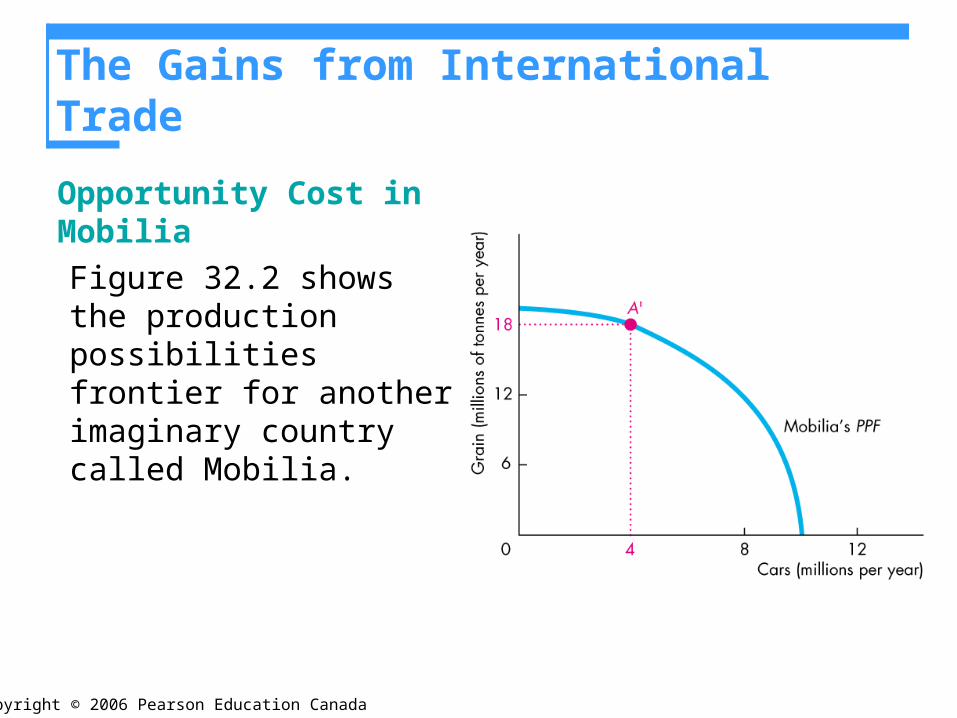
Opportunity Cost in Mobilia
Figure 32.2 shows the production possibilities frontier for another imaginary country called Mobilia.

Copyright © 2006 Pearson Education Canada
The Gains from International Trade
Without international trade, Mobilia produces and consumes 18 billion tonnes of grain and 4 million cars at point A'.
The opportunity cost of a car is 1,000 tonnes of grain.

Copyright © 2006 Pearson Education Canada
The Gains from International Trade
Comparative Advantage
Cars are cheaper for Mobilia to produce than for Farmland because less grain is given up to produce each car.
Grain is cheaper for Farmland to produce than for Mobilia because fewer cars are given up to produce each tonne.
A country has a comparative advantage in producing a good if it can produce that good at a lower opportunity cost than any other country.
Farmland has a comparative advantage in producing grain, and Mobilia has a comparative advantage in producing cars.

Copyright © 2006 Pearson Education Canada
The Gains from International Trade
The Gains from Trade: Cheaper to Buy Than to Produce
If Mobilia bought grain for the price that Farmland produces it, Mobilia could buy 9,000 tonnes of grain for 1 car—a much lower price than the opportunity cost of producing grain in Mobilia.
If Farmland bought cars for what Mobilia pays for them, Farmland could buy 1 car for 1,000 tonnes of grain—a much lower price than the opportunity cost of producing cars in Farmland.

Copyright © 2006 Pearson Education Canada
The Gains from International Trade
The Terms of Trade
The quantity of grain that Farmland must pay Mobilia for a car is called Farmland’s terms of trade with Mobilia.
Figure 32.3 shows how the forces of international demand and supply determine the terms of trade and the volume of trade.

Copyright © 2006 Pearson Education Canada
The Gains from International Trade
With no international trade, Mobilia can produce a car for 1,000 tonnes of grain, so at that price, it plans to sell no cars to Farmland.
But as the price rises above 1,000 tonnes of grain per car the quantity of cars supplied by Mobilia increases.

Copyright © 2006 Pearson Education Canada
The Gains from International Trade
With no international trade, Farmland can produce a car for 9,000 tonnes of grain, so at that price, it plans to buy no cars from Mobilia.
But as the price falls below 9,000 tonnes of grain per car the quantity of cars demanded by Farmland increases.

Copyright © 2006 Pearson Education Canada
The Gains from International Trade
The equilibrium terms of trade (price) is 3,000 tonnes of grain per car and 4 million cars are exported by Mobilia and imported by Farmland.

Copyright © 2006 Pearson Education Canada
The Gains from International Trade
Balanced Trade
The number of cars exported by Mobilia equals the number of cars imported by Farmland.
Farmland pays Mobilia with 12 billion tonnes of grain (4 million cars multiplied by 3,000 tonnes for each car)
Mobilia imports and Farmland exports 12 billion tonnes of grain. Trade is balanced.
For each country, the value of exports equals the value of imports—4 million cars are worth the same as 12 billion tonnes of grain.

Copyright © 2006 Pearson Education Canada
The Gains from International Trade
Changes in Production and Consumption
Farmland buys cars at a price that is lower than it can produce them itself, and sells its grain at a higher price.
Mobilia buys grain at a price that is lower than it can produce it itself, and sells its cars at a higher price.
Both countries gain from international trade.
Each PPF illustrates the production possibilities of a country, but it does not show the consumption possibilities when the country engages in international trade.

Copyright © 2006 Pearson Education Canada
The Gains from International Trade
Figure 32.4 shows how both countries gain from trade.

Copyright © 2006 Pearson Education Canada
The Gains from International Trade
Calculating the Gains from TradeFarmland increase its consumption of both cars and grain.
Farmland decreases car production and increases grain production until its own opportunity cost of producing a car equals the world terms of trade and exchanges grain for cars at those terms of trade.
Mobilia increases its consumption of both cars and grain.
Mobilia increases car production and decreases grain production until its own opportunity cost of producing a car equals the world terms of trade and exchanges cars for grain at those terms of trade.

Copyright © 2006 Pearson Education Canada
The Gains from International Trade
Gains for Both Countries
Both countries gain by consuming output combinations outside their respective production possibilities frontier.
Trade does not create a winner and a loser.
Both countries gain.
Copyright © 2006 Pearson Education Canada
The Gains from International Trade
Gains from Trade in Reality
Gains from trade occur in the real global economy.
Canada buys TVs and VCRs from Korea, machinery from Europe, and fashion goods from Hong Kong and in exchange for machinery, grain, lumber, airplanes, computers, and financial services.
All countries gain from this trade.
The combination of diverse preferences and economies of scale create comparative advantages that generate a large volume of international trade in similar but differentiated products.

Copyright © 2006 Pearson Education Canada
International Trade Restrictions
Governments restrict international trade to protect domestic producers from competition by using two main tools:
1. Tariffs
2. Nontariff barriers
A tariff is a tax that is imposed by the importing country when an imported good crosses its international boundary.
A nontariff barrier is any action other than a tariff that restricts international trade.

Copyright © 2006 Pearson Education Canada
International Trade Restrictions
The History of Tariffs
Figure 32.5 shows Canada’s average tariff rate.
Copyright © 2006 Pearson Education Canada
International Trade Restrictions
The General Agreement on Tariffs and Trade (GATT) is an agreement between nations to have a series of trade negotiations, or “rounds,” to reduce tariffs on international trade.
Subsequent rounds of the GATT occurred in the 1960s, late 1970s, and 1980s, resulting in gradual decline in the average tariff rate.
The Uruguay round was the most ambitious and lead to the creation of the World Trade Organization (WTO).
WTO membership brings greater obligations to follow the GATT rules governing trade.

Copyright © 2006 Pearson Education Canada
International Trade Restrictions
In 1994, Canada became party to the North American Free Trade Agreement (NAFTA), under which trade barriers between Canada, Mexico and the United States are being lowered.
The European Union (EU) is an organization of European countries that have agreed to eliminate trade barriers among them.
The Asia-Pacific Economic group (APEC) is another agreement to reduce trade barriers among East Asian countries, including China.

Copyright © 2006 Pearson Education Canada
International Trade Restrictions
How Tariffs Work
Tariffs increase the price that consumers of the importing country must pay for imported goods or services.
Figure 32.6 uses the Farmland and Mobilia example to illustrate the effects of a tariff on car imports into Farmland.

Copyright © 2006 Pearson Education Canada
International Trade Restrictions
The supply of cars to Farmland decreases because the tariff must be added to the price at which Mobilia is willing to supply a given quantity.
The price rises, the quantity falls, and the government collects the tariff revenue.

Copyright © 2006 Pearson Education Canada
International Trade Restrictions
The supply curve shifts leftward and the vertical distance between the free-trade supply curve and the new supply curve equals the amount of the tariff.
The price of a car in Farmland rises.
The quantity of cars imported by Farmland decreases.
The Farmland government collects tariff revenue.
Resources use is inefficient.
The value of exports changes by the same amount as the value of imports and trade remains balanced.

Copyright © 2006 Pearson Education Canada
International Trade Restrictions
Nontariff Barriers
There are two main types of non-tariff barriers to trade.
A quota is a quantitative restriction on the import of a particular good, which specifies the maximum amount of the good that may be imported in a given period of time.
A voluntary export restraint (VER) is an agreement between two governments in which the government of the exporting country agrees to restrain the volume of its own exports.
Copyright © 2006 Pearson Education Canada
International Trade Restrictions
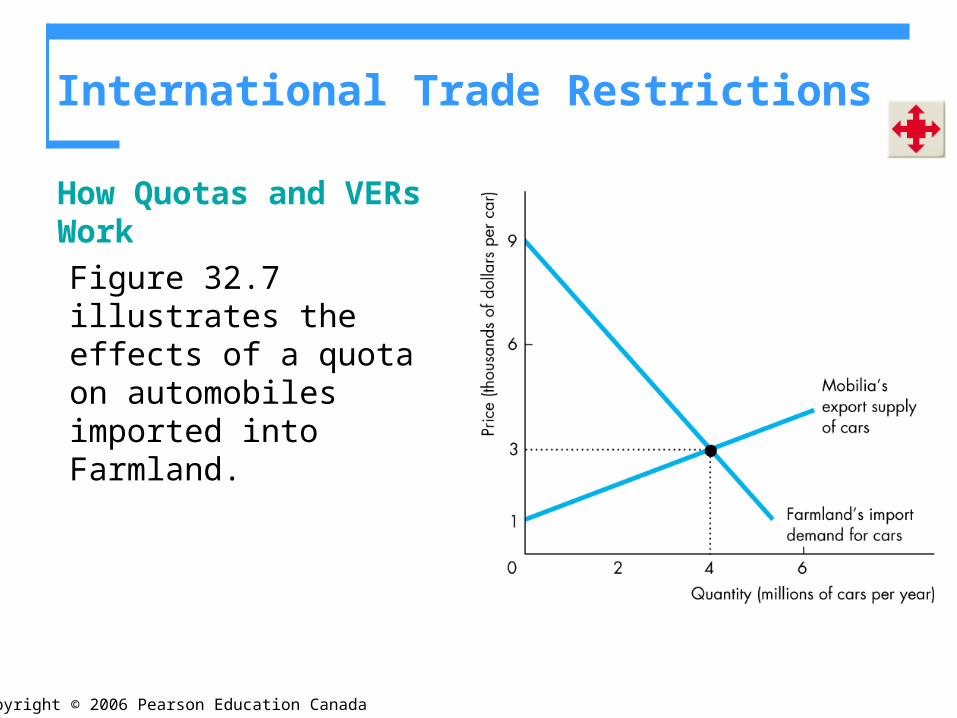
How Quotas and VERs Work
Figure 32.7 illustrates the effects of a quota on automobiles imported into Farmland.

Copyright © 2006 Pearson Education Canada
International Trade Restrictions
The quota limits the quantity that may be imported.
At the quota quantity, buyers are willing to pay more than the price that sellers are willing to accept.
Importers profit by buying at a lower price than the price at which they sell.

Copyright © 2006 Pearson Education Canada
International Trade Restrictions
A quota can generate the same price, quantity, and inefficiency as a tariff but with a quota, the importer makes an economic profit equal to what the government receives as tariff revenue with a tariff.
A VER is similar to a quota except that the exporter captures the economic profit.

Copyright © 2006 Pearson Education Canada
The Case Against Protection
Despite the fact that free trade promotes prosperity for all countries, trade is restricted.
It is often argued that international trade should be restricted to
Protect employment
Protect infant industries
Punish dumping
None of these arguments bear scrutiny.

Copyright © 2006 Pearson Education Canada
The Case Against Protection
Other common arguments for protection are that it
Maintains national security
Allows us to compete with cheap foreign labour
Brings diversity and stability to our economy
Penalizes nations with lax environmental standards
Protects national culture
Prevents rich nations from exploiting poor ones

Copyright © 2006 Pearson Education Canada
The Case Against Protection
The Employment Argument
The employment argument is that protection saves jobs.
The idea that buying foreign goods costs domestic jobs is wrong.
Free trade destroys some jobs and creates other better jobs.
Free trade also increases foreign incomes and enables foreigners to buy more domestic production.
Protection to save particular jobs is very costly.
Copyright © 2006 Pearson Education Canada
The Case Against Protection
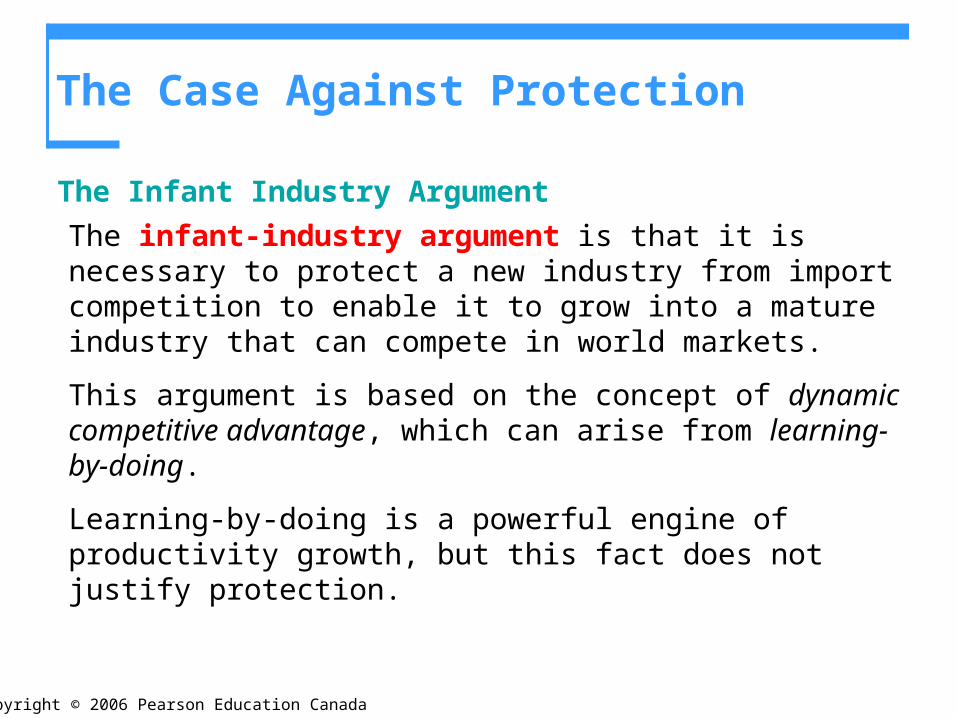
The Infant Industry Argument
The infant-industry argument is that it is necessary to protect a new industry from import competition to enable it to grow into a mature industry that can compete in world markets.
This argument is based on the concept of dynamic competitive advantage, which can arise from learning-by-doing.
Learning-by-doing is a powerful engine of productivity growth, but this fact does not justify protection.

Copyright © 2006 Pearson Education Canada
The Case Against Protection
The Dumping Argument
Dumping occurs when foreign a firm sells its exports at a lower price than its cost of production.
Dumping is seen as a justification for a tariff to prevent a foreign firm driving domestic firms out of business and then raising its price.
This argument does not justify protection because:
It is virtually impossible to determine a firm’s costs;
If there was a natural global monopoly, it would be more efficient to regulate it than to impose a tariff against it.

Copyright © 2006 Pearson Education Canada
The Case Against Protection
Maintains National Security
The idea that a country must protect the industries that produce defence equipment and supply raw material to these industries.
This argument does not withstand close scrutiny.
In time of war, no industry does not contribute to natioinal defence.

Copyright © 2006 Pearson Education Canada
The Case Against Protection
Allows us to Compete with Cheap Foreign Labour
The idea that a high-wage country cannot compete with a low-wage country is wrong.
Low-wage labour is less productive than high-wage labour.
And wages and productivity tell us nothing about the source of gains from trade, which is comparative advantage.

Copyright © 2006 Pearson Education Canada
The Case Against Protection
Brings Diversity and Stability
The idea that protection brings diversity of production and greater stability of income is wrong.
A nation can achieve diversity and stability through its international investments

Copyright © 2006 Pearson Education Canada
The Case Against Protection
Penalizes Lax Environmental Standards
The idea that protection is good for the environment is wrong.
Free trade increases incomes and poor countries have significantly lower environmental standards than rich countries.
These countries cannot afford to spend as much on the environment as a rich country can and sometimes they have a comparative advantage at doing “dirty” work, which helps the global environment achieve higher environmental standards.

Copyright © 2006 Pearson Education Canada
The Case Against Protection
Protects National Culture
The idea that trade restrictions protect the national culture is wrong.
This argument is heard in Canada and European countries.
Many countries are afraid of the “Americanization” of their culture through the prominence of American films, television programs, art, literature, and even cuisine in world markets.

Copyright © 2006 Pearson Education Canada
The Case Against Protection
Protecting “cultural” industries is a form of rent seeking, using cultural identity to eliminate competition from other culturally related goods and services.
The surest way to eliminate a culture is to impoverish a nation.

Copyright © 2006 Pearson Education Canada
The Case Against Protection
Prevents Rich Countries from Exploiting Poorer Countries
The idea that trade restrictions prevent rich countries from exploiting poorer countries is wrong.
Free trade is the best way of raising wages and improving working conditions in poor countries.

Copyright © 2006 Pearson Education Canada
The Case Against Protection
The most compelling argument against protection is that it invites retaliation.
We saw retaliation to the Smoot-Hawley Act in the United States during the Great Depression.
And we see it today as the world reacts to high U.S. tariffs on steel and agriculture.

Copyright © 2006 Pearson Education Canada
Why Is International Trade Restricted?
The two key reasons why international trade is restricted are
Tariff revenue
Rent seeking

Copyright © 2006 Pearson Education Canada
Why Is International Trade Restricted?
Tariff Revenue
It is costly for governments to collect taxes on income and domestic sales.
It is cheaper for governments to collect taxes on international transactions because international trade is carefully monitored.
This source of revenue is especially attractive to governments in developing nations.

Copyright © 2006 Pearson Education Canada
Why Is International Trade Restricted?
Rent Seeking
Rent seeking is lobbying and other political activities that seek to capture the gains from trade.
Despite the fact that protection is inefficient, governments respond to the demands of those who gain from protection and ignore the demands of those who gain from free trade because protection brings concentrated gains and diffused losses.

Copyright © 2006 Pearson Education Canada
Why Is International Trade Restricted?
Compensating LosersThe gains from free trade exceed the losses, and sometimes free trade agreements address the issue of the distribution of gains from trade by compensating those who lose from free trade.
1.The cost of identifying the losers form free trade and compensating them would be enormous.
2. Difficult to know if the person is a loser from free trade or some other reason.
Unemployment benefits and interprovincial transfers are two forms of compensation.

Copyright © 2006 Pearson Education Canada
The Balance of International Payments
We are now going to see what makes international trade unbalanced.
Why a country has an international surplus or international deficit.
We record international transactions in the balance of payments accounts.
Balance of Payments Accounts
A country’s balance of payments accounts records its international trading, borrowing, and lending.

Copyright © 2006 Pearson Education Canada
The Balance of International Payments
There are three balance of payments accounts:
1. Current account
2. Capital account
3. Official settlements account
The current account records payments for imports of goods and services from abroad, receipts from exports of goods and services sold abroad, net interest paid abroad, and net transfers (such as foreign aid payments).
The current accounts balance equals the sum of: exports minus imports, net interest income and net transfers.

Copyright © 2006 Pearson Education Canada
The Balance of International Payments
The capital account records foreign investment in Canada minus Canadian investments abroad.
The official settlements account records the change in Canadian official reserves.
Canadian official reserves are the government’s holdings of foreign currency.
If Canadian official reserves increase, the official settlements account is negative.
The sum of the balances of the three accounts always equals zero.

Copyright © 2006 Pearson Education Canada
The Balance of International Payments
Figure 32.8 shows the balance of payments (as a percentage of GDP) over the period 1984 to 2004.
Copyright © 2006 Pearson Education Canada
The Balance of International Payments
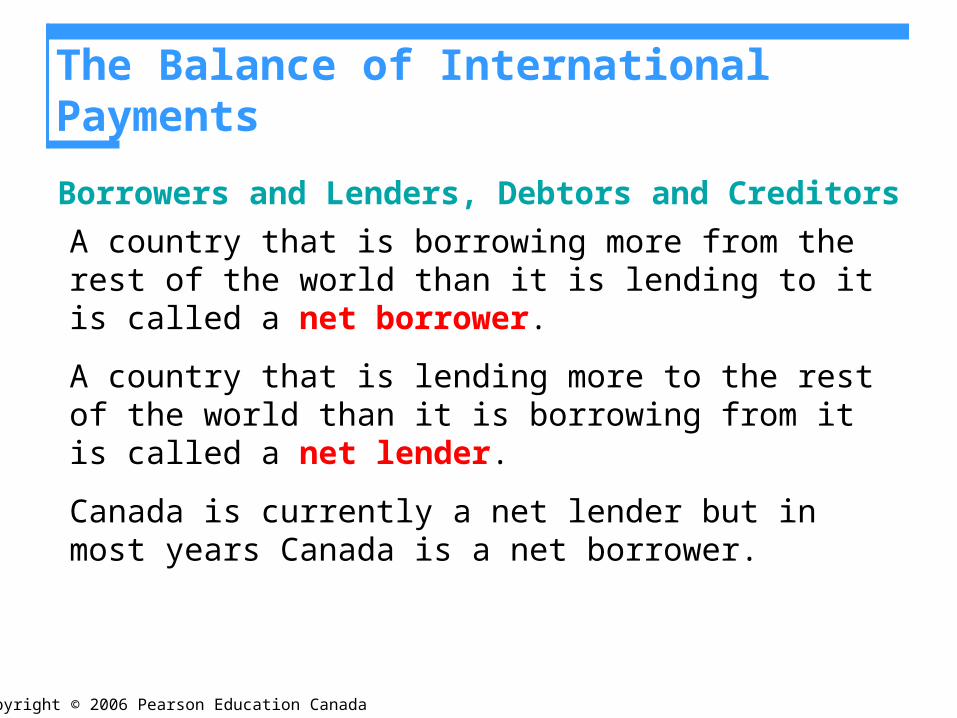
Borrowers and Lenders, Debtors and Creditors
A country that is borrowing more from the rest of the world than it is lending to it is called a net borrower.
A country that is lending more to the rest of the world than it is borrowing from it is called a net lender.
Canada is currently a net lender but in most years Canada is a net borrower.

Copyright © 2006 Pearson Education Canada
The Balance of International Payments
A debtor nation is a country that during its entire history has borrowed more from the rest of the world than it has lent to it. Canada is a debtor nation.
A creditor nation is a country that has invested more in the rest of the world than other countries have invested in it.
The difference between being a borrower/lender nation and being a creditor/debtor nation is the difference between stocks and flows of financial capital.

Copyright © 2006 Pearson Education Canada
The Balance of International Payments
Being a net borrower is not a problem provided the borrowed funds are used to finance capital accumulation that increases income.
Being a net borrower is a problem if the borrowed funds are used to finance consumption.

Copyright © 2006 Pearson Education Canada
The Balance of International Payments
Current Account Balance
The current account balance (CAB) is
CAB = NX + Net interest income + Net transfers
The main item in the current account balance is net exports (NX).
The other two items are much smaller and don’t fluctuate much.

Copyright © 2006 Pearson Education Canada
The Balance of International Payments
The government sector surplus or deficit is equal to net taxes, NT, minus government expenditures of goods and services G.
The private sector surplus or deficit is saving, S, minus investment, I.
Net exports is equal to the sum of government sector balance and private sector balance:
NX = (NT – G) + (S – I)

Copyright © 2006 Pearson Education Canada
The Balance of International Payments
For Canada for 2004,
Net exports of $55 billion equal the sum of the government sector balance—a surplus of $35 billion—and the private sector balance—a surplus of $20 billion.

Copyright © 2006 Pearson Education Canada
The Balance of International Payments
The Twin Deficits
Because the current account balance and the government budget balance have a tendency to move together, they are called the twin deficits.
Figure 32.9 shows the twin deficits for Canada from 1984 through 2004.

Copyright © 2006 Pearson Education Canada


![[ 'Pearson 2017 Q1 Trading Update' ]](https://img.dokumen.tips/doc/110x75/6169ec4111a7b741a34cdcbc/-pearson-2017-q1-trading-update-.jpg)
