Embed Size (px)
Citation preview

ASIC Form 388 Ref 131855416 Page 1 of 2
Australian Securities &Investments Commission
Electronic Lodgement
Document No. 7EAQ79318
Lodgement date/time: 30-10-2019 12:42:07
Reference Id: 131855416
Form 388Corporations Act 2001
294, 295, 298-300, 307, 308, 319, 321, 322Corporations Regulations
1.0.08
Copy of financial statements and reports
Company details
Company name
KINETIC IT PTY LTD
ACN
072 941 943
Reason for lodgement of statement and reports
A large proprietary company that is not a disclosing entityDates on which financialyear ends
Financial year end date30-06-2019
Details of large proprietary company
What is the consolidated revenue of the large proprietary company and theentities that it controls?
203215516
What is the value of the consolidated gross assets of the large proprietarycompany and the entities that it controls?
84510320
How many employees are employed by the large proprietary company andthe entities that it controls?
1336
How many members does the large proprietary company have?6
Auditor's report
Were the financial statements audited?
Yes
Is the opinion/conclusion in the report modified? (The opinion/conclusion inthe report is qualified, adverse or disclaimed)
No
Form 388 - Copy of financial statements and reportsKINETIC IT PTY LTD ACN 072 941 943
ASIC Form 388 Ref 131855416 Page 2 of 2
Does the report contain an Emphasis of Matter and/or Other Matterparagraph?
Yes
Details of current auditor or auditors
Current auditorDate of appointment 24-11-2016
Name of auditorDELOITTE TOUCHE TOHMATSU
Address'TOWER 2 BROOKFIELD PLACE'123 ST GEORGES TERRACEPERTH WA 6000
Certification
I certify that the attached documents are a true copy of the original reportsrequired to be lodged under section 319 of the Corporations Act 2001.
Yes
Signature
Select the capacity in which you are lodging the formSecretary
I certify that the information in this form is true and complete and that I amlodging these reports as, or on behalf of, the company.
Yes
Authentication
This form has been submitted byName Terrence Peter NORTHDate 30-10-2019
For more help or informationWeb www.asic.gov.auAsk a question? www.asic.gov.au/questionTelephone 1300 300 630
2019FINANCIAL
REPORT
FOR THE YEAR ENDED 30 JUNE 2019Kinetic IT PTY LTD | ABN 97 072 941 943

1 Directors’ Report
2 Statement of Financial Position
3 StatementofProfitorLossandOtherComprehensiveIncome
4 StatementofChangesinEquity
5 StatementofCashFlows
6 NotestotheFinancialStatements
7 Directors’ Declaration
8 IndependentAuditor’sReport
9 Auditor’sIndependenceDeclaration
...................................................................................................................................................................05..............................................................................................................................09
..................................................11..............................................................................................................................13
..............................................................................................................................................15........................................................................................................................17
........................................................................................................................................................34....................................................................................................................................36
....................................................................................................................40
Kinetic IT PTY LTD | ABN 97 072 941 943

The names of the directors and officers in office at any time during or since the end of the year are:DIRECTORS & OFFICERS
As Kinetic IT’s CEO from 2007 to 2016, Terry led the company through significant growth, including expansion into the Northern Territory, Victoria and New South Wales markets. Following his departure as Kinetic IT’s CEO in January 2016, co-founder Terrence (Terry) North has continued to guide the company as a Non-Executive Director. Prior to forming Kinetic IT with Phil North and David McCleery, Terry was the General Manager of a large regional transport company and was responsible for driving the company’s expansion into private and government-funded transport services. Terry is a member of the CEO Institute of Australia and the Australian Institute of Company Directors.
Kinetic IT’s co-founder and Chairman, David McCleery, has over 37 years’ experience in the technology industry. Prior to forming Kinetic IT with brother’s Phillip and Terry North in 1997, David consulted to some of Australia’s largest organisations to deliver major infrastructure and ICT projects. While serving on the Board of Kinetic IT, David successfully established and chaired energy trading company, DMT Energy, from 2007 to 2011. He continues to serve on the Board for a number of companies and not-for-profit organisations. David holds a Graduate Diploma in Business Computing and a Graduate Diploma in Applied Physics (Geophysics). He is a graduate of the Australian Institute of Company Directors.
Non-Executive Director and ChairpersonAppointed Director December 1999
Non-Executive Director Appointed Director February 1996
David John McCleery Terrence Peter North
As one of Kinetic IT’s co-founders, Phillip North has been a cornerstone in the formation and continued growth of the company. He has been a member of Kinetic IT’s Board for 20 years, serving as an Executive Director from 1997, and then as a Non-Executive Director since 2007. Phil is an active member of the Australian ICT industry and has worked with a range of government and corporate organisations on strategic and transformational ICT initiatives.
Phillip North
Non-Executive Director Appointed Director August 1997
3

DIRECTORS & OFFICERS (CONTINUED)
Kinetic IT’s Chief Financial Officer, Russell Decent, was appointed as an Executive Director in January 2016. Russell has a wealth of experience across all aspects of financial, regulatory and commercial management. As CFO, Russell is responsible for Kinetic IT’s Australia-wide financial operations, managing the company’s corporate finance, business systems and intelligence, financial services and business technology functions. Russell plays a fundamental role in supporting Kinetic IT’s strategy through strategic, financial and commercial leadership. Russell is a graduate of the Australian Institute of Company Directors and a member of the Institute of Chartered Accountants Australia and New Zealand.
Chief Executive Officer, Michael North, has been instrumental in guiding Kinetic IT to become one of Australia’s leading ICT managed services providers. Joining Kinetic IT’s Service Delivery and Operations team in 1999, Michael matured his technical and commercial experience to progress into senior and executive positions. More recently, he’s played an integral role in driving of Kinetic IT’s strategic direction as Chief Strategy Officer and Chief Operating Officer before his appointment as CEO. Today, Michael is focused on leading Kinetic IT through continued growth as the company evolves its services and expands into new regions. Michael is a graduate of the Australian Institute of Company Directors.
Chief Financial Officer since July 2009 and Executive
Director since January 2016
Michael Eric North Russell Antony Decent
Richard Williams, appointed Company Secretary in January 2016 and Group Executive in 2019 after initially joining Kinetic IT in 2015 in the role of National Commercial Manager, is responsible for overseeing the Company’s corporate performance and compliance activities. Richard has extensive international experience within the ICT industry, gained in senior finance and management roles at Logicalis Group and PricewaterhouseCoopers (UK). Richard holds a Bachelor of Commerce and Postgraduate Diploma in Accounting. He is a graduate of the Australian Institute of Company Directors, a member of the Institute of Chartered Accountants Australia and New Zealand, and member of the CFA Institute.
Richard John Hoskyn Williams
Company Secretary since January 2016 and Group Executive since 2019
Chief Executive Officer and Executive Director since January 2016
4

DIRECTORS’ REPORTTheDirectorspresenttheirreporttogetherwiththefinancialstatementsofKineticITPtyLtd(“theCompany”)forthefinancialyearended30June2019.

The 2019 financial year has been a hallmark of exceptional operational and financial performance, with significant progress made towards achieving our strategic goals. Our collective success is reflected in our record-high revenue of $203.2 million, up 2.9 per cent from the previous year, and the achievement of two major growth milestones as we welcomed our first federal government customer and established our presence in the Australian Capital Territory. Underpinning this was our commitment to service excellence, targeted investment into the development of high value, customer-centric solutions, and our commitment to growing and enabling an empowered Australian workforce.
INVESTING IN OUR FUTURE
Kinetic IT is built for the long term, and our strategy and Business Plan provide us with the guardrails and guidelines to achieve our goals and realise our vision. Across the 2019 financial year, we focused significant investment into the growth, expansion and evolution of our organisation, delivered through a range of strategic initiatives.
Early in FY19, we implemented a program of work to evolve our operating model and ensure we remain positioned to deliver on our purpose. Guided by a mantra of ‘the right roles, in the right places, doing the right things for the right outcomes’ we are re-engineering how we operate. Starting at the very top of our organisation and progressively working our way across the business, we’re simplifying Kinetic IT’s structure and ways of working to empower our people and enable us to scale and flex in a world of increasing change.
To bring greater value to our customers and amplify our strategic position, we have commenced expansion of Kinetic IT’s customer experience, research and service innovation capabilities. This includes the formation of a new Strategic Marketing division, which will also house our partner alliance and market development functions. Working closely with our customer development and service delivery areas, these new capabilities will drive the continued growth and diversification of Kinetic IT into new and existing regions, industries and technologies.
Because of our growth investments, we experienced a slight cooling of our net profit after tax to achieve $16 million, representing an expected 8.5% decrease compared with the previous year. However, as a platform to generate near-term and future growth, these initiatives have already started to deliver valuable improvements to our business and we’re looking forward to realising their full potential in the coming year.
EXPANDING OUR HORIZONS
Kinetic IT remains uniquely positioned to partner with our communities’ critical services providers and support their highly secure and complex IT environments. In December 2018, we celebrated a major growth milestone which built on our law enforcement, emergency and protective services pedigree through the signing of two major services contracts with the Department of Defence.
The significance of this event had a flow-through impact on our business, with targeted investment of over $6 million into onboarding additional resources, new assets and increased capabilities. In the space of just six months, we welcomed over 150 new crew into the company, established new premises in Canberra’s CBD and expanded our coverage to become one of the largest technology-focused, government security-cleared workforces in Australia. EXPANDING OUR HORIZONS
OPERATING AND FINANCIAL REVIEW
Stat
emen
t of P
rofit
or
Loss
and
Oth
er
Com
preh
ensi
ve In
com
e
Stat
emen
t of
Cash
Flo
ws
Dire
ctor
s’ D
ecla
ratio
nSt
atem
ent o
f Ch
ange
s in
Equ
ityN
otes
to th
e Fi
nanc
ial S
tate
men
tsAu
dito
r’s In
depe
nden
ce
Decl
arat
ion
Inde
pend
ent
Audi
tor’s
Rep
ort
6
Stat
emen
t of
Fina
ncia
l Pos
ition
Dire
ctor
s’ R
epor
t
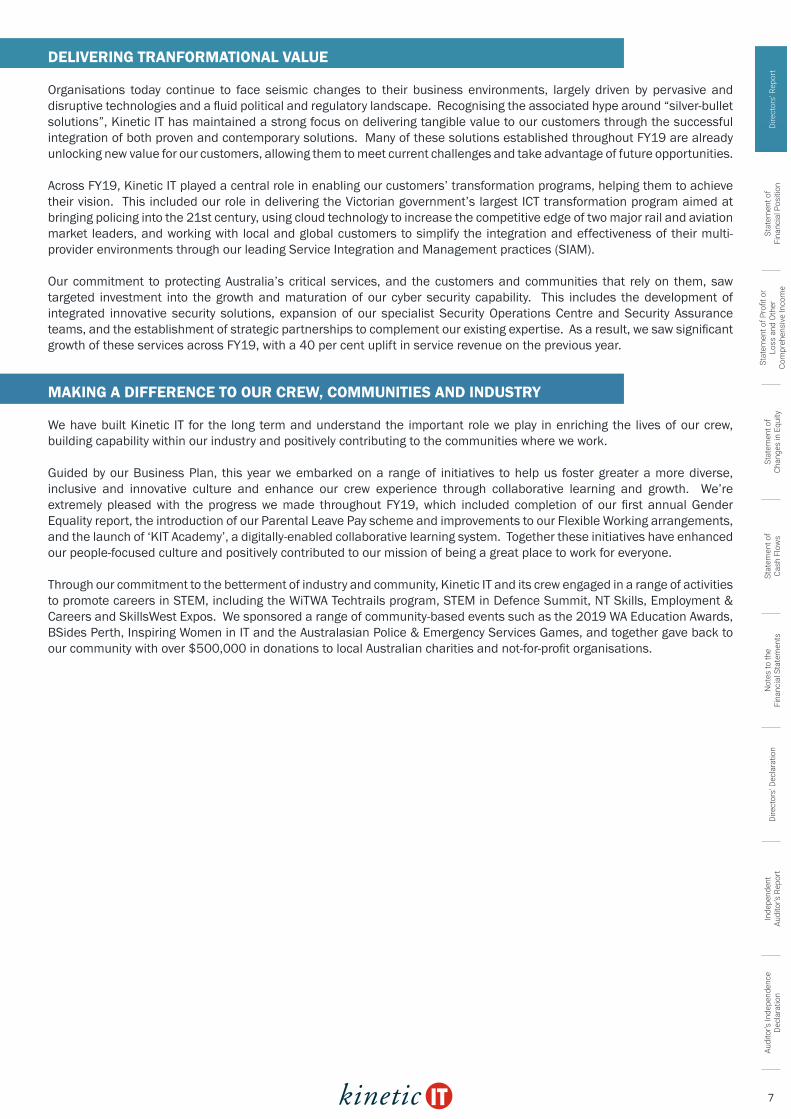
DELIVERING TRANFORMATIONAL VALUE
Organisations today continue to face seismic changes to their business environments, largely driven by pervasive and disruptive technologies and a fluid political and regulatory landscape. Recognising the associated hype around “silver-bullet solutions”, Kinetic IT has maintained a strong focus on delivering tangible value to our customers through the successful integration of both proven and contemporary solutions. Many of these solutions established throughout FY19 are already unlocking new value for our customers, allowing them to meet current challenges and take advantage of future opportunities.
Across FY19, Kinetic IT played a central role in enabling our customers’ transformation programs, helping them to achieve their vision. This included our role in delivering the Victorian government’s largest ICT transformation program aimed at bringing policing into the 21st century, using cloud technology to increase the competitive edge of two major rail and aviation market leaders, and working with local and global customers to simplify the integration and effectiveness of their multi-provider environments through our leading Service Integration and Management practices (SIAM).
Our commitment to protecting Australia’s critical services, and the customers and communities that rely on them, saw targeted investment into the growth and maturation of our cyber security capability. This includes the development of integrated innovative security solutions, expansion of our specialist Security Operations Centre and Security Assurance teams, and the establishment of strategic partnerships to complement our existing expertise. As a result, we saw significant growth of these services across FY19, with a 40 per cent uplift in service revenue on the previous year.
MAKING A DIFFERENCE TO OUR CREW, COMMUNITIES AND INDUSTRY
We have built Kinetic IT for the long term and understand the important role we play in enriching the lives of our crew, building capability within our industry and positively contributing to the communities where we work.
Guided by our Business Plan, this year we embarked on a range of initiatives to help us foster greater a more diverse, inclusive and innovative culture and enhance our crew experience through collaborative learning and growth. We’re extremely pleased with the progress we made throughout FY19, which included completion of our first annual Gender Equality report, the introduction of our Parental Leave Pay scheme and improvements to our Flexible Working arrangements, and the launch of ‘KIT Academy’, a digitally-enabled collaborative learning system. Together these initiatives have enhanced our people-focused culture and positively contributed to our mission of being a great place to work for everyone.
Through our commitment to the betterment of industry and community, Kinetic IT and its crew engaged in a range of activities to promote careers in STEM, including the WiTWA Techtrails program, STEM in Defence Summit, NT Skills, Employment & Careers and SkillsWest Expos. We sponsored a range of community-based events such as the 2019 WA Education Awards, BSides Perth, Inspiring Women in IT and the Australasian Police & Emergency Services Games, and together gave back to our community with over $500,000 in donations to local Australian charities and not-for-profit organisations.
Dire
ctor
s’ D
ecla
ratio
nN
otes
to th
e Fi
nanc
ial S
tate
men
tsAu
dito
r’s In
depe
nden
ce
Decl
arat
ion
Inde
pend
ent
Audi
tor’s
Rep
ort
7
Dire
ctor
s’ R
epor
tSt
atem
ent o
f Pro
fit o
r Lo
ss a
nd O
ther
Co
mpr
ehen
sive
Inco
me
Stat
emen
t of
Cash
Flo
ws
Stat
emen
t of
Chan
ges
in E
quity
Stat
emen
t of
Fina
ncia
l Pos
ition

Significant changes in the state of affairs It is the belief of the directors that there were no significant changes in the Company’s state of affairs that occurred during the financial year.
Principal activitiesThe principal activities of the Company during the financial year were the provision of services pertaining to Managed Enterprise Technology, Cyber and Information Security, Business and Digital Transformation and Advisory and Consulting.
No significant change in the nature of these activities occurred during the year.
Events subsequent to reporting dateIn the opinion of the directors of Kinetic IT, in the interval between the end of the financial year and the date of this report, there has not arisen any item, transaction or event of a material and unusual nature likely to affect significantly the operations of the Company, the results of those operations, or the state of affairs of the Company, in future financial years.
Likely developmentsLikely developments in the operations of the Company and the expected results of those operations in future financial years have not been included in this report as the inclusion of such information is likely to result in unreasonable prejudice to the Company.
Environmental regulationsKinetic IT’s operations are not regulated by any significant environmental regulation under a law of the Commonwealth or of a State or Territory.
DividendsDividends of $814,000 per each D class share on issue were declared and paid in respect of the year ended 30 June 2019 for a total of $24,420,000 (2018: $12,270,000). The dividends paid were fully franked.
Share optionsNo options over issued shares or interests in the Company were granted during or since the end of the financial year and there were no options outstanding at the date of this report.
Indemnification and insurance of officers and auditorsKinetic IT Pty Ltd has agreed to indemnify all directors and executive officers of the Company, against liabilities to another person (other than the Company or a related body corporate) that may arise from their position as directors and executive officers of Kinetic IT Pty Ltd, except where the liability has arisen from a wilful breach of duty in relation to the Company. The agreement stipulates that Kinetic IT Pty Ltd will meet the full amount of any such liabilities, including costs and expenses. The Company has paid a total of $30,224 in insurance premiums, relating to Director and Officer insurance, during the financial period. No indemnities have been given or insurance premiums paid during or since the end of the year for a person who is or has been an auditor of the Company.
Proceedings on behalf of the companyNo person has applied for leave of Court to bring proceedings on behalf of the Company or intervene in any proceedings to which the Company is a party for the purpose of taking responsibility on behalf of the Company for all or any part of those proceedings. The Company was not a party to any such proceedings during the year.
Auditor’s independence declarationThe auditor’s independence declaration under section 307C is attached.
Signed in accordance with a resolution of the Board of Directors, made pursuant to s.298(2) of the Corporations Act 2001.
On behalf of the Directors:
Director ...................................................
David John McCleery
Dated this 29 October 2019
Dire
ctor
s’ D
ecla
ratio
nN
otes
to th
e Fi
nanc
ial S
tate
men
tsAu
dito
r’s In
depe
nden
ce
Decl
arat
ion
Inde
pend
ent
Audi
tor’s
Rep
ort
8
Dire
ctor
s’ R
epor
tSt
atem
ent o
f Pro
fit o
r Lo
ss a
nd O
ther
Co
mpr
ehen
sive
Inco
me
Stat
emen
t of
Cash
Flo
ws
Stat
emen
t of
Chan
ges
in E
quity
Stat
emen
t of
Fina
ncia
l Pos
ition

STATEMENT OF FINANCIAL POSITION
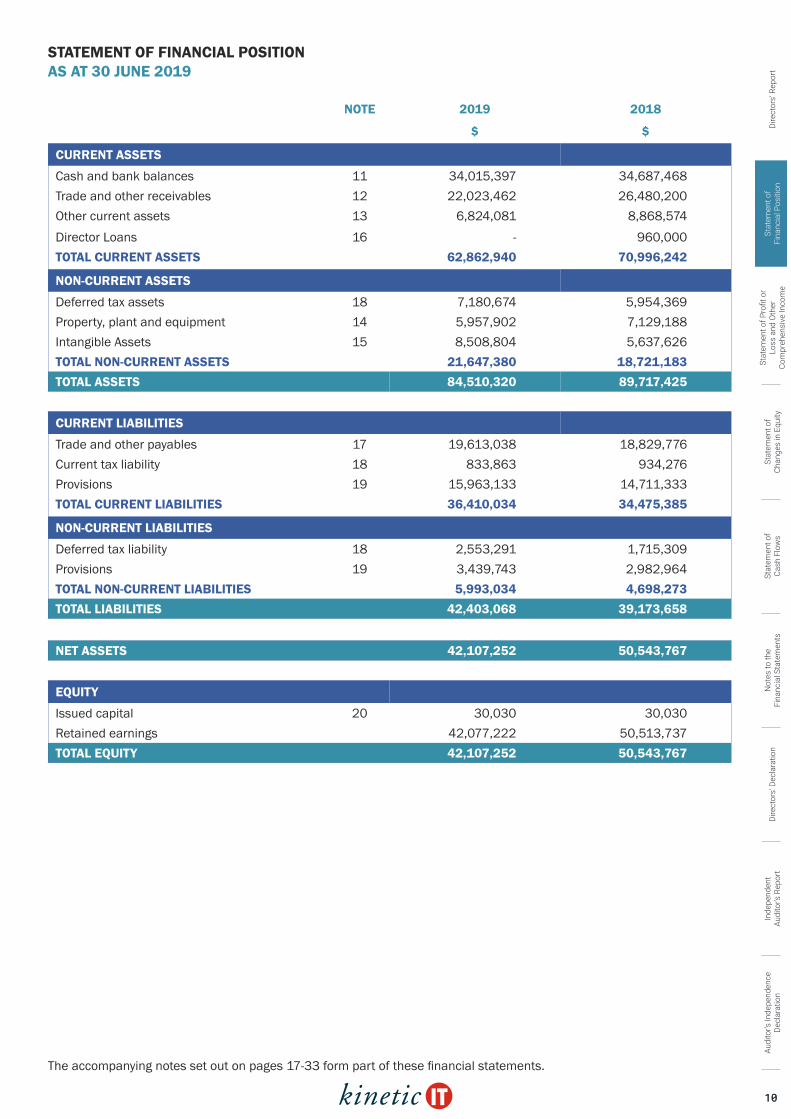
STATEMENT OF FINANCIAL POSITION AS AT 30 JUNE 2019
NOTE 2019 2018
$ $
CURRENT ASSETS
Cash and bank balances 11 34,015,397 34,687,468 Trade and other receivables 12 22,023,462 26,480,200 Other current assets 13 6,824,081 8,868,574 Director Loans 16 - 960,000TOTAL CURRENT ASSETS 62,862,940 70,996,242
NON-CURRENT ASSETS
Deferred tax assets 18 7,180,674 5,954,369 Property, plant and equipment 14 5,957,902 7,129,188 Intangible Assets 15 8,508,804 5,637,626 TOTAL NON-CURRENT ASSETS 21,647,380 18,721,183TOTAL ASSETS 84,510,320 89,717,425
CURRENT LIABILITIES
Trade and other payables 17 19,613,038 18,829,776 Current tax liability 18 833,863 934,276Provisions 19 15,963,133 14,711,333 TOTAL CURRENT LIABILITIES 36,410,034 34,475,385
NON-CURRENT LIABILITIES
Deferred tax liability 18 2,553,291 1,715,309 Provisions 19 3,439,743 2,982,964 TOTAL NON-CURRENT LIABILITIES 5,993,034 4,698,273 TOTAL LIABILITIES 42,403,068 39,173,658
NET ASSETS 42,107,252 50,543,767
EQUITY
Issued capital 20 30,030 30,030 Retained earnings 42,077,222 50,513,737TOTAL EQUITY 42,107,252 50,543,767
The accompanying notes set out on pages 17-33 form part of these financial statements.
Dire
ctor
s’ D
ecla
ratio
nN
otes
to th
e Fi
nanc
ial S
tate
men
tsAu
dito
r’s In
depe
nden
ce
Decl
arat
ion
Inde
pend
ent
Audi
tor’s
Rep
ort
Dire
ctor
s’ R
epor
t
1010
Stat
emen
t of
Fina
ncia
l Pos
ition
Stat
emen
t of P
rofit
or
Loss
and
Oth
er
Com
preh
ensi
ve In
com
e
Stat
emen
t of
Cash
Flo
ws
Stat
emen
t of
Chan
ges
in E
quity
STATEMENT OF PROFIT OR LOSS AND OTHER COMPREHENSIVE INCOME

STATEMENT OF PROFIT OR LOSS AND OTHER COMPREHENSIVE INCOME FOR THE YEAR ENDED 30 JUNE 2019
NOTE 2019 2018
$ $
CONTINUING OPERATIONSRevenue from contracts with customers 5A 203,215,516 197,533,463 Cost of Sales (133,450,653) (128,913,331)GROSS PROFIT 69,764,862 68,620,132 Other gains and losses 5B - 367,981Employee benefits expense (27,341,696) (24,653,668)Occupancy expenses (4,107,692) (4,653,566)Marketing expenses (423,551) (160,863)Administration expenses (4,701,877) (4,402,004)Depreciation and amortisation expense 6A (6,869,232) (7,049,530)Finance costs 7 (649) -Finance income 7 206,950 337,097Other expenses (3,446,110) (3,318,856)
PROFIT BEFORE TAX 23,081,005 25,086,723 Income tax expense 8 (7,097,520) (7,613,988)PROFIT FOR THE YEAR 15,983,485 17,472,735
OTHER COMPREHENSIVE INCOME, NET OF INCOME TAX:ITEMS THAT WILL NOT BE RECLASSIFIED SUBSEQUENTLY TO PROFIT OR LOSS:Other - -
- -
ITEMS THAT MAY BE RECLASSIFIED SUBSEQUENTLY TO PROFIT OF LOSS:Other - -
- -
Other comprehensive income for the year, net of income tax - -
TOTAL COMPREHENSIVE INCOME FOR THE YEAR 15,983,485 17,472,735
The accompanying notes set out on pages 17-33 form part of these financial statements.
Dire
ctor
s’ D
ecla
ratio
nN
otes
to th
e Fi
nanc
ial S
tate
men
tsAu
dito
r’s In
depe
nden
ce
Decl
arat
ion
Inde
pend
ent
Audi
tor’s
Rep
ort
Dire
ctor
s’ R
epor
t
12
Stat
emen
t of P
rofit
or
Loss
and
Oth
er
Com
preh
ensi
ve In
com
e
Stat
emen
t of
Cash
Flo
ws
Stat
emen
t of
Chan
ges
in E
quity
Stat
emen
t of
Fina
ncia
l Pos
ition

STATEMENTOF CHANGESIN EQUITY

STATEMENT OF CHANGES IN EQUITY FOR THE YEAR ENDED 30 JUNE 2019
The above amounts are stated net of tax.
Issued Capital Retained Earnings
TotalOrdinary D Class
$ $ $ $
BALANCE AT 1 JULY 2017 30,000 30 45,311,002 45,341,032Profit for the year - - 17,472,735 17,472,735Other comprehensive income for the year, net of income tax - - - -
Total comprehensive income for the year - - 17,472,735 17,472,735
Payment of dividends - - (12,270,000) (12,270,000)BALANCE AT 30 JUNE 2018 30,000 30 50,513,737 50,543,767
BALANCE AT 1 JULY 2018 30,000 30 50,513,737 50,543,767Profit for the year 15,983,485 15,983,485Other comprehensive income for the year, net of income tax - - - -
Total comprehensive income for the year - - 15,983,485 15,983,485
Payment of dividends - - (24,420,000) (24,420,000)BALANCE AT 30 JUNE 2019 30,000 30 42,077,222 42,107,252
The accompanying notes set out on pages 17-33 form part of these financial statements.
Dire
ctor
s’ D
ecla
ratio
nN
otes
to th
e Fi
nanc
ial S
tate
men
tsAu
dito
r’s In
depe
nden
ce
Decl
arat
ion
Inde
pend
ent
Audi
tor’s
Rep
ort
Dire
ctor
s’ R
epor
t
14
Stat
emen
t of
Chan
ges
in E
quity
Stat
emen
t of P
rofit
or
Loss
and
Oth
er
Com
preh
ensi
ve In
com
e
Stat
emen
t of
Cash
Flo
ws
Stat
emen
t of
Fina
ncia
l Pos
ition

STATEMENT OFCASH FLOWS

NOTE 2019 2018
$ $
CASH FLOWS FROM OPERATING ACTIVITIESReceipts from customers 230,770,045 215,181,590Payment to suppliers and employees (191,213,509) (180,816,226)Interest received 284,856 271,545 Interest paid (649) -Bank guarantee costs (396,107) (262,957)Income tax paid (7,685,552) (8,997,051)Income tax refund received 99,289 68,875 Net cash generated by operating activities 22 31,858,373 25,445,776 CASH FLOWS FROM INVESTING ACTIVITIESProceeds from disposal of property, plant and equipment - 1,313,049 Payment for property, plant and equipment (3,049,717) (3,478,864)Customer formation costs (6,020,727) -Net cash used in investing activities (9,070,444) (2,165,815)CASH FLOWS FROM FINANCING ACTIVITIESMovement in shareholder loans 960,000 (960,000) Dividends paid (24,420,000) (12,270,000)Net cash used in financing activities (23,460,000) (13,230,000)Net (decrease)/increase in cash and cash equivalents (672,071) 10,049,961 Cash and cash equivalents at beginning of year 34,687,468 24,637,507 CASH AND CASH EQUIVALENTS AT END OF YEAR 11 34,015,397 34,687,468
STATEMENT OF CASH FLOWSFOR THE YEAR ENDED 30 JUNE 2019
The accompanying notes set out on pages 17-33 form part of these financial statements.
Dire
ctor
s’ D
ecla
ratio
nN
otes
to th
e Fi
nanc
ial S
tate
men
tsAu
dito
r’s In
depe
nden
ce
Decl
arat
ion
Inde
pend
ent
Audi
tor’s
Rep
ort
Dire
ctor
s’ R
epor
t
16
Stat
emen
t of
Cash
Flo
ws
Stat
emen
t of P
rofit
or
Loss
and
Oth
er
Com
preh
ensi
ve In
com
e
Stat
emen
t of
Chan
ges
in E
quity
Stat
emen
t of
Fina
ncia
l Pos
ition

NOTES TO THE FINANCIALSTATEMENTSNOTE 01 COMPANYINFORMATIONNOTE 02 APPLICATIONOFNEWANDREVISED ACCOUNTINGSTANDARDSNOTE 03 BASISOFPREPARATIONNOTE 04 SIGNIFICANTACCOUNTINGPOLICIESNOTE 05REVENUENOTE 06 EXPENSESNOTE 07FINANCEANDINCOMEEXPENSESNOTE 08INCOMETAXEXPENSENOTE 09AUDITORS’REMUNERATIONNOTE 10DIVIDENDSNOTE 11CASHANDBANKBALANCESNOTE 12TRADEANDOTHERRECEIVABLESNOTE 13OTHERCURRENTASSETSNOTE 14PROPERTY,PLANTANDEQUIPMENTNOTE 15INTANGIBLEASSETSNOTE 16DIRECTORLOANSNOTE 17PAYABLESNOTE 18TAXASSETSANDLIABILITIESNOTE 19PROVISIONSNOTE 20ISSUEDCAPITALNOTE 21 CAPITAL&LEASINGCOMMITMENTSNOTE 22CASHFLOWINFORMATIONNOTE 23CONTINGENTLIABILITIESNOTE 24SUBSEQUENTEVENTSNOTE 25COMPANYDETAILS
................18
...............18.................20
...20.................................28................................28
........29....................29
...............29................................29
..............29.........29
..................30.......30
......................30.........................30
................................31.............31
..............................31..........................31
......32...............32
.................32....................33
.......................33
FOR THE YEAR ENDED 30 JUNE 2019
NOTE 1: COMPANY INFORMATION
Kinetic IT Pty Ltd (the “Company”) is a company domiciled in Australia. The address of the Company’s registered office is Ground Floor, 30 The Esplanade, Perth WA 6000 The principal activities of the Company during the financial year were the provision of services pertaining to Managed Enterprise Technology, Cyber and Information Security, Business and Digital Transformation and Advisory and Consulting.
NOTE 2: APPLICATION OF NEW AND REVISED ACCOUNTING STANDARDS
A. Amendments to Accounting Standards and new Interpretations that are mandatorily effective for the current year
New and revised Standards and amendments thereof and Interpretations effective for the current year that are relevant to the Company include:
AASB 9 Financial Instruments and related amending Standards
AASB 9 Financial Instruments (AASB 9) replaces AASB139 Financial Instruments: Recognition and Measurement (AASB 139) for annual periods beginning on or after 1 January 2018, bringing together all three aspects of the accounting for financial instruments: classification and measurement; impairment; and hedge accounting.
The Company has applied AASB 9 retrospectively, with an initial application date of 1 July 2018 and no impact to comparative figures and no cumulative effect to the opening balance of retained earnings at 1 July 2018. The changes as a result of adoption of AASB 9 has not had a significant effect on the Company’s accounting policies related to financial liabilities. Trade receivables is the only financial asset that has been impacted by the adoption of the standard, specifically the measurement basis for the impairment of trade receivables.
i. Classification and measurement
Under AASB 9, debt instruments are subsequently measured at fair value through profit or loss, amortised cost, or fair value through Other Comprehensive Income. The classification is based on two criteria, being the Company’s business model for managing the assets; and whether the instruments’ contractual cash flows represent ‘solely payments of principal and interest’ on the principal amount outstanding. The assessment of the Company’s business model was made as of the date of initial application, 1 July 2018. The assessment of whether contractual cash flows on debt instruments are solely comprised of principal and interest was made based on the facts and circumstances as at the initial recognition of the assets.
The classification and measurement requirements of AASB 9 did not have a significant impact on the Company. Trade receivables and other non-current financial assets (i.e. directors’ loans) previously classified as loans and receivables are held to collect contractual cash flows and give rise to cash flows representing solely payments of principal and interest. These are now classified and measured as debt instruments at amortised cost.
The Company has not designated any financial liabilities as at fair value through profit or loss. There are no changes in classification and measurement for the Company’s financial liabilities.
ii. Impairment loss
The adoption of AASB 9 has not fundamentally changed the Company’s accounting assessment of impairment losses for financial assets by replacing AASB 139’s incurred loss approach with a forward-looking expected credit loss (ECL) approach. Under AASB 9, loss allowances are measured on either 12-month ECLs or Lifetime ECLs. 12-month ECLs result from possible default events within the 12 months after reporting date and Lifetime ECLs result from all possible default events over the expected life of a financial instrument. The Company has elected to measure loss allowances on a 12-month ECL basis.
AASB 9 requires the Company to recognise an allowance for ECLs for all financial assets not held at fair value through profit or loss and contract assets, i.e. those held at amortised cost and at Fair Value Through Other Comprehensive Income (FVTOCI). When determining the credit risk for trade receivables the Company uses quantitative and qualitative information and analysis, based on the Company’s historical experience and informed credit assessment, as well as forward-looking information. The adoption of AASB 9 has not resulted in any adjustment to the provision for doubtful debts and therefore no change to opening retained earnings at 1 July 2018.
Dire
ctor
s’ D
ecla
ratio
nAu
dito
r’s In
depe
nden
ce
Decl
arat
ion
Inde
pend
ent
Audi
tor’s
Rep
ort
Dire
ctor
s’ R
epor
t
18
Not
es to
the
Fina
ncia
l Sta
tem
ents
Stat
emen
t of P
rofit
or
Loss
and
Oth
er
Com
preh
ensi
ve In
com
e
Stat
emen
t of
Cash
Flo
ws
Stat
emen
t of
Chan
ges
in E
quity
Stat
emen
t of
Fina
ncia
l Pos
ition
NOTE 2: APPLICATION OF NEW AND REVISED ACCOUNTING STANDARDS (continued)
A. Amendments to Accounting Standards and new Interpretations that are mandatorily effective for the current year (continued)
AASB 15 Revenue from Contracts with Customers and related amending Standards
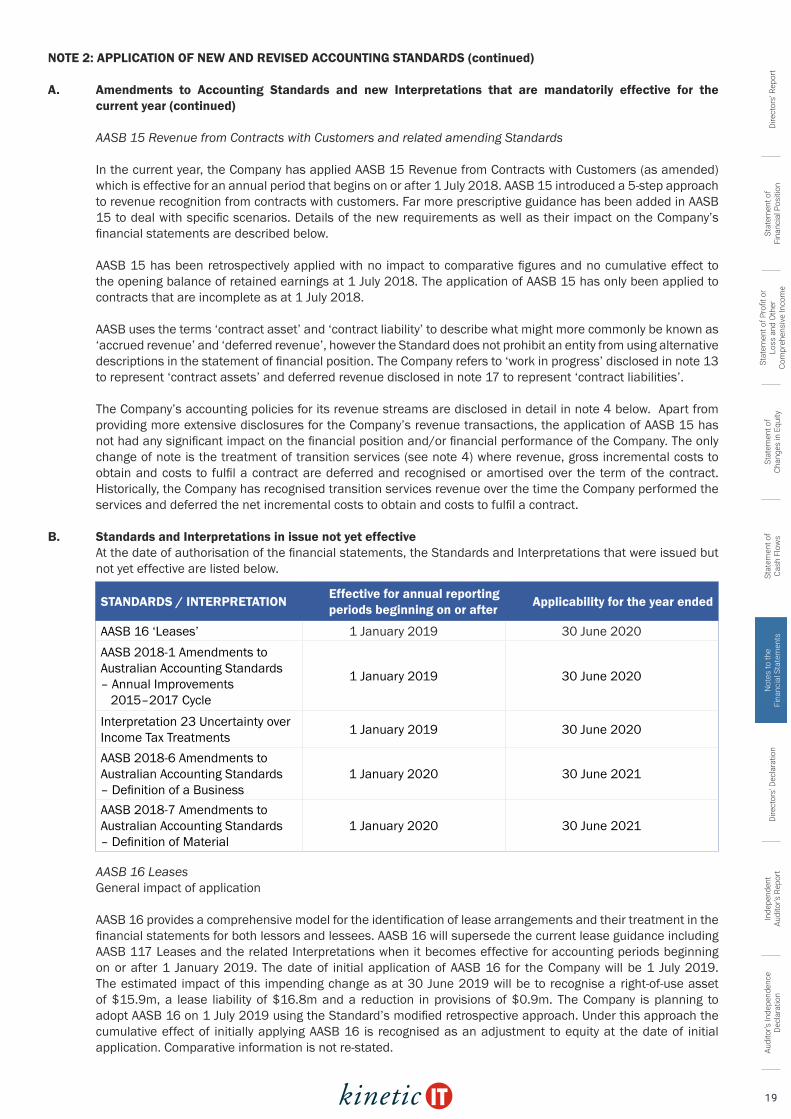
In the current year, the Company has applied AASB 15 Revenue from Contracts with Customers (as amended) which is effective for an annual period that begins on or after 1 July 2018. AASB 15 introduced a 5-step approach to revenue recognition from contracts with customers. Far more prescriptive guidance has been added in AASB 15 to deal with specific scenarios. Details of the new requirements as well as their impact on the Company’s financial statements are described below.
AASB 15 has been retrospectively applied with no impact to comparative figures and no cumulative effect to the opening balance of retained earnings at 1 July 2018. The application of AASB 15 has only been applied to contracts that are incomplete as at 1 July 2018.
AASB uses the terms ‘contract asset’ and ‘contract liability’ to describe what might more commonly be known as ‘accrued revenue’ and ‘deferred revenue’, however the Standard does not prohibit an entity from using alternative descriptions in the statement of financial position. The Company refers to ‘work in progress’ disclosed in note 13 to represent ‘contract assets’ and deferred revenue disclosed in note 17 to represent ‘contract liabilities’.
The Company’s accounting policies for its revenue streams are disclosed in detail in note 4 below. Apart from providing more extensive disclosures for the Company’s revenue transactions, the application of AASB 15 has not had any significant impact on the financial position and/or financial performance of the Company. The only change of note is the treatment of transition services (see note 4) where revenue, gross incremental costs to obtain and costs to fulfil a contract are deferred and recognised or amortised over the term of the contract. Historically, the Company has recognised transition services revenue over the time the Company performed the services and deferred the net incremental costs to obtain and costs to fulfil a contract.
B. Standards and Interpretations in issue not yet effectiveAt the date of authorisation of the financial statements, the Standards and Interpretations that were issued but not yet effective are listed below.
AASB 16 LeasesGeneral impact of application
AASB 16 provides a comprehensive model for the identification of lease arrangements and their treatment in the financial statements for both lessors and lessees. AASB 16 will supersede the current lease guidance including AASB 117 Leases and the related Interpretations when it becomes effective for accounting periods beginning on or after 1 January 2019. The date of initial application of AASB 16 for the Company will be 1 July 2019. The estimated impact of this impending change as at 30 June 2019 will be to recognise a right-of-use asset of $15.9m, a lease liability of $16.8m and a reduction in provisions of $0.9m. The Company is planning to adopt AASB 16 on 1 July 2019 using the Standard’s modified retrospective approach. Under this approach the cumulative effect of initially applying AASB 16 is recognised as an adjustment to equity at the date of initial application. Comparative information is not re-stated.
STANDARDS / INTERPRETATION Effective for annual reporting periods beginning on or after Applicability for the year ended
AASB 16 ‘Leases’ 1 January 2019 30 June 2020AASB 2018-1 Amendments to Australian Accounting Standards – Annual Improvements 2015–2017 Cycle
1 January 2019 30 June 2020
Interpretation 23 Uncertainty over Income Tax Treatments 1 January 2019 30 June 2020
AASB 2018-6 Amendments to Australian Accounting Standards – Definition of a Business
1 January 2020 30 June 2021
AASB 2018-7 Amendments to Australian Accounting Standards – Definition of Material
1 January 2020 30 June 2021 Dire
ctor
s’ D
ecla
ratio
nAu
dito
r’s In
depe
nden
ce
Decl
arat
ion
Inde
pend
ent
Audi
tor’s
Rep
ort
Dire
ctor
s’ R
epor
t
19
Not
es to
the
Fina
ncia
l Sta
tem
ents
Stat
emen
t of P
rofit
or
Loss
and
Oth
er
Com
preh
ensi
ve In
com
e
Stat
emen
t of
Cash
Flo
ws
Stat
emen
t of
Chan
ges
in E
quity
Stat
emen
t of
Fina
ncia
l Pos
ition
NOTE 2: APPLICATION OF NEW AND REVISED ACCOUNTING STANDARDS (continued)
B. Standards and Interpretations in issue not yet effective (continued)Lease incentives (e.g. rent free period) will be recognised as part of the measurement of the right of use assets and lease liabilities whereas under AASB 117 they resulted in the recognition of a lease liability incentive, amortised as a reduction of rental expenses on a straight line basis. Under AASB 16, right of use assets will be tested for impairment in accordance with AASB 136 Impairment of Assets. This will replace the previous requirement to recognise a provision for onerous lease contracts. For short term leases (lease term of 12 months or less) and leases of low value assets (such as personal computers and office furniture), the Company will opt to recognise a lease expense on a straight line basis as permitted by AASB 16.
NOTE 3: BASIS OF PREPARATION
A. Statement of complianceThe Company is not a reporting entity because in the opinion of the directors there are unlikely to exist users of the financial report who are unable to command the preparation of reports tailored so as to satisfy specifically all of their information needs. Accordingly, these special purpose financial statements have been prepared to satisfy the directors’ reporting requirements under the Corporations Act 2001.
The financial statements have been prepared in accordance with the Corporations Act 2001, the recognition and measurement requirements specified by all Australian Accounting Standards and Interpretations, and the disclosure requirements of Accounting Standards AASB 101 Presentation of Financial Statements, AASB 107 Statement of Cash Flows, AASB 108 Accounting Policies, Changes in Accounting Estimates and Errors, and AASB 1054 Australian Additional Disclosures.
B. Basis of measurement The financial statements have been prepared on the historical cost basis.
C. Functional and presentation currency These financial statements are presented in Australian dollars, which is the Company’s functional currency.
D. Use of estimates and judgementsThe preparation of financial statements requires management to make judgements, estimates and assumptions that affect the application of accounting policies and the reported amounts of assets, liabilities, income and expenses. Actual results may differ from these estimates. Estimates and underlying assumptions are reviewed on an ongoing basis. Revisions to accounting estimates are recognised in the period in which the estimate is revised and in any future periods affected. The judgements, estimates and assumptions that have a significant risk of causing a material adjustment to the carrying amounts of assets and liabilities in future periods are discussed below;
i. Impairment of Intangible AssetsThe Company assesses impairment of its intangible assets (customer formation costs) at each reporting date by evaluating conditions specific to the Company and the asset that may lead to impairment. If an impairment trigger exists, the recoverable amount of the asset is determined. This involves value in use calculations, which incorporate a number of key estimates and assumptions.
ii. Employee Benefits ProvisionThe liability for employee benefits expected to be settled more than 12 months from the reporting date are recognised and measured at the present value of the estimated cashflows to be made in respect of all employees at reporting date. In determining the present value of the liability, estimates of attrition rates, salary and wage increases, inflation and discount rates have all been taken into account.
NOTE 4: SIGNIFICANT ACCOUNTING POLICIES
The accounting policies set out below have been applied consistently to all periods presented in these financial statements.
A. Foreign currency transactionsTransactions in foreign currencies are translated to the respective functional currencies of the Company at exchange rates at the dates of the transactions. Monetary assets and liabilities denominated in foreign currencies at the reporting date are retranslated to the functional currency at the foreign exchange rate at that date. The foreign currency gain or loss on monetary items is the difference between amortised cost in the functional currency at the beginning of the period, adjusted for effective interest and payments during the period, and the amortised cost in foreign currency translated at the exchange rate at the end of the period.
Dire
ctor
s’ D
ecla
ratio
nAu
dito
r’s In
depe
nden
ce
Decl
arat
ion
Inde
pend
ent
Audi
tor’s
Rep
ort
Dire
ctor
s’ R
epor
t
20
Not
es to
the
Fina
ncia
l Sta
tem
ents
Stat
emen
t of P
rofit
or
Loss
and
Oth
er
Com
preh
ensi
ve In
com
e
Stat
emen
t of
Cash
Flo
ws
Stat
emen
t of
Chan
ges
in E
quity
Stat
emen
t of
Fina
ncia
l Pos
ition

NOTE 4: SIGNIFICANT ACCOUNTING POLICIES (continued)
B. Financial instruments
Recognition, and derecognition
Financial assets and financial liabilities are recognised when the Company becomes a party to the contractual provisions of the financial instrument.
Financial assets are derecognised when the contractual rights to the cash flows from the financial asset expire, or when the financial asset and all substantial risks and rewards are transferred. A financial liability is derecognised when it is extinguished, discharged, cancelled or expires.
The Company derecognises financial liabilities only when the Company’s obligations are discharged, cancelled or have expired. The difference between the carrying amount of the financial liability derecognised and the consideration paid and payable is recognised in profit or loss.
Classification and initial measurement of financial assets
Except for those trade receivables that are measured at the transaction price in accordance with AASB 15, all financial assets are initially measured at fair value adjusted for initial transaction costs (where applicable). Financial assets, other than those designated and effective as hedging instruments, are classified into the following categories:
• amortised cost• fair value through profit or loss (FVTPL)• fair value through other comprehensive income (FVOCI).
The classification is determined by both the Company’s business model for managing the financial asset the contractual cash flow characteristics of the financial asset. In the periods presented the Company does not have any financial assets categorised as FVTPL or FVOCI.
All income and expenses relating to financial assets that are recognised in profit or loss are presented within finance costs, finance income or other financial items, except for impairment of trade receivables which are included within other expenses.
Financial assets at amortised cost
Financial assets are measured at amortised cost if
• the assets are not designated as FVTPL• the assets are held within a business model whose objective is to hold the financial assets and collect its contractual cashflows • the contractual terms of the financial assets give rise to cash flows that are solely payments of principal and interest on the principal amount outstanding.
After initial recognition, these are measured at amortised cost using the effective interest method. Discounting is omitted where the effect of discounting is immaterial. The Company’s cash and cash equivalents, trade and most other receivables fall into this category of financial instruments.
Foreign exchange gains and losses
Foreign currency transactions are translated using the exchange rates prevailing at the date of the transaction. Foreign exchange gains and losses resulting from movements in exchange rate at the date of settlement of such transactions are recognised in profit or loss.
Financial liabilities
All financial liabilities are initially measured at fair value adjusted for initial transaction costs (where applicable). After initial recognition, financial liabilities are measured subsequently at amortised cost using the effective interest method or at FVTPL. Amortised cost is calculated by considering any issue costs, and any discount or premium on settlement. Gains and losses are recognised in profit or loss when the liabilities are derecognised and through the amortisation process.
Dire
ctor
s’ D
ecla
ratio
nAu
dito
r’s In
depe
nden
ce
Decl
arat
ion
Inde
pend
ent
Audi
tor’s
Rep
ort
Dire
ctor
s’ R
epor
t
21
Not
es to
the
Fina
ncia
l Sta
tem
ents
Stat
emen
t of P
rofit
or
Loss
and
Oth
er
Com
preh
ensi
ve In
com
e
Stat
emen
t of
Cash
Flo
ws
Stat
emen
t of
Chan
ges
in E
quity
Stat
emen
t of
Fina
ncia
l Pos
ition
NOTE 4: SIGNIFICANT ACCOUNTING POLICIES (continued)
B. Financial instruments (continued)The effective interest method is a method of calculating the amortised cost of a financial liability and of allocating interest expense over the relevant period. The effective interest rate is the rate that exactly discounts estimated future cash payments (including all fees paid or received, transaction costs and other premiums or discounts) through the expected life of the financial liability, or (where appropriate) a shorter period, to the amortised cost of a financial liability.
Financial liabilities at FVTPL:
Financial liabilities are classified as at FVTPL when the financial liability is (i) held for trading or (ii) it is designated as at FVTPL in accordance with AASB 9. A financial liability is classified as held for trading if:
• It has been acquired principally for the purpose of repurchasing it in the near term; or• On initial recognition it is part of a portfolio of identified financial instruments that the Company manages together and has a recent actual pattern of short-term profit-taking; or• It is a derivative, (except financial guarantee contracts or designated hedging instruments
Financial liabilities at FVTPL are measured at fair value, with any gains or losses arising on changes in fair value recognised in profit or loss to the extent that they are not part of a designated hedging relationship. The net gain or loss recognised in profit or loss incorporates any interest paid on the financial liability and is included in the ‘other expenses’ in profit or loss.
C. Property, plant and equipment
i. Recognition and measurementItems of plant and equipment are measured at cost less accumulated depreciation and impairment losses.
Cost includes expenditure that is directly attributable to the acquisition of the asset. The cost of self-constructed assets includes the cost of materials and direct labour, any other costs directly attributable to bringing the asset to a working condition for its intended use, and the costs of dismantling and removing the items and restoring the site on which they are located. Cost also may include transfers from equity of any gain or loss on qualifying cash flow hedges of foreign currency purchases of property, plant and equipment. Purchased software that is integral to the functionality of the related equipment is capitalised as part of that equipment. Borrowing costs related to the acquisition or construction of qualifying assets are recognised in profit or loss as incurred.
When parts of an item of property, plant and equipment have different useful lives, they are accounted for as separate items (major components) of property, plant and equipment.
Gains and losses on disposal of an item of property, plant and equipment are determined by comparing the proceeds from disposal with the carrying amount of property, plant and equipment and gains are recognised within “other income” in profit or loss. When revalued assets are sold, the amounts included in the revaluation reserve are transferred to retained earnings.
ii. Subsequent costs The cost of replacing part of an item of property, plant and equipment is recognised in the carrying amount of the item if it is probable that the future economic benefits embodied within the part will flow to the Company and its cost can be measured reliably. The carrying amount of the replaced part is derecognised. The costs of the day-to-day servicing of property, plant and equipment are recognised in profit or loss as incurred.
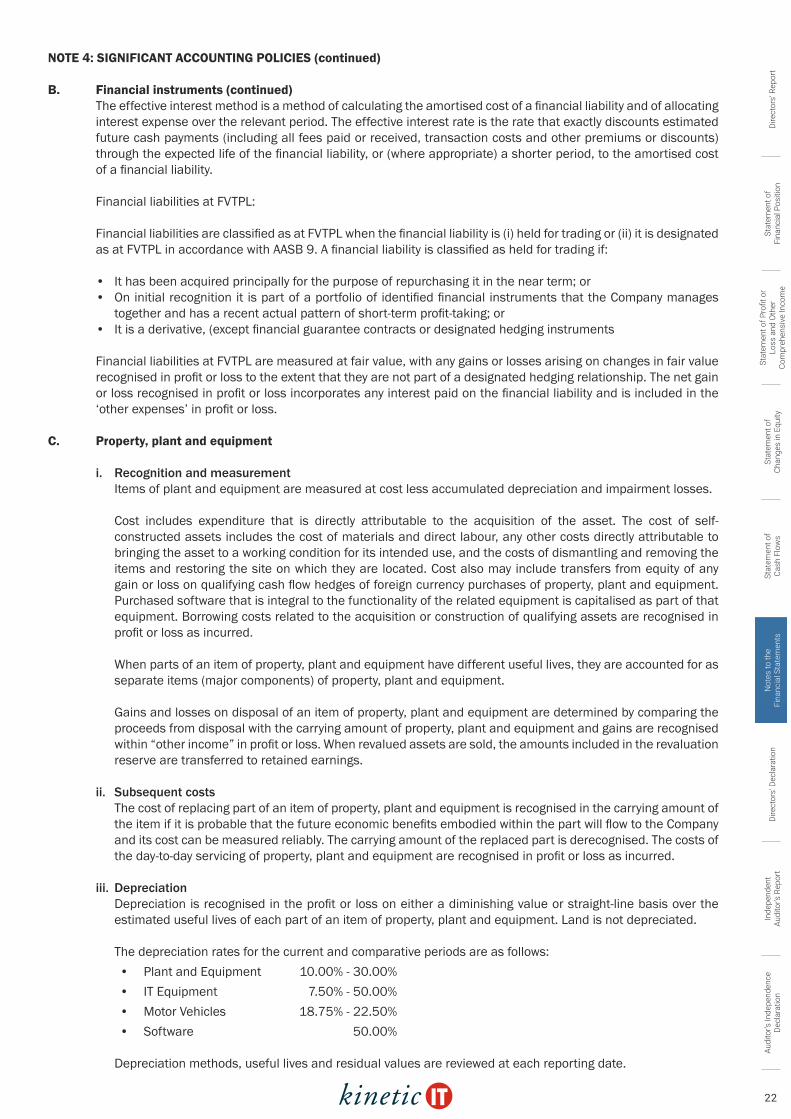
iii. DepreciationDepreciation is recognised in the profit or loss on either a diminishing value or straight-line basis over the estimated useful lives of each part of an item of property, plant and equipment. Land is not depreciated.
The depreciation rates for the current and comparative periods are as follows:• Plant and Equipment 10.00% - 30.00%• IT Equipment 7.50% - 50.00%• Motor Vehicles 18.75% - 22.50%• Software 50.00%
Depreciation methods, useful lives and residual values are reviewed at each reporting date.
Dire
ctor
s’ D
ecla
ratio
nAu
dito
r’s In
depe
nden
ce
Decl
arat
ion
Inde
pend
ent
Audi
tor’s
Rep
ort
Dire
ctor
s’ R
epor
t
22
Not
es to
the
Fina
ncia
l Sta
tem
ents
Stat
emen
t of P
rofit
or
Loss
and
Oth
er
Com
preh
ensi
ve In
com
e
Stat
emen
t of
Cash
Flo
ws
Stat
emen
t of
Chan
ges
in E
quity
Stat
emen
t of
Fina
ncia
l Pos
ition

NOTE 4: SIGNIFICANT ACCOUNTING POLICIES (continued)
D. Non-current assets classified as held for saleWhen the Company intends to sell a non-current asset or a group of assets (a disposal group), and if sale within twelve (12) months is highly probable, the asset or disposal group is classified as ‘held for sale’ and presented separately in the statement of financial position as current assets.
Assets classified as ‘held for sale’ are measured at the lower of their carrying amounts immediately prior to their classification as ‘held for sale’ and their fair value less costs to sell.
E. Leased assetsLeases in terms of which the Company assumes substantially all the risks and rewards of ownership are classified as finance leases. Upon initial recognition the leased asset is measured at an amount equal to the lower of its fair value and the present value of the minimum lease payments. Subsequent to initial recognition, the asset is accounted for in accordance with the accounting policy applicable to that asset. There are no finance leases held by the Company at reporting date.
Other leases are operating leases. The leased assets are not recognised on the Company’s statement of financial position.
F. Inventories Inventories are measured at the lower of cost and net realisable value. The cost of inventories is based on the first-in first-out principle, and includes expenditure incurred in acquiring the inventories, and other costs incurred in bringing them to their existing location and condition.
Net realisable value is the estimated selling price in the ordinary course of business, less the estimated costs of completion and selling expenses.
G. Impairment
i. Financial assetsThe Company recognises a loss allowance for expected credit losses (ECLs) on trade receivables and contract assets. The amount of expected credit losses is updated at each reporting date to reflect changes in credit risk since initial recognition of the respective financial instrument.
The Company always recognises lifetime ECLs for trade receivables and contract assets. The expected credit losses on these financial assets are estimated based on the Company’s historical credit loss experience, adjusted for factors that are specific to the customer’s circumstances and current and forecast economic conditions at the reporting date.
For all other financial instruments, the Company recognises lifetime ECLs when there has been a significant increase in credit risk since initial recognition. However, if the credit risk on the financial instrument has not increased significantly since initial recognition, the Company measures the loss allowance for that financial instrument at an amount equal to the 12-month ECL.
Lifetime ECL represents the expected credit losses that will result from all possible default events over the expected life of a financial instrument. In contrast, 12-month ECL represents the portion of lifetime ECL that is expected to result from default events on a financial instrument that are possible within 12 months after the reporting date.
In assessing whether the credit risk on a financial instrument has increased significantly since initial recognition, the Company compares the risk of a default occurring on the financial instrument at the reporting date with the risk of a default occurring on the financial instrument at the date of initial recognition. In making this assessment, the Company considers both quantitative and qualitative information that is reasonable and supportable, including historical experience and forward-looking information that is readily available.
The measurement of expected credit losses is a function of the probability of default and the expected exposure at default. The assessment of the probability of default is based on historical data adjusted by forward-looking information as described above. Exposure at default for financial assets is represented by the asset’s gross carrying amount at the reporting date.
If the Company has measured the loss allowance for a financial instrument at an amount equal to lifetime ECL in the previous reporting period, but determines at the current reporting date that the conditions for lifetime ECL are no longer met, the Company will measure the loss allowance at equal to 12-month ECL.
Dire
ctor
s’ D
ecla
ratio
nAu
dito
r’s In
depe
nden
ce
Decl
arat
ion
Inde
pend
ent
Audi
tor’s
Rep
ort
Dire
ctor
s’ R
epor
t
23
Not
es to
the
Fina
ncia
l Sta
tem
ents
Stat
emen
t of P
rofit
or
Loss
and
Oth
er
Com
preh
ensi
ve In
com
e
Stat
emen
t of
Cash
Flo
ws
Stat
emen
t of
Chan
ges
in E
quity
Stat
emen
t of
Fina
ncia
l Pos
ition

NOTE 4: SIGNIFICANT ACCOUNTING POLICIES (continued)
G. Impairment (continued)
i. Financial assets (continued) The Company recognises an impairment gain or loss in profit or loss for all financial instruments with a corresponding adjustment to their carrying amount through a loss allowance account, except for financial assets that are measured at FVTOCI, where the loss allowance is recognised in other comprehensive income and accumulated in an investment revaluation reserve.
ii. Impairment of non-financial assets At each reporting date, the Company assesses whether there is any indication that an asset may be impaired. Where an indicator of impairment exists, the Company makes a formal estimate of recoverable amount. Where the carrying amount of an asset exceeds its recoverable amount the asset is considered impaired and is written down to its recoverable amount.
Recoverable amount is the greater of fair value less costs to sell and value in use. It is determined for an individual asset, unless the asset’s value in use cannot be estimated to be close to its fair value less costs to sell and it does not generate cash inflows that are largely independent of those from other assets or groups of assets, in which case, the recoverable amount is determined for the cash-generating unit to which the asset belongs.
In assessing value in use, the estimated future cash flows are discounted to their present value using a pre tax discount rate that reflects current market assessments of the time value of money and the risks specific to the asset.
H. Employee benefits
i. Defined contribution plansA defined contribution plan is a post-employment benefit plan under which an entity pays fixed contributions into a separate entity and will have no legal or constructive obligation to pay further amounts. Obligations for contributions to defined contribution plans are recognised as a personnel expense in profit or loss when they are due. Prepaid contributions are recognised as an asset to the extent that a cash refund or a reduction in future payments is available.
ii. Other long-term employee benefitsThe Company’s net obligation in respect of long-term employee benefits is the amount of future benefit that employees have earned in return for their service in the current and prior periods plus related on costs; that benefit is discounted to determine its present value, and the fair value of any related assets is deducted. The discount rate is the yield at the reporting date on AA credit-rated that have maturity dates approximating the terms of the Company’s obligations. The calculation is performed using the projected unit credit method. Any actuarial gains or losses are recognised in profit or loss in the period in which they arise.
iii. Termination benefitsTermination benefits are recognised as an expense when the Company is demonstrably committed, without realistic possibility of withdrawal, to a formal detailed plan to either terminate employment before the normal retirement date or to provide termination benefits as a result of an offer made to encourage voluntary redundancy.
Termination benefits for voluntary redundancies are recognised as an expense if the Company has made an offer encouraging voluntary redundancy, it is probable that the offer will be accepted, and the number of acceptances can be estimated reliably.
iv. Short-term benefitsLiabilities for employee benefits for wages, salaries, and annual leave represent present obligations resulting from employees’ services provided to reporting date and are calculated at undiscounted amounts based on remuneration wage and salary rates that the Company expects to pay as at reporting date including related on-costs, such as workers compensation insurance and payroll tax.
Non-accumulating non-monetary benefits, such as medical care, housing, cars and free or subsidised goods and services, are expensed based on the net marginal cost to the Company as the benefits are taken by the employees.
Dire
ctor
s’ D
ecla
ratio
nAu
dito
r’s In
depe
nden
ce
Decl
arat
ion
Inde
pend
ent
Audi
tor’s
Rep
ort
Dire
ctor
s’ R
epor
t
24
Not
es to
the
Fina
ncia
l Sta
tem
ents
Stat
emen
t of P
rofit
or
Loss
and
Oth
er
Com
preh
ensi
ve In
com
e
Stat
emen
t of
Cash
Flo
ws
Stat
emen
t of
Chan
ges
in E
quity
Stat
emen
t of
Fina
ncia
l Pos
ition
NOTE 4: SIGNIFICANT ACCOUNTING POLICIES (continued)
H. Employee benefits (continued)
iv. Short-term benefits (continued)A liability is recognised for the amount expected to be paid under short-term cash bonus or profit-sharing plans if the Company has a present legal or constructive obligation to pay this amount as a result of past service provided by the employee and the obligation can be estimated reliably.
I. ProvisionsA provision is recognised if, as a result of a past event, the Company has a present legal or constructive obligation that can be estimated reliably, and it is probable that an outflow of economic benefits will be required to settle the obligation. Provisions are determined by discounting the expected future cash flows at a pre-tax rate that reflects current market assessments of the time value of money and the risks specific to the liability.
WarrantiesA provision for warranties is recognised when the underlying products or services are sold. The provision is based on historical warranty data and a weighting of all possible outcomes against their associated probabilities.
J. Revenue
i. Revenue from Contracts with CustomersRevenue arises mainly through customer contracts and agreements for the provision of services pertaining to Managed Enterprise Technology, Business and Digital Transformation, Cyber and Information Security, and Advisory and Consulting. The sale of goods, predominantly third party software licensing, represents a small component of revenue that are generally contracted through the same customer contract and agreements.
The Company mainly enters into master services agreements involving a range of the Company’s services and products for which some services will be engaged through additional contracts such as project agreements, statements of works and consulting agreements. Revenue which represents income arising in the course of the Company’s ordinary activities is recognised by reference to each distinct performance obligation promised in the contracts with customers, when or as the Company transfers the control of the goods or services promised in a contract and the customer obtains control of the goods or services. Depending on the substance of the respective contract with customers, the control of the promised goods or services may transfer over time or at a point in time.
The Company recognises contract liabilities for the consideration received in respect of unsatisfied performance obligations and reports these amounts as deferred revenue in the statement of financial position. Similarly, if the Company satisfied a performance obligation before it receives the consideration, the Company recognises either a contract asset or a trade receivable in its statement of financial position, depending on whether something other than the passage of time is required before the consideration is due.
Recognition and Measurement
Revenue is measured at the amount of consideration to which the Company expects to be entitled in exchange for transferring the promised goods or services to the customers, excluding amounts collected on behalf of third parties such as sales and service taxes or goods and services taxes. If the amount of consideration varies due to discounts, rebates, credits, incentives, performance bonuses, penalties or other similar items, the Company estimates the amount of consideration that it expects to be entitled based on the expected value or the most likely outcome but the estimation is constrained up to the amount that is highly probable of no significant reversal in the future. If the contract with customer contains more than one distinct performance obligation based on the relative stand-alone selling prices of the goods or services promised in the contract, the Company will use the stand-alone selling prices. If a standalone selling price is not directly observable, the Company will need to estimate it using adjusted market assessment approach, expected cost plus a margin approach and residual approach.
The consideration allocated to each performance obligation is recognised as revenue when or as the customer obtains control of the goods or services. At the inception of each contract with customer, the Company determines whether control of the goods or services for each performance obligation is transferred over time or at a point.
Dire
ctor
s’ D
ecla
ratio
nAu
dito
r’s In
depe
nden
ce
Decl
arat
ion
Inde
pend
ent
Audi
tor’s
Rep
ort
Dire
ctor
s’ R
epor
t
25
Not
es to
the
Fina
ncia
l Sta
tem
ents
Stat
emen
t of P
rofit
or
Loss
and
Oth
er
Com
preh
ensi
ve In
com
e
Stat
emen
t of
Cash
Flo
ws
Stat
emen
t of
Chan
ges
in E
quity
Stat
emen
t of
Fina
ncia
l Pos
ition

NOTE 4: SIGNIFICANT ACCOUNTING POLICIES (continued)
J. Revenue (continued)
i. Revenue from Contracts with Customers (continued)Managed Services
Managed services are generally contracted via a master services agreement that has base services scope and pricing that is distinct from discretionary services arrangements facilitated by the same agreement. Revenue from managed services is either in the form of monthly fixed and/or monthly variable fees based on customer service dimensions. Fixed fees are recognised on a straight-line basis for the respective contract period that the fees apply to for each contract, as the amount of work required to perform under these fixed fee arrangements do not vary significantly from month-to-month and therefore the straight-line method provides a faithful depiction of the transfer of goods or services. Consideration received can be variable in nature dependent on the customer service dimensions where the variable consideration is included in the transaction price at the company’s best estimate, using either an expected value or most likely outcome, whichever provides the best estimate and is included in revenue to the extent that it is highly probable that there will be no significant reversal of the cumulative amount of revenue when any price uncertainty is resolved. This variable consideration can include service credits, abatements, earn-backs and other penalty and performance regimes.
Consulting, Professional, Project and Other Discretionary Services
Discretionary services are generally contracted via contractual instruments such as agreements, statements of work and service requests for which in many cases are associated with a master services agreement. Revenue from discretionary services for a fixed fee or time and materials is recognised when or as the Company performs the services, as costs are generally incurred uniformly as the work progresses and are considered to be proportionate to the company’s performance. The Company also measures its’ progress towards complete satisfaction of the performance obligation by assessing the status/progress and comparing actual hours spent to date with the total estimated hours required to complete each engagement and/or milestone. If the inputs used to recognise revenue do not contribute to the progress in satisfying the company’s performance or are disproportionate to the progress, recognised revenue will be adjusted accordingly. The combination of hours-to-hours and progress against outcomes provides the most faithful depiction of the transfer of goods and services for each engagement and/or milestone due the Company’s ability to make reliable estimates of the total number of hours required to perform, arising from its significant historical experience with similar engagements and customers. Consideration can include variable elements such as liquidated damages and critical deliverable credits to which the company will only include revenue to the extent that it is highly probable that there will be no significant reversal of the cumulative amount of revenue when any price uncertainty is resolved.
Transition Services
When entering into a contract to deliver managed services, the contract generally has a discrete transition plan and pricing to transition the services from either an incumbent service provider, the customer themselves or to introduce a new service. These transition services generally have fixed fees based on the completion of milestones along with costs incurred to establish the managed services.
While the nature of transition services is similar to discretionary services, without the transition services, the customer would not be able to receive the benefits of the managed services. Therefore the fees and costs associated with each transition (referred to as customer formation costs), being the incremental costs to obtain and costs to fulfil a contract, are deferred and amortised on a straight-line basis over the initial term of the customer contract. Consideration can include variable elements such as liquidated damages and critical deliverable credits to which the company will only include revenue to the extent that it is highly probable that there will be no significant reversal of the cumulative amount of revenue when any price uncertainty is resolved.
As a Service Platforms & Services
Revenue is derived from providing customers access to the Company’s platforms and shared services over time and is recognised in accordance with the terms of contracts provided in various forms of agreements. The AaS platforms and shared services revenue (if any) is recognised over time, being the subscription or relevant contract period, as the customer simultaneously receives and consumes the benefit of accessing the platform and shared services.
Dire
ctor
s’ D
ecla
ratio
nAu
dito
r’s In
depe
nden
ce
Decl
arat
ion
Inde
pend
ent
Audi
tor’s
Rep
ort
Dire
ctor
s’ R
epor
t
26
Not
es to
the
Fina
ncia
l Sta
tem
ents
Stat
emen
t of P
rofit
or
Loss
and
Oth
er
Com
preh
ensi
ve In
com
e
Stat
emen
t of
Cash
Flo
ws
Stat
emen
t of
Chan
ges
in E
quity
Stat
emen
t of
Fina
ncia
l Pos
ition

NOTE 4: SIGNIFICANT ACCOUNTING POLICIES (continued)
J. Revenue (continued)
i. Revenue from Contracts with Customers (continued)Access to the Platform components of AaS is not considered distinct from other performance obligations, as access to any platform alone does not allow the customer to obtain substantially all the benefits of the access, and is therefore accounted for as a single performance obligation. Consideration received can be variable in nature, based upon customer usage in excess of contractually agreed units.
The variable consideration is included in the transaction price at the company’s best estimate, using either an expected value or most likely outcome, whichever provides the best estimate and is included in revenue to the extent that it is highly probable that there will be no significant reversal of the cumulative amount of revenue when any price uncertainty is resolved.
Product and License Revenue
Revenue from the sale of product and software licenses is recognised when or as the Company transfers control of the assets to the customer. Invoices for goods or services transferred are due upon receipt by the customer.
K. Lease paymentsPayments made under operating leases are recognised in profit or loss on a straight-line basis over the term of the lease. Lease incentives received are recognised as an integral part of the total lease expense, over the term of the lease.
L. Finance income and expenseFinance income comprises interest income on funds invested. Interest income is recognised as it accrues in profit or loss, using the effective interest method.
Finance expenses comprise interest expense on short-term borrowings from related parties. All borrowing costs are recognised in profit or loss using the effective interest method.
Foreign currency gains and losses are reported on a net basis.
M. Income tax Income tax expense comprises current and deferred tax. Income tax expense is recognised in profit or loss except to the extent that it relates to items recognised directly in equity, in which case it is recognised in equity.
Current tax is the expected tax payable on the taxable income for the year, using tax rates enacted or substantively enacted at the reporting date, and any adjustment to tax payable in respect of previous years.
Deferred tax is recognised using the balance sheet method, providing for temporary differences between the carrying amounts of assets and liabilities for financial reporting purposes and the amounts used for taxation purposes. Deferred tax is not recognised for the following temporary differences: the initial recognition of assets or liabilities in a transaction that is not a business combination and that affects neither accounting nor taxable profit. In addition, deferred tax is not recognised for taxable temporary differences arising on the initial recognition of goodwill.
Deferred tax is measured at the tax rates that are expected to be applied to the temporary differences when they reverse, based on the laws that have been enacted or substantively enacted by the reporting date. Deferred tax assets and liabilities are offset if there is a legally enforceable right to offset current tax liabilities and assets and they relate to income taxes levied by the same tax authority.
A deferred tax asset is recognised to the extent that it is probable that future taxable profits will be available against which the temporary difference can be utilised. Deferred tax assets are reviewed at each reporting date and are reduced to the extent that it is no longer probable that the related tax benefit will be realised.
N. Goods and services taxRevenue, expenses and assets are recognised net of the amount of goods and services tax (GST), except where the amount of GST incurred is not recoverable from the taxation authority. In these circumstances, the GST is recognised as part of the cost of acquisition of the asset or as part of the expense.
Dire
ctor
s’ D
ecla
ratio
nAu
dito
r’s In
depe
nden
ce
Decl
arat
ion
Inde
pend
ent
Audi
tor’s
Rep
ort
Dire
ctor
s’ R
epor
t
27
Not
es to
the
Fina
ncia
l Sta
tem
ents
Stat
emen
t of P
rofit
or
Loss
and
Oth
er
Com
preh
ensi
ve In
com
e
Stat
emen
t of
Cash
Flo
ws
Stat
emen
t of
Chan
ges
in E
quity
Stat
emen
t of
Fina
ncia
l Pos
ition

NOTE 4: SIGNIFICANT ACCOUNTING POLICIES (continued)
N. Goods and services tax (continued)
Receivables and payables are stated with the amount of GST included. The net amount of GST recoverable from, or payable to, the ATO is included as a current asset or liability in the balance sheet.
Cash flows are included in the statement of cash flows on a gross basis. The GST components of cash flows arising from investing and financing activities which are recoverable from, or payable to, the ATO are classified as operating cash flows.
O. Customer formation costsCustomer Formation costs comprises of capitalised tendering and start-up costs (including due diligence, contract negotiations and transition) on specifically identified contracts which are generally amortised during the initial term of each contract which can range between 2 and 5 years. An exception to amortisation of customer formation costs over the initial term is applied when a specifically identified contract involves establishing a presence in a new region where the amortisation period is extended to include the optional term of the contract when it is expected that the optional term will be exercised by the customer, which can range between an additional 1 to 3 years. These costs comprise wages, contractor fees and expenses incurred, relating directly to tendering and start-up costs. Customer formation costs are disposed of on the expiry and termination of contracts regardless of whether new contracts are formed with those existing customers.
2019 2018
$ $
NOTE 5: REVENUEA. Revenue from contracts with customers
Services revenue 198,622,671 193,287,582Aircraft revenue - 9,552Sale of goods 4,592,844 4,236,329
203,215,516 197,533,463 B. Other income
Gain on disposal of property, plant and equipment - 367,981- 367,981
NOTE 6: EXPENSESA. Depreciation & amortisation of non-current assets
• Leasehold improvements 770,254 760,851 • IT equipment 1,002,344 868,285 • Aircraft - 5,270 • Motor vehicle 24,467 30,733 • Plant & equipment 51,895 55,471 • Low value pool 59,673 39,789 • Software 1,811,050 2,360,441 • Boat - 7,336 • Amortisation of customer formation costs 3,149,549 2,921,354
TOTAL DEPRECIATION & AMORTISATION 6,869,232 7,049,530
B. Rental expense on operating leases
• Minimum lease payments 2,724,452 2,683,422 2,724,452 2,683,422
C. Revenue and net gains
Net gain/(loss) on foreign exchange revaluations (17,502) (81)Net gain/(loss) on disposal of plant and equipment (161,064) 367,981
(178,566) 367,900
The gross gains are included in other income and gross losses are included in other expenses.
Dire
ctor
s’ D
ecla
ratio
nAu
dito
r’s In
depe
nden
ce
Decl
arat
ion
Inde
pend
ent
Audi
tor’s
Rep
ort
Dire
ctor
s’ R
epor
t
28
Not
es to
the
Fina
ncia
l Sta
tem
ents
Stat
emen
t of P
rofit
or
Loss
and
Oth
er
Com
preh
ensi
ve In
com
e
Stat
emen
t of
Cash
Flo
ws
Stat
emen
t of
Chan
ges
in E
quity
Stat
emen
t of
Fina
ncia
l Pos
ition

FOR THE YEAR ENDED 30 JUNE 2019
2019 2018
$ $
NOTE 7: FINANCE AND INCOME EXPENSESRecognised in profit and lossInterest income on bank deposits 206,950 337,097 Interest income on shareholder loans - -FINANCE INCOME 206,950 337,097Interest expense on bank accounts (649) -FINANCE EXPENSE (649) -NET FINANCE INCOME (EXPENSE) 206,301 337,097
NOTE 8: INCOME TAX EXPENSECURRENT TAX EXPENSECurrent tax 6,709,196 5,898,810Adjustment for prior period - -
6,709,196 5,898,810 DEFERRED TAX EXPENSEOrigination and reversal of temporary differences 388,324 1,715,178
7,097,520 7,613,988 NUMERICAL RECONCILIATIONS BETWEEN TAX EXPENSE AND PRE-TAX ACCOUNTING PROFITProfit before income tax 23,081,005 25,086,723 Income tax using the Company's domestic tax rate of 30% (2018: 30%) 6,924,301 7,526,017 Non-deductible expenses 173,219 188,015 R&D net tax benefit - (100,044)
7,097,520 7,613,988
NOTE 9: AUDITORS’ REMUNERATIONAUDIT SERVICESAuditors of the CompanyDeloitte Touche Tohmatsu:Audit of financial reports 40,800 40,800Other advisory services 23,750 9,500Taxation services 23,994 10,783
88,544 61,083
NOTE 11: CASH AND BANK BALANCESCash at bank 31,207,594 21,925,622Cash deposits 1,806 3,030Term deposits 2,805,997 12,758,816CASH AND CASH EQUIVALENTS IN THE STATEMENT OF CASHFLOW 34,015,397 34,687,468
NOTE 12: TRADE AND OTHER RECEIVABLES
CURRENTTrade receivables 22,021,297 26,400,130 Provision for impairment of receivables - -
22,021,297 26,400,130 Other receivables 2,165 80,070 Receivable from related parties - -
22,023,462 26,480,200
NOTE 10: DIVIDENDSFully franked ordinary dividend franked at the rate of 30% 24,420,000 12,270,000
Dire
ctor
s’ D
ecla
ratio
nAu
dito
r’s In
depe
nden
ce
Decl
arat
ion
Inde
pend
ent
Audi
tor’s
Rep
ort
Dire
ctor
s’ R
epor
t
29
Not
es to
the
Fina
ncia
l Sta
tem
ents
Stat
emen
t of P
rofit
or
Loss
and
Oth
er
Com
preh
ensi
ve In
com
e
Stat
emen
t of
Cash
Flo
ws
Stat
emen
t of
Chan
ges
in E
quity
Stat
emen
t of
Fina
ncia
l Pos
ition

NOTE 14: PROPERTY, PLANT AND EQUIPMENT
Leasehold improvements at:- cost 6,312,378 6,396,519 Less accumulated depreciation (3,470,437) (2,833,460)
2,841,941 3,563,059 IT equipment at:- cost 5,677,355 5,879,521 Less accumulated depreciation (4,060,516) (4,191,184)
1,616,839 1,688,337 Motor vehicles at:- cost 212,850 212,850 Less accumulated depreciation (139,451) (114,983)
73,399 97,867 Plant & equipment at:- cost 623,558 573,146 Less accumulated depreciation (274,389) (222,703)
349,169 350,443 Low value pool at:- cost 173,348 214,699 Less accumulated depreciation (77,201) (122,881)
96,147 91,818 Software at:- cost 5,325,568 7,068,963 Less accumulated depreciation (4,345,161) (5,731,299)
980,407 1,337,664 TOTAL PROPERTY, PLANT AND EQUIPMENT 5,957,902 7,129,188
NOTE 15: INTANGIBLE ASSETSCustomer Formation costs at:- cost 22,685,396 16,664,669Less accumulated amortisation (14,176,592) (11,027,043)
8,508,804 5,637,626
FOR THE YEAR ENDED 30 JUNE 2019
2019 2018
$ $
NOTE 13: OTHER CURRENT ASSETS
Work in Progress 3,966,043 6,240,797Prepayments 1,882,724 1,592,223Other 975,314 1,035,554
6,824,081 8,868,574
NOTE 16: DIRECTOR LOANSCurrent asset director loan accounts:- R Decent - 960,000
- 960,000
Dire
ctor
s’ D
ecla
ratio
nAu
dito
r’s In
depe
nden
ce
Decl
arat
ion
Inde
pend
ent
Audi
tor’s
Rep
ort
Dire
ctor
s’ R
epor
t
30
Not
es to
the
Fina
ncia
l Sta
tem
ents
Stat
emen
t of P
rofit
or
Loss
and
Oth
er
Com
preh
ensi
ve In
com
e
Stat
emen
t of
Cash
Flo
ws
Stat
emen
t of
Chan
ges
in E
quity
Stat
emen
t of
Fina
ncia
l Pos
ition

Assets Liabilities Net
2019 2018 2019 2018 2019 2018
$ $ $ $ $ $
Employee entitlements 17,930,815 15,778,764 - - 17,930,815 15,778,764 Accruals and other 6,004,765 4,069,131 (2,165) (80,070) 6,002,600 3,989,061 Customer Formation costs - - (8,508,804) (5,637,626) (8,508,804) (5,637,626)TAXABLE AMOUNT 23,935,581 19,847,896 (8,510,969) (5,717,697) 15,424,611 14,130,199 Deferred tax assets/(liabilities) - 30% 7,180,674 5,954,369 (2,553,291) (1,715,309) 4,627,383 4,239,060
2019 2018
$ $
NOTE 17: PAYABLESCURRENTTrade creditors 3,652,738 4,580,980Sundry creditors and accrued expenses 11,427,782 10,041,957Deferred revenue 4,532,518 4,206,839
19,613,038 18,829,776
NOTE 18: TAX ASSETS AND LIABILITIES
CURRENT TAX ASSETThe current tax liability for the Company of $833,863 (2018: $934,276) represents the amount of income taxes payable in respect of current and prior financial periods.
RECOGNISED DEFERRED TAX ASSETS AND LIABILITIESDeferred tax assets and liabilities are attributable to the following:
FOR THE YEAR ENDED 30 JUNE 2019
NOTE 19: PROVISIONSCURRENTEmployee benefits 14,257,293 12,606,794Lease Incentives 1,705,840 2,104,539
15,963,133 14,711,333 NON-CURRENTEmployee benefits 3,439,743 2,982,964
3,439,743 2,982,964
NOTE 20: ISSUED CAPITAL30,000 fully paid ordinary shares 30,000 30,000 30 fully paid D class shares 30 30
30,030 30,030 Dire
ctor
s’ D
ecla
ratio
nAu
dito
r’s In
depe
nden
ce
Decl
arat
ion
Inde
pend
ent
Audi
tor’s
Rep
ort
Dire
ctor
s’ R
epor
t
31
Not
es to
the
Fina
ncia
l Sta
tem
ents
Stat
emen
t of P
rofit
or
Loss
and
Oth
er
Com
preh
ensi
ve In
com
e
Stat
emen
t of
Cash
Flo
ws
Stat
emen
t of
Chan
ges
in E
quity
Stat
emen
t of
Fina
ncia
l Pos
ition

2019 2018
$ $
NOTE 21: CAPITAL & LEASING COMMITMENTSA. Operating Lease Commitments
Non-cancellable operating leases are payable as follows:
• Less than one year 3,652,595 2,818,652 • Between one and five years 8,056,476 4,868,456 • more than five years 1,094,685 -
12,803,756 7,687,108
B. Capital expenditure
Contracted but not provided for and payable:• Less than one year 2,110,410 2,251,991
2,110,410 2,251,991
Operating leases relate primarily to premises occupied by the Company in the course of its operations, generally with terms between 2 and 7 years. Some of the operating leases contain options to extend for further periods and an adjustment to bring the lease payments into line with market rates prevailing at that time. The leases do not contain an option to purchase the leased property and sub-letting of all leases is subject to the landlord’s consent.
The Company has no financial liabilities that relate to financing cash flows.
NOTE 22: CASH FLOW INFORMATIONRECONCILIATION OF CASH FLOW FROM / (USED IN) OPERATIONS WITH PROFIT FROM ORDINARY ACTIVITIES AFTER INCOME TAXProfit from ordinary activities after income tax 15,983,485 17,472,735Non-cash flows in profit from ordinary activitiesDepreciation & Amortisation 6,869,232 7,049,530 Net loss/(gain) on disposal of plant and equipment 161,064 (367,981) Changes in Assets & Liabilities:(Increase)/decrease in receivables 4,456,737 476,101(Increase)/decrease in other assets 2,044,493 (2,944,786) Increase/(decrease) in payables 1,123,519 3,523,354Increase/(decrease) in income tax payable (100,412) 400,985 (Increase)/decrease in deferred taxes (388,324) (1,715,178)Increase/(decrease) in provisions 1,708,579 1,551,016CASH FLOWS FROM OPERATIONS 31,858,373 25,445,776
FOR THE YEAR ENDED 30 JUNE 2019
Bank Facility The Company has a facility issued by ANZ to the value of $44,311,503 (2018: $27,596,668) comprised of a commercial card facility, a specific standby letter of credit or guarantee facility and a multi-option facility that may be used for the issue of standby letters of credit, guarantees or as an overdraft facility. At the 30th June 2019 $32,284,757 was used (2018: $21,218,004).
NOTE 23: CONTINGENT LIABILITIESBank guarantees and security deposits given on behalf of the Company to:Customers 30,011,503 19,296,669 Lessors of leased premises 2,273,254 1,921,335 TOTAL BANK GUARANTEES/SECURITY DEPOSITS 32,284,757 21,218,004
The bank guarantees in place at 30 June 2019 to the value of $32,284,757 (2018: $21,218,004), which were given by the Company’s Bankers, were secured by $2,805,997 (2018: $2,758,816) of term deposits and a fixed and floating charge over the assets and undertakings of the Company.
Dire
ctor
s’ D
ecla
ratio
nAu
dito
r’s In
depe
nden
ce
Decl
arat
ion
Inde
pend
ent
Audi
tor’s
Rep
ort
Dire
ctor
s’ R
epor
t
32
Not
es to
the
Fina
ncia
l Sta
tem
ents
Stat
emen
t of P
rofit
or
Loss
and
Oth
er
Com
preh
ensi
ve In
com
e
Stat
emen
t of
Cash
Flo
ws
Stat
emen
t of
Chan
ges
in E
quity
Stat
emen
t of
Fina
ncia
l Pos
ition

NOTE 24: SUBSEQUENT EVENTS
In the opinion of the directors of Kinetic IT, in the interval between the end of the financial year and the date of this report, there has not arisen any other item, transaction or event of a material and unusual nature likely to affect significantly the operations of the Company, the results of those operations, or the state of affairs of the Company, in future financial years. NOTE 25: COMPANY DETAILS
The registered office of the Company is: Ground Floor, 30 The Esplanade Perth WA 6000
FOR THE YEAR ENDED 30 JUNE 2019
Dire
ctor
s’ D
ecla
ratio
nAu
dito
r’s In
depe
nden
ce
Decl
arat
ion
Inde
pend
ent
Audi
tor’s
Rep
ort
Dire
ctor
s’ R
epor
t
33
Not
es to
the
Fina
ncia
l Sta
tem
ents
Stat
emen
t of P
rofit
or
Loss
and
Oth
er
Com
preh
ensi
ve In
com
e
Stat
emen
t of
Cash
Flo
ws
Stat
emen
t of
Chan
ges
in E
quity
Stat
emen
t of
Fina
ncia
l Pos
ition

DIRECTORS’DECLARATION
In the opinion of the directors of Kinetic IT Pty Ltd (“the Company”):
A. As detailed in Note 3, the Company is not a reporting entity because there are unlikely to exist users of the financial report who are unable to command the preparation of reports tailored so as to specifically satisfy all their information needs;
B. The financial statements and notes, set out on pages 9 to 33, are in accordance with the Corporations Act 2001, including:
i. Giving a true and fair view of the financial position of the Company as at 30 June 2019 and of its performance, as represented by the results of its operations and its cash flows, for the financial year ended on that date in accordance with the statements of compliance and basis of preparation described in Note 3; and
ii. Complying with Australian Accounting Standards, to the extent described in Note 3, and the Corporations Regulations 2001; and
C. There are reasonable grounds to believe that the Company will be able to pay its debts as and when they become due and payable.
Signed in accordance with a resolution of directors, made pursuant to s.295(5) of the Corporations Act 2001.
On behalf of the Directors:
Director ...................................................
David John McCleery
Dated this 29 October 2019
Audi
tor’s
Inde
pend
ence
De
clar
atio
nIn
depe
nden
t Au
dito
r’s R
epor
tDi
rect
ors’
Rep
ort
35
Dire
ctor
s’ D
ecla
ratio
nN
otes
to th
e Fi
nanc
ial S
tate
men
ts
Stat
emen
t of P
rofit
or
Loss
and
Oth
er
Com
preh
ensi
ve In
com
e
Stat
emen
t of
Cash
Flo
ws
Stat
emen
t of
Chan
ges
in E
quity
Stat
emen
t of
Fina
ncia
l Pos
ition

INDEPENDENTAUDITOR’SREPORT

Liability limited by a scheme approved under Professional Standards Legislation.
Member of Deloitte Asia Pacific Limited and the Deloitte Network.
Opinion We have audited the financial report, being a special purpose financial report, of Kinetic IT Pty Ltd (the “Entity”) which comprises the statement of financial position as at 30 June 2019, the statement of profit or loss and other comprehensive income, the statement of changes in equity and the statement of cash flows for the year then ended, and notes to the financial statements, including a summary of significant accounting policies, and the directors’ declaration. In our opinion, the accompanying financial report of the Entity is in accordance with the Corporations Act 2001, including: (i) Giving a true and fair view of the Entity’s financial position as at 30 June 2019 and of its financial
performance for the year then ended; and
(ii) Complying with Australian Accounting Standards to the extent described in Note 2 and the Corporations Regulations 2001.
Basis for Opinion We conducted our audit in accordance with Australian Auditing Standards. Our responsibilities under those standards are further described in the Auditor’s Responsibilities for the Audit of the Financial Report section of our report. We are independent of the Entity in accordance with the auditor independence requirements of the Corporations Act 2001 and the ethical requirements of the Accounting Professional and Ethical Standards Board’s APES 110 Code of Ethics for Professional Accountants (the Code) that are relevant to our audit of the financial report in Australia. We have also fulfilled our other ethical responsibilities in accordance with the Code. We confirm that the independence declaration required by the Corporations Act 2001, which has been given to the directors of the Company, would be in the same terms if given to the directors as at the time of this auditor’s report. We believe that the audit evidence we have obtained is sufficient and appropriate to provide a basis for our opinion. Emphasis of Matter – Basis of Accounting We draw attention to Note 2 to the financial report, which describes the basis of accounting. The financial report has been prepared for the purpose of fulfilling the directors’ financial reporting responsibilities under the Corporations Act 2001. As a result, the financial report may not be suitable for another purpose. Our opinion is not modified in respect of this matter.
Deloitte Touche Tohmatsu ABN 74 490 121 060 Tower 2 Brookfield Place 123 St Georges Terrace Perth WA 6000 GPO Box A46 Perth WA 6837 Australia Tel: +61 8 9365 7000 Fax: +61 8 9365 7001 www.deloitte.com.au
Independent Auditor’s Report to the members of Kinetic IT Pty Ltd
Audi
tor’s
Inde
pend
ence
De
clar
atio
nDi
rect
ors’
Rep
ort
37
Inde
pend
ent
Audi
tor’s
Rep
ort
Not
es to
the
Fina
ncia
l Sta
tem
ents
Dire
ctor
s’ D
ecla
ratio
nSt
atem
ent o
f Pro
fit o
r Lo
ss a
nd O
ther
Co
mpr
ehen
sive
Inco
me
Stat
emen
t of
Cash
Flo
ws
Stat
emen
t of
Chan
ges
in E
quity
Stat
emen
t of
Fina
ncia
l Pos
ition
Other Information The directors are responsible for the other information. The other information comprises the Directors’ Report for the year ended 30 June 2019, but does not include the financial report and our auditor’s report thereon. Our opinion on the financial report does not cover the other information and we do not express any form of assurance conclusion thereon. In connection with our audit of the financial report, our responsibility is to read the other information and, in doing so, consider whether the other information is materially inconsistent with the financial report or our knowledge obtained in the audit, or otherwise appears to be materially misstated. If, based on the work we have performed, we conclude that there is a material misstatement of this other information, we are required to report that fact. We have nothing to report in this regard. Responsibilities of the Directors for the Financial Report The directors of the Company are responsible for the preparation of the financial report that gives a true and fair view and have determined that the basis of preparation described in Note 2 to the financial report is appropriate to meet the requirements of the Corporations Act 2001 and is appropriate to meet the needs of the members. The directors’ responsibility also includes such internal control as the directors determine is necessary to enable the preparation of the financial report that gives a true and fair view and is free from material misstatement, whether due to fraud or error. In preparing the financial report, the directors are responsible for assessing the ability of the Entity to continue as a going concern, disclosing, as applicable, matters related to going concern and using the going concern basis of accounting unless the directors either intend to liquidate the Entity or to cease operations, or has no realistic alternative but to do so. Auditor’s Responsibilities for the Audit of the Financial Report Our objectives are to obtain reasonable assurance about whether the financial report as a whole is free from material misstatement, whether due to fraud or error, and to issue an auditor’s report that includes our opinion. Reasonable assurance is a high level of assurance, but is not a guarantee that an audit conducted in accordance with the Australian Auditing Standards will always detect a material misstatement when it exists. Misstatements can arise from fraud or error and are considered material if, individually or in the aggregate, they could reasonably be expected to influence the economic decisions of users taken on the basis of this financial report. As part of an audit in accordance with the Australian Auditing Standards, we exercise professional judgement and maintain professional scepticism throughout the audit. We also:
Identify and assess the risks of material misstatement of the financial report, whether due to fraud or error, design and perform audit procedures responsive to those risks, and obtain audit evidence that is sufficient and appropriate to provide a basis for our opinion. The risk of not detecting a material misstatement resulting from fraud is higher than for one resulting
Audi
tor’s
Inde
pend
ence
De
clar
atio
nDi
rect
ors’
Rep
ort
38
Inde
pend
ent
Audi
tor’s
Rep
ort
Not
es to
the
Fina
ncia
l Sta
tem
ents
Dire
ctor
s’ D
ecla
ratio
nSt
atem
ent o
f Pro
fit o
r Lo
ss a
nd O
ther
Co
mpr
ehen
sive
Inco
me
Stat
emen
t of
Cash
Flo
ws
Stat
emen
t of
Chan
ges
in E
quity
Stat
emen
t of
Fina
ncia
l Pos
ition

from error, as fraud may involve collusion, forgery, intentional omissions, misrepresentations, or the override of internal control.
Obtain an understanding of internal control relevant to the audit in order to design audit procedures that are appropriate in the circumstances, but not for the purpose of expressing an opinion on the effectiveness of the Entity’s internal control.
Evaluate the appropriateness of accounting policies used and the reasonableness of accounting estimates and related disclosures made by the directors.
Conclude on the appropriateness of the directors’ use of the going concern basis of accounting and, based on the audit evidence obtained, whether a material uncertainty exists related to events or conditions that may cast significant doubt on the Entity’s ability to continue as a going concern. If we conclude that a material uncertainty exists, we are required to draw attention in our auditor’s report to the related disclosures in the financial report or, if such disclosures are inadequate, to modify our opinion. Our conclusions are based on the audit evidence obtained up to the date of our auditor’s report. However, future events or conditions may cause the Entity to cease to continue as a going concern.
Evaluate the overall presentation, structure and content of the financial report, including the disclosures, and whether the financial report represents the underlying transactions and events in a manner that achieves fair presentation.
We communicate with the directors regarding, among other matters, the planned scope and timing of the audit and significant audit findings, including any significant deficiencies in internal control that we identify during our audit. DELOITTE TOUCHE TOHMATSU Peter Rupp Partner Chartered Accountants Perth, 29 October 2019
Audi
tor’s
Inde
pend
ence
De
clar
atio
nDi
rect
ors’
Rep
ort
39
Inde
pend
ent
Audi
tor’s
Rep
ort
Not
es to
the
Fina
ncia
l Sta
tem
ents
Dire
ctor
s’ D
ecla
ratio
nSt
atem
ent o
f Pro
fit o
r Lo
ss a
nd O
ther
Co
mpr
ehen
sive
Inco
me
Stat
emen
t of
Cash
Flo
ws
Stat
emen
t of
Chan
ges
in E
quity
Stat
emen
t of
Fina
ncia
l Pos
ition

AUDITOR’SINDEPENDENCEDECLARATION

Liability limited by a scheme approved under Professional Standards Legislation.
Member of Deloitte Asia Pacific Limited and the Deloitte Network.
Dear Board Members
Kinetic IT Pty Ltd
In accordance with section 307C of the Corporations Act 2001, I am pleased to provide the following declaration of independence to the directors of Kinetic IT Pty Ltd. As lead audit partner for the audit of the financial statements of Kinetic IT Pty Ltd for the financial year ended 30 June 2019, I declare that to the best of my knowledge and belief, there have been no contraventions of:
(i) The auditor independence requirements of the Corporations Act 2001 in relation to the audit; and
(ii) Any applicable code of professional conduct in relation to the audit. Yours sincerely DELOITTE TOUCHE TOHMATSU Peter Rupp Partner Chartered Accountants
Deloitte Touche Tohmatsu ABN 74 490 121 060 Tower 2 Brookfield Place 123 St Georges Terrace Perth WA 6000 GPO Box A46 Perth WA 6837 Australia Tel: +61 8 9365 7000 Fax: +61 8 9365 7001 www.deloitte.com.au
The Board of Directors Kinetic IT Pty Ltd 30 The Esplanade PERTH WA 6000 29 October 2019
Dire
ctor
s’ R
epor
t
41
Audi
tor’s
Inde
pend
ence
De
clar
atio
nN
otes
to th
e Fi
nanc
ial S
tate
men
tsDi
rect
ors’
Dec
lara
tion
Inde
pend
ent
Audi
tor’s
Rep
ort
Stat
emen
t of P
rofit
or
Loss
and
Oth
er
Com
preh
ensi
ve In
com
e
Stat
emen
t of
Cash
Flo
ws
Stat
emen
t of
Chan
ges
in E
quity
Stat
emen
t of
Fina
ncia
l Pos
ition

Kinetic IT Pty Ltd | ABN 97 072 941 943
Perth, Melbourne, Sydney, Darwin & Canberra
1300 782 072
www.kineticit.com.au
www.linkedin.com/company/kinetic-it