Embed Size (px)
Citation preview
Journal of Hazardous Materials 403 (2021) 123918
Available online 13 September 20200304-3894/© 2020 The Author(s). Published by Elsevier B.V. This is an open access article under the CC BY-NC-ND license(http://creativecommons.org/licenses/by-nc-nd/4.0/).
Copper ecological risk assessment using DGT technique and PNEC: A case study in the Brazilian coast
Karelys Umbría-Salinas a,b, Astolfo Valero a,b, Samantha Eslava Martins c,d,*, Monica Wallner- Kersanach a
a Laboratorio de Hidroquímica, Instituto Oceanografico, Universidade Federal de Rio Grande, 96203-000, Brazil b Biology Centre CAS, Soil and Water Research Infrastructure, 370 05, Czech Republic c Instituto de Ciencias Biologicas, Universidade Federal de Rio Grande, 96203-000, Brazil d Norwegian Institute for Water Research (NIVA), NO-0349, Oslo, Norway
A R T I C L E I N F O
Editor: T Meiping
Keywords: Predicted No effect concentration Copper speciation Availability Estuary Species sensitivity distribution (SSD)
A B S T R A C T
Estuarine systems are vulnerable to metals stress, such as copper (Cu). Thus, the development of applicable tools to improve routine monitoring programs is increasingly necessary. In the present work a comprehensive Ecological Risk Assessment (ERA) was implemented by coupling the Measured Environmental Concentration (MEC), based on labile Cu (DGT) and the total dissolved Cu concentration. Additionally, toxicity data related to site-specific Predicted No Effect Concentration (PNEC) were used. As case study, estuarine areas were selected on Brazilian coast, previously reported as Cu release in shipyard areas. The results indicated an increase in con-centrations of dissolved and labile Cu during the application of antifouling paints. In locations where more vessels in maintenance were found, the concentration of Cu-DGT exceeded the PNEC value (0.16 μg.L− 1) and represented an important part of the total dissolved fraction (>93 %). The MEC/PNEC quotients, showed that shipyard areas represent a high ecological risk. Thus, it is highlighted the need for site-specific environmental assessments to manage complex ecosystems and set in environmental legislation. Consequently, the novel coupling of DGT technique and the derivation of a site-specific PNEC represent an easily applicable tool as an alternative to classical ERAs.
1. Introduction
Currently, trace metals contamination has received great attention from different research areas worldwide (Cheng et al., 2019; Dar et al., 2019; Rai et al., 2019). This is mainly related to their high persistence and lack of biodegradability, which cause metals to be easily enriched in aquatic environments and be accumulated in the organisms (Liu et al., 2019). Such elements can also affect human health when their concen-trations in the environment reach critic levels (Nour et al., 2019).
The problem described is aggravated in the estuarine and coastal en-vironments, because of the influence of variations in physicochemical and geochemical parameters, as well as a strong anthropic influence (Choi et al., 2012; Machado et al., 2016). Consequently, the biodiversity of these areas is affected by trace metals excess (Seeliger, 2001; Eisler, 2010). Nevertheless, quantifying the total dissolved concentration of these metals in the environment (required by regulation frameworks) does not necessarily indicate the real degree of toxicity that these generate.
Some anthropic sources of trace metals, specifically shipyard areas, include vessel repair and maintenance works, within those that stand out hull scraping of organisms (biofouling), surfaces sanding and coat-ings with anti-corrosion and antifouling paints (Turner, 2010; Choi et al., 2014). It is known that many antifouling paints of new generation include in their composition copper (Cu) and zinc (Zn) as the main biocides (Turner et al., 2009; Turner, 2010). Depending on the anti-fouling paint, Cu can be representing between 40–60 % of the total composition (Turner, 2010).
Cu has a great biological importance, mainly because it plays an essential role in the physiological and metabolic processes of organisms (Eisler, 2010; Braz-Mota et al., 2018). However, exposure to high con-centrations of Cu can generate important negative effects on organisms (De Boeck et al., 2006; Choi et al., 2012; Sappal et al., 2015). Addi-tionally, these effects are aggravated when Cu is in their labile fraction, which is more easily taken up by organisms. However, even though the labile fraction represents the most readily potential available form, it is
* Corresponding author at: Norwegian Institute for Water Research (NIVA), NO-0349, Oslo, Norway. E-mail address: [email protected] (S.E. Martins).
Contents lists available at ScienceDirect
Journal of Hazardous Materials
journal homepage: www.elsevier.com/locate/jhazmat
https://doi.org/10.1016/j.jhazmat.2020.123918 Received 27 March 2020; Received in revised form 11 August 2020; Accepted 7 September 2020

Journal of Hazardous Materials 403 (2021) 123918
2
not able to indicate by itself if the biological community is negatively affected by the presence of a metallic ion. Therefore, it is important to study the metal labile fraction and its relationship with the ecosystem.
In this sense, it is necessary to establish tools applicable in routine programs that allow better monitoring and management of aquatic ecosystems. Thus, the developing of a comprehensive Ecological Risk Assessment (ERA) – “process that evaluates the likelihood that adverse ecological effects may occur or are occurring as a result of exposure to one or more stressors” (US EPA, 2008) - as an applicable tool to a particular system could address this problem. In the planning and con-duction of an ERA, the coupling between exposure data and toxicity data of a given contaminant constitutes an important step.
The exposure data can be obtained through the measurement of the analyte of interest in this system, generating the Measured Environ-mental Concentration (MEC). While toxicity data from representative species can be collected to derive a Predicted Non-Effect Concentration (PNEC) - defined as the concentration below which an unacceptable effect on exposed organisms is unlikely to occur (ECB, 2003; Finizio and Vighu, 2014) – representative of the present biological community (ECB, 2003; Finizio and Vighu, 2014). According to Finizio and Vighu (2014), there is no established criterion for PNEC determination. However, in literature, most of the PNEC is derived based on populational endpoints, such as survival, development, and growth of organisms (Jin et al., 2014).
In the case of the MEC, it is expected that the use of the labile fraction will provide more realistic results in terms of exposure data; despite that, the total dissolved fraction is commonly used in this variable. In this sense, the technique of Diffusive Gradients in Thin films (DGT), based on a passive sampling, provides an in situ quantitative measurement, time- integrated and with good resolution of the labile fraction (Zhang and Davison, 1995; Davison and Zhang, 2012). Moreover, this technique has been successfully applied in estuarine environments with variable hy-drodynamic and complex physicochemical conditions, as well as in lo-cations with continuous and localized trace metal sources (Wallner-Kersanach et al., 2009; Costa and Wallner-Kersanach, 2013; Valero et al., 2020). In the same way, the DGT technique produces excellent results in the prediction of bioavailability of metals and good interpretations of exposure effects (Amato et al., 2018; Paller et al., 2019; Wang et al., 2019).
The Brazilian coastal areas are not exempt from the described problem. These allow exemplifying a problem of global interest, since it presents innumerable sources of high-impact contamination by metals, such as shipyards, which release Cu into the estuarine waters (Costa and Wallner-Kersanach, 2013; Martins and Monteiro-Neto, 2018). In Brazil, there is no legal control of the waste generated by antifouling paints based on Cu (40–60 %) and Zn (15–30 %) (Paradas and Amado Filho, 2007; Costa et al., 2016). In addition, the established legislation in Brazil, as well in other parts of the world, usually does not consider the labile fraction of trace metals for regulatory purposes. Finally, it is important to highlight that ERAs are not used for the establishment or refinement of quality criteria in Brazilian coastal environments, despite these areas shelter a wide range of species representing different taxa belonging to different trophic levels and covering many native species.
The main objective of this study is to generate a comprehensive ERA by coupling the DGT technique and site-specific PNEC and showing its application in aquatic areas highly impacted by metals pollution. Consequently, it was evaluated the true degree of impact of the Cu released by a hotspot (shipyard areas) and its implications for aquatic species that occur naturally in the ecosystem. For this purpose, different estuarine areas were selected along the southeast and southern coast of Brazil, specifically in the states of Rio de Janeiro, Santa Catarina and Rio Grande do Sul. The PNEC was derived for species that naturally occur in these areas.
2. Materials and methods
2.1. Study area
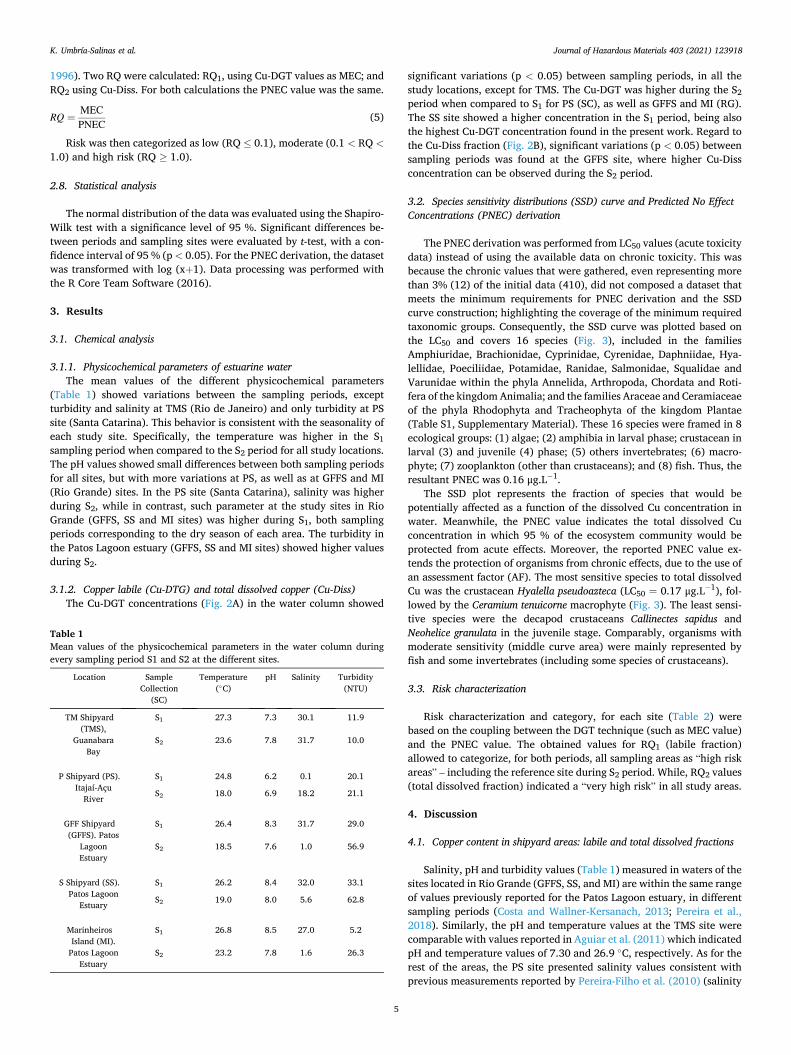
The determination of the MEC of Cu (exposure data) was determined to both the total dissolved (Cu-Diss) and the labile fraction (Cu-DGT) in water column. Three important port areas of southeastern and southern Brazil were selected, on the intertidal area of estuaries in the states of Rio de Janeiro (RJ), Santa Catarina (SC) and Rio Grande do Sul (RS) (Fig. 1).
In the southeastern region of the country, samplings were carried out in the Guanabara Bay (Niteroi, RJ) at the TM Shipyard (TMS; 22◦52′32′′S, 43◦06′59′′W), categorized as a medium-sized shipyard (1500 m2), and located at the Conceiçao Island. This bay (384 km2), known as the most prominent in Brazil, has an average depth of 5.7 m in their margins and up to 30 m in the inner channel, and the hydrody-namic is mainly dominated by tidal currents (Amador, 1997). The Guanabara Bay shelters different mangrove species, more than 100 plant taxa, more than 68 species of birds (including endangered species), and several groups of crustaceans (Kjerfve et al., 2001). In spite of its ecological importance, the bay has proven degradation of its waters because of direct discharge of sewage, as well as supersaturation of dissolved oxygen in the surface, while anoxic conditions are found in the water near the bottom (Borges et al., 2009; Aguiar et al., 2011).
In South Brazil, samplings took place in the Itajaí-Açu River, state of Santa Catarina, and in the Patos Lagoon estuary, in the state of Rio Grande do Sul. The samplings in the Itajaí-Açu River (SC) were per-formed at the P Shipyard (PS; 26◦51′55′′S, 48◦42′23′′W), a medium to large-sized shipyard (2589 m2) located in the Volta Grande neighbor-hood of Navegantes city. The Itajaí-Açu river stands out as one of the largest national fishing centers and the main sea route (national and international) of Santa Catarina state, as well as it represents 90 % of the freshwater flow to the estuary (Schettini, 2002; Pereira-Filho et al., 2010; Frena et al., 2016). It presents semidiurnal micro-tidal regime, influenced by atmospheric pressure and shear stress and intertidal mean depths from 5 to 8 m (Schettini, 2002). Besides the economic impor-tance, the system has an important ecological role for the regional coastal zone, presenting a great trophic complexity (Schettini, 2002; Vivan et al., 2009). However, the port activities and the direct sewage discharge, solid waste disposal, and industrial effluents (Pereira-Filho et al., 2003; Poleza et al., 2014) may represent a threat to the ecosystem.
In the southernmost region of the country, samplings were carried out in three areas: two medium-sized shipyards and a reference area. All areas are located in the Patos Lagoon estuary in the vicinities of Rio Grande city (RG). GFF Shipyard (GFFS; 32◦01′48′′S, 52◦04′57′′W) in the Porto Velho area has over one century of operation. Whereas the S Shipyard (SS; 32◦08′44′′S, 52◦06′8′′W) is located in the Super Porto area and has more than 20 years of operation. The reference area at the Marinheiros Island (MI; 32◦00′52′′S, 52◦07′52′′W) was selected because there are no shipyards in the area. The Patos Lagoon (10,360 km2) is defined as the largest choked type coastal lagoon in the world and is notably affected by phenomena such as "El Nino" and "La Nina" (Kjerfve, 1994). It is characterized by complex hydrodynamic, which is mainly driven by a NE-SW winds regime and fluvial discharge (Moller et al., 1996; Marreto et al., 2017). The estuary intertidal areas receive anthropogenic effluents, including urban, industrial, and agricultural sewage (Odebrecht et al., 2010; Wallner-Kersanach et al., 2016). Also, the system exhibits a wide variety of flora and fauna, and its complex hydrodynamics provides, in the periods of greater seawater intrusion, an increase in the biodiversity of the aquatic communities (Seeliger, 2001; Rosa and Bemvenuti, 2005).
2.2. DGTs assembly
All materials used for sample treatment were previously washed (>24 h) with 10 % (v/v) nitric acid (HNO3; Merck) p.a. solution and
K. Umbría-Salinas et al.

Journal of Hazardous Materials 403 (2021) 123918
3
rinsed with ultrapure water (Milli-Q®, 18.2 MΩ cm). Suprapur® nitric acid (HNO3; Merck) was used for all analyses. All other reagents were of analytical grade (high purity).
The gels required for the Cu determination as well as the assembly of the DGT devices were prepared at the Hydrochemistry Laboratory of the Federal University of Rio Grande-FURG. The plastic holders of the DGT devices were obtained from DGT Research Ltd. (Lancaster, UK; https://www.dgtresearch.com/). The devices were assembled according to Zhang and Davison (1995). Over the base of the plastic holders were placed: (a) a binding gel which retains the analyte (0.5 mm thick); (b) a diffusive layer of polyacrylamide hydrogel (0.8 mm thick), responsible for the entrance only of free metal cations, inorganic complexes and some small organic metal complexes (<0.45 μm); and (c) a cellulose nitrate filter (0.45 μm porosity, 47 mm diameter; Sartorius, Germany) which allows only the metals dissolved fraction from the waterbody to pass into the sampler. The binding gel was prepared with acrylamide (99 %), cross-linker agarose (2 %), Milli-Q® water, TEMED (N, N, N ’, N’-tetramethylenediamine, 99 %), ammonium persulfate (10 %) and Chelex-100 resin in sodium form, according to Zhang and Davison (1995) and Odzak et al. (2002). The polyacrylamide hydrogel was prepared with acrylamide (99 %), cross-linker agarose (2 %), Milli-Q® water and TEMED (N, N, N ’, N’-tetramethylenediamine, 99 %).
2.3. Sample collection
The sample collections and DGT devices deployment were performed during two sampling periods in 2018: (S1) between February and March, corresponding to the dry season in RG and rainy season in RJ and SC;
and (S2) between July and September, which represent the rainy season in RG and dry season in the other sampling areas.
In every study area (TMS, PS, GFFS, SS, and MI), in the same periods, DGT devices were deployed in situ for a period of 48 h, for further quantification of the Cu labile fraction (Cu-DGT). Units were placed approximately at the middle depth of the water column (the mean depth of the sites ranged from 1.1 to 2.0 m), using a deployment system (developed in the Laboratory of Hydrochemistry of FURG). The latter consists of a polycarbonate plastic plate with a plastic net attached to a silk rope, weighted at the bottom end to avoid drift and buoyancy. At every sampling period, time (seconds) and temperature were precisely controlled (Datalogger, OnSet) during the DGT devices deployment. Besides, the water column parameters salinity and conductivity (WTW, Model 315i), pH (Toledo, Model DM) and turbidity (Digimed, DM-TU) were measured at the beginning and the end of each sampling. After the deployment periods (48 h), DGT devices were then removed from the water, placed individually in a ziplock® plastic bag, and transported refrigerated to the laboratory. In the first deployment period, 5 DGT devices (n = 25) were deployed in each studied area (one deployment system per shipyard). Whilst in the second deployment period, 9 DGT devices (n = 45) were used in each area (three deployment systems in three locations of each shipyard). For every deployment, two additional DGT devices were randomly selected in the field as analytical blanks, but not deployed in the water column. In addition to the DGT deployment, water samples were collected in plastic bottles (previously washed with acid solution), refrigerated and transported to the laboratory for further analysis of the Cu-Diss fraction.
Fig. 1. Study sites in estuarine areas in the southeastern and southern coast of Brazil: A) TM Shipyard (TMS) located at the Conceiçao Island in Guanabara Bay (RJ); B) P Shipyard (PS) in the margins of the Itajaí-Açu River (SC); C) GFF Shipyard (GFFS), S Shipyard (SS) and Reference Area (Marinheiros Island, MI) in Rio Grande city, located in the southern region of the Patos Lagoon estuary (RS). Satellite images were extracted from Google Earth® in July 2019.
K. Umbría-Salinas et al.

Journal of Hazardous Materials 403 (2021) 123918
4
2.4. Chemical analysis
2.4.1. Copper labile (Cu-DGT) At the laboratory, the DGT devices were opened and the binding gels
were eluted in 1 mL of Suprapur® HNO3 (Merck) according to Zhang and Davison (1995). Subsequently, those were stored under refrigera-tion (4 ◦C) for at least 24 h before analysis by Graphite Furnace Atomic Absorption Spectroscopy (GF-AAS; Shimadzu, model AA-7000).
The metal mass retained on the binding gel (M) was calculated as described by Zhang and Davison (1995; Eq. 1), considering the con-centration measured in the equipment (Ce), the volume of acid from the elution (VHNO3 ), the volume of the gel (Vgel), and the Cu elution factor (fe):
M =Ce (VHNO3 + Vgel)
fe(1)
The Cu-DGT concentration (Eq. 2) was calculated from M, total gels and filter thickness (Δg), Cu2+ diffusion coefficient retained in the diffusive gel (D), deployment time (t) and the window deployment area (A):
CuDGT =MΔgDtA
(2)
The thickness of the binding gel and the diffusive gel was confirmed using a digital microscope (1000x); and the Cu2+ diffusion coefficient was obtained from DGT Research Ltd. (www.dgtresearch.com), considering the average temperature registered in situ at every DGT deployment.
2.4.2. Total dissolved copper (Cu-Diss) Samples for the determination of Cu-Diss fraction were filtered with
cellulose nitrate filters (0.45 μm, 47 mm in diameter, Millipore®) pre-viously washed in acid solution, and then pre-concentrated through their passage in a Chelex-100 micro-column (Bowles et al., 2006). Cu-Diss analyses were conducted by Inductively Coupled Plasma Optical Emission Spectrometry (ICP-OES; Perkin-Elmer, model DV 2400).
For the analysis of both Cu fractions (DGT and Diss), the analytical control was performed using River Water Certified Reference Material (SLSR-6; National Research Council, Canada). The method accuracy for the Cu-Diss analysis had a variation below ±7%; while for Cu-DGT it was below ±15 %. The detection limits (DL) were determined by measuring a sample 10 times (3σ, with a significance level of 5%). The DL for Cu- DGT was 0.06 and 0.19 μg.L− 1 for S1 and S2 sampling periods, respec-tively; whereas, the DL for Cu-Diss was 0.40 μg.L− 1.
2.5. Toxicity data
Copper toxicity data for aquatic organisms were obtained consid-ering only natural species on the Brazilian coast, and tests performed under estuarine conditions. These variables were considered with the objective of obtaining data that represent several niches of the ecosys-tems that represent the estuarine environment of the southeast and southern region of Brazil. The toxicity data were collected after an exploratory examination, where a preliminary data review was carried out in the large Science Direct, Springer, Wiley, and PubMed databases.
Following, seven journals were chosen to develop data collection, since they have a greater number of published Cu toxicity data: Aquatic Toxicology, Archives of Environmental Contamination and Toxicology, Bulletin of Environmental Contamination and Toxicology, Chemosphere, Ecotoxicology and Environmental Safety, Environmental Toxicology and Chemistry, Science of the Total Environment. A total of 65 peer-reviewed publications (2000–2019) were considered, generating a database of 410 toxicity tests covering 51 species. This compiled ecotoxicological dataset (n = 410) consisted of 3.17 % determined the No Observed Effect Concentration (NOEC) and Lowest Observed Effect Concentration (LOEC); 27.10 % Effect Concentration (ECx); 66.10 % Lethal
Concentration (LCx); the remaining 3.63 % investigated the Inhibitory Concentration (IC), Threshold-Effect Concentration (TEC), Minimum Detectable Effect Concentrations (MDEC), and Half-Maximal Activity Concentration (AC50).
Before proceeding, all data extracted from peer-reviewed publica-tions were checked for reliability trough the SciRAP platform (Science in Risk Assessment and Policy; http://www.scirap.org/) (Moermond et al., 2016). For such evaluation, the parameters considered as most impor-tant, besides the chemical species tested (Cu) and the exposure condition (reflecting the estuarine conditions observed in this study), were the validity of the criterion/endpoint, the exposure time, and the descrip-tion of the test organism. Data with great uncertainties or lacking key information were discarded to ensure that only robust and accurate test results were used. At the end of the data analysis, only data that pre-sented a reliability ≥75 % were used for the PNEC derivation, resulting in 266 LCx data. When more than one test was conducted for the same species under the same condition, they were combined to generate a unique LCx value for each species (mean values were used). However, the same species tested in different life stages were considered as separate tests. The final dataset consisted of 18 toxicity tests (LC50), covering 16 species (Table S1, Supplementary Material).
2.6. Derivation of predicted no effect concentrations (PNEC): probabilistic approach using species sensitivity distributions (SSD)
PNEC was derived using the probabilistic approach, according to the Technical Guidance Document (TGD) on risk assessment of the Euro-pean Chemicals Bureau (ECB, 2003). The probabilistic method was used because the dataset was robust enough to enable the construction of a Species Sensitivity Distribution (SSD) curve, including more than 15 different species belonging to several ecological groups (ECB, 2003; EC, 2011; Martins et al., 2018). The SSD curve was generated using a cu-mulative graph of the toxicity values (LC50) algorithmically transformed against the assigned percentiles for every value at which a statistical distribution was adjusted (Wheeler et al., 2002). In detail, the "y-axis" positions in the plot of the SSD curve were determined based on the data classification (i) and the total number of data (n), according to the Eu-ropean Chemicals Bureau (Eq. 3; EC, 2011).
(i − 0.5)/n (3)
The ecotoxicity dataset was analyzed using a probability distribution of the ranked log-normal toxicity, thus the PNEC value was derived considering the hazard concentration to 5% of the species (5%SSD), a 50 % confidence interval (50%C.I.) and an appropriate AF (AF = 10) (Eq. 4; ECB, 2003).
PNEC =5%SSD × 50%C.I.
AF(4)
The Assessment Factors (AFs) are uncertainty factors based on the precaution principle, which considers that risk assessments may have multiple sources of uncertainty related to the huge variability of ecological communities that are intended to be protected (ECB, 2003). Their size depends on the robustness of the dataset (EC, 2011; Martins et al., 2018), in which the smaller the amount or reliability of the available data, the greater the AF applied (Finizio and Vighu, 2014). AF from 1 to 5 are recommended for PNEC derived from SSD (ECB, 2003). However, to account for extrapolating the results from acute to chronic conditions, an AF of 10 was selected in this study, in which different ecological groups were used from reliable studies.
2.7. Risk characterization
To assess the applicability and response of coupling the DGT tech-nique with toxicity data, Risk Quotients (RQ) were calculated for each study area, by dividing the Measured Environmental Concentration (MEC) for the Predicted No Effect Concentration (PNEC) (Eq. 5; ECB,
K. Umbría-Salinas et al.
Journal of Hazardous Materials 403 (2021) 123918
5
1996). Two RQ were calculated: RQ1, using Cu-DGT values as MEC; and RQ2 using Cu-Diss. For both calculations the PNEC value was the same.
RQ =MECPNEC
(5)
Risk was then categorized as low (RQ ≤ 0.1), moderate (0.1 < RQ <1.0) and high risk (RQ ≥ 1.0).
2.8. Statistical analysis
The normal distribution of the data was evaluated using the Shapiro- Wilk test with a significance level of 95 %. Significant differences be-tween periods and sampling sites were evaluated by t-test, with a con-fidence interval of 95 % (p < 0.05). For the PNEC derivation, the dataset was transformed with log (x+1). Data processing was performed with the R Core Team Software (2016).
3. Results
3.1. Chemical analysis
3.1.1. Physicochemical parameters of estuarine water The mean values of the different physicochemical parameters
(Table 1) showed variations between the sampling periods, except turbidity and salinity at TMS (Rio de Janeiro) and only turbidity at PS site (Santa Catarina). This behavior is consistent with the seasonality of each study site. Specifically, the temperature was higher in the S1 sampling period when compared to the S2 period for all study locations. The pH values showed small differences between both sampling periods for all sites, but with more variations at PS, as well as at GFFS and MI (Rio Grande) sites. In the PS site (Santa Catarina), salinity was higher during S2, while in contrast, such parameter at the study sites in Rio Grande (GFFS, SS and MI sites) was higher during S1, both sampling periods corresponding to the dry season of each area. The turbidity in the Patos Lagoon estuary (GFFS, SS and MI sites) showed higher values during S2.
3.1.2. Copper labile (Cu-DTG) and total dissolved copper (Cu-Diss) The Cu-DGT concentrations (Fig. 2A) in the water column showed
significant variations (p < 0.05) between sampling periods, in all the study locations, except for TMS. The Cu-DGT was higher during the S2 period when compared to S1 for PS (SC), as well as GFFS and MI (RG). The SS site showed a higher concentration in the S1 period, being also the highest Cu-DGT concentration found in the present work. Regard to the Cu-Diss fraction (Fig. 2B), significant variations (p < 0.05) between sampling periods was found at the GFFS site, where higher Cu-Diss concentration can be observed during the S2 period.
3.2. Species sensitivity distributions (SSD) curve and Predicted No Effect Concentrations (PNEC) derivation
The PNEC derivation was performed from LC50 values (acute toxicity data) instead of using the available data on chronic toxicity. This was because the chronic values that were gathered, even representing more than 3% (12) of the initial data (410), did not composed a dataset that meets the minimum requirements for PNEC derivation and the SSD curve construction; highlighting the coverage of the minimum required taxonomic groups. Consequently, the SSD curve was plotted based on the LC50 and covers 16 species (Fig. 3), included in the families Amphiuridae, Brachionidae, Cyprinidae, Cyrenidae, Daphniidae, Hya-lellidae, Poeciliidae, Potamidae, Ranidae, Salmonidae, Squalidae and Varunidae within the phyla Annelida, Arthropoda, Chordata and Roti-fera of the kingdom Animalia; and the families Araceae and Ceramiaceae of the phyla Rhodophyta and Tracheophyta of the kingdom Plantae (Table S1, Supplementary Material). These 16 species were framed in 8 ecological groups: (1) algae; (2) amphibia in larval phase; crustacean in larval (3) and juvenile (4) phase; (5) others invertebrates; (6) macro-phyte; (7) zooplankton (other than crustaceans); and (8) fish. Thus, the resultant PNEC was 0.16 μg.L− 1.
The SSD plot represents the fraction of species that would be potentially affected as a function of the dissolved Cu concentration in water. Meanwhile, the PNEC value indicates the total dissolved Cu concentration in which 95 % of the ecosystem community would be protected from acute effects. Moreover, the reported PNEC value ex-tends the protection of organisms from chronic effects, due to the use of an assessment factor (AF). The most sensitive species to total dissolved Cu was the crustacean Hyalella pseudoazteca (LC50 = 0.17 μg.L− 1), fol-lowed by the Ceramium tenuicorne macrophyte (Fig. 3). The least sensi-tive species were the decapod crustaceans Callinectes sapidus and Neohelice granulata in the juvenile stage. Comparably, organisms with moderate sensitivity (middle curve area) were mainly represented by fish and some invertebrates (including some species of crustaceans).
3.3. Risk characterization
Risk characterization and category, for each site (Table 2) were based on the coupling between the DGT technique (such as MEC value) and the PNEC value. The obtained values for RQ1 (labile fraction) allowed to categorize, for both periods, all sampling areas as “high risk areas” – including the reference site during S2 period. While, RQ2 values (total dissolved fraction) indicated a “very high risk” in all study areas.
4. Discussion
4.1. Copper content in shipyard areas: labile and total dissolved fractions
Salinity, pH and turbidity values (Table 1) measured in waters of the sites located in Rio Grande (GFFS, SS, and MI) are within the same range of values previously reported for the Patos Lagoon estuary, in different sampling periods (Costa and Wallner-Kersanach, 2013; Pereira et al., 2018). Similarly, the pH and temperature values at the TMS site were comparable with values reported in Aguiar et al. (2011) which indicated pH and temperature values of 7.30 and 26.9 ◦C, respectively. As for the rest of the areas, the PS site presented salinity values consistent with previous measurements reported by Pereira-Filho et al. (2010) (salinity
Table 1 Mean values of the physicochemical parameters in the water column during every sampling period S1 and S2 at the different sites.
Location Sample Collection
(SC)
Temperature (◦C)
pH Salinity Turbidity (NTU)
TM Shipyard (TMS),
Guanabara Bay
S1 27.3 7.3 30.1 11.9
S2 23.6 7.8 31.7 10.0
P Shipyard (PS). Itajaí-Açu
River
S1 24.8 6.2 0.1 20.1
S2 18.0 6.9 18.2 21.1
GFF Shipyard (GFFS). Patos
Lagoon Estuary
S1 26.4 8.3 31.7 29.0
S2 18.5 7.6 1.0 56.9
S Shipyard (SS). Patos Lagoon
Estuary
S1 26.2 8.4 32.0 33.1
S2 19.0 8.0 5.6 62.8
Marinheiros Island (MI).
Patos Lagoon Estuary
S1 26.8 8.5 27.0 5.2
S2 23.2 7.8 1.6 26.3
K. Umbría-Salinas et al.

Journal of Hazardous Materials 403 (2021) 123918
6
Fig. 2. (A) Cu-DGT (deployment 48 h) and (B) Cu-Diss concentrations (μg.L− 1) in S1 ( ) and S2 ( ) in: TM Shipyard (TMS), P Shipyard (PS), GFF Shipyard (GFFS), S Shipyard (SS) and reference area (Marinheiros Island, MI). Values are reported as mean ± SE. Samples from each data set (Cu-DGT e Cu-Diss) were compared by t- test (p < 0.05); the same letters indicate no significant differences, while the different letters indicate differences.
Fig. 3. Species Sensitivity Distribution (SSD) curve of dissolved copper for different species inhabiting the Brazilian coastal ecosystem. The toxicity data include only acute values (LC50), and they are reported using the log-normal distribution of toxicity data.
Table 2 Calculated Risk Quotients (RQ) during each sampling period S1 and S2 of the different sites. RQ were calculated using the derived Predicted No-Effect Concentration (PNEC) value, with Cu-DGT (RQ1) and Cu-Diss (RQ2) fractions as Measured Environmental Concentration (MEC) values.
Location Sample Collection (SC) Risk characterization (MEC = Cu-DGT) Risk characterization (MEC = Cu-Diss)
RQ1 Risk category RQ2 Risk category
TM Shipyard (TMS), Guanabara Bay S1 4.1 >1 High 8.6 >>1 High! S2 4.7 >1 High 7.7 >>1 High!
P Shipyard (PS), Itajaí-Açu River S1 1.5 >1 High 9.6 >>1 High! S2 3.1 >1 High 13.7 >>1 High!
GFF Shipyard (GFFS), Patos Lagoon Estuary S1 0.9 <1 Moderate 10.5 >>1 High! S2 2.0 >1 High 52.3 >>1 High!
S Shipyard (SS), Patos Lagoon Estuary S1 11.1 >>1 High! 11.8 >>1 High! S2 5.7 >>1 High! 15.8 >>1 High!
Marinheiros Island (MI), Patos Lagoon Estuary S1 0.3 <1 Moderate 10.1 >>1 High! S2 1.9 >1 High 7.7 >>1 High!
K. Umbría-Salinas et al.

Journal of Hazardous Materials 403 (2021) 123918
7
= 16) and Oliveira et al. (2010) (salinity from 11 to 22). However, it is important to highlight that the Itajaí-Açu River basin was affected by heavy rainfall during the week before the first sampling period (S1), that generated a decrease of the dissolved salt content in water during the sampling, because of the increase of the freshwater flow. This explains the salinity value of 0.1 corresponding in the sampling period.
Regarding the Cu-DGT concentrations determined in this study (Fig. 2A), the following descending order of concentrations was found for the study areas in both periods: SS > TMS > PS > GFF > MI. For the TMS site, the Cu-DGT concentrations did not show significant differ-ences (p > 0.05) between sampling periods (Fig. 2A), which reflects the low variability in the water physicochemical parameters in the area (Table 1). This is caused by the restricted circulation of water in this system since the study site is morphologically protected (Fig. 1), which reduces the water renewal. In contrast, the significant differences (p <0.05) observed in all other study sites reflect the great variations in the physicochemical conditions, with special attention to salinity and pH. Thus, higher concentrations of Cu-DGT were observed in the water of the Patos Lagoon estuary during S2 period, when water salinity is lower. Salinity had already been reported as one of the major factors respon-sible for the availability of labile Cu in waters of the Patos Lagoon es-tuary (Costa and Wallner-Kersanach, 2013).
The only exception was the SS site, in which the highest Cu-DGT values was reported during the S1 period, highlighting that this value was very significantly different (p < 0.01) and much higher than the average values of the other sites in RG. During the deployment time in the S1 period at SS site and S2 period at PS site (higher salinity values and lower precipitation), a great vessels maintenance activity was observed. The SS site has been reported as one of the most active shipyards at the Patos Lagoon estuary (Costa et al., 2016; Soroldoni et al., 2018). Therefore, the Cu input in these shipyards may be high enough to pre-dominate over the effects of the physicochemical parameters on the Cu labile fraction mobility, resulting in the high concentrations of Cu-DGT obtained in these sites, in such periods (Fig. 2.A).
Singh and Turner (2009) have reported, from laboratory experiments with simulated environmental conditions that antifouling paints tend to leach larger quantities of Cu ions to the surrounding water at higher environmental salinities. This is attributed to dissolution processes of copper (I) oxide (Cu2O) from antifouling paints, in the presence of chlo-ride ion (Cl− ) and seawater cations (Singh and Turner, 2009). However, the final products of these processes generate compounds that are not completely stable (CuCl2- and CuCl3-2), so the associated Cu with them can be dissociated (Singh and Turner, 2009). Consequently, generating an increase in the proportion of labile Cu (copper-free ions and weak inor-ganic complexes). This is consistent with the findings at TMS and PS sites, but unlike them, the site SS in RG have the highest Cu-DGT concentrations during the S2 period, when salinity values were lower than 5. This could be associated, as already mentioned, to the predominant control that the pH exerts on the availability of labile Cu at the Patos Lagoon estuary, asso-ciated in turn with the greater complexity of this system.
Besides, when comparing Cu labile concentrations obtained in this study with those reported in other works, it is observed that the results are consistent with values reported for marinas and different shipyards areas at the Patos Lagoon estuary (Wallner-Kersanach et al., 2009; Costa and Wallner-Kersanach, 2013). They are also consistent with leisure areas with constant vessels traffic in Sweden (Egardt et al., 2018). However, with exception of the SS site during S1, Cu labile concentra-tions in the studied area were lower than values reported in ports and marinas in Spain (Montero et al., 2013) and France (Caro et al., 2015).
The concentration of Cu-Diss was similar in all sampling sites and periods, except for the GFFS site, which presented a significant differ-ence (p < 0.05) during the S2 period. This high Cu-Diss value may be related to the high turbidity values (56.9 NTU) observed for this site during this period (S2). In this estuary, high freshwater discharges and changes in wind patterns provide a decrease in dissolved salts and favor sediment resuspension processes (Wallner-Kersanach et al., 2009). This
could remobilize metals from sediment to the overlying water column (Seitzinger et al., 2010) and thus, increase the total dissolved copper content. Additionally, previous studies have reported important Cu content in the sediment of this site (Costa et al., 2016; Valero et al., 2020) recently showed that there is a diffuse flow of labile Cu from the sediment to the water column, and this turns out to be greater during S1 for the site GFFS and S2 for MI. When comparing these values with the results obtained, this process is consistent with the highest concentra-tions of Cu-DGT obtained in the water column of the MI site but not for GFFS. This may also be related to the turbidity values of the GFFS, since there is a higher content of suspended material, which is able to immobilize part of the labile Cu present in the water column. This process does not seem to occur at the MI site.
Although turbidity values at SS site (62.8 NTU) were similar to GFFS during the S2 period, the SS site is closer to the narrow part and entrance of the channel of the Patos Lagoon estuary. This shipyard area has a higher hydrodynamics, a deeper water column, and coarser sediment in the surroundings, which decreases the resuspension process of particu-late material. Meanwhile, the GFFS site has a shallower water column, which provides greater sediment resuspension. Indeed, when high sus-pended particulate matter content (SPM) is found, a decrease in the Cu- DGT is observed (Costa and Wallner-Kersanach, 2013). This is concor-dant with the low Cu-DGT concentrations determined at this location compared to its dissolved fraction (Fig. 2).
Except for GFFS in the S2 period, Cu-Diss values obtained in this study were up to twice as lower than values reported for the Venezia Lagoon estuary, a site with high discharge of domestic and industrial sewage (Morabito et al., 2018). The same was observed when compared with the results described for marinas on the coast of California (Schiff et al., 2007), as well on various locations on the northern coast of Australia (Munksgaard and Parry, 2001). On the other hand, the Cu-Diss concentration was higher than that reported for Sydney Harbor in Australia (Hatje et al., 2003), a highly urbanized area that includes harbors, marinas, paint industries, and continuous vessel traffic.
When comparing Cu-DGT and Cu-Diss concentrations in every sampling period, it is noted that the dissolved fraction exceeds the labile fraction (between 2 and 32 times more), which is to be expected since the labile fraction is part of the total dissolved fraction. Nevertheless, the Cu-DGT fraction represents a higher proportion of Cu-Diss (between 22–62 %) during low salinity period, except at the GFFS site where it only represented 2%. Meanwhile, the opposite is observed during high salinity period (3–48 %), except at SS site, where Cu-DGT represents 93 % of Cu-Diss fraction.
4.2. Hazard assessment
The probabilistic derivation of PNEC is an increasingly important tool in Ecological Risk Assessments since it allows high statistical reli-ability in risk assessment procedures (Wheeler et al., 2002; Fan et al., 2019; Yan et al., 2019). In addition, the toxicity tests results gathered from the literature were highly reliable (≥75 %), and the number of species (preferably more than 15) and taxonomic groups (at least 8 taxonomic groups) met the minimum criteria to derive PNEC based on SSD curves (ECB, 2003). Moreover, the database used encompasses only species that occur naturally in Brazilian coastal areas. Thus, resulting PNEC (0.16 μg.L− 1) can be considered robust enough for Brazilian estuarine ecosystems.
Specifically, the finding that H. pseudoazteca represents the most sensitive species to Cu in water has important implications, since this amphipod can represent an essential part of the ecosystem food web, because of its role as food in the lower trophic levels (Casset et al., 2001). The macrophyte C. tenuicorne also showed to be highly sensitive to compounds released in shipyard and port areas, and therefore is widely affected in systems of this type. This species is also ecologically impor-tant and widely distributed throughout the world (Eklund, 2017).
In this study, the toxicity dataset used include different salinity
K. Umbría-Salinas et al.

Journal of Hazardous Materials 403 (2021) 123918
8
values, highlighting that the species that were most sensitive to the ef-fect of Cu were tested under low salinity conditions. Despite this, to date, reliable toxicity tests performed at low salinities (using dissolved seawater) are scarce. These tests could improve the understanding of the toxicity of Cu in low salinity estuaries, which are adapted to the worst scenario of Cu toxicity. Accordingly, the ecotoxicological dataset used in this work was based on results of toxicity tests performed within a wide range of salinity (5–38) to better reflect estuarine conditions. Further-more, it is advisable to use a set of chronic toxicity data in the PNEC derivation, because they offer greater robustness and allow more precise statistical extrapolations. Likewise, chronic data results in more repre-sentative values of natural systems, where the water body is continu-ously receiving low concentrations of pollutants (Finizio and Vighu, 2014). However, due to the restrictions of the dataset considered in this work (natural organism of the Brazilian coast), these were insufficient to generate a robust chronic dataset. In spite of that, the use of acute data for such derivation is equally valid, mainly associated to the scarcity of chronic data (Wheeler et al., 2002; Finizio and Vighu, 2014; Martins et al., 2018). In this sense, Huang et al. (2018) concluded that when PNEC derivation comes from acute data, it should be based only on the most sensitive endpoints of each species. In this sense, Martins et al. (2018) indicate that because the probabilistic approach is more comprehensive, the degree of uncertainty of the generated data is reduced, producing a more realistic result when a low AF value is used.
It is important to mention that site-specific probabilistic PNECs, such as the one considered in the present study, usually depend on the use of non-standard species in the scope of international guidelines for toxicity tests, in order to generate a complete and robust dataset. The suitability in using non-standard species was verified based on the reliability of the toxicity tests performed, thus, only tests whose reliability was ≥75 % were used. Another advantage of using site-specific PNECs, which embrace a more comprehensive dataset of naturally occurring species, is that they allow a more accurate hazard assessment and adjusted to the characteristic of a specific system. Hence, the PNEC derived in this study, by covering species that occur naturally in the Brazilian coast could be successfully extrapolated to areas other than those affected only by vessel maintenance.
The PNEC derivation depends on individual decisions, as discussed by Hahn et al. (2014), which attributed the choice of methodology used, especially key study selection, acute versus chronic definitions, and the size of assessment factors, as parameters that influence the final result. In this sense, some studies had derived a PNEC for copper using the probabilistic approach, resulting in different values. For instance, Park et al. (2019) has estimated a more permissible PNEC of 0.80 μg.L− 1 for river resident organisms located in Korea. However, the authors used a slightly different model to estimate PNEC, adjusted all data to the total fraction of Cu, used only data for freshwater organisms and used a lower AF (5). On the other hand, Li et al. (2019) found a PNEC value of 0.17 μg. L− 1, using chronic toxicity data and an AF of 5. This value is very similar to that found in our study (0.16 μg.L− 1), enhancing reliability in extrapolating from acute to chronic using an AF size of 10.
Physicochemical conditions strongly affect the toxicity of trace metals and therefore they should be taken into account when gathering toxicity datasets to derive PNEC. Ideally, site-specific hazard assess-ments should be conducted, as different waterbodies present particular abiotic and biotic characteristics, and the biological community might be adapted to different environmental pressures, including exposure to contaminants. In addition, accounting for a wide range of species within different taxonomic and ecological groups is also important when it is desired to have a comprehensive characterization of the ecosystem under study, reducing bias and uncertainties.
4.3. Risk characterization
Once the value of the PNEC (toxicity data) has been determined and integrating this with Cu-DGT - or Cu-Diss - concentrations (exposure
data), it is possible to demonstrate the successful coupling between the DGT technique with toxicity data, thus arising a potentially more precise tool for Ecological Risk Assessments (ERA). The RQs calculated with different MEC values, allowed to visualize the overestimation that may exist when a system is ecologically evaluated using the total dissolved fraction. In many cases, such overestimation is positive in relation to frames within the established legislation. However, more precise mea-surement (labile fraction) could facilitate the application and compli-ance with laws, as the labile fraction represents a lower environmental value, when compared to the total dissolved fraction. As expected, the values obtained from RQ2 (Table 2) allowed us to observe more alarming values when compared to RQ1. Taking into account that RQ1 is based on the bioavailable Cu species, it represents a more realistic risk characterization.
According to the Cu-DGT values, the RQ1 showed the highest risks at the TMS and SS sites, where a greater contribution of labile Cu from a larger number of vessels under maintenance was observed during the deployment time. Therefore, it is possible to affirm that concentrations of labile Cu in Brazilian coastal areas with the presence of hotspots (e.g. shipyards) effectively represent an alarming risk to the aquatic com-munity established in that system.
This study was carried out using measured concentrations of single sampling campaigns and not considering time series (continuous monitoring). Despite this, the DGT passive sampler, capable of inte-grating measurements over time, provides reliable results capable of identifying areas that require the application of ERA.
Finally, it is important to mention that overall, the derivation of Water Quality Criteria (WQC) worldwide is based on the total or dis-solved total concentration. This means that it is not taken into account important factors such as speciation and bioavailability, and the effects they can generate on the biological community of each ecosystem. When some Cu WQC are compared, different values are found. For example, 2.6 μg.L− 1 for Europe (ECB, 2008), 3.8 μg.L− 1 for England and Wales (DEFRA, 2014), 4.8 μg.L− 1 for USA (US EPA, 2009) and 7.8 μg.L− 1 for Brazil (CONAMA, N. 357, 2005; study case). That shows that Brazil has a more permissible legislation comparing to other nations and over-estimate the support capability of estuarine ecosystems for copper, as a PNEC of 0.16 μg.L− 1 was derived for the Brazilian coast. As a conse-quence, this overestimation could lead to problems in decision-making and execution of environmental management programs, highlighting environments with metals hotspot presence or/and high complexity such as estuarine systems. The above also highlights the need for site-specific environmental assessments to safeguard and manage different ecosystems.
As this study assessed the ecological risk of copper to estuarine areas impacted by shipping maintenance activities, it was observed that the Cu labile fraction alone represents a moderate to high ecological risk. Thus, the need to generate new tools for environmental monitoring is necessary, leading to deriving a new WQC and supporting future man-agement actions.
5. Conclusion and recommendations
In this study, it was possible to perform compressive Ecological Risk Assessments (ERA) of Cu for estuarine environments of the southeastern and southern coast of Brazil, by coupling the Diffusive Gradients in Thin films (DGT) technique (Cu-DGT), the total dissolved Cu content (Cu- Diss) in water, and the derivation of a site-specific PNEC considering aquatic species occurring in Brazilian coasts. The Cu-DGT and Cu-Diss concentrations, determined in the water column of the shipyard areas (hotspots), showed a direct relationship between the contribution of Cu with the application of antifouling paints and the maintenance of ves-sels. Likewise, it was observed that in areas where these activities were intense, the labile Cu concentration represented up to 93 % of the total dissolved fraction, which increases the risk for the local aquatic com-munity. This was confirmed since the Cu-DGT and Cu-Diss
K. Umbría-Salinas et al.

Journal of Hazardous Materials 403 (2021) 123918
9
concentrations exceeded the PNEC value, resulting in Risk Quotients (RQ) that represent moderate to high risk. These concentrations were similar or lower than those reported for the aquatic compartment of other contaminated estuarine areas.
It is concluded that the use of the DGT technique -as MEC value- pro-vided a more accurate Risk Assessment and should be considered for implementation in future legislation. Nevertheless, this research would be considered as a first approach to establish a more robust alternative to classic ERAs. Thus, further refinements will be necessary yet. For example, the lack of more toxicological test using native species to a specific area can lead to difficulties to derivate a site-specific PNEC. However, the authors are confident that in near future environmental agencies and research institutes can affront this complexity and easily apply the proposed alternative. This can be addressed by tools such as incorporating ERAs in regulation frameworks, with specific criteria for each country according to their needs. This could naturally lead to wise choices in species to be taken into account for the derivation of PNECs. Therefore, it is proposed that the derived PNEC and the implemented approach in this work used in the Ecological Risk Assessment can be extrapolated along the Brazilian coast, and in other natural environments in the world.
Finally, considering that in addition to Cu, antifouling paints can release other metals such as Cr, Ni, and Zn (Costa et al., 2016; Soroldoni et al., 2018), it is important to perform ERAs of these elements in areas with similar characteristics, considering the use of the DGT technique that determine the labile fraction of these elements simultaneously.
CRediT authorship contribution statement
Karelys Umbría-Salinas: Conceptualization, Formal analysis, Investigation, Writing - original draft, Visualization. Astolfo Valero: Formal analysis, Investigation, Writing - original draft. Samantha Eslava Martins: Conceptualization, Methodology, Writing - review & editing, Validation, Supervision. Monica Wallner-Kersanach: Conceptualization, Methodology, Resources, Writing - review & editing, Validation, Supervision, Project administration, Funding acquisition.
Declaration of Competing Interest
The authors report no declarations of interest.
Acknowledgments
The authors thank the National Council for Scientific and Techno-logical Development (CNPq; project no. 45501/2014-5 APQ) for the financial support, and Coordination of Personnel of Superior Level Improvement (CAPES) for the research grants of Karelys Umbría-Salinas and Astolfo Valero. The authors also acknowledge the support of the Post-Graduate Program in Oceanology from CAPES, as well as the anonymous reviewers for their constructive comments.
Appendix A. Supplementary data
Supplementary material related to this article can be found, in the online version, at doi:https://doi.org/10.1016/j.jhazmat.2020.123918.
References
Aguiar, V.M.C., Neto, J.A.B., Rangel, C.M., 2011. Eutrophication and hypoxia in four streams discharging in Guanabara Bay, RJ, Brazil, a case study. Mar. Pollut. Bull. 62, 1915–1919. https://doi.org/10.1016/j.marpolbul.2011.04.035.
Amador, E.S., 1997. Baia de Guanabara e ecossistemas perifericos – Homem e Natureza. Reproarte Grafica e Editora, Rio de Janeiro, p. 529.
Amato, E., Marasinghe, W., Taylor, A., Maher, W., Simpson, S., Jolley, D., 2018. Field and laboratory evaluation of DTG for predicting metal bioaccumulation and toxicity in the freshwater bivalve Hyridella australisexposed to contaminated sediments. Environ. Pollut. 243 (B), 862–871. https://doi.org/10.1016/j.envpol.2018.09.004.
Borges, A.C., Sanders, C.J., Santos, H.L.R., Araripe, D.R., Machado, W., Patchineelam, S. R., 2009. Eutrophication history of Guanabara Bay (SE Brazil) recorded by
phosphorous flux to sediments from a degraded mangrove area. Mar. Pollut. Bull. 58 (11), 1750–1754. https://doi.org/10.1016/j.marpolbul.2009.07.025.
Bowles, K.C., Apte, S.C., Batley, G.E., Hales, L.T., Rogers, N.J., 2006. A rapid Chelex column method for the determination of metal speciation in natural waters. Anal. Chim. Acta 237–245. https://doi.org/10.1016/j.aca.2005.10.071.
Braz-Mota, S., Campos, D.F., MacCormack, T.J., Duarte, R.M., Val, A.L., Almeida-Val, V. M.F., 2018. Mechanism of toxic action copper and copper nanoparticles in two Amazon fish species: dwarf cichlid (Apistogrammna agassizii) and cardinal tetra (Paracheirodon axelrodi). Sci. Total Environ. 630, 1168–1180. https://doi.org/ 10.1016/j.scitotenv.2018.02.216.
Caro, A., Chereau, G., Briant, N., Roques, C., Freydier, R., Delpoux, S., et al., 2015. Contrasted responses of Ruditapes decussatus (filter and deposit feeding) and Loripes lacteus (symbiotic) exposed to polymetallic contamination (Port-Camargue, France). Sci. Total Environ. 505, 526–534. https://doi.org/10.1016/j.scitotenv.2014.10.001.
Casset, M.A., Momo, F.R., Giorgi, A.D.N., 2001. Dinamica poblacional de dos especies de anfípodos y su relacion con la vegetacion acuatica en un microambiente de la cuenca del rio Lujan (Argentina). Ecologia Austral 11, 31–37. Casset et al., 2001.
Cheng, L., Ge, S., Zhifeng, W., Honglin, Z., Rongping, W., Xiaonan, L., Zhixing, G., Jiong, C., 2019. Soil physicochemical properties and landscape patterns control trace metal contamination at the urban-rural interface in southern China. Environ. Pollut. 250, 537–545. https://doi.org/10.1016/j.envpol.2019.04.065.
Choi, K., Kim, S., Hong, G., Chon, H., 2012. Distributions of heavy metals in the sediments of South Korean harbors. Environ. Geochem. Health 34, 71–82. https:// doi.org/10.1007/s10653-011-9413-3.
Choi, J., Hong, G., Ra, K., Kim, K.-T., Kim, K., 2014. Magnetic characteristics of sediment grains concurrently contaminated with TBT and metals near a shipyard in Busan, Korea. Marine Pollut. Bull. 85 (2), 679–685. https://doi.org/10.1016/j. marpolbul.2014.03.029.
CONAMA, 2005. Conselho Nacional Do Meio Ambiente. Resoluçao n◦ 357. 17 de março de 2005. DOU n◦ 053 de 18 de março de 2005.
Costa, L.D.F., Wallner-Kersanach, M., 2013. Assessment of the labile fractions of copper and zinc in marinas and port areas in Southern Brazil. Environ. Monit. Assess. 185 (8), 6767–6781. https://doi.org/10.1007/s10661-013-3063-0.
Costa, L., Mirlean, N., Wasserman, J., Wallner-Kersanach, M., 2016. Variability of labile metals in estuarine sediments in areas under the influence of antifouling paints, southern Brazil. Environ. Earth Sci. Res. J. 75.
Dar, M., Green, I., Khan, F., 2019. Trace metal contamination: transfer and fate in food chains of terrestrial invertebrates. Food Webs 20, e00116. https://doi.org/10.1016/ j.fooweb.2019.e00116.
Davison, W., Zhang, H., 2012. Progress in understanding the use of diffusive gradients in thin films (DGT) – back to basics. Environ. Chem. 9, 1–13. https://doi.org/10.1071/ EN11084.
De Boeck, G., Van Der Ven, K., Hattink, J., Blust, R., 2006. Swimming performance and energy metabolism of rainbow trout, common carp and gibel carp respond differently to sublethal copper exposure. Aquat. Toxicol. 80 (1), 92–100. https://doi. org/10.1016/j.aquatox.2006.07.017.
DEFRA, 2014. Water Framework Directive Implementation in England and Wales: New and Updated Standards to Protect the Water Environment. Llywodraeth Cymru Welsh Government, England and Wales. May 2014.
Egardt, J., Mørk, M.L., Lassenc, P., Dahllof, I., 2018. Release of PAHs and heavy metals in coastal environments linked to leisure Boats. Mar. Pollut. Bull. 127, 664–671. https://doi.org/10.1016/j.marpolbul.2017.12.060.
Eisler, R., 2010. Crustaceans. In: Eisler, R. (Ed.), Compendium of Trace Metals and Marine Biota. Elsevier, pp. 399–516. https://doi.org/10.1016/B978-0-444-53439- 2.00007-2.
Eklund, R., 2017. Review of the use of Ceramium tenuicorne growth inhibitions test for testing toxicity of substances, effluents, products sediment and soil. Estuar. Coast. Shelf Sci. 195, 88–97. https://doi.org/10.1016/j.ecss.2016.10.009.
European Chemical Bureau, 1996. Technical Guidance Document in Support of the Commission Directive 93/667/EEC on Risk Assessment for New Notified Substances and the Commission Regulation (EC) 1488/94 on Risk Substances. European Chemical Bureau, Ispra, Italy, 19th April 1996, parts 1, 2, and 3.
European Chemicals Bureau, 2008. Copper, copper II sulphate pentahydrate, copper(I) oxide, copper(II)oxide, dicopper chloride trihydroxide. Marine effects assessment. European Union Risk Assessment Report. European Copper Institute, Brussels.
European Commission Bureau, 2003. Technical Guidance Document on Risk Assessment, Part II. European Commission – Joint Research Centre. European Chemical Bureau, p. 328.
European Communities, 2011. European Commission. Common Implementation Strategy for the Water Framework Directive (2000/60/EC) Guidance Document No. 27. Technical Guidance for Deriving Environmental Quality Standards. European Communities, p. 203.
Fan, B., Wang, X., Li, J., Gao, X., Li, W., Huang, Y., Liu, Z., 2019. Deriving aquatic life criteria for galaxolide (HHCB) and ecological risk assessment. Sci. Total Environ. 681, 488–496. https://doi.org/10.1016/j.scitotenv.2019.05.033.
Finizio, A., Vighu, M., 2014. Predicted No effect concentration (PNEC). In: Wexler, P. (Ed.), Encyclopedia of Toxicology, third edition. Academic Press, pp. 1061–1065. https://doi.org/10.1016/B978-0-12-386454-3.00572-8.
Frena, M., Bataglion, G.A., Tonietto, A.E., Eberlin, M.N., Alexandre, M.R., Madureira, L. A.S., 2016. Assessment of anthropogenic contamination with sterol markers in surface sediments of a tropical estuary (Itajaí-Açu, Brazil). Sci. Total Environ. 544, 432–438. https://doi.org/10.1016/j.scitotenv.2015.11.137.
Hatje, V., Apte, S.C., Hales, L.T., Birch, G.F., 2003. Dissolved trace metals distributions in Port Jackson estuary (Sydney Harbour), Australia. Mar. Pollut. Bull. 46, 719–730. https://doi.org/10.1016/S0025-326X(03)00061-4.
K. Umbría-Salinas et al.

Journal of Hazardous Materials 403 (2021) 123918
10
Huang, Q., Bu, Q., Zhong, W., Shi, K., Cao, Z., Yu, G., 2018. Derivation of aquatic predicted no-effect concentration (PNEC) for ibuprofen and sulfamethoxazole based on various toxicity endpoints and the associated risks. Chemosphere 193, 223–229. https://doi.org/10.1016/j.chemosphere.2017.11.029.
Jin, X., Wang, Y., Jin, W., Rao, K., Giesy, J., Hollert, H., Richardson, K., Wang, Z., 2014. Ecological risk of nonylphenol in China surface waters based on reproductive fitness. Environ. Sci. Technol. 48 (2), 1256–1262. https://doi.org/10.1021/es403781z.
Kjerfve, B., 1994. Chapter 1: coastal lagoons. In: Kjerfve, B. (Ed.), Coastal LaGoon Processes. 1-8. Elsevier Science B. V. Google Scholar, Netherlands.
Kjerfve, B., Lacerda, L.D., Dias, G.T.M., 2001. Chapter 8: baía de guanabara, Rio de Janeiro, Brazil. In: Seeliger, U., Kjerfve, B. (Eds.), Coastal Marine Ecosystems of Latin America. Springer-Verlag Berlin Heidelberg GmbH, United States, pp. 107–117.
Li, X., Chi, W., Tian, H., Zhang, Y., Zhu, Z., 2019. Probabilistic ecological risk assessment of heavy metals in wetern Laizhou Bay, Shandong Province, China. PLoS One 14 (3), e0213011. https://doi.org/10.1371/journal.pone.0213011.
Liu, J.-J., Diao, Z.-H., Xu, X.-R., Xiao, Q., 2019. Effects of dissolved oxygen, salinity, nitrogen and phosphorus on the release of heavy metals from coastal sediments. Sci. Total Environ. 666, 894–901. https://doi.org/10.1016/j.scitotenv.2019.02.288.
Machado, A.A.S., Spencer, K., Kloas, W., Toffolon, M., Zarfl, C., 2016. Metal fate and effects in estuaries: a review and conceptual model for better understanding of toxicity. Sci. Total Environ. 541, 268–281. https://doi.org/10.1016/j. scitotenv.2015.09.045.
Marreto, R.N., Baumgarten, M.G.Z., Wallner-Kersanach, M., 2017. Trophic quality of Waters in the Patos Lagoon estuary: a comparison between its margins and the port channel located in Rio Grande, RS, Brazil. Acta Limnol. Bras. 29, e11. https://doi. org/10.1590/S2179-975X10716.
Martins, R.R.M., Monteiro-Neto, C., 2018. Economics trends of industrial double-rig bottom trawlers in Southern Brazil. Mar. Policy 90, 125–136. https://doi.org/ 10.1016/j.marpol.2017.12.026.
Martins, S.E., Fillmann, G., Lillicrap, A., Thomas, K.V., 2018. Review: ecotoxicity of organic and organo-metallic antifouling co-biocides and implications for environmental hazard and risk assessments in aquatic ecosystems. Biofouling 34, 34–52. https://doi.org/10.1080/08927014.2017.1404036.
Moermond, C.T.A., Kase, R., Korkaric, M., Ågerstrand, M., 2016. CRED: Criteria for reporting and evaluating ecotoxicity data. Environ. Toxicol. Chem. 35 (5), 1297–1309. https://doi.org/10.1002/etc.3259.
Moller, O.O., Lorenzzentti, J.A., Stech, J.L., Mauricio, M.M., 1996. The Patos Lagoon summertime circulation and dynamics. Cont. Shelf Res. 16 (3), 335–351. https://doi. org/10.1016/0278-4343(95)00014-R.
Montero, N., Belzunce-Segarra, M.J., Del Campo, A., Garmendia, J.M., Ferrer, L., Larreta, J., et al., 2013. Integrative environmental assessment of the impact of Pasaia harbour activities on the Oiartzun estuary (southeastern Bay of Biscay). J. Mar. Syst. 109-110, S252–S260. https://doi.org/10.1016/j.jmarsys.2011.06.002.
Morabito, E., Radaelli, M., Corami, F., Turetta, C., Toscano, G., Capodaglio, G., 2018. Temporal evolution of cadmium, copper and lead concentration in the Venice Lagoon water in relation with the speciation and dissolved/ particulate partition. Mar. Pollut. Bull. 129, 884–892. https://doi.org/10.1016/j.marpolbul.2017.10.043.
Munksgaard, N.C., Parry, D.L., 2001. Trace metals, arsenic and lead isotopes in dissolved and particulate phases of North Australian coastal and estuarine seawater. Mar. Chem. 75, 165–184. https://doi.org/10.1016/S0304-4203(01)00033-0.
Nour, H.E., El-Sorogy, A.S., El-Wahab, M.A., Nouh, E.S., Mohamaden, M., Al-Kahtary, K., 2019. Contamination and ecological risk assessment of heavy metals pollution from the Shalateen coastal sediments, Red Sea, Egypt. Mar. Pollut. Bull. 144, 167–172. https://doi.org/10.1016/j.marpolbul.2019.04.056.
Odebrecht, C., Abreu, P.C., Bemvenuti, C.E., Copertino, M., Muelbert, J.H., Vieira, J.P., Seeliger, U., 2010. Chapter 17: the Patos lagoon estuary, Southern Brazil - biotic responses to natural and anthropogenic impacts in the last decades (1979–2008). In: Kennish, M.J., Paerl, H.W. (Eds.), Coastal Lagoons: Critical Habits of Environmental Change. CRC Press, Boca Raton, FL, U.S.A, p. 555. ISBN: 978-1420088311.
Odzak, N., Kistler, D., Xue, H., Sigg, L., 2002. In situ metal speciation in a eutrophic lake using the technique of diffusion gradients in thin films (DGT). Aquatic Sci. 64, 292–299. https://doi.org/10.1007/s00027-002-8073-x.
Oliveira, C.R., Santos, D.M., Madureira, L.A.S., Marchi, M.R.R., 2010. Speciation of butyltin derivates in surface sediments of three southern Brazilian harbors. J. Hazard. Mater. 181, 851–856. https://doi.org/10.1016/j.jhazmat.2010.05.091.
Paller, M., Harmon, S., Knox, A., Kuhne, W., Halverson, N., 2019. Assessing effects of dissolved organic carbon and water hardness on metal toxicity to Ceriodaphnia dubia using diffusive gradients in thin films (DGT). Sci. Total Environ. 697, 134107 https://doi.org/10.1016/j.scitotenv.2019.134107.
Paradas, W., Amado Filho, G.M., 2007. Are metals of antifouling paints transferred to marine biota? Braz. J. Oceanogr. 55, 51–56. https://doi.org/10.1590/S1679- 87592007000100006.
Park, J., Lee, S., Lee, E., Noh, H., Seo, Y., Lim, H., et al., 2019. Probabilistic ecological risk assessment of heavy metals using the sensitivity of resident organisms in four Korean rivers. Ecotoxicol. Environ. Saf. 183, 109483 https://doi.org/10.1016/j. ecoenv.2019.109483.
Pereira, T.L., Wallner-Kersanach, M., Costa, L.D.F., Costa, D.P., Baisch, P., 2018. Nickel, vanadium and lead as indicators of sediment contamination of marina, refinery and shipyard areas. Environ. Sci. Pollut. Res. - Int. 25 (2), 1719–1730. https://doi.org/ 10.1007/s11356-017-0503-3.
Pereira-Filho, J., Spillere, L.C., Schettini, C.A.F., 2003. Dinamica de nutrientes na regiao portuaria do estuario do Rio Itajaí-Açu, SC. Atlntica 25 (1), 11–20. Pereira-Filho et al., 2003.
Pereira-Filho, J., Rodric, L.R., Schettini, C.A.F., Soppa, M.A., Santana, B.L., Santos, J.E., 2010. Spatial changes in the water quality of Itajaí-Açu Fluvial-Estuarine System, Santa Catarina, Brazil. Anais da Academia Brasileira de Ciencias. 82 (4), 963–982. https://doi.org/10.1590/S0001-37652010000400019.
Poleza, F., Souza, R.C., Resgalla, C.Jr., 2014. Identification of the toxic constituents of sediments in a Brazilian subtropical estuary. Mar. Pollut. Bull. 80, 71–79. https://doi. org/10.1016/j.marpolbul.2014.01.046.
Rai, P., Lee, S., Zhang, M., Tsang, Y., Kim, K.-H., 2019. Heavy metals in food crops: health risk, fate, mechanisms, and management. Environ. Int. 125, 365–385. https:// doi.org/10.1016/j.envint.2019.01.067.
Rosa, L.C., Bemvenuti, C.E., 2005. Effects of the burrowing crab Chasmagnathus granulate (Dana) on meiofauna of estuarine intertidal habitats of Patos Lagoon, Southern Brazil. Braz. Arch. Biol. Technol. 48 (2), 267–274. https://doi.org/10.1590/S1516- 89132005000200014.
Sappal, R., MacDougald, M., Fast, M., Stevens, D., Kibenge, F., Siah, A., Kamunde, C., 2015. Alterations in mitochondrial electron transport system activity in response to warm acclimation, hypoxia-reoxygenation and copper in rainbow trout, Oncorhynchus mykiss. Aquat. Toxicol. 165, 51–63. https://doi.org/10.1016/j. aquatox.2015.05.014.
Schettini, C., 2002. Caracterizaçao Física do Estuario do Rio Itajaí-Açu, SC. Revista Brasileira de Recursos Hídricos 7, 123–142. https://doi.org/10.21168/rbrh.v7n1. p123-142.
Schiff, K., Brown, J., Diehl, D., Greenstein, D., 2007. Extent and magnitude of copper contamination in marinas of the San Diego region, California, USA. Mar. Pollut. Bull. 54, 322–328. https://doi.org/10.1016/j.marpolbul.2006.10.013.
Seeliger, U., 2001. Chapter 12: the Patos lagoon estuary, Brazil. In: Seeliger, U., Kjerfve, B. (Eds.), Coastal Marine Ecosystems of Latin America. Springer-Verlag Berlin Heidelberg GmbH, United States, pp. 167–183.
Seitzinger, S.P., Mayorga, E., Bouwman, A.F., Kroeze, C., Beusen, A.H.W., Billen, G., et al., 2010. Global river nutrient export: a scenario analysis of past and future trends. Global Biogeochem. Cycles 24, 2621–2628. https://doi.org/10.1029/ 2009GB003587.
Singh, M., Turner, A., 2009. Leaching of copper and zinc from spent antifouling paint particles. Environ. Pollut. 157, 371–376. https://doi.org/10.1016/j. envpol.2008.10.003.
Soroldoni, S., Martins, S.E., Castro, I.B., Pinho, G.L.L., 2018. Potential ecotoxicity of metals leached from antifouling paints under different salinities. Ecotoxicol. Environ. Saf. 148, 447–452. https://doi.org/10.1016/j.ecoenv.2017.10.060.
Turner, A., 2010. Marine pollution from antifouling paint particles. Mar. Pollut. Bull. 60 (2), 159–171. https://doi.org/10.1016/j.marpolbul.2009.12.004.
Turner, A., Singh, N., Richards, J., 2009. Bioaccessibility of metals in soils and dusts contaminated by marine antifouling paint particle. Environ. Pollut. 157 (5), 1526–1532. https://doi.org/10.1016/j.envpol.2009.01.008.
U.S. Environmental Protection Agency, 2008. Ecological Risk Assessment. Guidance Document DERR-00-RR-031. Environmental Protection Agency, Division of Environmental Response and Revitalization, State of Ohio, p. 130.
U.S. Environmental Protection Agency, 2009. National Recommended Water Quality Criteria. Technical Report. Office of science and technology, Washington DC. Office of water.
Valero, A., Umbría-Salinas, K., Wallner-Kersanach, M., Andrade, C., Santos, M.J., Contreira-Pereira, L., et al., 2020. Potential availability of trace metals in sediments in southeastern and southern Brazilian shipyard areas using the DGT technique and chemical extraction methods. Sci. Total Environ. 710 (25), 136216 https://doi.org/ 10.1016/j.scitotenv.2019.136216.
Vivan, J.M., Domenico, M.D., Almeida, T.C.M., 2009. Effects of dredged material disposal on benthic macrofauna near Itajaí Harbour (Santa Catarina, South Brazil). Ecol. Eng. 35, 1435–1443. https://doi.org/10.1016/j.ecoleng.2009.06.005.
Wallner-Kersanach, M., Andrade, C., Zhang, H., Milani, M.R., Niencheski, L.F., 2009. In situ Measurement of Trace Metals in Estuarine Waters of Patos Lagoon using Diffusive Gradients in Thin Films (DGT). J. Braz. Chem. Soc. 20 (2), 333–340. https://doi.org/10.1590/S0103-50532009000200019.
Wallner-Kersanach, M., Mirlean, N., Baumgarten, M., Costa, L., Baisch, P., 2016. Temporal evolution of the contamination in the southern area of the Patos Lagoon estuary, RS, Brazil. J. Integrated Coastal Zone Manage. 16 (3), 263–279.
Wang, M., Cui, Z., Xue, M., Peng, Q., Zhou, F., Wang, D., et al., 2019. Assessing the uptake of selenium from naturally enriched soils by maize (Zea mays L.) using diffusive gradients in thin-films technique (DGT) and traditional extractions. Sci. Total Environ. 689, 1–9. https://doi.org/10.1016/j.scitotenv.2019.06.346.
Wheeler, J.R., Grist, E.P.M., Leung, K.M.Y., Morritt, D., Crane, M., 2002. Species sensitivity distributions: data and model choice. Mar. Pollut. Bull. 45, 192–202. https://doi.org/10.1016/j.chemosphere.2017.11.029.
Yan, Z., Pa, J., Gao, F., An, Z., Liu, H., Huang, Y., Wang, X., 2019. Seawater quality criteria derivation and ecological risk assessment for oil pollution in china. Mar. Pollut. Bull. 142, 25–30. https://doi.org/10.1016/j.marpolbul.2019.02.033.
Zhang, H., Davison, W., 1995. Performance characteristics of diffusion gradients in thin films for the in situ measurement of trace metals in aqueous solution. Anal. Chem. 67, 3391–3400. https://doi.org/10.1021/ac00115a005.
K. Umbría-Salinas et al.