Embed Size (px)
Citation preview


Occasional Papers are written by the Staff of the Directorate-General for Economic and Financial Affairs, or by experts working in association with them. The “Papers” are intended to increase awareness of the technical work being done by the staff and cover a wide spectrum of subjects. Views expressed do not necessarily reflect the official views of the European Commission. Comments and enquiries should be addressed to: European Commission Directorate-General for Economic and Financial Affairs Publications B-1049 Brussels Belgium E-mail: mailto:[email protected] Legal notice Neither the European Commission nor any person acting on its behalf may be held responsible for the use which may be made of the information contained in this publication, or for any errors which, despite careful preparation and checking, may appear. This paper exists in English only and can be downloaded from the website ec.europa.eu/economy_finance/publications A great deal of additional information is available on the Internet. It can be accessed through the Europa server (ec.europa.eu ) KC-AH-11-086-EN-N ISBN 978-92-79-19346-0 doi: 10.2765/1762 © European Union, 2011 Reproduction is authorised provided the source is acknowledged.

European Commission Directorate-General for Economic and Financial Affairs
The EU's neighbouring economies: coping with new challenges
EUROPEAN ECONOMY Occasional Papers 86


ABBREVIATIONS
iii
ACAA Agreement on Conformity Assessment and Acceptance AMD Armenian Dram BA Bank of Algeria BAM Bank al Maghrib BdL Banque du Liban BIS Bank for International Settlements BR Bank of Russia CBE Central Bank of Egypt CBJ Central Bank of Jordan CBI Central Bank of Israel CBS Central Bureau of Statistics CDS Credit Default Swaps CESE Central Eastern and Southern Europe CET Common External Tariff CIA Central Intelligence Agency CIS Commonwealth of Independent States CNED Caisse Nationale d’Equipements et de Développement COM European Commission CPI Corruption Perception Index CPI Consumer Price Index CU Customs Union DB Doing Business DCFTA Deep and Comprehensive Free Trade Area DoTS Directorate of Trade Statistics EBRD European Bank for Reconstruction and Development ECB European Central Bank EDL Electricité du Liban EdStat Education Statistics EFTA European Free Trade Area EGP Egyptian Pound EIB European Investment Bank EMBI Emerging Market Bond Index ENP European Neighbourhood Policy ENPI European Neighbourhood and Partnership Instrument EIU Economist Intelligence Unit EU European Union EUR Euro EURASEC Eurasian Economic Community EUROSTAT European Statistics Office FSAP Financial Sector Assessment Program FAO Food and Agriculture Organization FDI Foreign Direct Investment FTA Free Trade Agreement FX Foreign Exchange FY Fiscal Year GAFTA Greater Arab Free Trade Area GCI Global Competitiveness Index GCC Gulf Cooperation Council (Bahrain, Kuwait, Oman, Qatar, Saudi Arabia, UAE) GDP Gross Domestic Product GFSIM Government Financial Management and Information System GFSM Government Finance Statistics Manual GNI Gross National Income GSP General System of Preferences

iv
HDI Human Development Index IFI International Financial Institutions ILO International Labour Organisation IMD Institute for Management Development IMF International Monetary Fund IEA International Energy Agency INTOSAI International Organization for Supreme Audit Institutions IT Inflation Targeting JODs Jordanian Dinars MDB Multilateral Developments Banks MDH Moroccan Dirham MED ENP Mediterranean Countries MED Ministry of Economic Development MEI Main Economic Indicators MENA Middle East and North Africa region MERCOSUR Mercado Común del Sur MFA Macro-financial Assistance MTEF Medium Term Expenditure Framework NBB National Bank of Belarus NBG National Bank of Georgia NBM National Bank of Moldova NBU National Bank of Ukraine NDF National Development Fund NEER Nominal Effective Exchange Rate NHGDP Non Hydrocarbon Gross Domestic Product NIP National Indicative Programme NPLs Non-Performing Loans OCA Optimum Currency Area OECD Organisation for Economic Co-operation and Development oPT occupied Palestinian Territory PA Palestinian Authority PAFTA Pan Arab Free trade Area PFM Public Finance Management PIP Public Investment Program PMA Palestinian Monetary Authority PNP Palestinian National Plan PPP Purchasing Power Parities PPP Public Private Partnership PIFC Public Internal Financial Control REER Real Effective Exchange Rate RER Real Exchange Rate ROB Result Oriented Budget ROSSTAT Russian State Committee for Statistics SBA Stand-By Arrangement SCAF Supreme Council Armed Forces SDR Special Drawing Rights SMEs Small- and Medium-sized Enterprises SOFAZ State Oil Fund Azerbaijan Republic SPPRED State Programme on Poverty Reduction and Economic Development TASE Tel Aviv Stock Exchange TI Transparency International TIMSS Trends in International Mathematics and Science Study TND Tunisian Dinar

v
UAE United Arab Emirates UN United Nations UNDP United Nations Development Program UNESCO United Nations Educational, Scientific and Cultural Organization US United States USD US Dollar VAT Value Added Tax WB World Bank WDI Word Development Indicators WGI Worldwide Governance Indicators WTO World Trade Organisation


CONTENTS
vii
Foreword 1
Part I: Introduction 3 1. Overview 4
1.1. A comparison between the Mediterranean and the Eastern neighbours 4 1.2. Specific policy challenges exposed by the crisis in the South
Mediterranean 8 1.3. Improving economic governance and the investment climate 11 1.4. Exchange rate policies and competit iveness 13
Part II: Regional issues 17 1. Macroeconomic developments and policy challenges 18
1.1. Mediterranean neighbours 18 1.2. Eastern neighbours 24
2. Economic governance and investment climate 34 2.1. Mediterranean neighbours 34 2.2. Eastern neighbours 36
Part III: Thematic Issues 43 1. Economic factors behind the political unrest in the South
Mediterranean 44 1.1. A disappoint ing growth performance 44 1.2. Populat ion dynamics and inefficient labour markets 46 1.3. Weaknesses in the educational system 50 1.4. Vulnerability to food and energy prices 53 1.5. The role of the public sector: crowding out and fiscal sustainability 55 1.6. Trade policies and regional integrat ion 59 1.7. Conclusions 61
2. Exchange rate policies and competitiveness in the EU's neighbours 63 2.1. Introduction 63 2.2. Descript ion of current exchange rate arrangements 63 2.3. Recent exchange rate developments 68 2.4. Trends in external competit iveness 71 2.5. Dollarisat ion 74 2.6. Conclusions and policy issues 77
Part IV: Country analysis 79 1. Algeria 80 2. Armenia 84 3. Azerbaijan 88 4. Belarus 92 5. Egypt 96 6. Georgia 100 7. Israel 104

viii
8. Jordan 108 9. Lebanon 112 10. Libya 116 11. Moldova 120 12. Morocco 124 13. Occupied Palestinian Territory 128 14. Russia 132 15. Syria 136 16. Tunisia 140 17. Ukraine 144
References 148
LIST OF TABLES II.1.1. ENP-Med countries - Main economic indicators 22 II .1.2. ENP-East countries - Main economic indicators 31 III.1.1. Food and energy dependence of MED countries, yearly averages (2006-
2009) 54 III.2.1. Exchange rate arrangements in the EU's neighbour countries 65 IV.1.1. Algeria - Main economic indicators 83 IV.2.1. Armenia - Main economic indicators 87 IV.3.1. Azerbaijan - Main economic indicators 91 IV.4.1. Belarus - Main economic indicators 95 IV.5.1. Egypt - Main economic indicators 99 IV.6.1. Georgia - Main economic indicators 103 IV.7.1. Israel - Main economic indicators 107 IV.8.1. Jordan - Main economic indicators 111 IV.9.1. Lebanon - Main economic indicators 115 IV.10.1. Libya - Main economic indicators 119 IV.11.1. Moldova - Main economic indicators 123 IV.12.1. Morocco - Main economic indicators 127 IV.13.1. oPt - Main economic indicators 131 IV.14.1. Russia - Main economic indicators 135 IV.15.1. Syria - Main economic indicators 139 IV.16.1. Tunisia - Main economic indicators 143 IV.17.1. Ukraine - Main economic indicators 147
LIST OF GRAPHS I.1.1. GDP developments by region 4 I.1.2. Real GDP growth and oil dependence during the crisis (2009) 6 I .1.3. General government expenditure 7 II .1.1. Real GDP growth (% change) 18 II .1.2. Current account balance (% of GDP) 19 II .1.3. 10 Year Bond CDS Spread* 19 II .1.4. Nominal Exchange Rate 20 II .1.5. Debt to GDP rat io 21

ix
II .1.6. Real GDP growth (regional comparison) 24 II .1.7. Real GDP growth 25 II .1.8. Exports of goods and services (volume) 25 II .1.9. Current account balance 26 II .1.10. Credit growth 27 III.1.1. Real GDP growth (Average 1980-2010, %) 44 III.1.2. GDP per capita - proport ion of EU-27 44 III.1.3. GDP per capita 45 III.1.4. Populat ion growth rate 47 III.1.5. Unemployment rates 48 III.1.6. Literacy Rate in 2009* 50 III.1.7. Rate of repeaters and dropouts* 50 III.1.8. Percentage of graduate per programme 51 III.1.9. Public expenditure (% of GDP) 56 III.1.10. General government revenue (% of GDP) 56 III.1.11. Debt to GDP rat io 57 III.1.12. State ownership (% of total banking sector assets*) 58 III.1.13. Interest rates in selected MED countries 58 III.1.14. Domest ic credit to private sector (2009) (% of GDP) 58 III.1.15. Trade openess 59 III.2.1. Monthly nominal exchange rates (MED) 69 III.2.2. Real effective exchange rate (MED) 69 III.2.3. Monthly nominal exchange rates (East) 70 III.2.4. Real effective exchange rate (ENP-East) 70 III.2.5. Real GDP growth (regional comparison) 71 III.2.6. Total private financial flows, net (USD bn) 72 III.2.7. Foreign banks net claims on domest ic banks (% of GDP) 73 III.2.8. Foreign banks net claims on domest ic banks (% of GDP) 73 III.2.9. Average monthly wage in manufacturing 73 III.2.10. Export volume growth rate 74 III.2.11. Dollarisat ion of bank deposits (ENP-East) 75 III.2.12. Volat ility of exchange rate and dollarisat ion 75 III.2.13. Depreciat ion and dollarisat ion 76 III.2.14. Dollarisat ion of bank deposits (ENP-MED) 76 IV.1.1. Algeria - Fiscal balances, public debt, current account 80 IV.1.2. Algeria - Exchange rates 80 IV.1.3. Algeria - Exports & imports of goods 80 IV.2.1. Armenia - GDP growth and remittances 84 IV.2.2. Armenia - Fiscal balance, public debt, current account 84 IV.2.3. Armenia - Exchange rates 84 IV.3.1. Azerbaijan - GDP and production 88 IV.3.2. Azerbaijan - Fiscal balance, SOFAZ transfers, current account 88 IV.3.3. Azerbaijan - Exchange rates 88 IV.4.1. Belarus - GDP and production 92 IV.4.2. Belarus - Fiscal balance, public debt, current account 92 IV.4.3. Belarus - Exchange rates 92 IV.5.1. Egypt - Output and expenditure on GDP (annual % change) 96 IV.5.2. Egypt - Fiscal balance, public debt and current account 96 IV.5.3. Egypt - Share prices and exchange rates 96 IV.6.1. Georgia - GDP and production 100 IV.6.2. Georgia - Fiscal balance, fiscal debt, current account 100 IV.6.3. Georgia - Exchange rates 100 IV.7.1. Israel - Real sector and trade in 2010 104

x
IV.7.2. Israel - Fiscal balance, public debt and current account 104 IV.7.3. Israel - Share prices and exchange rates 104 IV.8.1. Jordan - Contribut ions to real GDP-growth 108 IV.8.2. Jordan - Fiscal balance, public debt, current account 108 IV.8.3. Jordan - Share prices and exchange rates 108 IV.9.1. Lebanon - GDP growth and CPI inflat ion 112 IV.9.2. Lebanon - Fiscal balance, public debt, current account 112 IV.9.3. Lebanon - Exchange rate and stock market 112 IV.10.1. Libya - Inflat ion and oil production 116 IV.10.2. Libya - Fiscal balance, public debt and current account 116 IV.10.3. Libya - Exchange rates 116 IV.11.1. Moldova - GDP and industrial production 120 IV.11.2. Moldova - Fiscal balance, fiscal debt, current account 120 IV.11.3. Moldova - Exchange rates 120 IV.12.1. Morocco - Output and expenditure on GDP (annual % change) 124 IV.12.2. Morocco - Fiscal balance, public debt, current account 124 IV.12.3. Morocco - Share prices and exchange rates 124 IV.13.1. oPt - Fiscal balance, current account, budget support 128 IV.13.2. oPt - Share prices and exchange rates 128 IV.14.1. Russia - Contribut ions to real GDP-growth 132 IV.14.2. Russia -Fiscal balance, public debt and current account 132 IV.14.3. Russia - Share prices and exchange rates 132 IV.14.4. Russia - Foreign-exchange reserves 133 IV.15.1. Syria - GDP and production 136 IV.15.2. Syria - Fiscal balance, public debt and current account 136 IV.15.3. Syria - Exchange rates 136 IV.16.1. Tunisia - Real GDP growth and industrial production 140 IV.16.2. Tunisia - Fiscal balance, public debt and current account 140 IV.16.3. Tunisia - Exchange rate and stock market developments 140 IV.17.1. Ukraine - GDP and production 144 IV.17.2. Ukraine - Fiscal balance, public debt, current account (% GDP) 144 IV.17.3. Ukraine - Share prices and exchange rates 144
LIST OF BOXES II.1.1. The Customs Union between Belarus, Kazakhstan and Russia 29 II .2.1. Indicators of economic governance and investment climate 35 II .2.2. Structural reform agenda in the Eastern neighbours 39 III.1.1. A short analysis of TIMSS 2007 results for Mediterranean neighbours 52 III.1.2. General inflat ion versus food price inflat ion in selected MED countries 53

FOREWORD
1
The period since the global financial crisis has been characterised by divergent economic experiences within the EU neighbourhood. Most of the Eastern neighbours, having been hit hard by the crisis, have since embarked on a recovery that has gradually solidified over the past 18 months or so. Macroeconomic, financial and balance-of-payments vulnerabilities have been reduced, often supported by external assistance from institutions such as the International Monetary Fund (IMF) and the EU. Crucially, private capital flows to the region started to recover, in tandem with a general improvement in investor attitudes towards emerging markets. Yet the apparent return to reliance on external financing and insufficient channelling of this financing into productive capital formation raises some concerns that history could repeat itself: there is the potential for macroeconomic imbalances and vulnerabilities to re-emerge, setting off another boom-bust sequence akin to that seen in the past decade. Policy measures to diversify and balance the growth model are therefore key. At the same, downside risks to growth in the region have increased with the global economic slowdown.
Meanwhile, the recent experience in the Mediterranean neighbourhood has been overshadowed by the region’s political upheaval, which in many countries has displaced the global financial and economic crisis as the defining feature of the economic situation and outlook. Alongside the obvious political challenges, the popular unrest has also brought many economic policy issues to the fore. The situation calls for structural reforms aimed at promoting sustainable and inclusive growth; providing jobs and professional development opportunities for all, and in particular for the young generation. Importantly, the fostering of a vibrant private sector will play a key role in the often state-dominated economies of the Mediterranean neighbourhood. Replacing generalised energy and food subsidy systems with targeted social transfers; reforming energy labour markets; strengthening educational systems; and promoting international and regional trade integration are other key policy challenges. At the same time, the hard- won macroeconomic stability that the region has enjoyed by and large over the past two decades will have to be preserved; even in the face of strong and immediate popular pressure for higher social outlays to improve the lives of citizens, and to restore their faith in and acceptance of the state.

2
As part of the annual series of Occasional Papers on the European Neighbourhood Policy (ENP), this paper reviews recent economic developments in the countries neighbouring the EU. The ENP encompasses the EU’s immediate neighbours by land or sea, along the southern and eastern shores of the Mediterranean – Algeria, Egypt, Israel, Jordan, Lebanon, Libya, Morocco, the occupied Palestinian territory, Syria and Tunisia – and the countries to the east of the EU that were previously part of the Soviet Union – Armenia, Azerbaijan, Belarus, Georgia, Moldova and Ukraine. Although Russia is outside the scope of the ENP, this report also contains analysis on the Russian economy, given its size and associated importance in particular for the eastern neighbourhood countries.
The paper is structured into four parts. Part I starts with a comparison of the economic situation and outlook in the eastern and southern sub-regions of the EU’s neighbourhood, before turning to selected economic policy issues drawing on the detailed analysis contained in subsequent parts of the report. Part II describes recent economic developments separately for the southern and eastern neighbourhoods, analysing the macroeconomic and structural policy challenges and reviewing key aspects of economic governance and the investment climate on a regional level. Part III consists of two thematic chapters. The first discusses the main economic factors underlying the ongoing social and political unrest in parts of the Southern Mediterranean, and the economic policy challenges they expose. The second examines trends in exchange rate policy and competitiveness in the two neighbourhood regions, identifying some patterns and policy issues. Finally, Part IV delivers a country-by-country analysis of the economies in the EU’s neighbourhood; including public finances, the financial sector, the balance of payments, social developments, as well as the structural reform agenda.
This Occasional Paper was written under the guidance of Heliodoro Temprano-Arroyo, Andreas Papadopoulos and Christoph Wagner, by Stylianos Dendrinos (Armenia; Israel; Libya), Jörn Griesse (Overview; Ukraine), Martina von Terzi and Nicola Costa (Russia), Alexandra Janovskaia (Economic governance and investment climate in the Eastern neighbours; Belarus; Georgia), Neil Kay (Overview; Macroeconomic developments and policy challenges in the Mediterranean neighbours; Economic factors behind the political unrest in the South Mediterranean; Egypt; Morocco; occupied Palestinian territory), Mihai-Gheorghe Macovei (Overview; Macroeconomic developments and policy challenges in the Eastern neighbours; Exchange rate policies and competitiveness; Azerbaijan; Moldova), Paul Toulet-Morlanne (Syria) and Irene Vlachaki (Economic governance and investment climate in the Mediterranean neighbours; Economic factors behind the political unrest in the South Mediterranean; Algeria; Jordan; Lebanon; Tunisia). The paper also benefitted from contributions and editorial assistance from Maria Sole Pagliari (Overview), Vincenzo Scrutinio (Economic factors behind the political unrest in the South Mediterranean, and Exchange rate policies and competitiveness) and Rachel Cassidy (overall editing) during their secondment with DG ECFIN. The overall editorial coordination was ensured by Mihai-Gheorghe Macovei.
The authors are particularly grateful to Mary McCarthy and Heikki Oksanen for their comments. The authors are also grateful for the comments of Aliaksei Vavokhin (EU Delegation Belarus), Wolfgang Behrendt and Oleg Hirbu (EU Delegation Moldova).
Brussels, 27th October 2011. European Commission – DG ECFIN BU-24 B - 1049 Brussels Tel: +32 2 29 95553 Fax: +32 2 29 80806 E-mail: [email protected]

Part I Introduction

1. OVERVIEW
4
1.1. A COMPARISON BETWEEN THE MEDITERRANEAN AND THE EASTERN NEIGHBOURS
1.1.1. Macroeconomic developments and policy challenges
Just as the global economic and financial crisis played out differently in the countries of the Mediterranean and Eastern EU neighbours, so too have the two regions differed in entering the recovery phase. To recall, Eastern Europe was hit by the global crisis with full force (1). While the extent varied across countries, the region as a whole suffered a sudden capital outflow, exposing both structural weaknesses and economic imbalances built up over the pre-crisis boom period. Strong pre-crisis growth (8.5% in 2007, on a PPP-weighted basis) gave way to a steep regional recession (-7.7% in 2009). By contrast, the Southern Mediterranean weathered the global economic crisis relatively well and managed to maintain positive growth, even at the height of the crisis (3.3% in 2009, after 5.2% in 2008). The difference in the two regions’ resilience to the crisis becomes evident when looking at the longer-term picture.
Graph I.1.1:GDP developments by region
-8
-6
-4
-2
0
2
4
6
8
10
2003 2004 2005 2006 2007 2008 2009 2010 2011
Sources: IMF, Commission forecast s.
90
100
110
120
130
140
150
160
170
180
CIS (real growth, PPP-weighted)MED (real growth, PPP-w eighted)CIS (real GDP level, 2003=100, PPP-weighted)MED (real GDP level, 2003=100, PPP-weighted)
In terms of cumulative real GDP growth since 2003, the two regions are now roughly on a par; indicating that the advantage built up by the Eastern neighbours over their Mediterranean (1) For a more detailed discussion of the different way in
which the global crisis affected the two groups of neighbours, see European Commission (2009 and 2010a).
counterparts in the pre-crisis years has evaporated as a result of the heavy toll of the crisis in the East (see Graph I.1.1).
2010 was a year of recovery in the EU neighbourhood, as indeed in the EU itself. Real GDP began to grow again, reaching 4.2% in the East (on a PPP-weighted basis) and 4.4% in the South. Nonetheless, the differences between the Southern and Eastern neighbourhood in terms of degrees and types of vulnerabilities, which help to explain the divergence in economic performance during the crisis, are also characterising the current challenges faced by the countries South and East of the EU. In Eastern Europe, the recovery was spurred to some extent by the return of financial-market confidence towards the region and the gradual restoration of capital inflows; a confidence which in turn was catalysed in many countries by support programmes of the IMF. However, heavy reliance on foreign capital, in particular in the banking sector which still exhibits remaining weaknesses, and a failure sufficiently to channel foreign capital into productive capital formation could create new risks of unbalanced growth and a renewed build-up of external vulnerabilities. In the short-run, the risk is mitigated by the on-going slowdown in the global economic activity which increases downside risks for growth also in the Eastern neighbourhood.
Meanwhile in large parts of the Southern Mediterranean, the global economic crisis and how to overcome it are no longer even the main thread of policy discussions. Instead the scene is dominated by the political upheavals that started in early 2011, including upheavals in the area of economic policy. If the fact that the global crisis left the EU’s Southern neighbours relatively unscathed originally gave rise to complacency among economic policy-makers in the countries concerned, then the popular protests that have since swept the region have put the structural economic problems, notably in the public sector and the labour market, in stark relief. Political events are also weighing down on these countries’ macroeconomic performance. Strikes, civil conflict and political instability have negatively affected production and consumer confidence and growth in many countries, and contributed to increase budget deficits. At the same time, declining export receipts (particularly owing to a drop in tourist

Part I Introduction
5
arrivals), lower remittances (owing to the turmoil in Libya and some richer countries in the Gulf) and lower foreign investment (as international confidence in the region has been shaken) have all taken their toll.
While the aftermath of the economic and financial crisis and the political unrest in the Arab world are in many ways the main elements shaping short-term economic developments in the EU’s neighbourhood, the performance of their largest trading partners– first and foremost the EU itself, but also other big regional economies such as Russia, Turkey or the key countries of the Gulf Cooperation Council (GCC) – is also of key concern; influencing as it does the cross-border flows of goods and services, financial investments and remittances.
Within the EU, the moderate recovery is slowing down due to the weakening in global demand and amid financial market crisis. According to the European Commission’s 2011 forecasts (the Spring and the interim Autumn), EU GDP is expected to expand by 1.7% in 2011. The global economic activity is projected to slow down also in the United States and other developed economies. This could also weigh down on economic activity in the EU's neighbours via its negative impact on external demand and financial market confidence. As a positive feature for the Eastern neighbourhood, growth is projected to be above EU-average in Germany, the Nordic and Baltic countries and the central-Eastern European Member States, all of which tend to have stronger trade links to the Eastern neighbours. By contrast, the Southern European Member States are likely to experience weaker growth or even continued recession, thus lending little support to their neighbours on the Southern shore of the Mediterranean in terms of external demand. Meanwhile, Russia’s economy has only marginally slowed compared to 2010 and its recovery looks set to continue, helped in part by strong commodity prices, with positive spill-over effects on the Eastern economies. Also on the positive side, but this time for the Southern neighbourhood, is the fact that Turkey (an important trading partner for the region) is posting vigorous growth; while the GCC economies (which are also important as trading and financial partners and as sources of remittances for the region, particularly for certain countries such as Jordan and Lebanon)
are expected to perform well supported by the recovery of oil prices. On the other hand, the crisis in Syria (which is also a trading route for the GCC area) and post-conflict weaknesses in Libya are expected to continue to represent a weak factor in the external economic environment of their immediate neighbours.
Overall, it is clear that the external environment is more favourable for the EU’s Eastern than for its Southern neighbours; and indeed this is reflected in a stronger growth-rate prediction for the former group. According to projections by the European Commission services, the EU’s Eastern neighbours are set to take a further step towards recovery, with the regional economy expanding at broadly a similar pace as in 2010 (3.8% in 2011 against 4.2% registered in 2010 on PPP-weighted averages), despite the on-going global economic slowdown. By contrast, the Mediterranean neighbours will grow on average by just about 0.5% (on a PPP-weighted basis) in 2011; and even excluding Libya - the main outlier in terms of expected economic growth this year - such an expansion of the regional economy would still represent the weakest since 2002.
Although this section compares the Southern and Eastern neighbourhood of the EU on a regional level, it is important not to lose sight of the differences across countries. In the East the pattern of crisis and subsequent recovery appears fairly uniform. The recovery from the crisis has been quite strong both in Moldova and Georgia, with real GDP growth above 6% in 2010 and about 6% estimated for 2011 in both cases. Although less buoyant, an economic recovery has also taken hold in Ukraine, which has been growing at above 4% since it overcame the crisis; while economic activity in Armenia only started to pick up more decisively in 2011.
However, an exception to this trend is Azerbaijan which originally managed to avoid a large drop in economic growth rates from 2008 to 2009, cushioned by the buffer fund built up in previous years from its oil and gas receipts. Growth in Azerbaijan then slowed markedly in 2010 and in the first half of 2011, as production in the oil sector has reached a peak. Another distinct case is Russia, which was also helped by its stockpile of foreign exchange reserves and its hydrocarbons-related sovereign wealth fund. Along with

European Commission The EU's neighbouring economies: coping with new challenges
6
Azerbaijan, and unlike the five oil importers of the EU’s Eastern neighbourhood, Russia managed to avoid having to resort to official external support from the IMF. Nevertheless, the scale of pre-crisis private inflows of capital into Russia, in particular into the domestic financial sector, was so large that its sudden reversal left Russia unable to avert recession.
Looking at the expected path of recovery in the Eastern neighbourhood, a final important outlier is Belarus. The country managed to avoid outright recession in 2009, with an IMF programme cushioning the effect of the crisis on the domestic economy. Yet although Belarus graduated from the IMF Stand-By Arrangement in March 2010, the country’s economic recovery and external stabilisation have proved unsustainable, essentially reflecting the excessive easing of monetary and fiscal policies after the IMF programme and ahead of the December 2010 presidential elections. With the current account deficit rising to 16% of GDP in 2010, and with international reserves and the local currency under pressure since early 2011, Belarus was forced to widen the currency’s fluctuation band in April and then markedly to devalue its currency in May. In early June, Belarus agreed on a USD 3 billion loan from the Russian-dominated Eurasian Economic Community, and has again had to request financial support from the IMF. Meanwhile the need for outside help is gradually diminishing in most other countries of the region, and thus we see that Belarus is clearly out of step with the economic cycle in the rest of the Eastern neighbourhood.
In the South, as in the East, resource endowments are also an important differentiator for countries’ economic position and prospects. However, contrary to the developments witnessed in the East, the major net exporters of oil and gas in the Southern neighbourhood arguably fared worse than their peers during the crisis (see Graph I.1.2). In a region that was generally less affected by the crisis, owing to the relatively low intensity of its economic links with the rest of the world (in particular in the financial sector), the sharp drop in international oil prices was one of the crisis’ principal transmission channels; working to the detriment of net exporters while benefiting the net importers. Indeed, considering net exporters, Libya was the only country registering a contraction of GDP in the crisis year of 2009; while Algeria
posted lacklustre growth of 2.4%, the fourth-lowest in the region. However, when oil prices rebounded in 2010, the fortunes of these economies changed accordingly.
Graph I.1.2: Real GDP growth and oil dependence during the crisis (2009)
-20
-15
-10
-5
0
5
10
15
-15 0 15 30 45 60 Oil Dependence *
Rea
l GD
P G
row
rh R
ate
(%)
CIS countries MED countries
* Oil Current Account Surplus (negative figures for net importes) over GDPSources: IMF, World Bank, national statistics off ices, Commission ca lculations.
Meanwhile Israel’s economy also registered very slow growth in 2009, at 0.8%. Its developed-economy status and the concomitantly closer financial and trade linkages to the core industrialised economies, in particular the United States, made it the second-most crisis-affected country in the region (if 2009 economic performance is taken as a yardstick). However, the Israeli economy posted a solid recovery in 2010, growing by 4.7%, and in 2011 is recording one of the strongest macroeconomic performances in the region (1).
As far as the economic prospects of the Mediterranean neighbours are concerned, a key determining factor will be the severity and timing of the popular uprisings and how individual countries respond to the political upheaval that the region is experiencing. Given the gravity of the political conflicts in Libya and Syria, it is unsurprising that Commission services' forecasts put them at the bottom end of expected 2011 growth rates in the region (with a steep contraction of 28% forecast for Libya). Less affected countries with more solid macroeconomic fundamentals, by contrast, are expected to grow more strongly in
(1) However, dissatisfaction with the growth and income
distribution model pursued by the authorities in recent years has resulted in a strong movement of political protest in Israel in recent months.

Part I Introduction
Graph I.1.3:General government expenditure
0
10
20
30
40
50
60
Alg
eria
Arm
enia
Aze
rba
ijan
Bela
rus
Egyp
t
Geo
rgia
Israe
l
Jord
an
Leba
non
Libya
Mol
dov
a
Mor
occo
Russ
ia
Syria
Tuni
sia
Ukra
ine
Ave
rage
MED
Ave
rage
CIS
Sub-
Saha
ran
Afri
caLa
tinA
mer
ica
Dev
elop
ing
Asia All
emer
gin
g &
deve
lop
ing EU
Source: IMF.
% o
f GD
P
2005-08 2009
7
2011 despite a difficult regional and global economic environment (e.g. Morocco, Jordan and Israel with forecasted growth rates of 3.7%, 4.2% and 4.7% respectively).
To highlight the key macroeconomic policy challenges faced by the EU’s neighbouring economies: on the monetary policy side, they must respond to the inflationary impact of the increase in food and energy prices while not choking the recoveries (Eastern neighbours) or exacerbating the deceleration or decline in economic activity caused by the political upheavals in the region (affected Mediterranean neighbours). Plans in some Southern Mediterranean countries to adopt formal inflation- targeting regimes (for example in Tunisia and Egypt) are now being delayed due to the uncertainty created by the new political and economic context. In the case of Israel, monetary policy must remain particularly vigilant because high food and energy prices are combined with overheating pressures from the strength of domestic demand and constraints in the housing market. Some countries (e.g. Belarus) should move to more flexible exchange rate policies to facilitate balance of payments adjustment or to reduce the constraints faced by monetary policy to respond to fluctuations in international commodity prices and capital flows.
On the fiscal side, Southern neighbours are facing new challenges created by the deterioration in public finances arising from the political turmoil and its economic impact. While some deterioration in fiscal positions in 2011 seems likely, these countries should endeavour to limit it and to resume the fiscal consolidation path in 2012. Net energy exporters, in particular, should already tighten fiscal policy now to avoid economic overheating. Amongst the Eastern neighbours, the
improvement in the fiscal positions that began in 2010 should be continued, as part of the graduation process from the current IMF financing arrangements.
1.1.2. The structural reform agenda: challenges common to both regions
Notwithstanding the divergences both within and between the two regions, there are a number of common challenges that the EU neighbourhood, to the South as well as to the East, will need to tackle if it is to leave the crisis behind and establish sustainable growth in living standards.
Firstly, both regions have a tradition of the public sector playing a relatively large role in economic life, to the detriment of private sector development. In the case of the Eastern neighbours this stems from the communist heritage of central planning; while the political systems in many countries of the Southern neighbourhood have also favoured strong government control over the economy, breeding in some cases a type of “crony capitalism”. As shown in Graph I.1.3, both regions of the EU neighbourhood post a higher share of general government expenditure in GDP than other developing regions (albeit lower than in the EU). In addition, state-owned enterprises, which fall within the public sector but do not count for general government financial statistics, play a significant role in both the Eastern and the Mediterranean neighbours. Encouraging a vibrant private sector could therefore give a boost to potential growth and job creation in both regions.
Secondly, and related to the previous observation, most countries of the EU neighbourhood continue to face economic governance challenges which are weighing heavily on the operating and

European Commission The EU's neighbouring economies: coping with new challenges
8
investment climate for businesses (see Section 1.3). Governance and corruption problems contributed to triggering the social uprisings in the Southern neighbours, and are also perceived as a weakness of political systems and the business environment in the Eastern neighbours. Tackling corruption and favouritism; strengthening accountability and transparency in public administration; improving public finance management; reducing the bureaucratic burden on citizens and companies; and ensuring that the judiciary is efficient, independent and free from political interference could go a long way in rendering the business environment more hospitable in many neighbourhood countries.
Thirdly, making the labour market more flexible, and encouraging job creation in the private sector so that it offers opportunities to rising numbers of young jobseekers, are key challenges particularly for the Southern neighbours. A lack of professional prospects even for the well-educated has been identified as an important ingredient in the feelings of disenchantment and frustration fuelling the mass protests across the region. The labour market situation in the Eastern neighbourhood countries is less acute; not least owing to a different demographic starting point, with populations stagnating or even declining unlike in the Mediterranean neighbours. Nonetheless, labour markets in Eastern Europe have their own problems: they are also heavily regulated, and the public sector remains an important employer. The challenge is therefore to increase flexibility while at the same time safeguarding a degree of job and income security that is compatible with people’ expectations in these countries.
Fourthly, financial systems need to become both more resilient and capable of serving the demands of households and enterprises for financial products. Following the experience of the financial crisis, and notwithstanding the progress already made, some countries in the East still have an overhang of large non-performing loan ratios and insufficiently capitalised banks. In the South, most of the banking sectors are still protected from domestic and foreign competition. Meanwhile, the shallowness of the financial system in many countries of the neighbourhood, both in the East and the South, deprives companies and in particular SMEs of options to obtain funding; thus hindering business development, job creation and
economic growth. This is an important aspect of long-term development that should not fall victim to a misguided belief that national financial isolation is the best way to reduce a country’s vulnerability to an international financial crisis. At the same time, an adequate regulatory and supervisory framework must be put in place to reduce the exposure to potential cross-border financial contagion. Finally, political interference into banks’ capital allocation decisions, notably in the case of state-owned banks, should be minimised.
Fifthly, the trend increase in raw material prices puts the spotlight on another structural problem in many economies of the EU neighbourhood: public subsidies for the consumption of basic goods, notably food and fuel. Against this backdrop, the recent rise in world prices for commodities is not only putting upward pressure on inflation in both regions, but also straining public budgets. This underlines the need to reduce and, in the longer term, to replace generalised public subsidy systems with targeted social assistance programmes for the poorest households. Such a policy would relieve pressure on the public purse, while also letting price signals take their full effect on consumption decisions.
1.2. SPECIFIC POLICY CHALLENGES EXPOSED BY THE CRISIS IN THE SOUTH MEDITERRANEAN
The crisis in the South Mediterranean has exposed important economic weaknesses and underlined several macroeconomic and structural policy challenges that are specific to the region. This section reviews these challenges as well as the international response put together to help those countries overcome them.
1.2.1. Macroeconomic policy challenges
While the stimulus measures, applied in 2009 and 2010 in response to the global economic crisis, helped compensate for falling external demand, there is little room for governments to further apply counter-cyclical fiscal policy to compensate for the negative economic impact of the regional crisis. Moreover, higher commodity prices have raised the cost of government food and fuel subsidy schemes, which typically make up a large

Part I Introduction
9
proportion of government spending. This situation has left governments with a clear dilemma: the uprisings have raised social expectations and led to public demands for an immediate rise in living standards, but at a time when there is very limited fiscal capacity to respond to such demands and to support growth. Under these circumstances, securing sufficient financing to support expenditure, including programmes designed to upgrade infrastructure and employment, has become an immediate priority.
In some countries, financing current accounts has also become an immediate priority; since higher commodity prices have come at the same time as falling revenue from key export sectors such as tourism, reduced remittances (linked to weak regional and global labour markets), and a slowdown in FDI. Some capital outflows from equity and bond markets have also added to financing pressures.
Monetary policy began to be eased at the start of 2009 and, with the exception of Israel, central banks throughout the region have not yet embarked on a tightening cycle. Although economic activity is weaker due to the regional crisis, inflationary pressure has increased on account of high international commodity prices. The challenge for monetary policymakers is to try to avert second-round effects from higher commodity prices, which could set off an inflationary spiral, while allowing monetary policy to support growth. Many central banks of the region operate managed floats or de facto pegs, mainly against the US Dollar. Although these have provided a useful nominal anchor against inflation, there may be benefits in allowing greater flexibility: this would permit the exchange rate to act as a shock absorber at the current time, promote current account adjustment, and lay the ground for the future adoption of inflation-targeting which remains a medium-term objective of several central banks in the region.
1.2.2. Structural challenges
In addition to the structural reform challenges common to both ENP regions, which were overviewed in section 1.1.2, the Arab Spring has exposed some that are of particular relevance to the Southern neighbours.
The economies in the ENP Mediterranean region have under-performed over the last thirty years in terms of GDP growth, and in particular (given their rapid rates of population growth), in terms of per capita GDP growth when compared to other developing regions such as Latin America, Asia and Central and Eastern Europe. While GDP growth has picked up in the Mediterranean region over the last decade, due partly to progress on structural reform programmes, growth in the other developing regions has accelerated more, particularly in Eastern Europe and Asia. This disappointing growth (and employment) performance is no doubt one of the roots of the uprisings in the Southern Mediterranean. Raising potential growth, and fostering more socially inclusive growth, is therefore a challenge of particular importance for the region.
The disappointing growth of employment, combined with rapid demographic growth and labour-market rigidities, resulted in high rates of unemployment particularly among woman and young people even before the global crisis and the ongoing regional crisis. Recorded unemployment rates have been fairly constant at 10-13% for the past two decades in Egypt, Jordan, Lebanon, Morocco, Syria and Tunisia (IMF 2011). Unemployment would be even higher were it not for the fact that the region has large informal sectors and one of the lowest participation rates in the world, particularly among women. All this of course feeds into the pressure to migrate, notably towards Europe and to the riches countries in the Middle East and North African (MENA) region. Educational systems exacerbate unemployment by producing significant mismatches between the skills supplied (notably for qualified workers) and those demanded by the private sector. This is because education is largely orientated to serving the over-bloated public administration, a problem which furthermore constrains the development of the private sector. There is also a double challenge of raising the participation rate of women while reducing unemployment: unemployment is

European Commission The EU's neighbouring economies: coping with new challenges
10
particularly high amongst women even despite their extremely low participation rates, meaning that currently on average only one in four women is in paid employment.
Another marked feature of the Southern neighbours is their particular sensitivity to international commodity prices’ impact on the food and energy subsidies, and the heavy weight that food and energy prices have in the consumer price indices. This makes them, from a social, budgetary and inflation point of view, particularly vulnerable to fluctuations in commodity prices. This had already become evident for example from the riots caused by food-price increases in 2008. It is therefore not surprising that in reaction to the social unrest, many governments in the region have decided to interrupt, and in some cases even to revert, the reforms of their public subsidy systems. Although this strategy may be effective in the short-term as a way of appeasing social unrest, it could lead to the build up of large fiscal and external financing gaps (if growth remains weak), reduce the scope for counter-cyclical fiscal policy in future, and lead to increases in government borrowing costs. It is therefore important not to abandon the medium-term strategy of reform of the public subsidy systems.
Finally, another structural shortcoming specific to the Southern neighbours is their very low degree of international and intra-regional trade integration. They have much lower trade openness ratios, measured for example by the share of their exports to GDP, than the Asian emerging market economies. Outside the oil and gas sectors, the share of their exports in world trade has stagnated over recent decades, in contrast to the doubling of market shares seen by emerging and developing economies as a whole. This is partly explained by their relatively closed trade regimes (1); and lack of trade integration is, according to empirical studies, one factor contributing to explain their disappointing GDP growth performance. While the EU and other developed partners can help change this (both by facilitating liberalisation at multilateral level and through their own bilateral trade agreements), further regional integration is essential in order to limit trade diversion effects of FTA agreements with major trading partners. In
(1) Oil importers tariffs averaged over 12 per cent in 2009
(International Monetary Fund, 2010b).
this respect, the Agadir Free Trade Agreement signed between Tunisia, Morocco, Jordan and Egypt in 2004 represents a step in the right direction. By promoting economies of scale, economic diversification, the flow of capital to the most productive investments and the dissemination of know-how, deepening global and regional trade integration should support economic growth and mitigate migration and other social pressures.
Chapter III.1 further discusses the structural weakness in the Arab Mediterranean countries and how they contributed to trigger the political upheavals.
1.2.3. International response
The international community has responded to calls for assistance to meet the short-term financing needs of countries in the Southern Mediterranean, and to support longer-term development. The signature event of the G8 Deauville summit on 26-27 May was the launch of a “Deauville Partnership” with all countries of the "Middle East and North Africa" (MENA) region, “engaging in a transition towards free, democratic and tolerant societies. A partnership has so far been agreed with Tunisia, Egypt, Morocco and Jordan. It is based on political and economic pillars. The economic pillar consists firstly of short-term measures, including the possibility of IMF programmes, frontloaded support from multilateral development banks’ (MDB), and assistance by bilateral donors such as Saudi Arabia; and secondly of medium- to long- term measures, such as a joint MDB action plan to coordinate their investments in the region (with a strong role for the EIB), the extension of the geographic scope of the EBRD mandate and measures in the trade policy area. The joint MDB action plan highlights several key challenges as follows:
• Increasing Governance, Transparency, Accountability, and Citizen Participation
• Increasing Social and Economic Inclusion
• Creating Jobs
• Accelerating Shared Economic Growth led by the Private Sector

Part I Introduction
11
• Regional Cooperation and Integration: The Arab World Initiative and the New Arab World
• Sequencing, Flexibility, and Macroeconomic Stability
The Deauville partnership will make USD 38 billion available to aid change in Tunisia, Egypt, Morocco and Jordan. The EU is very much part of the international effort to increase investment in infrastructure and for the private sector. The ceiling for the EIBs external mandate operations in the Mediterranean region is to be raised by EUR 1 billion, which will bring EIB operations in the region to close to €6 billion over the coming three years. There will also be an extension in the EBRD’s operations to Egypt and possibly to other countries in the Southern Neighbourhood in close co-operation with EIB. In terms of EU regular cooperation assistance (in the form of grants), the EU already provides substantial assistance to the region, mainly through national indicative programmes. The EU provided around €700 million to the countries of the Southern Mediterranean (1) in 2010. Through its regional European Neighbourhood and Partnership Instrument (ENPI), the EU will allocate additional financial resources to neighbouring countries, including those in the Southern Mediterranean, totalling around €1.24 billion. In addition, Mediterranean neighbourhood countries are in principle also eligible for macro-financial assistance from the EU, provided an IMF programme is in place and the existence of a balance of payments financing gap is confirmed.
On 8 March 2011 the European Commission and the High Representative of the Union for Foreign and Security Policy published a Communication on a Partnership for Democracy and Shared Prosperity with the Southern Mediterranean. The Communication spelt out the EU strategy to support the momentous changes in the Southern Neighbourhood and was submitted to the extraordinary European Council held on 11 March 2011.
On 25 May 2011, the Commission and the European External Action Service (EEAS) adopted a joint communication to the Parliament, the Council, the Economic and Social Committee and (1) All countries except the occupied Palestinian Territories.
the Committee of the Regions entitled “A new response to a changing Neighbourhood”, revising the approach of the European Neighbourhood Policy encompassing political and economic themes. This new approach puts more emphasis on democracy, human rights, inclusive economic development and intra-regional co-operation. Greater regional trade with the EU is strongly promoted, including through the possible establishment of Deep and Comprehensive Free Trade Areas (DCFTA's) with countries of the Southern Mediterranean.
1.3. IMPROVING ECONOMIC GOVERNANCE AND THE INVESTMENT CLIMATE
From the analysis of specific indicators (2) one can note that the South Mediterranean neighbours tend to outperform the Eastern ones in terms of institutional development and macroeconomic stability, in particular prior to recent social and political turbulences (3). On the other hand, they display a relatively poor performance when it comes to goods and financial market efficiency, and to the degree of openness of their economies. Obviously the ongoing regional crisis has deteriorated the performance of the Mediterranean neighbours on several of these indicators; indeed the recent publication of the Global Competitiveness Index for 2011-2012 confirms a significant short-term worsening of rankings for countries like Egypt, Tunisia and Jordan. Yet on the other hand, the regional crisis represents an important occasion for more reform-oriented governments to address the governance weaknesses of these economies.
Regarding the Worldwide Governance Indicators, the Southern Mediterranean neighbours seem to outperform their Eastern counterparts in all the six dimensions considered. There are, however, several caveats to be taken into account. First of all, the figures for the performance of the Southern
(2) Such as the Worldwide Governance Indicators
(WGI) provided by the World Bank, the World Economic Forum's Global Competitiveness Index (GCI), Transparency International's Corruption Perception Index (CPI) and the World Bank's Doing Business (DB) reports.
(3) Only some indicators, such as the GCI and the DB, were computed before the recent socio-political unrest affecting some of the Middle Eastern and North African countries; hence the other indicators do not take into account the recent political and economic changes and their effects.

European Commission The EU's neighbouring economies: coping with new challenges
12
Mediterranean region are biased upwards due to the presence of Israel, which is an outlier with respect to the other countries (except for the political stability dimension). Secondly, the analysis underlying these results does not take into account the recent political unrest affecting the region (see previous footnote), which is likely to lead to a revision in the values of countries such as Libya and Egypt and above all Tunisia, which actually had scored well in terms of political stability and rule of law.
While it is true that the current situation has negatively impacted the affected countries’ institutional-reliability rankings, the new political phase which began when political unrest erupted in December 2010 could over time increase these countries’ incentives to address a number of structural problems in order to attract foreign investments; problems including labour market rigidities, trade integration, the enhancement of institutional framework, reinforcement of anticorruption measures, the strengthening of public finance management, and indeed other factors affecting competitiveness. It may be also an opportunity to solve the long-lasting structural challenges related to large and inefficient government bureaucracies, restricted access and heavy tax regulation.
When considering the Eastern neighbours, it is notable that their main problems are related to political and government instability, the burden of government regulation, the lack of judicial independence (which hampers the functioning of the entire legal system), and governance problems. Admittedly some reforms have been introduced in several countries of the region as a result of the economic recession, in order to improve their macroeconomic performance and their competitiveness, but the reforms still need to be further pursued.
Regarding performance in the overall Global Competitiveness Index 2011-2012, most of the Eastern and Southern Mediterranean neighbours (9 out of 14) are placed in the lower half of the rankings. The best-performing countries are Israel and Tunisia (22nd and 40th respectively). Yet while the former moved up by two positions, the latter dropped by eight positions reflecting the negative impact of the "Arab Spring" turbulences. Similar downgrades were also witnessed by Egypt (from
81st to 94th) and Jordan (from 65th to 71st), while Libya was not covered by this year's report because of the social unrest in the country. Business environments, security situations and macroeconomic stability also understandably suffered in the countries directly impacted by the unrest.
Eastern neighbours have therefore outperformed the Southern Mediterranean neighbourhood in this year's report, in particular since the majority of the former moved up in the rankings. As to the GCI sub-indices, Eastern neighbours also display a better position in the enhancement of efficiency and in innovation than that held by countries of the Southern Mediterranean. Generally speaking, the countries in the Eastern neighbourhood are performing better in terms of labour market efficiency and technological readiness; although they still encounter difficulties regarding macroeconomic stability, the efficiency of goods markets, financial market development, and the quality of the institutional framework.
The most widespread problem across the Southern Mediterranean region consists of the inefficiencies in labour markets, due to rigid employment regulation and wage-setting processes, high taxes and low participation of women in the labour force. Overregulation and relatively low levels of domestic and foreign investment led to a lack of job opportunities in the labour market, resulting into high unemployment rates among young people and above all amongst well-educated young people. This in turn has contributed to the increased social dissatisfaction that led to the popular uprisings in Tunisia, Egypt and Libya, and that still feeds the social unrest in other countries of the region. In terms of the quality of education, market size and institutional reliability, the indicators seem to suggest that this region is performing better than the Eastern neighbourhood; but again, the current events have somewhat altered this picture as well.
Corruption, as already noted, is one of the most important aspects of economic governance of any country. In cases of non-transparent institutions and decision-making processes, corruption can lead to the malfunctioning of the political and economic development of the country. The effect goes via weakened property rights and forced redistribution of income, thus creating major
Part I Introduction
13
disincentives for engaging in productive rather than rent-seeking activities. The Corruption Perception Index (CPI) ranks countries in terms of the degree to which businesspeople and country analysts perceive corruption to exist among public officials and politicians. The score ranges from 1 to 10 and the better the performance of a country, the higher its score.
In the Southern Mediterranean neighbourhood, corruption is found to be a problem for good governance in particular in Morocco, Libya, Egypt and Algeria. In these countries the phenomenon is rooted in the political and institutional infrastructure of the state and it develops as a result of the relatively limited opportunities for public participation. The best performing country of the group is Israel, which is among the upper 25% of all the ranked countries.
As for the Eastern countries, corruption is also perceived as one of the major problems. According to the CPI, the average of this group is in the lower third of the world distribution. The regional best performer is Georgia. There have been significant gains in the rankings for Belarus and Moldova over the last two years, which has enhanced the overall performance of the region; but some countries such as Azerbaijan, Ukraine and Russia remain among the worst worldwide.
Two further dimensions that must be considered are the investment climate and the easiness of doing business. In this respect, the World Bank's 2012 Doing Business report encompasses a set of indicators that are used for assessing how good the business environment is in 183 countries. Several successful reforms have been introduced in the Southern Mediterranean neighbours to make it easier to launch a business and to attract investments. Nonetheless, the region still lags behind most others. The primary challenges consist of streamlining the cumbersome and costly procedure for business start-ups, protecting investor rights, enhancing contract enforcement and strengthening transparency. Another weakness comes from the insufficient reform of the financial sector. Indeed, the region falls short in providing wide access to financial services for the population. Likewise, small and medium-sized enterprises receive substantially less financing from banks than in other regions. In this sense, the challenge is to expand the reach of the financial
sector by strengthening the financial infrastructure, enhancing competition, developing the non-bank system and deepening local debt and equity markets to provide alternative sources of finance.
In the Eastern neighbourhood, the picture is somewhat different. In recent years many reforms have been introduced which have greatly improved the ease of starting and handling a business in these countries; although there is still room for further improvement. According to the report, the countries in the region have recently achieved top ranks as far as the easing of business start-up, the access to credit and the registration of property are concerned; moreover they have shown a positive trend in terms of dealing with construction permits, protecting investors, enforcing contracts and resolving insolvency. On the other hand these neighbours are still performing poorly regarding access to electricity, trading across borders and paying taxes.
1.4. EXCHANGE RATE POLICIES AND COMPETITIVENESS
This year's report includes a thematic chapter (see chapter 3.2) dedicated exclusively to the analysis of exchange rate arrangements and related competitiveness issues in the EU neighbourhood countries, immediately prior to and during the crisis. While looking at the divergent evolution of exchange rates among the EU's Eastern and Southern neighbours before and during the crisis, the paper focuses on the potential role of the exchange rate in emerging economies to better cope with large and volatile capital flows. In 2010 and early 2011, developments in exchange rates and exchange rate arrangements in the EU neighbours continued to be shaped by the repercussions of the global economic crisis, as well as by the consequences of the Arab Spring in the Mediterranean neighbours.
At the on-set of the crisis, the majority of both the Eastern and the Southern EU neighbours were using de facto pegged or tightly managed exchange rate regimes. The only notable exception was Israel, which already had an independent floating exchange rate and a fully-fledged inflation-targeting regime. The Southern neighbours had a higher share of pegged arrangements than the Eastern neighbours, and

European Commission The EU's neighbouring economies: coping with new challenges
14
also managed to maintain them through the crisis while some countries in the latter group moved towards more flexibility. The main reason was the divergent evolution of the exchange rates which depreciated heavily in most of the EU's Eastern neighbours at the beginning of the crisis (with the notable exception of Azerbaijan). This was primarily the consequence of the build-up of real appreciation pressures in the pre-crisis period and the subsequent corrections needed to restore macro-economic stability and external competitiveness. At the same time, in the EU's Mediterranean countries exchange rate volatility has been less pronounced than in other emerging markets and the currencies exhibited remarkable stability.
Once the macro-economic situation started to stabilize in the EU's Eastern neighbours during 2010 and early 2011, their exchange rates resumed again a moderate appreciation trend in both nominal and real terms. The Armenian, Georgian, Moldovan and Russian currencies appreciated slightly in nominal terms against the US Dollar, regaining some of their lost strength. The Ukrainian hryvnia has also been under modest upward pressure, enabling the central bank to replenish its reserves, but the pre-crisis de facto peg to the USD continued at a depreciated exchange rate level. Given the inflation differential, the currency has been appreciating in real terms. Only Belarus' rouble followed a different evolution path. The exacerbation of external imbalances and pressure on the currency led to a widening of the band and a significant depreciation of the rouble by about 36% against the US Dollar in May 2011.
Over the same period 2010-2011, the evolution of financial markets and exchange rates diverged once again between the Mediterranean neighbours and the Eastern neighbours. In contrast with the increased macro-economic stability, improved investor confidence and recovering capital flows in the Eastern neighbours, the Arab uprisings were accompanied by financial turmoil and pressures on the external side of the Mediterranean neighbours’ economies. In the first quarter of 2011, financial market contagion took hold across the region, illustrated by double-digit plunges in some stock markets such as in Egypt, Jordan, Lebanon or Tunisia, as well as a sharp increase in both CDS and government bond spreads. International rating
agencies have also downgraded several countries in the region, including Egypt, Jordan, Lebanon and Tunisia. However, the situation on the financial markets began to stabilise again as of mid-March, and most importantly, exchange rates proved again quite stable and resilient in most economies. The Israeli Shekel was appreciating steadily in the first half of 2011.
Looking forward, one cannot rule out further pressure on the currencies of the Mediterranean neighbours as long as the political turmoil continues. At the same time, as the countries embark gradually on economic liberalisation and structural reform programmes, renewed investor confidence and more abundant capital inflows are expected. Similarly to what has happened in the Eastern neighbours, this will raise the question of what is the optimum combination of exchange rate arrangements and other macro-economic and structural policies necessary to avoid an excessive real appreciation of exchange rates, which may put pressure on external competitiveness.
Developments in terms of external competitiveness point to a gradually worsening situation in the pre-crisis period amongst the EU's Eastern neighbours. Our analysis in chapter 3.2 shows that in general, the large capital inflows exerted upward pressure on the real exchange rates, wages, domestic credit growth and private and public consumption, displaying overheating signs relative to the speed and composition of growth. Mediterranean countries remained more shielded from the building-up of such macroeconomic imbalances, being less exposed to international capital flows and accumulating fewer foreign liabilities.
An important and related phenomenon also discussed in chapter 3.2 is that of dollarisation. Dollarisation ratios have tended to be much higher in the Eastern neighbours than in the Mediterranean neighbours (with the exception of Lebanon). This largely reflects the high inflation and mistrust in the local currencies that characterised the Eastern neighbours in the early 1990s (following the break-up of the former Soviet Union and the need for the newly-created central banks to establish their monetary credibility), combined with the inertia that characterises the currency substitution process. Although the Mediterranean neighbours were confronted with moderate but sticky inflation rates in the 1980s,

Part I Introduction
15
confidence in the local currencies was not so negatively affected. Lebanon's high dollarization rates are essentially explained by the hysteresis of the currency substitution which began with the banking crisis in the 1960s, continued during the civil war and was reinforced by the subsequent political instability. During the global crisis, dollarization ratios generally declined in the Mediterranean countries, whereas they increased further in the Eastern partners, constraining the move towards more exchange rate flexibility in the crisis. In the context of lower dollarisation levels and more effective monetary policy, Mediterranean neighbours seem better positioned to move towards formal inflation targeting in the future.


Part II Regional issues

1. MACROECONOMIC DEVELOPMENTS AND POLICY CHALLENGES
18
1.1. MEDITERRANEAN NEIGHBOURS
Recent macroeconomic developments
The social and political turmoil in spring 2011 has damaged growth prospects throughout much of the region, and has taken some of the momentum out of the recovery which started in 2010. Average real GDP growth was around 5% in 2010 (see Graph II.1.1), while it is set to decline to almost a standstill in 2011, partly on account of a sharp contraction in output in Libya. Exports have been hit, particularly tourism; remittances have been affected in the Maghreb region; and the gradual revival of foreign investment, which was already at low levels due to the global economic crisis, is set to be more drawn out. On the domestic side, strikes have disrupted activity and consumer confidence has been shaken, which will hinder private consumption growth and could lead to more precautionary saving.
Graph II.1.1: Real GDP growth (% change)
-6
-4
-2
0
2
4
6
8
10
2005 2006 2007 2008 2009 2010
Algeria
Egypt
Israel
Jordan
Lebanon
Lybia
Morocco
oPT
Syria
Tunisia
Source: IMF.
Egypt, Tunisia and Libya have been most seriously affected by the unrest and by the combination of domestic and external factors noted above. Output in Libya is set to contract in 2011 by around 28% due to the military conflict (which has crippled oil exports), in sharp contrast to its very high growth rate in excess of 10% for 2010. In Egypt, GDP growth fell to below 2% in FY2010-2011 (July-to-June), from over 5% in FY2009-2010; and in Tunisia, GDP growth is about to stall in 2011 after close to 4% in 2010. The Maghreb region was also collectively badly affected by the fallout from the
conflict in Libya, which created a refugee crisis affecting Egypt and Tunisia that disrupted remittances and contributed to rises in domestic unemployment.
The Syrian economy has been hit by the consequences of civil unrest though reduced tourism flows and the closure of borders with surrounding countries; the latter which, combined with foreign sanctions, will hit export revenues. Jordan has also seen a fall in tourism revenue, and the situation in Syria is harming trade flows between the two countries. Yet although there have been demonstrations in Morocco, Moroccan exports have risen, partly due to higher international prices for phosphate products and iron ore, while tourism revenue has also gone up. This may be the result of a substitution effect given instability in other Maghreb countries, although the terrorist bombing in Marrakech may have a negative affect on tourism going forward.
While countries are mindful of the need to ensure fiscal sustainability, particularly the oil importers, public spending will come under pressure in 2011 from the rise in international commodity prices. The latter will weigh particularly on those countries operating food and fuel subsidy schemes, and where there are public demands for better living standards. Government borrowing costs have increased and external borrowing is set to be more difficult for some time to come. After beginning to narrow in 2010, public deficits are expected to widen in 2011. Public debt, for its part, is set to rise, to around 59% of GDP in 2011.
Unemployment in several countries has started to edge upwards, due to the impact of the regional crisis and because of poorer job prospects abroad. Migration traditionally provides an escape valve for pressure in these countries' domestic labour markets, in particular with respect to many young educated workers who seek employment in Europe. The weaker external environment has put further pressure on policymakers to generate jobs in response to social demands.
Inflationary pressure is increasing, combined with concerns about food security. The key driver of headline inflation is food and energy prices; but

Part II Regional issues
19
core inflation is also increasing in many countries, reflecting a rise in inflationary expectations. Food and fuel products carry a much larger weight in CPI baskets of the region than in industrialised economies. Sharp rises in food prices, in particular, can have a significant impact on livelihoods and quickly give rise to social unrest. This was clearly shown in the food riots of 2008- which occurred in several countries and led to fatalities- as well being a factor behind the widespread unrest in 2011. Egypt is clearly vulnerable in that it has a record of very high and volatile inflation.
Monetary policy throughout much of the region began to be eased in 2009 following the onset of the global economic crisis, through reduced interest rates and, in some cases, lowering of reserve requirements. While inflationary pressure has since picked up, so far only the central bank of Israel has raised interest rates. The rise in commodity prices presents a dilemma for policymakers as although headline inflation is rising, pressure from domestic and external demand is weakening.
Higher commodity prices have also weighed on the current accounts of oil importers (see Graph II.1.2). Earlier this year the FAO’s food price index surpassed its record level of June 2008, and oil prices have risen by around a third compared to the 2010 average. The IMF has estimated that the extra cost of food and fuel imports will add US$15 billion (on average about 3% of these countries' GDP) to the combined import bill of Egypt, Jordan, Lebanon, Morocco, Tunisia, and Syria (IMF 2001a). As a result, there is set to be a further deterioration in the current account balances of oil importers (1).Currency depreciation in some countries will also make the import bill less affordable. Yet while the current accounts of oil importers will deteriorate, the oil exporters in the MENA region, particularly the GCC, may act as a partial buffer in respect of being the source of more export demand, inward investment and remittances.
Investor confidence in the region was shaken during the regional unrest. Equity markets fell in
(1) The IMF (2011c) has estimated that the external financing
needs of the region’s oil importers will exceed US$160 billion during 2011-13, and that their fiscal financing needs are about US$150 billion.
most countries, including in those which were relatively lightly affected such as Morocco and Jordan. There were also disruptions to trading in Egypt and Tunisia, where bourses were closed for 47 and 10 days, respectively. Although most stock indices have stabilised or regained momentum, most notably in Tunisia, the Egyptian stock market has continued to decline; so far by about forty percent in 2011.
Graph II.1.2: Current account balance (% of GDP)
-20
-10
0
10
20
30
40
50
2004 2005 2006 2007 2008 2009 2010
Algeria Egypt Israel Jordan LebanonLybia Morocco Syria Tunisia
Source: IMF
Government bond spreads and the cost of insuring against sovereign defaults in the region rose after the revolution in Tunisia, on speculation of regional contagion. CDS spreads increased the most in Egypt at the start of the uprising (see Graph II.1.3).
Graph II.1.3: 10 Year Bond CDS Spread*
0
50
100
150
200
250
300
350
400
450
12/1/2010
1/1/2011
2/1/2011
3/1/2011
4/1/2011
5/1/2011
6/1/2011
7/1/2011
bps
EgyptIsraelLebanonMoroccoTunisia
Source: Bloomberg * vs 10 year
Governments will find it harder to borrow on international markets. Morocco and Jordan successfully placed international Eurobond issues in 2010, but it may be some time before they are able to make further issuances. International rating

European Commission The EU's neighbouring economies: coping with new challenges
20
agencies downgraded the long-term debt of several countries in the region. Ratings were lowered for Egypt, Morocco and Tunisia, and Libya’s ratings were withdrawn after the start of the military conflict.
Graph II.1.4:Nominal Exchange Rate
96
98
100
102
104
106
108
110
Dec-10
Jan-11
Feb-1 1
Mar-11
Apr-11
May-11
Jun-11Ju l-11
Index100=1 /12/2010
Algerinian DinarEgyptian PoundIsraelian New ShekelJordanian DinarLebanese pound Lybian DinarMoroccan DirhamSyrian PoundTunis inian Dinar
Source: Ecowin REUTEURS.
Many countries in the region operate either managed floats or de facto pegs against the US Dollar. Despite the unrest, nominal exchange rates appreciated in the majority of cases due to the weakness of the US Dollar (see Graph II.1.4). Even in Egypt, there was only a moderate depreciation in the nominal EGP/USD exchange rate.
Although banking sectors which dominate the region's financial system have on the whole remained stable, the share of non-performing loans has started to increase in countries directly affected by social upheaval such as Egypt, indicating that there may be difficulties ahead. So far governments in the region have tended to respond to the unrest by raising public expenditure, including by increasing food and fuel subsidies and raising public sector wages, but this strategy can only work in the short-term.
Macroeconomic policy challenges
The region faces a range of short- and long-term policy challenges resulting from the impact of the global economic crisis and the regional political unrest, which are summarised in this section. Note that the long-term challenges exposed by the social uprisings are dealt with in more detail in the thematic chapter on the Southern Mediterranean.
This section focuses on the crisis-related policy challenges.
Policymakers in the region have to strike a delicate balance between meeting the raised expectations of citizens while maintaining macroeconomic stability. In response to social uprisings, and similar to the reaction that followed the food riots in 2008, policymakers have tended to hike government spending. Although this strategy may be effective in the short term as a way of appeasing social unrest, it could lead to the build up of large fiscal and external imbalances if growth remains weak, could reduce the scope for counter-cyclical fiscal policy in the future, and could lead to increases in government borrowing costs. Many governments in the region were on a tentative path of structural reforms before the social uprisings occurred in spring 2011 and are mindful of the need to maintain sustainable public finances due to the build up of unsustainable debt levels in several countries towards the end of the 1980s. Privatisation programmes can help to create economic opportunities through the private sector whilst keeping down levels of public debt.
The public finances of Mediterranean countries have in general improved over the last twenty-five years. With respect to the main oil exporters, Algeria and Libya, the increase in production capacity and rising oil prices led to regular and sizeable fiscal surpluses up to 2008. With respect to the oil importers, the average size of fiscal deficits had on the whole fallen between the late-1980s, when some countries such as Egypt and Lebanon had been running unsustainable fiscal deficits, and 2008. A gradual improvement in fiscal discipline was clearly visible in Tunisia, which had a fiscal outturn close to balance in 2008, and in Morocco, which ran fiscal surpluses in 2007 and 2008. In addition to more disciplined fiscal policy, the improvement was also linked to advances in public finance management, including tax administration.
However, the global financial crisis led to a rather marked deterioration of fiscal positions, with the average general government deficit of the Mediterranean neighbours increasing. The average deficit narrowed somewhat in 2010 as countries began to overcome the negative effects of the global crisis; but it is again expected to increase

Part II Regional issues
21
markedly in 2011 as a result of the impact of the regional political and economic crisis.
There has been significant progress in reducing the level of government debt, which fell to around 55% of GDP in 2010, compared to above 90% of GDP in 2000 (see Graph II.1.5). The downward trend had been strongest for the main oil exporters, who benefitted from the recent surge in oil prices from 2005-2008. Amongst the oil importers average government debt is around 65% of GDP, and is still highly elevated in certain countries, particularly Lebanon. The decline can be attributed partly to greater fiscal discipline; to improvements in public finance management, including tax collection; to high real GDP growth, particularly during the period 2000-2008; and also, in some cases, to very high nominal GDP growth rates. For example, in Egypt nominal growth averaged 16.5% from 2004-2008 while nominal interests averaged 9% (World Bank, 2009).
Graph II.1.5:Debt to GDP ratio
0
50
100
150
200
250
19901992
19941996
1998 2000 2002 20042006
20082010
Algeria EgyptJordan LebanonLibya MoroccoSyria TunisiaAv erage
Source: IMF
It should also be noted that some countries also benefitted from substantial international budget support, in particular Israel and Jordan, which served to reduce the burden of debt service.
The trend of improving public finances has temporarily reversed since the global economic crisis. Most countries in the region allowed public finances to expand in 2009; which was arguably warranted in order to support demand even though the impact of the global economic crisis on the Mediterranean region was far less serious than in more export-led developing regions such as the Eastern Neighbourhood countries. In 2010 public finances improved slightly, but then deteriorated
again in 2011 due to the regional crisis. Thus while in general improvements have been made, public finances still remain in a vulnerable state in several (particularly oil-importing) countries, and could deteriorate further if the social unrest continues or if the global recovery fails to take hold.
The risks related to a high level of government debt are partly mitigated in many countries by the fact that a high proportion of debt is domestic, long-term and non-tradable. For example, in the case of Lebanon and Egypt domestic debt is around 80% of overall debt. In Egypt, less than 25% of domestic debt is fully tradable and more than 40% is only tradable amongst financial institutions, many of which are state-owned. However, the proportion of foreign debt is elevated in some countries, and the level of foreign-denominated debt is high in Lebanon. High public debt levels have led to a significant debt service burden for many countries. Interest expenditure is approximately 4% of GDP on average, and around 10% of GDP (ECB 2007) in Lebanon.
The public sector still plays a dominant role in the region. While tentative reforms have been ongoing for many years, public spending should be directed to more growth-enhancing areas. On the expenditure side of public finances, a large proportion of public spending is allocated to non-productive items, such as military spending, subsidy schemes, public sector wages and debt service costs. For many countries it is crucial to reform the existing subsidy systems for food and energy, as noted above. Where possible, public expenditure should be focused on growth-enhancing areas such as infrastructure (particularly transport networks), education and health, to support the continued development of economies in the region. These large budget deficits and heavy debt burdens risk crowding out private sector borrowing on domestic capital markets.

European Commission The EU's neighbouring economies: coping with new challenges
22
Table II.1.1:ENP-Med countries - Main economic indicators
Real sector 2007 2008 2009 2010 2011prel proj
Real GDP growth (domestic currency, % change)Algeria 3,0 2,4 2,4 3,3 3,7
Egypt 7,1 7,2 4,7 5,1 1,2
Israel 5,3 4,2 0,8 4,7 4,7Jordan 8,9 7,2 2,3 3,4 4,2
Lebanon 7,5 8,5 9,0 8,0 2,5Libya 6,0 2,8 -2,3 4,2 -28,0
Morocco 2,7 5,6 4,9 3,2 3,7
oPt -1,2 7,1 7,4 9,3 9,0Syria 4,2 5,2 2,9 3,2 0,2
Tunisia 6,3 4,5 3,1 3,1 0,0MED Region (simple average) 5,0 5,5 3,5 4,8 0,1
GDP per capita (EUR)Algeria 2743 3435 2788 3153 3356
Egypt 3934 4217 4367 4548 4264Israel 17052 18800 19184 19543 20717
Jordan 1942 2508 2685 2864 3080
Lebanon 4028 4798 5536 6129 6662Libya 8344 10628 7609 9240 7398
Morocco 2407 2812 2892 3164 2926oPt 1204 1102 1360 1394 1543
Syria 1400 1694 1663 1886 1952
Tunisia 2350 2929 2811 2780 2827MED Region (simple average) 4540 5292 5090 5470 5472
Inflation (% change)Algeria 3,7 4,9 5,7 4,3 5,0
Egypt 8,6 20,2 9,9 10,7 13,5Israel 3,4 3,8 4,0 2,8 3,4
Jordan 5,7 9,6 2,7 5,8 5,2
Lebanon 4,1 10,8 1,2 5,0 6,5Libya 6,2 10,4 2,4 4,5 6,8
Morocco 2,0 3,7 1,0 1,0 2,7oPt 2,7 9,9 2,8 3,7 4,0
Syria 3,9 15,7 3,8 4,4 8,5
Tunisia 3,4 4,9 3,5 4,4 3,5MED Region (simple average) 4,4 9,4 3,7 4,7 5,9
Social indicators
Unemployment rate (%)
Algeria 11,8 11,3 10,2 9,9 n.a.Egypt 8,9 8,7 9,4 9,7 12,2
Israel 7,3 6,1 7,7 6,6 6,5
Jordan 13,1 12,7 12,9 12,5 12,3Lebanon n.a. n.a. n.a. n.a. n.a.
Libya n.a. 17,0 20,7 20,0 n.a.Morocco 9,8 9,6 9,1 9,1 9,2
oPt 22,0 26,0 25,0 24,0 21,0
Syria 8,4 8,6 9,2 9,7 8,1Tunisia 14,1 14,2 13,3 14,0 14,1MED Region (simple average) 11,9 12,7 13,1 12,8 11,9
(Continued on the next page)

Part II Regional issues
23
Table (continued)
Fiscal sector 2007 2008 2009 2010 2011prel. proj.
General government budget balance (% GDP)Algeria (Central Government) 4,4 7,7 -6,8 -3,8 -3,3
Egypt -7,3 -6,8 -6,6 -8,0 -10,5Israel -0,4 -2,6 -5,5 -4,3 -3,2
Jordan -5,8 -5,4 -8,5 -6,2 -5,5
Lebanon -10,8 -9,6 -8,1 -8,7 -9,6Libya 28,6 30,3 7,0 12,9 -7,3
Morocco 0,2 0,4 -2,1 -4,3 -6,2oPt -26,0 -21,6 -25,9 -16,0 -12,8
Syria (Central Government) -3,1 -1,9 -8,0 -3,2 -7,7
Tunisia -2,8 -0,7 -2,6 -3,1 -4,1MED Region (simple average) -2,3 -1,0 -6,7 -4,5 -7,0
Total gross public debt (% GDP)Algeria 12,5 8,2 10,4 10,3 11,4
Egypt 101,0 85,0 80,9 81,2 92,0Israel 77,7 76,7 77,6 75,5 72,8
Jordan (Net Public Debt) 67,5 58,3 64,7 62,4 64,6Lebanon 168,0 157,0 148,0 137,0 137,0
Libya 5,4 4,9 4,3 7,3 8,5
Morocco 62,6 56,8 56,9 61,7 68,5oPt n.a. n.a. n.a. n.a. n.a.
Syria 28,7 25,4 28,0 22,4 34,5Tunisia 45,9 43,3 42,8 40,4 41,7MED Region (simple average) 63,3 57,3 57,1 55,4 59,0
External sectorCurrent account balance (% GDP)Algeria 22,8 20,2 0,3 8,5 9,3
Egypt 0,4 -0,8 -1,7 -1,4 -2,4
Israel 2,9 0,8 3,9 2,7 1,2Jordan -17,6 -9,6 -5,0 -7,0 -8,3
Lebanon -7,6 -9,7 -9,7 -11,3 -11,2
Libya 41,7 41,7 15,6 19,9 -11,4Morocco -0,3 -6,4 -5,9 -7,0 -11,0
oPt -0,8 8,7 1,9 -8,9 -8,9Syria 1,1 -1,4 -2,8 -1,3 -3,4
Tunisia -2,4 -3,8 -2,8 -4,8 -5,7MED Region (simple average) 4,0 4,0 -0,6 -1,1 -5,2
Foreign direct investment (net, % GDP)
Algeria 1,0 1,4 1,8 1,5 1,0Egypt 8,1 7,5 3,6 3,7 2,3
Israel 1,2 0,9 1,4 -1,2 -1,0
Jordan 11,2 12,4 9,4 9,0 9,0Lebanon 7,5 8,8 10,7 10,0 9,7
Libya 2,0 0,8 -2,6 1,6 n.a.Morocco 2,9 2,3 0,8 2,5 n.a.
oPt n.a. n.a. n.a. n.a. n.a.
Syria 2,8 4,2 3,7 3,2 2,7Tunisia 4,0 5,7 3,3 3,3 2,6MED Region (simple average) 4,5 4,9 3,6 3,7 3,8
(Continued on the next page)

European Commission The EU's neighbouring economies: coping with new challenges
24
1.2. EASTERN NEIGHBOURS
Recent macroeconomic developments
In 2010 the economies of the EU's Eastern neighbours started to grow again after the 2009 recession, and the recovery is expected to consolidate in 2011. The recovery is driven by higher commodity prices and the gradual normalisation of trade and capital flows to the region. At the same time, the recent economic slowdown in major advanced economies is also weighing down on the region's growth prospects. Together with countries in Central and Eastern Europe, the region had been among the emerging markets hardest hit by the crisis. In both cases growth, fuelled by large international capital inflows, had been very rapid and increasingly unbalanced prior to the crisis. The sudden collapse of investor confidence, global trade flows and easy access to foreign savings plunged the economies into a sharp recession, with real GDP declining by 5.3% in 2009 (see Graph II.1.6). Only Azerbaijan and Belarus escaped negative growth rates in 2009, while at the other extreme Ukraine and Armenia recorded a double-digit contraction in output. In 2010 the recovery unfolded at a fairly brisk pace and real GDP grew by 5.2%, while it is projected to moderate to about 4.5% in 2011. However, growth lagged behind other emerging markets, such as developing Asia and Latin America, despite a favourable base effect. This illustrates the fact that recovery of domestic demand and foreign investor confidence, together with the repair of banking sector vulnerabilities, are still ongoing.
Real GDP rebounded quite strongly in Belarus (7.6%), Moldova (6.9%) and Georgia (6.4%) in 2010 (see Graph II.1.7). However, Belarus' growth did not prove sustainable as it experienced a balance of payment crisis in 2011.
Graph II.1.6: Real GDP growth (regional comparison)
-14
-9
-4
1
6
11
2005 2006 2007 2008 2009 2010
Source: I MF.
% change
CIS Average
EU27
Developing Asia
Lat in America and the Caribbean
Moldova and Georgia reached again their pre-crisis output levels due to a strong growth of exports and a rebound in private consumption and investments. Real growth in Russia and Ukraine was also in excess of 4% in 2010, but could not make up for the output losses in the recession. Only in Armenia was growth very sluggish, at 2.1%, mainly due to a contraction in agricultural output as a result of poor weather conditions. Although positive throughout the crisis, real growth in Azerbaijan decelerated to 5% in 2010, as external conditions slowed down Azerbaijan's fast-growing oil economy. In general there has been a strong recovery of exports (see Graph II.1.8), while the recovery of domestic demand picked-up only gradually. In 2011 the recovery is expected to consolidate and real GDP to grow at about 4.5% in
Table (continued)
External public debt (% GDP) 2007 2008 2009 2010 2011prel. proj.
Algeria 4,2 3,3 3,8 2,8 2,2
Egypt 24,8 19,8 15,7 14,2 14,5Israel 53,9 43,2 47,1 45,1 44,2
Jordan 43,6 22,6 21,7 19,1 16,5Lebanon 194,1 172,0 171,0 160,0 162,0
Libya 6,7 5,8 8,5 7,9 10,0Morocco 27,3 23,4 26,2 29,7 30,7
oPt n.a. n.a. n.a. n.a. n.a.Syria 17,0 14,1 14,6 14,4 13,4
Tunisia 51,8 45,9 49,4 48,6 49,5MED Region (simple average) 47,0 38,9 39,8 38,0 38,1
Note: See the country chapters for the sources and clarifications.

Part II Regional issues
25
the region, in line with the close to 4% advance in economic activity in Russia. However, as Belarus suffers increased pressures on the external side, uncertainties regarding its real sector performance grow.
Graph II.1.7: Real GDP growth
-15,0
-10,0
-5,0
0,0
5,0
10,0
15,0
20,0
25,0
30,0
35,0
2005 2006 2007 2008 2009 2010 2011(proj)
Sources: I MF, nat ional authorities.
% change
Armenia AzerbaijanBelarusGeorgiaMoldovaUkraineRussia
Graph II.1.8: Exports of goods and services (volume)
-30
-20
-10
0
10
20
30
40
50
2005 2006 2007 2008 2009 2010 2011
Source: I MF
% change
Azerbaijan Belarus
Georgia Moldova
Ukraine Russia
In many of the economies, GDP per capita in Euros grew strongly in 2010, but did not reach the pre-crisis levels. This was unsurprising, as many exchange rates depreciated heavily in the crisis and not all GDPs have reached their pre-crisis levels in real terms. At the same time, the indicator grew significantly above its 2008 level in Azerbaijan, reflecting the international rise of oil and gas prices which translated into a very high growth of nominal GDP in 2010. A recovery of GDP per capita in Euros slightly above the 2008 mark was also recorded in Belarus, Georgia and Moldova; whereas Ukraine has still a wide gap to overcome.
After moderating to 6.2% in 2009 from the double-digit pre-crisis rates, average annual inflation picked up again to slightly above 8% in 2010. The main drivers were the rising global food and commodity prices, but also the still accommodative domestic monetary policies, the
resumption of credit growth and the pick-up in domestic demand. The highest inflation rate, close to 10% y-o-y, was recorded in Ukraine. In 2011, average annual inflation in the region is projected to increase moderately in most of the countries. Belarus is likely to be an outlier again, with annual average inflation estimated at close to 40% on account of the big depreciation of the currency and the lax monetary stance.
The resumption of economic growth did not bring about a significant decline in unemployment rates, which in most economies remained above their pre-crisis level in 2010. The unemployment rate continued to increase in Moldova, and to a lesser extent in Armenia. It dropped, however, by almost 1 percentage point in Russia and Ukraine and remained at very low levels of close to 1% in Belarus and Azerbaijan (as reflected by the statistics of registered unemployment). At double-digit rates, unemployment in Georgia remains the highest in the region. The slow pace of improvement in the labour market situation is weighing on the strength of the recovery via weaker private consumption. Yet the decline in unemployment in Russia represents a bright spot, supporting the other countries in the region both directly via increased domestic demand and indirectly via increased remittances from the guest workers in Russia.
After a widening of general government budget deficits in 2009, fiscal policy was tightened in both 2010 and 2011. However, big differences emerged between the EU's Eastern neighbours. Countries like Armenia, Georgia, Moldova and Ukraine reduced their budget deficits by around 2-4% of GDP in 2010, mainly by curbing public spending, in line with the lower revenue intakes (relative to GDP) post-crisis. In contrast, the budget deficit continued to widen in Belarus.
In 2011 a further reduction in fiscal deficits is foreseen across the region, to less than 3% of GDP on average. First and foremost, Russia aims at exiting the fiscal stimulus and reducing the central government budget deficit to below 3% of GDP. However, fiscal retrenchment is likely to prove difficult as most of the fiscal expansion in the crisis took place via permanent measures. In addition, Georgia and Ukraine are expected to lead the budget rebalancing with fiscal savings amounting to about 3% of GDP in both economies.

European Commission The EU's neighbouring economies: coping with new challenges
26
The budget deficit is projected to grow only in Azerbaijan.
EU's Eastern neighbours' public debt is relatively low, even after it increased by almost 10 percentage points to about 25% of GDP on average in 2009. Average public debt has continued to grow in 2010, to about 27% of GDP, and in 2011, when it is likely to exceed 30% of GDP. At the end of 2011, countries like Armenia, Belarus and Ukraine will have doubled or even trebled their 2008 public debt levels relative to GDP. The situation in Armenia requires increased attention, with the country moving towards a public debt level close to 50% of GDP- the highest in the region. Public debt remains particularly low as a share of GDP in the two oil producers, Azerbaijan and Russia.
The rebalancing of the external positions, i.e. of current account deficits, continued in the EU's Eastern neighbours' economies in 2010 supported by IMF programmes and EU macro-financial assistance. Prior to the crisis, strong international capital inflows, including surging cross-border bank lending, contributed to a significant widening of current account deficits in the region (see Graph II.1.9). As large commodity and oil producers, Azerbaijan and Russia were exceptions and consistently recorded large current account surpluses (to the tune of 33% of GDP in Azerbaijan in 2008). The sudden halt in private capital inflows at the onset of the crisis, which translated into net capital outflows in some cases and to large depreciation pressures on the exchange rate, led to a narrowing of the average current account deficit from 3.8% of GDP in 2008 to 2.7% of GDP in 2009 and further to 2% of GDP in 2010. The largest adjustments of the current account deficits occurred in Georgia, Moldova and Ukraine between 2008 and 2009. Rather exceptionally, Belarus' current account deficit continued to widen during the crisis from 8.6% of GDP in 2008 to about 15.5% of GDP in 2010, illustrating the protracted response to the changes brought about by the crisis and explaining the persistent pressures on the exchange rate. In 2010, the current account surpluses of Azerbaijan and Russia grew again on the back of higher international prices for oil and other commodities. Overall, in the absence of the official lending from the IMF, EU and other IFIs, the adjustment of external imbalances would have been more severe.
In 2011, the current account deficits are expected to widen again in Georgia, Moldova and Ukraine, as the economic recovery continues and capital inflows gain traction.
Graph II.1.9:Current account balance
-40
-30
-20
-10
0
10
20
30
40
2004 2005 2006 2007 2008 2009 2010 2011(proj)
Source: IMF.
% of GDP
Armenia Azerbaijan Belarus GeorgiaMoldova Russia Ukraine
As the large pre-crisis capital inflows dwindled in the crisis, both cross-border lending and foreign direct investment were affected. Net FDI dropped on average from the high level of 6.3% of GDP in 2008 to 4% of GDP in 2009, and 3.6% of GDP in 2010. A moderate revival to about 4.2% of GDP is expected for 2011. After declining by a double-digit rate in 2009, remittances began to grow again in both 2010 and 2011. They represent an important external financing source in most economies, except for Belarus and Russia. Despite their growth, remittances have not recovered in general to their 2008 peak level and could moderate further due to the on-going global economic slowdown.
Contingent to cross-border lending, domestic credit grew very rapidly in the pre-crisis period, fuelling the economic boom in many economies and then retrenched considerably at the onset of the crisis (see Graph II.1.10). In 2009 the credit growth rate dropped on average to a single-digit rate, while in Georgia and Moldova it even fell into negative territory. As of 2010, credit growth picked up again in all economies and reached on average around 20%. This trend continued into 2011. Again, Belarus represents an outlier as the growth of credit continued to be very strong in the crisis, outpacing all other economies. The banking sectors are in general well capitalised, but they still suffer from lingering vulnerabilities from the crisis and in particular from high non-performing loan rates. However the NPLs ratios are on a declining

Part II Regional issues
27
trend in several countries such as Armenia, Moldova, Russia and Ukraine.
Graph II.1.10: Credit growth
-20
0
20
40
60
80
100
2007 2008 2009 2010*Credit to the private sector **Credit to the whole economy ***Bank credit to the private sector
Source: IMF.
y-o-y % change
Armenia* Azerbaijan**Belarus** Georgia***
Moldova** Russia
Finally, exchange rates started to recover from the lows reached during the crisis. Depending on the specific exchange rate arrangements, domestic currencies started to appreciate slightly in 2010 and early 2011, either both in nominal terms and real terms – in Armenia, Moldova and Russia or mostly in real terms – in Azerbaijan, Georgia, and Ukraine, as these countries still run de facto pegs or tightly managed floats against the US Dollar or multicurrency baskets. In Russia for example, the rouble now lies within the central bank's range of 33.4-36.4 against the bi-currency basket and the real effective exchange rate is close to where it was on the eve of the crisis. The situation in Belarus is again somewhat different, as large depreciation pressures have recently been exerted on the rouble. Another large devaluation occurred (1) as the gap between the exchange rate on the interbank market and the official one has been widening.
Macroeconomic policy challenges
The fact that EU's Eastern neighbours were hit quite hard by the crisis is illustrated primarily by their reliance on international official financing in order to weather the crisis. Out of a group of seven, five countries - Armenia, Belarus, Georgia, Moldova and Ukraine – secured IMF supported programmes, which in close cooperation with the EU and other multilateral institutions smoothened the adjustment process via external funding and provided and an external anchor for domestic policy reforms and repair of investor confidence. The two countries in the group which did not need
(1) The rouble lost about 30% in May 2011.
international support – Azerbaijan and Russia – could rely on their "rainy day" funds, built with the help of revenues from their hydrocarbon exports, to provide fiscal stimuli and defend their domestic currencies.
Viewed in this context, the Eastern neighbours face two main types of policy challenges:
• In the short-run, it appears necessary to allow the crisis-induced adjustments in the real economy to play out, to consolidate macro-economic stability and the economic recovery, and to graduate from the IMF programmes;
• In the medium- and long-run, measures to ensure a more balanced growth model and to prevent such crises in the future should be at the forefront of the policy agenda.
The crisis signalled the need to correct the unsustainable pre-crisis growth model, which was driven by credit booms, rapid domestic demand growth and large capital inflows into the non-tradable sector. In general, the countries have allowed their economies to adjust in nominal and real terms to new equilibria at various speeds, depending on their financial or external sector vulnerabilities. The sharp drop in economic activity in 2009 is a witness to the adjustment of the real sector. Belarus represents an exception as it tried to artificially maintain the pre-crisis output and consumption levels by shifting the composition of international capital inflows from private to official sources. Although the external imbalances should have been self-correcting, i.e. a drop in capital inflows would result in a reduction of current deficits and domestic demand rather than a depletion of reserves, many countries such as Armenia, Belarus, Moldova, Russia and Ukraine used a large amount of reserves before they allowed exchange rates to depreciate. This was linked to the severity of the capital outflows and concerns about the soundness of private sector balance sheets.
Supporting confidence and stabilizing the banking sectors was a priority, especially as some countries like Ukraine, Russia and to a lesser extent Moldova and Georgia had to deal with capital outflows with strong deleveraging pressures in the banking sector. In some cases (Russia and

European Commission The EU's neighbouring economies: coping with new challenges
28
Ukraine) the authorities intervened to provide direct capital or liquidity support to individual institutions, in other they only increased liquidity in general in the banking sector. Monetary policy rates were also briefly increased, for example in Russia and Ukraine, in order to defend the domestic currencies. At a later stage, the countries that resorted to IMF support or benefitted from pre-crisis fiscal buffers and large international reserves were able to allow a temporary relaxation of their monetary and fiscal policies in order to cushion the hardship of the adjustment.
Now that the recovery is underway, the biggest short-term policy challenge is to carry out the fiscal consolidation process, i.e. to bring in line public spending to the post-crisis revenue level. The fiscal illusion built over windfall revenues generated by the domestic demand booms has prevented a more counter-cyclical policy in the pre-crisis period, thus forcing many countries among the Eastern neighbours to seek external finance assistance once the crisis erupted. Armenia, Georgia, Russia and Ukraine are faced with the biggest remaining challenges in terms of fiscal consolidation and withdrawing the fiscal stimulus. As inflationary pressures picked up again in 2010 and 2011, the countries in the region must steer monetary policy carefully to keep inflation under control, while not choking the recovery. Most countries, including Armenia, Azerbaijan, Moldova, Georgia and Russia, have already started to tighten their monetary policies by a combination of increase of refinancing rates and reserve requirements.
The Eastern neighbours have continued the repair of their financial sectors. Although credit has in general resumed its growth, vulnerabilities remain, primarily linked to the high levels of non-performing loans (NPLs). In Ukraine, bank recapitalisation and resolution are still on the agenda, with NPLs remaining in excess of 15% of total loans. The authorities have created a "bad bank" to which to transfer NPLs. Georgia has tightened prudential requirements for banks and Russia has not removed yet its unsecured loans to banks. At the same time, in Armenia and Moldova NPLs ratios are coming down from double-digit levels.
Some of the countries are also graduating from the IMF programmes. This is encouraging, as it means
that they are successfully consolidating macroeconomic stability and making progress with structural reforms, but also that they are regaining access to financial markets and therefore have more options to cover their external financing needs. Georgia and Ukraine have managed to return to capital markets, with one sovereign Eurobond issue in April 2011 by the former and several issues by the latter. Belarus also placed a Eurobond in January 2011, but since then its access to international capital markets has been severely curtailed. So far, Moldova's macroeconomic performance under its IMF EFF/ECF financing arrangements was beyond initial projections.
The medium- and long-term policy challenges relate primarily to rebalancing growth on a more sustainable path that will avoid such balance of payment crises in the future. The focus should be on both macroeconomic and structural instruments that prevent economic overheating and foster a stronger role for the tradable sectors in the region. In this context, stricter macro-prudential measures to control credit growth and capital inflows should be considered. This is particularly relevant for those Eastern neighbours who prefer fixed exchange rate regimes. However, exchange rate arrangements underwent important changes in the crisis, as most of the economies allowed more exchange rate flexibility and a depreciation of their currencies. Moreover, Armenia, Moldova and Ukraine are taking measures to improve the monetary policy transmission channels in order to move towards inflation targeting and floating exchange rates.
At the same time, capital inflows should flow more into the tradable sector, strengthening the productive capacity of the economies. In this context, further improvements of the business environment appear necessary (see chapter on Economic Governance and Investment Climate), together with an improved financial sector regulation and supervision. In addition, strengthening the tradable sector should be accompanied by bigger efforts to liberalise foreign trade. Indeed, countries in the region are working to remove obstacles to trade not only with major trade partners such as the EU via WTO membership, but also among the CIS countries (see Box II.1.1).

Part II Regional issues
29
Box II.1.1: The Customs Union between Belarus, Kazakhstan and Russia
A customs union is a type of trade bloc which is composed of a free trade area with a common external tariff. The participating countries agree on a common external trade policy, but in some cases they apply different import quotas. Having a common competition policy is also helpful to ensure a level playing field among economic agents. There are good reasons for establishing a customs union, which normally include increasing economic efficiency and establishing closer political ties between the member countries. But there is also a risk of trade diversion and reduced welfare, in particular for the countries that pass to a higher common external tariff and increase the protection of their domestic producers. One example is the recently formed Customs Union between Belarus, Russia and Kazakhstan (CU). Effects on trade and economic developments in the CU are difficult to analyse at this stage, as the CU came into effect only in July 2010.
In the aftermath of the break-up of the former Soviet Union, trade among the newly-developed independent countries collapsed (the estimated drop in trade volumes varies, but reached as much as 50% between 1992 and 1995). Countries in the Baltic region decided early on to reorient their trade towards the EU and the rest of the world. The other twelve countries – members of the Commonwealth of Independent States (CIS) – attempted to maintain trade within the region through a variety of policy interventions including the establishment of a Free Trade Agreement (FTA). The first agreement on the creation of an economic union between Russia and Belarus dates back to 1995. Kazakhstan and Kyrgyzstan, followed by Tajikistan, joined the agreement in 1996.
In November 2009, the governments of Belarus, Kazakhstan and Russia signed an agreement creating a customs union. While driven primarily by political considerations, this new arrangement is intended to maximize the benefits of the already strong trade relationship and to create an enlarged market. In January 2010, the three countries eliminated most duties on mutual trade, and moved to harmonize customs rules. In July 2010, member countries
adopted a common customs code, finalized customs rules, and began to redistribute collected duties. Russia’s share of total customs duties collected in the CU is 88%; Kazakhstan’s share is 7.3% and Belarus’ 4.7%.
The three countries intend to pursue economic integration and in July 2011 they removed all customs borders between themselves. The authorities see this as the first step to a single economic space, which they plan to create by 2012 and which may include other countries such as Kyrgyzstan, which has shown interest in joining the union. Recently, Russia called on other former Soviet Republics to join the future so-called "Eurasian Union". A single economic space should provide for the free movement of goods, assets and labour, and lay the basis for better coordinated economic policies across these countries. The ultimate aim of the customs union is to create a single market of some 170 million people, boosting trade and investment between its members.Eventually the introduction of a single currency could also be contemplated.
For Belarus, the CU is expected to bring significantbenefits due to its trade in crude oil supplied from Russia and in petroleum products. In the past, while Belarus would import Russia's crude oil duty-free, itwas expected to transfer 85% of the export duties to Russia in return. However, Belarus did not comply with its legal obligations vis-à-vis Russia, which led to a number of trade disputes. Supported by CU relations, the resolution of the dispute in January 2010 led to a new agreement that allows Belarus to import duty-free only the part of crude oil that it uses for internal consumption. This agreement reduces the price subsidy on imported oil from 30% to 15% of the average oil price.
For Kazakhstan, Russia is already a major trading partner, accounting for about 20% of the Kazakh total trade. The CU allows Kazakhstan to benefit from enhanced access to the large Russian market and from the eventual free movement of labour and capital. In particular, Kazakhstan's agricultural and commodity exports should benefit from the removal of customs duties. At the same time,
(Continued on the next page)

European Commission The EU's neighbouring economies: coping with new challenges
30
Box (continued)
export gains in these sectors and the increased exposure of the Kazakh manufacturing sector to competition from more established Russian companies could delay Kazakhstan’s plans for economic diversification. However, it may result in more competitive and efficient nascent industries. In addition, trade diversion may also arise since - as part of the agreement - Kazakhstan’s import tariffs on most goods from outside the union increased to the higher levels required by Russia.
Russia has been the prime initiator of the CU for several reasons. First, Russia can gain easier access to the markets of the other members of the CU. Second, significant quantities of Russia-China trade go through Kazakhstan and a significant amount of Russia-EU trade goes through Belarus. Thus Russia seeks to stop the uncontrolled imports of a wide range of manufactured goods (including automobiles, clothing and pharmaceuticals), which represent a strong competition to Russian companies and industries. Third, there is also a political dimension to the CU. Indeed, Russia has long been lobbying Ukraine to join the CU as well, in a bid to strengthen its political ties with Ukraine. Ukraine is, if anything, of even greater importance to Russia than Belarus and Kazakhstan both as a market and as a transit country, notably owing to its gas transit system connecting the EU’s consumers to Russian sources of gas. However, the Ukrainian authorities have so far declined to enter the CU; preferring instead to pursue negotiations on a Deep and Comprehensive Free Trade Agreement with the EU, which is widely seen as incompatible with membership in the CU. Fourth, Russia is also interested in using the CU as an instrument to prevent the uncontrolled exports of its raw materials through the territories of neighbouring states, particularly Belarus. Fifth, the CU also helps to streamline the non-tariff barriers and changes agricultural subsidy rates. Through a revision of subsidy quotas, Russia may increase its own subsidies to agriculture before joining the World Trade Organization.
Another potential candidate for the CU is Kyrgyzstan. In April 2011, Kyrgyzstan applied for membership of this CU. However, the negotiations over the terms of joining CU may take quite some time (from two to five years) and the economic impact of such decision has yet to be properly assessed. The main benefits Kyrgyzstan expects to obtain from entering this CU, apart from possible foreign policy considerations, is to preserve oil
supplies from Russia and Kazakhstan at favourable prices and to limit the risk of disruptions in trade flows with these important trading partners (such as last year’s temporary border closure with Kazakhstan).
Entering the CU would entail a number of significant costs. First, it is likely to clash with Kyrgyzstan's WTO commitments, as Kyrgyzstan would be the only CU member with WTO membership. More importantly, joining the CU would restrict the important transit trade with China. Since both China and Kyrgyzstan are WTO members, Kyrgyzstan imports Chinese goods cheaply (gray imports are also pervasive) and re-exports them to neighbouring countries, with which Kyrgyzstan has a free trade agreement under the CIS framework.
Although the decision to join the CU has been formally taken, it is expected to take a long time to negotiate; such that, by the time Kyrgyzstan may join, Russia, Kazakhstan and possibly Belarus are likely to have joined the WTO and, in that context, to have reformed accordingly their trade regimes (including through a possible reduction of the CET) such that the costs for Kyrgyzstan of joining the CU would be more acceptable.
A number of issues need to be resolved to achieve free trade in goods and services within the borders of the CU. While member countries have agreed on mutual recognition of import certificates from other countries, in practice these agreements still need to be fully implemented and require synchronising registries of suppliers from other countries. Transport tariffs differ significantly between the members of the union, and are subject to intense negotiations. These issues will need to be resolved to ensure that each country reaps the full benefits of free trade between the member countries.
Since the customs union has been in operation for less than a year, it is too early to evaluate the impact on the direction of trade. The impact of the CU on some of the small neighbouring countries also deserves attention. International experience of successful trade agreements shows that regional integration works better if conceived as a stepping stone toward multilateral trade liberalization. This is particularly important, as the establishment of the CU has wider consequences for the EU's bilateral trade relations with the countries of the CU.

Part II Regional issues
31
Table II.1.2:ENP-East countries - Main economic indicators
Real sector 2007 2008 2009 2010 2011prel. proj.
Real GDP growth (domestic currency, % change)
Armenia 13,7 6,9 -14,2 2,1 4,6Azerbaijan 25,0 10,8 9,3 5,0 1,5
Belarus 8,6 10,2 0,2 7,6 5,0
Georgia 12,3 2,3 -3,8 6,4 5,5Moldova 3,0 7,8 -6,0 6,9 6,0
Russia 8,1 5,6 -7,9 4,0 3,7Ukraine 7,9 2,3 -14,8 4,2 4,7East countries Region (simple average) 11,2 6,6 -5,3 5,2 4,4
GDP per capita (EUR)
Armenia 2081 2470 1916 2184 2658Azerbaijan 2647 3778 3457 4344 5026
Belarus 3368 4302 3522 4388 4278
Georgia 1679 1987 1777 1998 2251Moldova 902 1160 1097 1234 1564
Russia 6686 8016 6243 7875 8919Ukraine 2235 2650 1829 2266 2536East countries Region (simple average) 2800 3480 2835 3470 3890
Inflation (average annual % change)
Armenia 4,4 9,0 3,5 7,3 9,4Azerbaijan 16,7 20,8 1,5 5,7 n.a.
Belarus 8,4 14,8 13,0 7,7 38,0Georgia 9,2 10,0 1,7 7,1 9,5
Moldova 12,4 12,7 0,0 7,4 7,9
Russia 9,0 13,7 10,5 9,0 7,8Ukraine 12,8 25,2 15,9 9,4 9,3East countries Region (simple average) 10,4 15,2 6,6 7,7 13,6
Social indicatorsUnemployment rate (%)
Armenia 6,7 6,3 6,9 7,0 6,8Azerbaijan 0,9 0,9 0,9 1,0 1,0
Belarus 1,0 0,8 0,9 0,9 0,7Georgia 13,3 16,5 16,9 16,3 16,2
Moldova 5,1 4,0 6,4 7,4 n.a.
Russia 6,1 6,4 8,4 7,5 7,3Ukraine 6,9 6,9 9,6 8,8 7,9East countries Region (simple average) 5,7 6,0 7,1 7,0 n.a.
Fiscal sectorGeneral government budget balance (% GDP)Armenia (Central Government) -2,2 -1,2 -7,9 -4,6 -3,9
Azerbaijan -0,2 0,2 -0,7 -0,9 -1,3Belarus 0,4 1,4 -0,7 -1,8 0,0
Georgia -4,7 -6,3 -9,2 -6,6 -3,6
Moldova -0,2 -1,0 -6,3 -2,5 -1,9Russia (Central Government) 5,6 7,1 -4,3 -4,0 -2,7
Ukraine -2,0 -3,2 -8,7 -6,5 3,5
East countries Region (simple average) -0,5 -0,4 -5,4 -3,8 -1,4
(Continued on the next page)

European Commission The EU's neighbouring economies: coping with new challenges
32
Table (continued)
Total gross public debt (% GDP) 2007 2008 2009 2010 2011prel. proj.
Armenia 16,1 16,2 40,6 39,9 45,2
Azerbaijan (external) 7,7 6,5 7,9 10,2 n.a.Belarus 11,4 13,4 21,7 26,5 46,0Georgia 21,5 27,6 37,3 39,5 41,1
Moldova 26,8 21,3 24,4 26,3 25,1Russia 8,5 7,8 10,9 9,9 9,2Ukraine 12,3 20,5 35,3 41,3 42,4East countries Region (simple average) 14,9 16,2 25,4 27,7 34,8
Monetary sectorDegree of monetisation (M2/GDP, %)Armenia n.a. n.a. n.a. n.a. n.a.
Azerbaijan (M3/GDP) 22,0 21,2 24,5 25,3 n.a.Belarus (M3/GDP) 25,2 23,9 27,7 30,9 n.a.Georgia (M3/GDP) 23,7 24,1 21,6 26,3 31,2
Moldova (M3/GDP) 51,2 50,3 54,1 51,6 n.a.Russia 39,2 31,1 38,8 43,6 n.a.Ukraine 54,3 54,1 53,1 54,5 n.a.East countries Region (simple average) 35,9 34,1 36,6 38,7 n.a.
Dollarisation in bank deposits (%)Armenia 35,6 43,8 68,3 68,6 n.a.Azerbaijan 51,3 59,3 58,9 51,3 n.a.
Belarus 38,0 38,9 49,4 51,4 51,6Georgia 65,0 64,6 73,6 71,1 70,6Moldova 43,3 41,1 49,3 45,6 n.a.
Russia 38,7 44,0 53,9 42,3 n.a.Ukraine 32,3 43,9 48,3 42,6 n.a.East countries Region (simple average) 43,5 47,9 57,4 53,3 n.a.
External sectorCurrent account balance (% GDP)Armenia -6,4 -11,8 -16,0 -14,0 -11,5
Azerbaijan 28,9 33,6 23,7 26,1 28,5Belarus -6,7 -8,6 -13,0 -15,5 -13,4Georgia -20,0 -22,6 -11,2 -9,6 -10,8
Moldova -15,2 -16,2 -8,5 -8,3 -11,2Russia 6,1 6,2 7,4 9,5 10,8Ukraine -3,7 -7,1 -1,5 -2,1 -3,9
East countries Region (simple average) -2,4 -3,8 -2,7 -2,0 -1,6
Foreign direct investment (net, % GDP)Armenia 7,6 8,1 8,5 6,1 6,0Azerbaijan -16,4 -1,1 0,3 1,0 n.a.Belarus 4,0 3,5 3,6 2,4 1,2Georgia 16,4 12,2 6,1 5,0 5,5
Moldova 12,1 11,7 2,3 3,4 4,5Russia 4,3 4,5 2,9 3,1 n.a.Ukraine 6,5 5,5 4,0 4,2 3,8East countries Region (simple average) 4,9 6,3 4,0 3,6 4,2
(Continued on the next page)

Part II Regional issues
33
Table (continued)
External debt (% GDP) 2007 2008 2009 2010 2011prel. proj.
Armenia (public) 15,7 13,5 34,7 36,0 36,9Azerbaijan 21,3 19,1 19,9 21,4 20,8
Belarus 27,7 25,0 44,9 52,4 n.a.
Georgia 35,7 44,0 58,1 61,9 62,0Moldova 75,6 67,1 80,0 82,0 n.a.
Russia 31,7 30,6 37,6 31,9 n.a.Ukraine 56,0 56,5 88,2 85,1 85,0CIS Region (simple average) 37,7 36,5 51,9 53,0 51,2
Note: See the country chapters for the sources and clarifications.

2. ECONOMIC GOVERNANCE AND INVESTMENT CLIMATE
34
2.1. MEDITERRANEAN NEIGHBOURS
One reason for the region’s relatively poor growth performance in the last decades is weak economic governance. While several countries in the South Mediterranean have put in place substantial economic and institutional reforms towards improving the efficiency of public services, reducing bureaucracy, overcoming deficiencies in the judicial system, and fighting corruption, there is still significant room for further improvement. Furthermore, improving the business environment so as to encourage entrepreneurship and attract investments is another important challenge.
A number of structural indicators (see Box II.2.1) developed by the World Bank, the World Economic Forum and Transparency International provide an overall assessment of the economic governance framework and the investment climate in each of the Southern Mediterranean countries. However, except for the Global Competitiveness Index and the Doing Business report, they do not account for the regional political crisis of 2011; meaning that several of these countries' scorings may have to be downgraded following the ongoing unrest in the region. On the other hand, the recent political developments can potentially offer a stimulus to these countries for improving several areas of economic governance in the future, depending on the traction of the new liberalisation trends currently sweeping across the region.
According to the World Bank’s Worldwide Governance Indicators, the South Mediterranean countries tend to score relatively low in terms of transparency, voice/accountability, and control of corruption; but they perform better when it comes to political stability and the rule of law. According to the latest available data for 2009, the best performer in all indicators except political stability is Israel. When it comes to voice and accountability, Israel is followed by Lebanon and Morocco. Jordan and Tunisia score fairly well in the areas of rule of law, control of corruption, regulatory quality and government effectiveness, whereas Libya appears in the lowest position.
The World Economic Forum's Global Competitiveness Index (GCI) provides a more updated picture of economic governance trends in
the region, as it takes into account the significant negative impact of recent disturbances on national investment climates. The countries most deeply engulfed by the "Arab Spring" – Egypt, Tunisia and Jordan – dropped severely in the rankings, whereas the other countries broadly maintained their previous positions or slightly improved. Libya, another country which suffered greatly in its recent armed conflict, was not even assessed in this year's report because of the social unrest on the ground.
The countries in the Southern Mediterranean region with the best performance overall are Israel and Tunisia (22nd and 40th position respectively). However, whereas Israel moved up two positions, Tunisia dropped by eight due to increased instability of the business environment during the uprising, a less favourable assessment of public and private institutions, and a sharp deterioration of the security situation (dropping from the 14th to the 47th position for the latter). Nevertheless a healthy macroeconomic environment was maintained in Tunisia; although the economic impact of the domestic and regional political events, and social pressure to delay necessary reforms, could endanger this dimension of the investment climate as well.
Jordan's investment climate has also deteriorated, as the country dropped six positions to 71st overall. The assessment of the health system and primary education both recorded a relative worsening, as did the development of the financial market. The most important challenges remain labour market efficiency and the macroeconomic environment, although both their scorings improved slightly. Egypt moved down 13 positions compared to the previous year’s assessment, ending up 94th overall, mainly on account of the country’s numerous structural challenges which also contributed to the uprisings. In contrast to Tunisia, the macroeconomic environment is also quite challenging. The most important weaknesses relate to labour market efficiency and the quality of education. On the other hand, Egypt’s main strength is the sheer size of its market, allowing businesses to exploit economies of scale.
Morocco and Algeria are ranked higher than Egypt (73rd and 87th respectively). Morocco advanced two positions as it improved in several areas,

Part II Regional issues
35
Box II.2.1: Indicators of economic governance and investment climate
Economic governance denotes the set of institutional rules that govern human interaction and promote economic prosperity by facilitating production and exchange, i) within the market, ii) inside business organizations, and iii) within a political governance framework. Regarding markets, economic governance may take the form of laws, regulations and enforcement mechanisms that protect property rights and enable the trade of property. Regarding business organizations, one might think of the rules that monitor transactions inside business firms. Regarding political governance, there is a strong link to economic governance here since governments frequently play a major role in funding pure public goods, and have a strong influence on the performance of the public sector. Furthermore, one must consider public finance management, corruption, transparency and accountability as key factors affecting economic governance. Moreover, the efficiency and size of a country’s public sector significantly impacts upon its economic performance. The leaner and more transparent a country's public administrations are, and the more accountable the political elite are in the eyes of citizens, then the greater the chance of successfully introducing economic reforms and boosting economic growth. Hence governance and public institutions are considered to be important determinants of a country's investment climate. There are three sets of cross-country indicators that are generally used for assessing the economic governance: the Worldwide Governance Indicators (WGI) provided by the World Bank; the World Economic Forum's Global Competitiveness Index (GCI); and Transparency International's Corruption Perception Index (CPI). These are usually complemented by the World Bank's Doing Business (DB) reports, which provide an assessment of the business environment of a country.
The Worldwide Governance Indicators (WGI), produced by D. Kaufmann, A. Kraay and M. Mastruzzi, cover 213 economies. They rely on each country's performance for all available years between 1996 and 2009 in six governance dimensions: i) voice & accountability; ii) political stability and lack of violence/terrorism; iii) government effectiveness; iv) regulatory quality; v)
rule of law; and vi) control of corruption. The aggregate indicators combine the views of a large number of enterprise, citizen and expert survey respondents in industrial and developing countries. The individual data sources underlying the aggregate indicators are drawn from a diverse variety of survey institutes, think-tanks, non-governmental organizations and international organizations.
The Global Competitiveness Index (GCI) was developed for the World Economic Forum by X. Sala-i-Martin and it was first introduced in 2004. The index provides a comprehensive picture of the investment climate based on 12 pillars: institutions; infrastructure; macroeconomic environment; health and primary education; higher education and training; goods market efficiency; labour market efficiency; financial market development; technological readiness; market size; business sophistication; and innovation. The rankings are calculated from both publicly available data and the Executive Opinion Survey, and are designed to capture a broad range of factors affecting an economy’s business climate.
The Corruption Perception Index (CPI), constructed by Transparency International, draws on thirteen different polls and surveys from eleven independent institutions. The data sources include the Asian Development Bank, the African Development Bank, the Bertelsmann Transformation Index, the World Bank’s Country Policy and Institutional Assessment, the Economist Intelligence Unit, Freedom House’s Nations in Transit, Global Insight, IMD International World Competitiveness Centre, Merchant International Group, Political and Economic Risk Consultancy and the World Economic Forum.
The Doing Business (DB) report, published each year by the World Bank, provides a less comprehensive set of indicators in comparison to the Global Competitiveness Index. This is because it overlooks several aspects of the business environment that affect firms’ competitiveness in the medium-term; such as macroeconomic stability, financial system stability, and labour skills. However, the DB report looks more deeply into aspects of the ease of doing business and of the overall investment climate.

European Commission The EU's neighbouring economies: coping with new challenges
36
including the quality of its institutions, macroeconomic environment, education, financial market development and technological readiness. Algeria’s ranking reflects its stable macroeconomic environment; although this is counterbalanced by the relatively low development of its financial market despite the country’s significant market size.
Lebanon advanced three positions to 89th overall; backed by a high-quality educational system, efficient goods markets and a well developed financial sector, but hindered by its less-developed infrastructure and labour market. Syria ranked 97th, on account of (amongst other factors), high inefficiency in goods, labour and financial markets, underdeveloped infrastructures and low levels of technological advancement.
According to the Transparency International’s Corruption Perceptions Index (CPI), the South Mediterranean countries rank below the world median but with notable variation across countries (1). The political and institutional infrastructure of some countries, combined with contextual factors such as insecurity, oil wealth and prevalence of conflict, continue to fuel corruption and the lack of transparency. In 2010, the best position was held by Israel (30th), followed by Jordan (50th), Tunisia (59th), Morocco (85th), Egypt (98th), Algeria (105th), Lebanon (127th), Syria (127th) and Libya (146th).
A business-friendly regulatory framework is a necessary condition to encourage private investment. Over the last five years, countries in the Mediterranean region have made significant progress in improving the business climate; with some of the biggest improvements on a regional basis being the reduction in the amount of capital required to start up a business and the launch of
(1) As a gap is to be expected between perceptions and actual
levels of corruption, global perception–based indexes may not fully reflect the multiple facets and complexity of the regional situation. Perceptions may be influenced by factors other than the real incidence of corruption. For example, some argue that a freer media such as Morocco's is more likely to report on corruption cases and feed people’s perception of higher levels of corruption, compared to countries where the media is particularly repressed and does not report abuses. However, doubt has been cast on this argument empirically, as countries with a free press appear more successful in controlling corruption.
one-stop shops, as well as the reduction in the administrative burden of paying taxes.
According to the 2012 World Bank’s Doing Business Report, several countries in the region improved their investment climate during 2010/11. Morocco was the top performer in the world (ranked 94th out of 183 countries) as it advanced twenty-one positions based on progress in three areas of regulation: dealing with construction permits, investors’ protection and paying taxes. In particular, Morocco introduced a one-stop shop for business start-ups; improved the protection of minority shareholders; and eased the administrative burden of paying taxes for firms by facilitating electronic filing and payment. Even lower ranked countries like Syria and Algeria (134th and 148th respectively) made some reforms. Syria eased business start-up by reducing both the minimum capital requirement and the cost of publication for the registration notice, while Algeria improved its credit information system by guaranteeing by law the right of borrowers to inspect their personal data.
Jordan and Lebanon are placed similarly to one another in the second half of the rankings. Jordan (96h) also reduced significantly the minimum capital required for starting a business and eased trading across borders. Lebanon (104th) made getting electricity less costly by reducing the application fees and security deposit for a new connection. Finally, Egypt and Tunisia retained their positions (110th and 46th respectively).
The best performer by far in terms of ease of doing business remains Israel (34th), which receives a remarkably high grading on investors’ protection, trading across borders and business access to credit. Israel’s latest reforms involve the change of the method used to calculate port fees and the amendment of the courts law aiming at establishing specialized courts for dealing with economic matters.
2.2. EASTERN NEIGHBOURS
Compared to their South Mediterranean peers, EU's Eastern Neighbourhood countries rank relatively well according to the latest available Worldwide Governance Indicators provided by

Part II Regional issues
37
the World Bank (1). There are significant differences among the Eastern Neighbourhood countries, but Belarus is the only strong outlier, lagging behind in most governance indicators. Overall Georgia and Armenia lead the regional table on four indicators of governance: government effectiveness, control of corruption, regulatory quality and rule of law. On governance effectiveness they are followed by Moldova and Azerbaijan, while Ukraine lags behind. As regards controlling corruption, Ukraine and Belarus are in the middle ranks, while Azerbaijan performs significantly worse. For the quality of regulatory frameworks, Moldova and Azerbaijan occupy the middle field, while Ukraine is just below the regional average but still far ahead of Belarus which is in the lowest percentile. As far as the perception of the adherence of the authorities to the rule of law is concerned, Georgia is leading (as on many other indicators) with Armenia and Moldova following closely; while Ukraine and Azerbaijan rank near to the regional average, and Belarus has the lowest score.
On political stability, Belarus leads the group followed by Armenia, while Georgia has the lowest ranking essentially explained by the 2008 military conflict with Russia and its aftermath. Azerbaijan's and Ukraine's rankings are close to the regional average, while Moldova has the lowest perception of political stability in the regional group. Finally, voice and accountability indicators place Ukraine and Georgia in the leading position, followed by Moldova; Armenia is in the middle field, while Azerbaijan and Belarus lag significantly behind.
In the World Economic Forum's recent Global Competitiveness Index (GCI) report (2), which provides data on 2010/2011, Ukraine, Moldova, Georgia and Armenia rank in the lower half of the distribution; while Azerbaijan and the Russian Federation are ranked somewhat better, making it into the upper half of the distribution. The ranking of all countries except Russia has improved in comparison to the previous year, partially due to reform efforts undertaken although partially due to the inclusion of additional countries in the GCI.
(1) The latest available data is for 2009. (2) World Economic Forum (2011)..
Azerbaijan leads the Eastern Neighbourhood region, ranking 55th out of 142. Among the most advantageous features of Azerbaijan's investment climate, respondents named sustainable fiscal policy, hiring and firing practices, a good enrolment rate in secondary education, the strength of investor protection, and the limited burden caused by government regulation. On the other hand, corruption is considered as by far the most the most problematic factor for doing business.
Russia ranks 66th out of 142 countries. Its domestic market size certainly contributes to its overall high mark; along with its relatively well-developed infrastructure, low government debt, and strong primary and tertiary education enrolment rates. However, numerous institutional features of the Russian economic governance system are reported as extremely problematic for the investment climate. In particular, corruption and the inefficiency of government bureaucracy appear as the two most problematic factors for doing business in Russia.
Ukraine is ranked 82nd out of 142 countries, overtaking Georgia in comparison to the previous year. Labour market efficiency is considered to be high, due to low redundancy and firing costs and also due to a high female participation in the labour force. Furthermore, market size, good railroad infrastructure and strong human capital endowments (good secondary and, especially, tertiary education enrolment rates) also feature as important advantages. On the other hand, the efficiency of the legal framework, judicial independence, protection of property rights and of minority shareholders are all considered very problematic for Ukraine's investment climate. Corruption and tax regulations are considered as the most problematic factors for doing business.
Georgia ranks 88th out of 142 countries. Among its most advantageous features are low trade tariffs, the low burden of government regulation, limited length and number of procedures necessary to start a business, and the low cost of redundancies. The three most problematic factors for doing business were reported to be access to financing, inadequately educated workforce and inflation.
Armenia ranks 92nd out of 142. Only few indicators are reported to be significantly strong enough to provide a comparative advantage:

European Commission The EU's neighbouring economies: coping with new challenges
38
regarding goods' market efficiency, low business costs of crime and violence and low costs of terrorism feature alongside institutional factors, low trade tariffs and a relatively limited number of procedures to start a business; whereas regarding labour market efficiency, there are low redundancy costs. The protection of minority shareholders is considered to be especially low, while corruption and tax regulations are reported to be the most problematic factors for doing business.
Finally, Moldova has the lowest overall ranking in among Eastern Neighbourhood countries: 93rd out of 142 countries. Policy instability is reported to be the most problematic factor for doing business; followed by corruption and difficult access to financing. At the same time, strong female participation in the labour force, low trade tariffs and overall limited total taxation burden are listed as the most advantageous features contributing to Moldova's investment climate.
In terms of Transparency International's Corruption Perception Index, the Eastern neighbours have not improved significantly in comparison to the previous year. For 2010, the Transparency International data places the majority of the Eastern Neighbourhood countries in the lower third of the distribution in the global ranking of corruption perceptions. This points to the still acute problem of government transparency and accountability in the Eastern neighbours, with a negative effect on domestic and foreign investment. Yet compared to the countries of Eastern Europe and Central Asia, the Eastern Neighbourhood is rather in the middle field, with Moldova ranking 105th, Armenia 123rd, Belarus 127th, Azerbaijan 134th and Ukraine 134th. Georgia remains the regional leader ranking 68th, which is relatively favourable when compared with some of the EU member states or EU candidate and potential candidates.
In the 2012 Doing Business report, Georgia ranked the 16th on the overall ease of doing business: the highest rank in the Eastern Neighbourhood and among the best placed EU member states. It improved access to credit by implementing a central collateral registry, strengthened investor protection by allowing greater access to corporate information during the trial, made the enforcement of contracts easier and improved insolvency proceedings.
Armenia and Azerbaijan were ranked 55th and 66th, respectively. Armenia made advances in the ease of starting a business, dealing with construction permits, getting credit, paying taxes and resolving insolvency; while Azerbaijan had already improved access to credit in 2010 by establishing an online platform for financial institutions and revised its tax code lowering several taxes and simplifying the tax paying. Belarus (69th) remains well ahead of Moldova (81st), Russia (120th) and Ukraine (152th).
Belarus, while being the last state-driven economy in Europe, implemented a package of business-friendly reforms by easing requirements for property transfer, strengthening investor protection by increasing corporate disclosure requirements to boards of directors and the public, as well as abolishing certain taxes and encouraging electronic tax filing and payment. Moldova showed significant improvement and advanced 18 positions since the previous report. A one-stop shop for starting a business was created and the introduction of a private credit bureau and private bailiffs will hopefully improve the country's performance on getting credit and enforcing contracts respectively.
In Russia limited improvements in business climate have taken place. In Russia, procedures for registering property, trading across borders and enforcing contracts were reformed, whilst revised tariffs for connection made electricity less costly. Ranked as the worst performer in the region on doing business, Ukraine has still undergone a number of reforms: regulation for business start-up was eased, by eliminating the requirement to obtain approval for a new corporate seal; paying taxes was made easier and less costly for firms, by revising and unifying tax legislation; and there were also enhancements in legislation for enforcing contracts and resolving insolvency.
Overall, the Eastern Neighbourhood countries have achieved significant progress in recent years as regards cutting red tape for business start-ups, as well as by facilitating access to credit and property regulation. They have also achieved some progress in the field of contract enforcement and investor protection. However, their tax systems are

Part II Regional issues
39
Box II.2.2: Structural reform agenda in the Eastern neighbours
The first generation of transition reforms from a centrally planned to a market-based economy can be considered as largely accomplished in the countries of Eastern Neighbourhood (with the notable exception of Belarus), at least when the traditional transition indicators of the EBRD's Transition Report are used (1). Most countries in the region have well-established market institutions, had already liberalised their trade and capital flows in the 1990s, and allow price-setting to function freely. Despite potential for further privatisation in a number of countries, such as Belarus, Russia, Ukraine, Azerbaijan and Moldova, large-scale as well as small-scale privatisations of previously state-owned enterprises have to a large extent taken place. Belarus has been a traditional laggard in the economic transition reform agenda. Notably, at 30% of GDP, the share of the private sector in the Belarus economy remains very low. In recent years however, there has been some progress in introducing market mechanisms. Amended legislation has improved the legal framework for privatisation, and a new agency for privatisation has been set up. Furthermore, part of the financial sector has been privatised. Prices have been further liberalised and administrative controls on business have been reduced. The Presidential Directive on the "Development of entrepreneurial initiative and promotion of business activity", adopted in December 2010, was perceived as a signal for a new wave of economic liberalisation; although few concrete steps were taken to implement it. In May 2011, linked to the 2011 balance of payments difficulties, the authorities announced plans to establish market principles for lending by government-controlled banks. Yet despite these steps towards liberalisation, state intervention in the economy remains widespread. Most countries of the Eastern Neighbourhood - especially those without natural resource endowments - have achieved significant progress in (1) The EBRD Transition Report 2010 elaborates that the
methodology to measure transition is currently being reviewed to account in the future for well-run, effective public institutions that support the functioning of markets. For further information, see EBRD (2010).
improving business climate, reducing corruption,and strengthening their public finance management systems. The international donor community has been active in the region: multinational banks, such as the European Investment Bank and the European Bank for Reconstruction and Development, have contributed to strengthening the infrastructure (water, energy, roads); while International Financial Institutions such as the World Bank, as well as EU bilateral cooperation assistance, have contributed to reforms in public finance management, private sector development, infrastructure and sometimes pension and social safety systems. However, in terms of reforming the economic governance and business climate, these countries are still lagging behind developed countries; thus, according to the EBRD Transition Report 2010, shortcomings remain. In particular, the rehabilitation of physical infrastructure, the further liberalisation of the energy sector, and the enhancement of the financial intermediation function of the banking system should be considered among the highest priorities for the region. Concerning the energy sector, domestic gas and electricity prices remain in many cases below economic cost recovery levels, while regulatory frameworks need to be further improved. The power and gas sectors remain dominated by large state-owned operators, often entailing problems of governance and transparency. In some cases (e.g. Ukraine) progress has yet to be made to unbundle the production, transit and distribution systems of the sectors. The offer to join the Energy Community,established in 2005 with the aim to bring the energy markets of Eastern Neighbourhood and potential EU candidate countries closer to the EU acquis communautaire, has so far only been taken up by Ukraine and Moldova, with Georgia having observer status. While the first generation "transition" agenda seems to be largely accomplished, Eastern Neighbourhood countries are still faced with the challenge of upgrading their structural reform agenda in order to achieve a more sustainable growth pattern than the
(Continued on the next page)

European Commission The EU's neighbouring economies: coping with new challenges
40
Box (continued)
pre-crisis one. For some, the choice is simplified due to the availability of natural resources. Most notably, Russia and Azerbaijan are resource-driven economies whose current economic performance largely depends on the global demand for oil and gas. For them, particularly for Azerbaijan, the long-term challenge is to further diversify their economies in order to reduce dependence on these commodities. Other countries that do not have significant natural resources are even more pressed to expand their growth potential by keeping open borders to foreign trade and investment, while ensuring a favourable investment climate. Thus, export growth and trade integration should become the main drivers of growth in these economies, in contrast with the pre-crisis unbalanced growth which was increasingly driven by a domestic demand boom. To a certain extent, internal consumption in many countries was supported by remittance inflows; however this cannot be considered as a viable medium-term strategy for national economic development, as migration and working abroad are in most cases second-best options for economic agents. Moreover, the demand boom was also the result of a surge in bank credit and asset prices, which raises the question of how to channel future domestic credit and capital flows more into productive activities and away from consumption and non-tradables. Understanding this, economic observers have been advising the countries of the region to identify and remove bottlenecks to growth and competitiveness. While some countries have adopted more comprehensive government action plans and growth strategies, not all of them have set-up clear medium-term economic performance targets. The EU's ambitious Europe 2020 Agenda could also inspire the countries of Eastern Neighbourhood to identify more clearly their respective obstacles to sustainable and inclusive growth, and to develop concrete actions to remove them. According to the Global Competitiveness Indicator, business sophistication and innovation capacities in the countries of the region remain weak. Also the promotion of SMEs and exports are still underdeveloped because often they are considered as
distortionary and leading to rent-seeking practices. Many SMEs find it particularly hard to cope with a heavy bureaucratic burden, with insufficient enforcement of protection rights by the judiciary,and with inadequate access to financing. The latter represents a hurdle especially in agribusiness: a sector in which many of these countries have high potential, considering the good climatic conditions, a long tradition of agricultural production and a high share of private land ownership. Strengthening export-led growth is important,considering the fact that only two countries in the region - Russia and Ukraine - dispose of a substantial domestic market. Other countries' medium-term economic success depends significantly either on developing a competitive export sector or on tourism. The latter remains underdeveloped in a region that is often considered as peripheral and prone to political and military instability. However, some countries (e.g. Azerbaijan and Georgia) have been taking some encouraging steps in this area. Another important factor affecting the growth potential is the human resource endowment. The basic level of human resources in the region is considered to be adequate, with health and primary and secondary education indicators of the Global Competitiveness Index being above the individual countries' overall competitiveness performance. Russia and Ukraine rank also well in higher education and training. However, what seems to be lacking is a strong system of vocational education and training, as inadequate skills are often mentioned by industry experts. Improving the functioning of the labour markets, including thealleviation of the labour tax wedge remains a challenge. Furthermore, there is scope for strengthening active labour market policies for the unemployed.

Part II Regional issues
41
reportedly under-performing due to the high number of payments and long collection times, while cross-border trading continues to be hampered by cumbersome procedures and high costs together with difficult access to electricity.
Public finance management (PFM) has been an important field of recent government reforms in the Eastern neighbours; thus contributing to government transparency, predictability and neutrality (see also Box II.2.2 on structural reforms in the Eastern neighbours). These reforms have also contributed to a more sustainable fiscal position for the respective countries. Most countries are involved in making more transparent, reliable and unbiased their tax collection, budget planning and execution, public procurement practices and judicial systems. However, the pace of reforms differs significantly.
Georgia has been a definite frontrunner in the area of PFM reform (however, a certain backtracking can be reported more recently in the field of public internal financial control and internal audit). The country further improved its budget preparation by making advances in introducing programme-based budgeting. In the area of external audit, Georgia continued to enhance the capacity of the Supreme Audit Institution. It further modernised its procurement system by introducing an electronic public procurement system and by increasing the share of competitive tenders. Georgia also made progress in the area of revenue management. A more compact unified customs and tax code was introduced in January 2011, while the Revenue Service introduced the e-filing of tax-return declarations thus enabling taxpayers to file declarations electronically.
In Armenia the reforms have been focussed on the judiciary system, and are hoped to lead to a decrease in the level of corruption. In Moldova, budget preparation has been modernised and the new law on public sector financial management and accountability is expected to be adopted shortly. Budget execution continues to suffer from weak implementation capacity due to an understaffed Treasury. A new law on public internal financial control was adopted in September 2010; while the capacities of the external audit were further developed by the Court of Accounts, bringing its practices closer to the international standards. Ukraine's flagship reform
in the PFM area has been the overhaul of the Tax Code, adopted after certain controversies in late 2010. The public procurement law has also been a prominent reform field, yet the law adopted in June 2010 was revised in early 2011 leading to a suspension of disbursements from EU sector budget support operations. The law was amended by the Parliament in line with international practice in June 2011. Ukraine also attempted to resolve the situation regarding VAT refund arrears that strongly increased in 2010, by introducing a controversial VAT bond scheme in August 2010. However, despite the government's commitment not to accumulate new arrears by early 2011, the issue is not yet fully resolved. In addition, external audit remains a significant challenge. The Accounting Chamber of Ukraine still has no power to audit state revenues, local governments or state-owned enterprises.
Azerbaijan and Belarus have not done much to improve their PFM systems; thus recent reports on public procurement in Azerbaijan show that that transparency of tenders remains problematic.


Part III Thematic Issues

1. ECONOMIC FACTORS BEHIND THE POLITICAL UNREST IN THE SOUTH MEDITERRANEAN
Graph III.1.2: GDP per capita - proportion of EU-27
0
10
20
30
40
50
1980 1982 1984 1986 1988 1990 1992 1994 1996 1998 2000 2002 2004 2006 2008 2010
Source: IMF World Economic Outlook and own calculations.
PPP international USD, share of EU-27
MediterraneanCIS and RussiaDeveloping Asia
44
1.1. A DISAPPOINTING GROWTH PERFORMANCE
Countries in the ENP Mediterranean region have underperformed over the last thirty years, compared to the Eastern Neighbours and to other developing regions such as Latin America, Asia and Central and Eastern Europe. Average Real GDP Growth from 1980 to 2010 was 2.9% in the MENA region (IMF 2011) and even lower in per capita terms (see Graph III.1.1). GDP growth has picked up in the Mediterranean region over the last decade, due to the impact of tentative structural reforms as well as a favourable global economic climate; but growth in the other developing regions has increased more, particularly in Eastern Europe and Asia (see Graph III.1.2). As well as lower average growth, growth has also been more volatile. This can be attributed to a heavy reliance on hydrocarbon revenues in some countries, notably Libya and Algeria, which fluctuate with international demand; and also the presence of large agricultural sectors in others, for example Morocco and Egypt, which are heavily influenced
by climatic conditions. In some countries, substantial aid flows have also played a role in explaining the volatility of growth. Syria is perhaps the clearest example of all, where a combination of record harvests, a spike in oil prices, and substantial post-Gulf War aid flows contributed to a significant growth spurt in the early 1990s that was not sustained.
0
1
2
3
4
5
6
Asia and Pacific Emerging anddevelopingeconomies
Africa MENA Latin America andthe Caribbean
Graph III.1.1:Real GDP growth(Average 1980-2010, %)
Source: IMF
In the 1980s, the Mediterranean countries benefitted from the spill over effects of regional oil wealth. The sharp rise in oil prices led to increased trade, remittances and capital flows from oil

Part III Thematic Issues
Graph III.1.3: GDP per capita
50
100
150
200
250
300
350
400
450
500
550
600
1990
1991
1992
1993
1994
1995
1996
1997
1998
1999
2000
2001
2002
2003
2004
2005
2006
2007
2008
2009
2010
2011
Source: IMF World Economic Outlook and own calculations.
PPP international USD, index 1990=100
MediterraneanEU-27EFTAGCCDeveloping AsiaCentral AsiaCIS and RussiaLatin America and the Caribbean
45
exporters to oil importers. GDP rose swiftly, led by investment spending, and was accompanied by raised living standards. However, the momentum of growth was not sustained as the economies of the region struggled to create sufficient employment for rapidly-growing populations. Economic reforms were undertaken by several countries in the region towards the end of the eighties and early nineties, aimed at liberalising and opening-up economies particularly in Jordan, Morocco, Tunisia and Egypt. Fiscal reforms were introduced to broaden tax bases, including the introduction of VAT, to scale down subsidy schemes, and to tighten the management of public expenditure. External trade started to be liberalized and foreign direct investment was encouraged. Growth started to accelerate as a consequence, in contrast to countries in which the state maintained a dominant role, such as Algeria and Syria. Although the early pace of reforms slackened, macroeconomic stability has improved as a result. Inflation has generally been lower, fiscal deficits have narrowed in many countries, and government debt, including external indebtedness, has been kept at manageable levels.
The population of the Mediterranean region has grown rapidly over the last thirty years. On average, annual population growth is around 2½%, with the strongest growth rate observed during 1980-1995. With respect to welfare levels, this trend has all but wiped out the rise in output. The MENA region averaged only 0.5% growth between 1980 and 2010 when looking at real per-capita GDP: far less than in other developing regions (IMF 2011c). Since 2000 growth has accelerated, reflecting reform efforts and stronger annual employment growth, but this has not been enough to significantly raise living standards. According to the latest statistics on relative income levels, adjusted for purchasing power parity, Mediterranean neighbour countries had an average GDP per capita of around 35% of the EU-27 level and 30% of the euro-area level in 2008. The data illustrate that between the early 1990s and 2008, the average relative income level of the Mediterranean ENP countries stayed roughly the same compared to that of the euro area (see Graph III.1.3). Admittedly this average masks important cross-country differences, such as the smoother catch-up of Tunisia over a longer period as well as a falling trend in the relative income level of Syria,

European Commission The EU's neighbouring economies: coping with new challenges
46
but it does reflect a general pattern in the region. Weak growth combined with strongly rising populations and inefficient labour markets (see below) has created high levels of unemployment, averaging between 10 and 12 percent despite very low rates of female participation.
Since 1980 the main oil exporters, Algeria and Libya, have had on average the weakest growth. The Libyan economy expanded by less than 0.5% in terms of average annual real GDP, having contracted sharply during the 1980s on account of civil conflict and the collapse in oil prices. In this respect, the main oil exporters appear to have struggled to convert substantial natural resource revenue into broader-based growth, and to have fallen victim to the so-called "resource curse" paradox whereby countries with an abundance of natural resources tend to have lower economic growth and worse development outcomes than countries with fewer natural resources.
Amongst the oil importers, Egypt has had the highest overall annual growth rate. However, in per capita terms real GDP has hardly risen since the end of the 1990s due to a rapidly rising population (1). Jordan and Tunisia have also seen relatively consistent and high growth rates, and Jordan and Morocco saw a marked increase in annual growth rates from 2000 until the 2008-2009 global financial crisis, highlighting the positive impact of recent structural reforms. The strongest growth since 1980 has been during the years when the region benefitted directly and indirectly from strong global demand, rising oil prices and an influx of foreign direct investment, emanating particularly from the Gulf region through recycled oil revenue. This can be clearly seen in the case of Jordan, which had the highest growth during the period and where FDI inflows have been particularly high, partly reflecting Public Private Partnership (PPP) initiatives. The increase in growth in the period 2000-2008 is encouraging in that it underlines the benefit of structural reforms and the significant untapped potential of the Mediterranean region.
(1) The stagnation in living standards has been seized upon by
many commentators as a main factor behind the spring uprising.
Resilience during the global economic crisis
The economies of the Mediterranean region also showed significant resilience during the global economic crisis, as GDP decelerated rather than contracted. Growth was hit via external channels through exports, inward investment and remittances; but several factors insulated and supported the region’s economies. The region as a whole has limited exposure to international financial markets and structured financial products, meaning that the domestic lending capacity of the primarily bank-based financial system remained largely intact. Many countries in the region are also relatively closed economies regarding trade, which limited the impact of the collapse in external demand on economic activity as a whole. The region was also helped significantly by the fall in global commodity prices in 2009, as its imports are more commodity-rich than in developed economies. Finally, a strong harvest boosted agricultural sectors, which employ as much as 40% per cent of the workforce in some countries (e.g. Morocco) and hence have a significant influence on domestic demand as a whole.
However, the events of spring 2011 have underlined that there are no grounds for complacency. While some of these factors sheltered the region from the global turmoil, they have also constrained the development of the private sector which should be the essential engine of growth and the generator of much-needed employment. Therefore, the recent political unrest should not result in the brakes being put on structural reforms: governments must instead respond by accelerating market reforms, in hand with deepening democracy, in order to raise the growth potential of the region.
1.2. POPULATION DYNAMICS AND INEFFICIENT LABOUR MARKETS
This section assesses the performance of labour markets in the Mediterranean region, including the impact of population dynamics. The section draws significantly on the findings of a recent study co-financed by the EU (EU 2010b), which focused on all countries of the Southern Mediterranean with the exception of Israel.

Part III Thematic Issues
47
The Arab countries of the Mediterranean region have experienced higher population growth rates than any other region in the world over the last thirty years. Although rates have declined since the mid-1980s, average annual population growth is still above 1.5%. This has resulted in a very young demographic profile: around 65% of the regional Arab population are less than 30 years old, and around 30% less than 15 years old. The highest growth rates have been in the occupied Palestinian territory, Jordan, Syria and Libya; while population growth has slowed down to around 1% in Lebanon, Morocco and Tunisia (see Graph III.1.4).
Graph III.1.4:Population growth rate
0
1
2
3
4
5
6
1981-2010 1980-1989 1990-1994 1995-1999 2000-2004 2005-2010
AlgeriaEgyptIsraelJordanLebanonLibyaMoroccoSyriaTunisiaAverage
Source: IMF.
The young demographic profile in the Arab Mediterranean region is potentially very positive for growth in that around two thirds of the total proportion is of working age. However, this profile has placed significant pressure on labour markets to create sufficient employment for young entrants. Furthermore, the pressure will be sustained as the working age population is set to continue expanding rapidly in most of these countries for at least the next thirty years. Therefore, although there are significant economic benefits to be realised, there are equally serious risks related to the failure to generate sufficient employment. In this respect, high unemployment, particularly amongst young people, has been widely acknowledged as a major factor behind the recent regional social and political unrest.
Between 2010 and 2020, it is projected that the working age population of Arab countries in the Mediterranean region will expand by about 2.5 million people a year, from 129 to 154 million. In order to absorb this expansion, employment would have to grow by around 3% a year. This implies
average real GDP growth of between 4-6% based on current employment-to-growth elasticity. Furthermore, the required growth rate is probably greater since elasticity will probably fall in the future, with more employment growth in the industrial sector and tradable services where productivity gains are greater than in the agricultural sector and non-tradable services. In addition, participation rates in the region are the lowest in the world (less than 46% of the working age population compared a world average of 61.2% (European Commission, 2010)), but they will probably increase with raised social aspirations. This is particularly the case with respect to the participation of women in the labour market, which is discussed further below.
Labour markets in the Arab Mediterranean region have for many years struggled to absorb the large supply of new entrants. Average official unemployment in the region is around 13% of the labour force (see Graph III.1.5). During the period of high growth from 2000 to 2008, unemployment somewhat declined. During this period, in which the Arab economies of the region grew at an average annual rate of about 5.5%, job creation grew by 4.5% which more than offset the growth in the labour force. Unemployment rates fell in all countries during the period, in particular in Algeria where official unemployment fell from over 25% to just above 11% in 2008. However, unemployment has risen again in the wake of the global economic crisis and of the economic difficulties related to the ongoing social and political unrest, and the more pessimistic global economic outlook will make employment growth more challenging in future.
Profile of unemployment
Official unemployment is much higher amongst women than men in the region. Female unemployment averages about 20% in Arab countries in the Southern Mediterranean, which is substantially higher than male unemployment despite the fact that female participation rates are much lower than for men, as discussed further below. Unemployment is also higher amongst young people: over 20% for the youngest 15-24 year age group and more than 17% for 25-34 year-olds. In contrast, unemployment is below 3% for those aged 45-64. In terms of educational profile, unemployment rates are higher for those who have

European Commission The EU's neighbouring economies: coping with new challenges
48
completed secondary and tertiary education, and this is particularly the case for women. Unemployment rates amongst those with no qualifications are very low. This may be a consequence of significant job creation in low- skilled employment such as agriculture, compared to less job creation in skilled employment.
Factors suppressing unemployment
While official unemployment rates are high, they furthermore have to be seen in the context of several factors which depress official unemployment rates. Firstly, as noted above, labour participation rates in the Arab Mediterranean region are the lowest in the world. This is mainly due to a very low female participation rate: only one in four working-age women participate in the labour market. This eases some of the pressure on job creation, but only at the cost of forfeiting significant educational investment and economic potential. Secondly, labour market performance is also difficult to gauge based on the official labour market, given that there are extensive informal labour sectors in the region. Informal employment is estimated to account on average for between 45% and 55% of total non-agricultural employment. The informal sector is mainly made up of poorer workers who cannot be employed due to a lack of national savings and limited coverage of social security systems. Hence the informal labour market acts as a buffer on the supply side of the formal labour market, depressing official unemployment rates.
Finally, a further factor which tends to reduce official unemployment rates and to ease pressure on employment creation is the high rate of
migration from Arab countries in the region. In 2005, around 4% of the MENA regional population were working abroad, compared to a global average of around 3%. Migration is particularly high for Lebanon, at around 17%, and for countries of the Maghreb (1) at around 5.5% on average. Over half of migrants work in Europe, around a third in the Gulf and other Arab states, with a significant amount also working in the United States and Australia. The educational profile of migrants tends to differ by region: migrants from the Maghreb have a lower educational profile than those from the Mashreq (2). The large degree of migration from the region highlights the lack of domestic job opportunities, contrasting demographic trends compared to those in the European Union, as well as significant wage differentials.
Reasons for labour market underperformance
• Role of the public sector
The public sector has played a pivotal role in Arab countries in the region; both in supporting employment as a whole, due to the large size of public sectors, and in providing attractive employment to the educated middle classes. In some countries civil-service employment was guaranteed for graduates of secondary and higher educational institutions until the 1980s. This led to a concentration of graduates in the public sector and pushed graduate studies towards humanities and social sciences. This policy discouraged (1) Morocco, Tunisia, Algeria, Mauritania (not included in the
research study), and Libya. (2) Egypt, Jordan, Lebanon, Syria and the occupied Palestinian
territory.
Graph III.1.5: Unemployment rates
0
5
10
15
20
25
30
35
1998 1999 2000 2001 2002 2003 2004 2005 2006 2007 2008 2009 2010
Algeria
Egypt
Israel
Jordan
Lebanon
Libya
Morocco
Syria
Tunisia
Average
Source: IMF.

Part III Thematic Issues
49
educated workers from entering the private sector, where conditions were inferior, and also devalued scientific and technical education in economic terms. However, the public sector employment guarantee became unsustainable due to overstaffing and burgeoning wage bills, leading to the abandonment of the policy in favour of long waiting lists of graduates seeking entry into civil services. Yet despite later reforms to these policies, the public sector wage bill is still considerable in many countries, representing around 8-10% of GDP. It is estimated that public sector employment still absorbs around 20% of total employment in Arab Mediterranean Countries, around a third of non-agricultural employment, and a far larger proportion of the female working population. Therefore, whilst reforms have reduced labour market distortions, there is still a bias towards public sector employment which saps the private sector of many educated workers - with important implications for productivity - and influences educational choices as a whole.
• Education and skills mismatches
The public education system has expanded significantly in Arab countries of the Southern Mediterranean. This had been accompanied by greater investment and has led to far higher enrolment rates. Consequently, educational attainment has advanced, which is reflected in the composition of the workforce. For example, in Egypt in the 1980s, 40% of those entering the workforce had not achieved a primary level of education. By 2005, 70% had received a secondary education or better. The higher level of education has most probably raised social aspirations, putting more pressure on governments in the region to produce policies generating more and better-quality employment. However, educational attainment is still relatively low compared to other regions in the world even though there has been a marked reduction in illiteracy and a rise in secondary level education. The proportion of university graduates has also increased over the last 25 years, but more slowly than the number of secondary school graduates. Hence, while improvements have been made, there are still challenges in particular to increase numbers in tertiary education and to raise the proportion of science and technology graduates, in order to
reduce skills mismatches. For historic reasons noted above, the education systems of the Arab Mediterranean countries still tend to focus more on the study of humanities and social sciences than on science and engineering. In more than half of MENA countries, about two-thirds of graduate students follow humanities. This contrasts with the pattern in East Asia, where science and engineering dominates graduate education. Some researchers have linked this tendency in the MENA countries to low productivity and weak gains in total factor productivity. The tendency may also help explain high unemployment rates among skilled workers, as well as the underdevelopment of the private sector.
• Labour market rigidities
In addition to the above factors, labour market regulation may also be holding back job growth. Based on the World Bank's Doing Business Report 2010 (the latest report to include labour market indicators), Arab countries in the region all fall into the bottom half of the "employing workers" ranking, with the exception of Jordan and Lebanon, which partly reflects quite heavy regulation. This may also account for the large size of the informal sector. There is also evidence that minimum wage levels may be hindering employment and driving informal sector employment. Minimum wages in some Arab countries are higher, for example, than in Romania and Bulgaria, which have far higher levels of GDP per capita. Minimum wages in the region may be set relatively high due to the larger size of a household, which traditionally had only one breadwinner. Despite this, they are often insufficient to keep a family above the poverty line. Labour market rigidities are also highlighted in the World Economic Forum's Global Competitiveness Report. On the measure of labour market efficiency, with the exception of Israel and Tunisia, the countries of the region all receive a ranking worse than 100th out of 139 countries assessed. The assessment of labour market efficiency takes into account the following factors: flexibility (hiring and firing practices), flexibility of wage determination; cooperation in labour-employer relations; efficiency (reliance on professional management; pay and productivity; "brain drain"; and private sector employment of women. These rankings indicate there are still

European Commission The EU's neighbouring economies: coping with new challenges
50
significant challenges in most of these countries in reforming the structural aspects of labour markets.
1.3. WEAKNESSES IN THE EDUCATIONAL SYSTEM
Despite remarkable achievements in schooling and participation, the educational systems in the South Mediterranean countries still face significant challenges.
During the 1980s and the 1990s, the region's governments invested considerably in education in order to fight illiteracy, which was hindering development and economic growth. Yet despite the remarkable progress achieved in this respect, illiteracy, especially among adults, still remains high in several countries of the region.
Graph III.1.6: Literacy Rate in 2009*
30
40
50
60
70
80
90
100
110
Alger
iaEg
ypt
Jorda
n
Leba
non
Libya
Morocc
ooP
TSyr i
a
Tunis
ia
Adult Males Adult Females Young Males Young Females
* In case of missing data, the latest data were used. Source: Unesco Statistics.
The situation appears particularly critical in Morocco, where almost one third of adult males and more than half of adult females are illiterate. In Algeria and Egypt illiteracy rates among adult females are also high, reaching almost 40% (see Graph III.1.6). Females in general exhibit much lower levels of literacy than males, mostly as a result of lower attendance in previous decades: in the 1980s, female net enrolment rate was more than 20 percentage points lower than males; thus depriving a high share of the female population of basic education. Recent efforts seem to have addressed some of the underlying problems. School enrolment of both males and females has increased and young people show lower levels of illiteracy compared to previous generations. By 2009 the gender participation gap in primary education had diminished in most countries. Yet as opposed to this trend, some countries have seen a
reduction in education participation in recent years; including Jordan, where net enrolment in primary school actually decreased from 98% in 1980 to 89% in 2008, and the oPt, where the net enrolment rate dropped sharply from 96% to 75% between 2000 and 2009.
Furthermore, primary education is characterized by high dropout and repetition rates (see Graph III.1.7). These figures help to understand the poor performance of countries like Morocco in terms of literacy. Morocco shows the highest rate of dropout, implying that although nearly 90% of the population enrols in primary education, a large share of enrolled students leave school before completion. In addition, some gender gaps still persist, with females tending to have higher level of repetition rates.
Graph III.1.7:Rate of repeaters and dropouts*
0
5
10
15
20
25
Egypt**Morocco Syria oPT Low erMid Inc.
Algeria Jordan Lebanon Tunisia UpperMid Inc.
Drop Out Males
Drop Out Females
Percent age of repeat ers MalesPercent age of repeat ers Females
* Data for 2009 and 2008, respec tively. If data were missing the latest available was used** Data for drop out Egypt are not availableSource: Unesco St atistics and World Bank EdStat.
Despite the considerable amount of resources spent on education, access to education in rural areas in some countries remains an issue of concern. In Morocco, which dedicates the largest share of the budget to education in the region (1), access in rural areas (where still 38% of total population lives) is much lower than in urban areas. Inequality of access to education is also a major concern in Egypt, the second-worst performer among the countries under investigation. As pointed out by Assaad and Barsoum (2007), regions in Upper Egypt perform much worse than the rest of the country both in terms of enrolment and retention. Data from the Egyptian Labour Market Panel Survey in 2006 show that, although in Lower Egypt participation to education was in general quite satisfactory both in urban and rural areas, participation in Upper Egypt was substantially lower. In rural Upper Egypt the overall
(1) Nearly 26% of the budget in 2008.

Part III Thematic Issues
51
participation was only 89%, compared to 96% in rural Lower Egypt. Females were the most disadvantaged, with participation rate hardly reaching 85%. Major mobility constraints related to norms of gender propriety and household responsibilities have systematically put girls at a disadvantage in terms of school attendance. Also in Syria, access to education and literacy are relevant problems in some areas. In some eastern governorates, illiteracy among youth still reaches 15%-20%: much higher than the national level (Kabbani and Kamel, 2009). At the same time, poor quality of education, ineffective transmission of basic skills and lack of adequate facilities have hindered social mobility, and have contributed to the perpetuating of social disparities and exclusion of those who cannot afford supplementary teaching or access to higher level of education.
According to the World Bank (2008), attendance inequality is increasing. This is partly due to the rise in the average level of education. At the same time, access to higher level of education is correlated with income. This means that as the rich populations can afford to invest in higher education, the poor ones are excluded (1). Furthermore, richer families can afford complementary private education, thus overcoming some of the problems connected with poor quality of public schools. Inequality in education attainment in turn leads to unequal distribution of human capital, eroding its potential as a mechanism for reducing poverty and enhancing economic growth. This problem is particularly relevant in Lebanon, where access to higher educational levels seems to be strongly correlated with income. In fact, although primary enrolment is almost universal, only 24% of young people from the poorest households are enrolled in secondary schools and only 5% in university, with respect to 60% and 38% among the richest families (Chaaban, 2009).
Quality of education is a major concern. Results from the Trends in International Mathematics and Trends Studies (TIMSS) on eighth-grade students show a very poor performance for some countries, and most of them are still far from international averages. Also for lower grades, results seem
(1) The mismatch in the labour market could explain why so
far, the development in education inequality has not led to higher income inequality.
unsatisfactory, with Tunisia and Morocco ranking among the lowest for the fourth grade in both Maths and Science in 2003 and 2007.
Reading skills also seem to be quite weak in Morocco. In the Progress in International Reading Literacy Study (PIRLS) test for fourth-grade students in 2006, its average score is higher only than that of South Africa and is well below the international average. Taking into account the level of development and the enrolment rate shows that some of these countries underperform with respect to their level of development, whereas others see an improvement of their ranking (see Box III.1.1).
Teaching methodologies and test-oriented learning seem to play a part in the poor performance of the educational system and in the skills mismatch on the labour market. In many cases, learning models are based on memorization even at the higher levels of education and do not provide students with analytical capacities needed on the labour market. In some cases this approach is encouraged by the structure of the tests which must be passed in order to enrol in higher education. The high level of competitiveness of these tests compels parents to invest in private schools and supplementary tutoring. Outdated curricula are also a relevant issue and have been the object of several reforms in the previous years. In the last decade, Syria, oPt and Jordan have reformed and updated their curricula in order to match the needs of the changing economic environment.
Tertiary education also presents some weaknesses (see Graph III.1.8). In particular, the high enrolment rate in tertiary education was mainly driven by the guarantee of a job in the public
Graph III.1.8:Percentage of graduate per programme
0
5
10
15
20
25
30
35
40
45
50
Engineering,manufacturing and
const ructio n
Humanities and arts Social sciences,business and law
Science
MoroccoMiddle Lower IncomeAlgeriaJordanLebanonMiddle Upper Income
Source: Unesco Statistics

European Commission The EU's neighbouring economies: coping with new challenges
52
Box III.1.1: A short analysis of TIMSS 2007 results for Mediterranean neighbours
Although international tests results are to be taken with caution, they can be considered a reasonable proxy to compare learning performance across countries. The 2007 session of the TIMSS saw the participation of 48 developed and developing countries and, among them, seven countries in the Mediterranean neighbourhood. The latter countries' performance was, in general, below the developing economies' average in both math and science.
Graph 1: TIMSS 2007 results
300
320
340
360
380
400
420
440
460
480
500
A lgeria
Egyp
t
Jord
an
Lebanon
oPT
Syria
Tunis
ia
Math Score
Science Score
AverageDevelopingEconomies(Math)
AverageDevelopingEconomies(Science)
Source: G onzalez et al. (2008) and own calculat ions.
In many cases, students in the surveyed South Mediterranean countries showed only a basic knowledge of simple Mathematics and Science. Algeria, Egypt and oPt were clearly below the developing economies' average for both disciplines, while Lebanon had at least one score below this average. On the other hand, Jordan- which is characterized by one of the most modern educational system in the region - was above this average in both Maths and Science. Obviously, when compared to the whole sample including developed countries, the Mediterranean partners fared even worse, the majority of them being in the lowest quintile.These results, however, have to be weighed by the relative level of development and the level of education participation. We can thus correct our analysis by estimating the following equation: Test_scorei= α+β1GDPppsi+β2Enrol_Seci+β3Previousi+εi
where Test_score is the score in 2007 for country i, GDPpps is the GDP in Purchasing Power Parity per capita, Enrol_Sec is the gross enrolment rate for secondary education, and Previous is a dummy taking the value of one if the country took part in the test in 2003, added to capture possible learning effect about the structure and functioning of the test (Chaaban, 2009). In our estimate we consider only developing countries, according to the IMF classification, to allow for a more proper comparison and to reduce the risk of omitted variables. We also exclude the Gulf States, as suggested by the World Bank (2008), given their outlier nature. Comparing actual and predicted values for average test scores
should help to understand how countries perform with respect to their level of development and school enrolment. The following tables report the results (1): Table 1:Regression Results 1 2 1 2
TIMSS Math TIMSS Math TIMSS Science TIMSS ScienceVARIABLES
gdp pps pc 0.00475*** 0.00489*** 0.00426** 0.00424**(0.00156) (0.00155) (0.00163) (0.00159)
gross enr secondary 2.201*** 2.152*** 2.204** 2.210***(0.764) (0.761) (0.798) (0.78)
previous session 15,17 -1,993(15.41) (16.11)
Constant 192.7*** 205.0*** 226.2*** 224.6***(60.85) (59.52) (63.61) (60.98)
Observations 27 27 27 27R-squared 0,575 0,557 0,516 0,516
Significance: * 10%; ** 5%; ***1% Table 2:Comparison of Predicted and Actual Scores
CountryActual Predicted Actual Predicted
Algeria 387 421 408 452Egypt 391 393 408 406Jordan 427 422 482 436Lebanon 449 446 414 456OPT 367 423 404 438Syria 395 373 452 405Tunisia 420 446 445 459Average 405 418 430 436
MATH Science
In most cases the analysis provides evidence of the weakness of the educational system of these countries even controlling for the level of development and participation. The oPt, Algeria, Tunisia and Syria considerably underperform, indicating weaknesses other than low development among which we can surely consider the quality of the educational system. For Lebanon and Jordan the evidence is mixed. Jordan performs well in Science while Lebanon underperforms in this subject, but both are close to their predicted value in Mathematics. Egypt performs in line with its predicted value, suggesting that its poor test results are largely explained by its low level of development. Lastly, Syria performs well, with scores well above those predicted given its level of development and participation. This should not, however, be interpreted in a complacent manner; especially since this analysis ignores the important inequalities in educational achievement within Syria as underlined elsewhere in this chapter.
(1) Results of these regressions seem quite robust. The Ramsey
RESET test and Link Test do not reject the null hypothesis of correct specification and absence of omitted variables. The Shapiro-Wilks test does not reject normality of residuals.

Part III Thematic Issues
Box III.1.2: General inflation versus food price inflation in selected MED countries
Food inflation is measured by the CPI inflation for food items and non-alcoholic beverages only. The base periods for the CPIs were assigned to January 2006 or the first month for which data are available after that month. Source: Data for food price indexes come from Peters and Albers (2011).
53
sector. With the transition to a private-led economy, university preparation has to adapt to the necessities of the labour market in general in order to be relevant for young people. Humanities are still favoured by a large amount of young people, and curricula are often outdated and do not respond to the needs of the labour market. A similar structure yields poor returns for education in the private sector and contributes to high unemployment levels among graduates. Finally, vocational education and training suffers from the same problem.
1.4. VULNERABILITY TO FOOD AND ENERGY PRICES
South Mediterranean economies are highly vulnerable to changes in global food prices, and this has been another economic factor contributing to the recent social unrest in the region. In fact, it is not the first time that these countries are challenged by international price developments: the surge in global prices that started to emerge worldwide in the course of 2007, just before the global crisis, also contributed to causing social turmoil in several countries of the region.
Food items carry a much larger weight in the CPI basket of Mediterranean neighbours than in those of industrial economies, and several of the
Mediterranean neighbours are net food importers. The impact of hiking international prices on these economies is multiple. First, positive price shocks tend to intensify inflation pressures and to lower consumption. This trend is illustrated in Box III.1.2, which displays headline CPI inflation and food price inflation for selected counties in the region. Exposure to food prices can nevertheless be mitigated in countries with relatively important agricultural sectors. Thus, Albers and Peeters (2011) show that between end-2005 and mid-2008 food price increases were stronger in major net food importers, such as Algeria, Egypt, Israel, Jordan and Lebanon, compared to countries where the agricultural sector is larger, such as Tunisia and Morocco. Second, the economic effects of positive price shocks are reflected both in the current account balances of net food importers, through the deterioration of trade deficits, and in budget balances due to the implementation of generalized food subsidy systems. Indeed, the practice of subsidizing food (as well as energy) products is widespread in the region, subjecting countries to automatic increases in the cost of subsidies during periods of soaring prices. In addition, some countries have adopted discretionary increases in subsidies to ease consumer price inflation pressures. Many countries in the region were engaged in a process of reform of these costly subsidy systems, entailing their gradual replacement with means-tested systems of

European Commission The EU's neighbouring economies: coping with new challenges
54
transfers targeted to the poor. However, the recent social unrest and increases in international food and energy prices has led many countries to interrupt, and in some cases reverse, some of these reform efforts (1).
International energy prices also impact heavily on the economies of the region, as most countries rely almost exclusively on oil and natural gas to meet their energy needs. Rapidly-expanding populations, steady economic growth, and (as noted) widespread public subsidy systems are factors that drive up energy demand. As can be readily seen in Table III.1.1, South Mediterranean countries are entirely dependent on hydrocarbon energy, using only a small portion of other energy sources (below 5% of total energy used) to cover their needs. Illustrative examples are Morocco and Tunisia, where the use of non-hydrocarbon energy is quite modest despite the lack of natural hydro-carbon resources. Israel and Egypt are more advanced in exploiting non-hydrocarbon forms of energy, but even in these countries the non-hydrocarbon/hydrocarbon energy ratio is remarkably low. This is particularly striking for a developed country like Israel. Regarding the countries’ energy needs in terms of oil use per
(1) For a recent review of food and subsidies systems in the
region, see Albers and Peeters (2011).
capita, Israel is the leader among the oil importers, reflecting its higher degree of development, followed by Jordan and Lebanon (2).
Similarly to food price shocks, fuel price shocks can have important impacts on inflation, the trade balance and the fiscal position. Table III.1.1 reports on the net energy imports of each of the South Mediterranean countries for 2007 (a negative figure is indicative of a net energy exporter). As can be seen, the most externally vulnerable economies are Jordan and Morocco, followed by Lebanon and Israel, all of which are net importers. Algeria, Egypt, Libya and Syria stand in the net-exporter category for that year. Broadly speaking, fuel-price increases tend to harm the current account and budget positions of fuel importers, and benefit those of fuel exporters. However, they have unwelcome effects on inflation and the cost of subsidy systems regardless of whether countries are oil importers or importers.
Energy importers may suffer more inflationary pressures than energy exporters, as the former
(2) Interestingly, Jordan’s reliance on oil for meeting its
energy needs has in the past not been particularly high: the country used to cover almost 80% of its needs through imported gas from Egypt, before the gas supplies were disrupted in 2011 due to a number of terrorist attacks on the Egyptian gas pipeline.
Algeria 7,7 -1.876 million -353 1,068 0.1Egypt 27.2 -40,850 -24 840 2.0Israel 2.5 249.320 86 2.664 3.9Jordan 3.9 108.200 96 1.240 1.5Lebanon NA 86.750 95 1.113 1.3Libya NA -1.541 million -473 2.900 0.0Morocco 7.8 178.380 96 455 0.7Syria 14.4 -96.290 -29 960 1.5Tunisia 11.6 10.170 17 865 0.1
Table III.1.1:
* 2009 Figures. ** Figures correspond to 2007, except for Egypt (2009). Negative figures imply that the country is a net exporter. *** Figures correspond to energy use less production, both measured in oil equivalents. A negative value indicates that the country is a net exporter. Energy use refers to use of primary energy before transformation to other end-use fuels, which is equal to indigenous production plus imports and stock changes, minus exports and fuels supplied to ships and aircraft engaged in international transport. **** In percentage of total energy use. Non-hydrocarbon energy is energy that does not produce carbon dioxide when generated, including, among others, hydropower and nuclear, geothermal, and solar power. Source: Albers and Peeters (2011), CIA World Factbook, International Energy Agency.
CountryFood and fuel subsidies (% of government
expenditure)*
Net oil imports (bbl/day)**
Non-hydrocarbon energy****
Food and energy dependence of MED countries, yearly averages (2006-2009)
Energy use (kg of oil equivalent per
capita)
Net energy imports (% of
energy use)***

Part III Thematic Issues
55
economies do not normally enjoy the disinflationary buffer of a strengthening currency. On the other hand, some oil and gas exporters have relatively more generous subsidies systems. However, the overall impact of price increases on the budget is usually positive, due to increased fiscal revenues and dividends from oil and gas exports. It should also be noted that in some net oil importers with particularly close economic, financial and worker-remittances links with oil- exporting countries (notably with the rich Gulf Cooperation countries), the negative direct impact of energy price rises on GDP, on the balance of payments and on fiscal positions is buffered by the increased import demand, remittances and financial inflows from those oil exporters. This is the case, for example, in Jordan and Lebanon (1).
Table III.1.1 also provides information on the subsidy systems implemented by the countries of the region during 2009. As can readily be seen, in several countries subsidies amount to a considerable portion of government expenditures, thereby putting significant pressures on the fiscal balance during periods of soaring international prices. Egypt, Syria, Tunisia, as well as Algeria and Morocco have relatively costly energy subsidies systems; whereas in Israel the cost of these subsidies is fairly small.
In the case of Algeria and Libya, the economic dependence on energy for their export and fiscal revenues is nearly absolute and is indicative of these economies’ low degree of economic diversification With hydrocarbon exports amounting to more than 96% of total exports, and to more than two-thirds of budget revenues, it is no surprise that these economies were so markedly affected by the oil price decreases during the global economic crisis of 2009. For the first time after many consecutive years of strong surpluses, Algeria’s budget balance moved into negative territory in 2009, when the sharp drop in oil exports resulted in an almost balanced current account. Although Libya retained the surpluses in
(1) Impulse response analysis conducted by the IMF (2010)
has shown that in the case of Jordan, the negative income effect that normally follows an international oil price shock can be offset by a positive income effect that accompanies the corresponding foreign demand shock.
both sectors, the economy also suffered a significant loss of fiscal and export revenues (2).
Finally, another interesting feature of the region’s economies is the existence of significant downward rigidities in consumer price inflation (Albers and Peeters, 2011). This phenomenon of downward stickiness implies that negative shocks to world food prices do not lead to a commensurate downward adjustment of consumer prices. In marked contrast, the CPI is very sensitive to positive global price shocks.
1.5. THE ROLE OF THE PUBLIC SECTOR: CROWDING OUT AND FISCAL SUSTAINABILITY
State institutions have traditionally played a large role in the Mediterranean region. This is particularly the case within the main oil exporters, due to the accrual of oil revenues; while independence also promoted a strong role for the state in some other countries of the region, such as Syria and Tunisia.
Government expenditure
The large role played by the state is evidenced by the size of public expenditure as a share of GDP (see Graph III.1.9). In comparison to other low- and middle-income countries, the countries of the Southern Mediterranean show a much higher expenditure-to-GDP ratio. A large proportion of public expenditure is allocated to military spending, subsidy schemes, public sector wages and, in some cases, debt service costs. Military expenditure is high due to political tensions in the region. In particular, Israel and Jordan allocate around 6% of GDP, while elsewhere in the region the level of defence spending is between 2.5-5% of GDP. The capacity to reduce defence spending is difficult to estimate, given that it is inherently linked to concerns about national security.
Governments have in the past taken steps to streamline subsidy schemes on food and fuel. As noted above, such schemes place a large burden on
(2) Libya’s over-dependence on oil has also had severe effects
for the economy, as a result of the disruption of the production and export infrastructure caused by the recent armed conflict in the country.

European Commission The EU's neighbouring economies: coping with new challenges
56
public finances and their outlays are difficult to forecast accurately. In 2008, governments in the region were faced with escalating bills for subsidy spending that were largely unpredictable. Subsidy schemes are also market-distorting as they tend to encourage oversupply, and also tend to benefit those less in need since the schemes target consumption rather than means. Many countries in the region have expressed a desire to reduce or streamline subsidy spending. For example, in Morocco a scheme of means-tested direct social transfers, similar to the "Bolsa Familia"-style programmes in Latin America, is being piloted as a possible alternative to food and fuel subsidies. However, subsidy schemes are an established part of the political economy in many countries, and a lever upon which governments rely in times of unrest, such as in 2008 and more recently during the so-called "Arab Spring".
05
1015202530354045
Avg EU
Avg Low-to-Mid Inc.
Avg South MedAlgeria Egypt
IsraelJordan
LebanonMorocco
Tunisia
Source: World Bank, 2010
Graph III.1.9: Public expenditure (% of GDP)
Public sector wages also account for a high percentage of public expenditure. Public sector wage bills are as high as 11% of GDP in Tunisia, Lebanon, and Morocco, and are elevated in other countries of the region. This contrasts much lower levels in regional peers such as Turkey, where the wage bill is less than 6% of GDP, and points to inefficiency (Deutsche Bank, 2010). Conditions of public sector employment are often considered to be superior to those in the private sector, and for many young people the public sector is still the preferred employer. Given that studies have found that rent-seeking behaviour is one of the factors holding back economic development (Brach, 2008), increasing the efficiency of the public sector is essential in order to unleash greater growth potential.
Finally, in some highly indebted countries a significant of public expenditure must be devoted to servicing the debt, further constraining the room for fiscal manoeuvre. Interest payments on the public debt account for approximately 4% of GDP on average in the countries of the region. In Lebanon, the most highly indebted Southern neighbour, they account for around 10% of GDP (ECB, 2007).
Government revenue
On the revenue side of public finances, countries in the region have a similar or higher proportion of total revenue to GDP when compared with other emerging market economies. General government revenue as a percentage of GDP is on average 31% for countries of the Southern Mediterranean, compared to about 25.5% for other emerging economies and about 42.5% percent on average for countries of the European Union (see Graph III.1.10). However, the average for the Southern Mediterranean is skewed by the major oil exporters, particularly Libya where revenue is 60% of GDP. For the oil importers of the region, excluding Israel, the average total revenue-over-GDP ratio is around 24.5%, similar to the average for emerging market economies. Tax revenue is generally higher as a proportion of all revenue amongst oil importers than oil exporters, which compensate through direct transfers from state-owned oil funds.
0
10
20
30
40
50
60
70
Avg EU
Avg Emerg econs.
Avg South MedAlgeria Egypt
JordanLebanon
LibyaMorocco
SyriaTunisia
Israel
Graph III.1.10: General government revenue (% of GDP)
Source: IMF, World Economic Outlook, October 2010
Due to large informal sectors, poor tax compliance, and weaknesses in tax administration, the proportion of direct taxes in overall tax revenue is generally quite low (ECB 2007). Revenue from indirect taxation is generally more significant and appears to be preferred due to its ease of collection: Value Added Tax (VAT) is used in all

Part III Thematic Issues
57
countries except Libya and Syria. The IMF has highlighted that taxation systems in the region often display widespread and inefficient tax exemptions and privileges that narrow the tax base. The IMF (2011d) emphasises that there is also a need to broaden the coverage of the tax system to better include high-income and high-wealth taxpayers, which will both boost revenue and improve fairness. While trade liberalisation has brought down customs revenue, it remains high in some countries (e.g. Lebanon) and is still a significant component of revenue in some other countries. Finally, as noted above, direct foreign grants substitute for a part of government revenue in most countries, particularly Jordan and Israel. While donor support is essential in certain cases, it can lead to dependency and be unpredictable. For example, in 2010, donor funding for the occupied Palestinian territories fell significantly, forcing the Palestinian Authority to immediately hike lending.
In order to strengthen the tax base and to compensate for the trend of falling trade-related revenues, there is scope to increase the level of direct taxes. This does not necessarily entail raising tax rates, which could discourage job growth in the formal labour market, as greater direct tax revenue can also be generated through further improvements in tax administration including the elimination of tax evasion.
Hence the main challenges on the revenue side of public finances are to raise tax collections through tax reform; notably by increasing the level of direct payroll taxes, strengthening tax administration and compliance and, in the case of oil and gas exporters, diversifying the revenue base in order to reduce dependency on oil revenues.
Crowding out private sector development
Public finances of the Mediterranean countries have in general improved over the last twenty-five years. With respect to the main oil exporters, Algeria and Libya, the increase in production capacity and rising oil prices led to regular and sizeable fiscal surpluses up to 2008. With respect to the oil importers, the average size of fiscal deficits has on the whole fallen since the late 1980s, when some countries such as Egypt and Lebanon ran unsustainable fiscal deficits. There has been significant progress in reducing the level of government debt, which has fallen gradually
since the early 1990s (see Graph III.1.11). The decline can be attributed partly to greater fiscal discipline, improvements in public finance management including tax collection, high real GDP growth particularly during the period 2000-2008, and also in some cases, very high nominal growth rates. Nevertheless, and as noted in Part II.1.2, fiscal deficits widened again as a result of the 2009 global crisis and the current regional political turmoil, and public debt levels remain high in many of the oil importers. These relatively high budget deficits and public debt burdens contribute to crowd out financing away from the private sector.
Graph III.1.11:Debt to GDP ratio
0
50
100
150
200
250
19901992
19941996
1998 2000 2002 20042006
20082010
Algeria EgyptJordan LebanonLibya MoroccoSyria TunisiaAverage
Source: IMF
The extent to which the public sector crowds out private sector development is often difficult to assess. It depends on a range of factors in addition to the amount and nature of public expenditure and level of public borrowing, e.g. the degree of trade liberalisation, the business environment and regulation, macroeconomic stability, and the degree of development of the financial sector. In some cases, public spending can also enhance private sector development. For example, public investment in infrastructure is generally acknowledged to promote private sector activity. Nevertheless, the scale of public spending and the size of government debt, combined with characteristics of financial sectors, can potentially constrain the supply of private sector lending.
In the Mediterranean region, banks are the main source of business lending since capital markets do not play a significant role in most countries. Banking sectors in the Mediterranean region tend to be conservative in lending to the private sector,

European Commission The EU's neighbouring economies: coping with new challenges
58
which may partly reflect the availability of a large amount of government borrowing as well as a significant level of state ownership in the corporate sector. Lebanon has a huge banking sector, with assets of over 300% of GDP, but most of its assets are directed to holding government debt which is around 135% of GDP.
In Algeria, Syria and Libya, state ownership of the banking sector is around 85%, 75% and 60%, respectively, while in Egypt it is around 45% of total banking sector assets (see Graph III.1.12).
0
10
20
30
40
50
60
70
80
90
Algeria Libya Egypt Tunisia Morocco
Graph III.1.12: State ownership (% of total banking sector assets*)
Source: Deutsche Bank, 2010 * Data as of 2008
Interest rates tend to be high in the Mediterranean region (see Graph III.1.13), particularly in Egypt, Algeria and Syria.
0
2
4
6
8
10
12
14
Algeria
Egyp
tIsr
ael
Jorda
n
Leba
non
Libya
Moroc
coSyri
a
OECD A
vg
Graph III.1.13: Interest rates in selected MED countries
Sources: World Bank (2010), OECD (2008)
This may be a reflection of high government domestic borrowing in certain cases, as well as high inflation, inefficient financial sectors due to limited competition, and a lack of credit-related information on potential borrowers which deters banks from lending. Collateral requirements on private sector loans are particularly high in Syria, Algeria and Egypt, which can be linked to the paucity of credit-related information. As a result,
domestic credit to the private sector, as a percentage of GDP, is very low in several countries such as Syria, Algeria and Libya; although in other countries such as Jordan it is now approaching the level of GDP (see Graph III.1.14). Reflecting their restricted access to credit and a high cost of capital, many smaller private sector enterprises tend to rely on self-financing to finance investment rather than borrowing.
Government borrowing requirements have generally increased in the wake of the global economic crisis, as public finances have been allowed to expand to compensate for the drop in external demand, further constraining the private sector’s access to credit. Furthermore, since the need to rely upon domestic financing sources has increased, due to increased foreign investor risk-aversion towards the Mediterranean region, the short-term risks for crowding out private sector investment have risen.
In the net oil or gas exporting countries (Algeria and Libya), crowding out of the private sector may be exacerbated by the "Dutch disease" phenomenon, whereby strong oil or gas export revenues (accruing to the public sector) and large foreign direct investment in the domestic energy sector tend to push up real exchange rates and prices and to draw capital and human resources away from other industries (often in the private sector).
0
20
40
60
80
100
120
140
160
EU Avg
Algeria
Egypt
Israe
l
Jorda
n
Leba
non
Libya
Morocc
oSyri
a
Tunis
ia
MED Avg
Graph III.1.14: Domestic credit to private sector (2009)(% of GDP)
Source: World Bank, 2009
Finally, as discussed elsewhere in this chapter, high salaries, stable employment opportunities and prestige tend to attract some of the best-qualified workers to public administration and to bias the educational system in favour of producing graduates employable in government, to the detriment of the private sector's needs.

Part III Thematic Issues
59
In summary, public sectors in the Mediterranean countries continue to absorb an excessive share of the economy's resources, including financial resources. While progress has been made in improving public finances, fiscal consolidation remains a challenge and the reduction of the size of the public sector (including through privatisation) remains a priority in order to promote a greater role for the private sector while underpinning macroeconomic stability.
1.6. TRADE POLICIES AND REGIONAL INTEGRATION
Trade can be an important engine of growth, technological progress and competition, and can also prove a powerful instrument of job creation and poverty reduction. Unfortunately, the South Mediterranean countries show a relatively low degree of both international and intra-regional trade integration. This factor is likely to have contributed to the disappointing GDP growth performance exhibited by the region's economies in recent decades.
The Mediterranean neighbours have gone through a significant trade liberalization process since the 1990s. Trade policy reforms in these countries have mainly been in the form of reductions in tariff rates, simplification of export and import procedures, elimination of export licensing requirements and reduction or suppression of import licensing. The liberalisation efforts sometimes took place in the context of trade agreements with the EU and the United States. Nevertheless, tariffs remain high (reaching 12% on average), while non-tariff barriers are still important. Not surprisingly, several countries in the region rank at the highest end on trade restrictiveness measures (see, for example, the World Economic Forum's Global Competitiveness Report 2010/11).
Partly as a result of their more restrictive trade regimes, the Mediterranean neighbours have much lower trade openness ratios, as measured for example by the share of their exports to GDP, than other emerging market economies. On average, the exports of oil-importing Mediterranean countries currently represent about 15% of GDP, compared to more than 25% for emerging and developing
countries overall (1). Outside the oil and gas sectors, the share of the Mediterranean ENP countries' exports in world trade has stagnated over recent decades, in contrast to the doubling of market shares seen by emerging and developing economies as a whole.
According to a recent empirical study by the IMF, the limited international trade integration of South Mediterranean countries is the main factor explaining their growth gap with respect to Emerging Asia, accounting for about 1 percentage point of the growth difference (2). For a region that has a stock of 20 million unemployed people and a labour force that grows by nearly 3.4% annually, the foregone opportunity for job creation is large.
Trade openness increased significantly in most Mediterranean countries during the decade preceding the global crisis, supported by trade liberalisation efforts and the rapid expansion of world trade. Egypt provides an illustrative example of this trend (see the evolution of its trade openness ratio in Graph III.1.15) (3): although Egypt represents a relatively closed economy in the region, its trade expanded by almost 40% between 1995 and 2008. Morocco, Lebanon and Israel have also advanced significantly in their trade integration process.
Graph III.1.15: Trade openess
30
60
90
120
150
1995
1996
1997
1998
1999
2000
2001
2002
2003
2004
2005
2006
2007
2008
2009
AlgeriaEgyptIsraelJordanLebanonLibyaMoroccoSyriaTunisia
Source: World Bank.
During the global crisis of 2008-2009, trade in the South Mediterranean region generally showed a downward trend, reflecting the disrupted (1) IMF (2010a). (2) See IMF (2010a). Other key explanatory factors identified
by this econometric study are the investment climate (ease of doing business), the excessive weight of the public sector, and the educational system.
(3) Data come from the World Bank Development Indicators.

European Commission The EU's neighbouring economies: coping with new challenges
60
international trade flows. In Jordan, for example, total trade declined by nearly 30% in 2009 compared to its 2005 peak level; whereas Tunisia experienced a 15% decline in trade between 2008 and 2009. While trade recovered markedly as the global recession was left behind, the regional political turmoil of 2011 has again had a negative impact on trade for several Mediterranean countries, through disruptions in production, weaker domestic demand, and civil conflict in some key trading partners or trading routes (Libya and Syria).
The South Mediterranean countries have made some effort towards deepening trade amongst themselves, although the coverage and outcomes have been rather modest. The Agadir Agreement, linking Tunisia, Morocco, Jordan, and Egypt, has been in place since 2007 and is open to other Arab Mediterranean countries. Furthermore, a number of free trade agreements have been concluded between Israel and Southern Mediterranean partners, and other bilateral free trade agreements between countries in the region are being negotiated. Tariffs have been reduced under the Greater Arab Free Trade Area (GAFTA), representing the most comprehensive trade agreement within the region (1). Yet despite these efforts, regional trade integration has remained remarkably low. Given the complementary nature of the economic activities in the region, there is ample room for more cross-border trading.
There is also scope for deeper integration with the EU, which represents the leading trade partner of the region and a key foreign investment partner as well. The EU accounts for over 40% of total Southern Mediterranean exports and is the first source of the region’s imports. EU exports to Southern Mediterranean countries, for their part, represent 8.5% of total EU external trade: not an insignificant share. Between 2004 and 2008, Southern Mediterranean exports to and imports from the EU have grown by an average of, respectively, 11% and 8% per year. In 2009, trade between the two regions registered a strong contraction on account of the impact of the global
(1) The GAFTA Area, also known as the Pan-Arab Free Trade
Area (PAFTA), was established in February 1997, and has so far been signed by Jordan, Iraq, Saudi Arabia, Kuwait, Yemen, Lebanon, Egypt, Bahrain, Libya, Oman, Qatar, Syria, Morocco, Sudan, Tunisia, the UAE, Palestine, and Algeria. See also Abedini and Peridy (2007).
crisis (-20% compared to 2008); but trade came back to pre-crisis levels in 2010, with Euro-Mediterranean total trade amounting to EUR 141 billion.
Trade relations with the EU are relatively well advanced for Tunisia, Morocco, Egypt and Jordan, but less so for Syria, Algeria and Libya. They are essentially based on the free trade areas established under the Euro-Mediterranean Association Agreements (except for Libya and Syria). These agreements have boosted trade between the two shores of the Mediterranean. To further deepen trade relations, the EU has recently developed a comprehensive strategy of trade integration; as reflected in the Joint Communication on the South Mediterranean of 8th March, the conclusions of the European Council meetings of March and June, and the review of the European Neighbourhood Policy at the end of May 2011. This strategy builds upon the EU’s recent economic integration initiatives, including the Euro-Mediterranean Association Agreements. It includes the ongoing negotiations on further trade liberalization for agricultural products and services; the PanEuroMed system of cumulating rules of origin and the signing in June 2010 of a single regional convention on Pan-Euro-Mediterranean preferential rules of origin; incoming negotiations on agreements over assessment and acceptance of industrial products (ACAA); and the possible future launching of negotiations on fully fledged deep and comprehensive free trade areas that will enhance integration between the economies of the Southern Mediterranean and the EU single market. In addition, the European Union has long supported intra-regional integration initiatives, notably the development of the Agadir agreement, including by supporting its secretariat. This agreement uses the European Union’s rules of origin and takes some of its temporary exceptions from the liberalization schedules of the Association Agreements of the EU, which should facilitate its member countries’ trade with the EU.
Fostering trade and economic integration with the EU can be beneficial for both the EU and the Southern Mediterranean countries, helping both sides to build an area of shared prosperity. Integration with the EU can also promote better and more stable regulatory frameworks in the Mediterranean neighbours, with a positive effect also on the investment climate.

Part III Thematic Issues
61
There is also scope for furthering trade integration with other key developed countries (notably the United States) and with the emerging market economies of Asia and Latin America. Despite the fact that global growth and trade is shifting towards emerging markets (with the Brazil, India, Russia and China alone having contributed to about half of global GDP growth in recent years), the share of Mediterranean countries' exports to emerging economies remains relatively limited (even though it has picked up somewhat in recent years). Important trade growth opportunities are, therefore, being missed in this respect.
In sum, the Mediterranean countries must deepen their international and intra-regional trade integration, so as to allow trade to act as an engine of growth.
1.7. CONCLUSIONS
Growth and employment performance in the South Mediterranean countries has been disappointing compared to other emerging market regions, contributing to the social dissatisfaction that triggered the "Arab Spring". Empirical evidence and worldwide comparisons suggest that the South Mediterranean countries do not fully exploit their growth potential. Although several countries in the region have stepped up structural reform efforts towards job creation, public finance management improvement, financial market development and trade liberalization, there are still several other factors constraining economic development and prosperity in the region.
Population dynamics combined with inefficient labour markets have, in most cases, been a major obstacle to job creation, social welfare and growth. High unemployment, especially among the educated youth, has long been a challenge for policymakers and a cause behind the social and political unrest of 2011. In this context, more flexible and better-regulated labour markets are badly needed, especially in cases where the size of the informal economy is relatively high. The development of the private sector is critical in combating unemployment and boosting growth. Government initiatives for enhancing the business climate, improving competitiveness and encouraging investment could therefore be particularly helpful. At the same time, skill
mismatches and shortages can be eliminated through the improvement and reform of the education system and the development and design of active labour market policies. Better aligning the human capital of these countries with labour market needs would not only help reduce unemployment and migration pressure, but also translate into higher productivity and growth.
Although the sizeable public sector in several economies in the region has traditionally played a pivotal role both in terms of job creation and infrastructure investment, it may also have constrained private sector development by diverting both labour and financial resources away from the latter. In countries with relatively high fiscal deficits and heavy public debt burdens, government spending crowds out scarce finance from private enterprises. Low financial integration combined with increased state ownership in the banking sector and high interest rates have also hampered the private sector's access to credit.
Public sector efficiency is further challenged by unpredictable and costly subsidy systems, expanded military spending, heavy wage bills and increasing debt service costs. Broadening the coverage of the tax system, increasing collections from direct taxes, and fighting tax evasion would contribute to more equitable and sustainable public finances. Despite the progress of the last decades in the field of public finance management, there is still room for improvement. Fiscal consolidation remains a challenge. The fiscal adjustment undertaken by several countries in the past has been temporarily reversed by the impact of the global and regional crisis on revenues, and by expansionary policies adopted to respond to increasing social demands. Moreover, the recent hike in international prices has stalled reforms of the subsidies system in some countries. Although these immediate policy responses may have boosted domestic demand and consumption in the short term, fiscal consolidation should remain a priority towards macroeconomic stability, private sector development and sustainable growth.
The large exposure to international food and fuel prices represents another source of economic vulnerability. As a policy response, governments have been taking significant measures to diversify their economies, increase dependence on renewable energy and develop the non-

European Commission The EU's neighbouring economies: coping with new challenges
62
hydrocarbon sector. Despite the progress achieved in this respect, fuel dependence remains nearly absolute in some economies, leaving substantial room for further improvement. Moreover, it is essential not to abandon plans to gradually replace generalised food and energy price subsidies with targeted social transfers.
Finally, low international and intra-regional trade integration is likely to have undermined economic development in the South Mediterranean countries during the last decades. Although trade liberalisation efforts have been significant, the deepening of trade integration, at both international and intra-regional level, remains a major challenge. Higher trade integration can boost employment, reduce poverty and contribute to shared prosperity for all trading partners. The EU is contributing to this through its trade policies, including the intention to negotiate Deep and Comprehensive Free Trade Agreements with countries in the region which meet certain pre-conditions.
Given the current economic challenges of the region, the need to pursue an ambitious reform agenda that will help economies to combat unemployment, consolidate macroeconomic stability and exploit sustainably higher sources of growth, is stronger than ever. With the external and domestic environment far less supportive than before, economic performance largely depends on structural reforms aimed at improving resource allocation and the functioning of the economy.
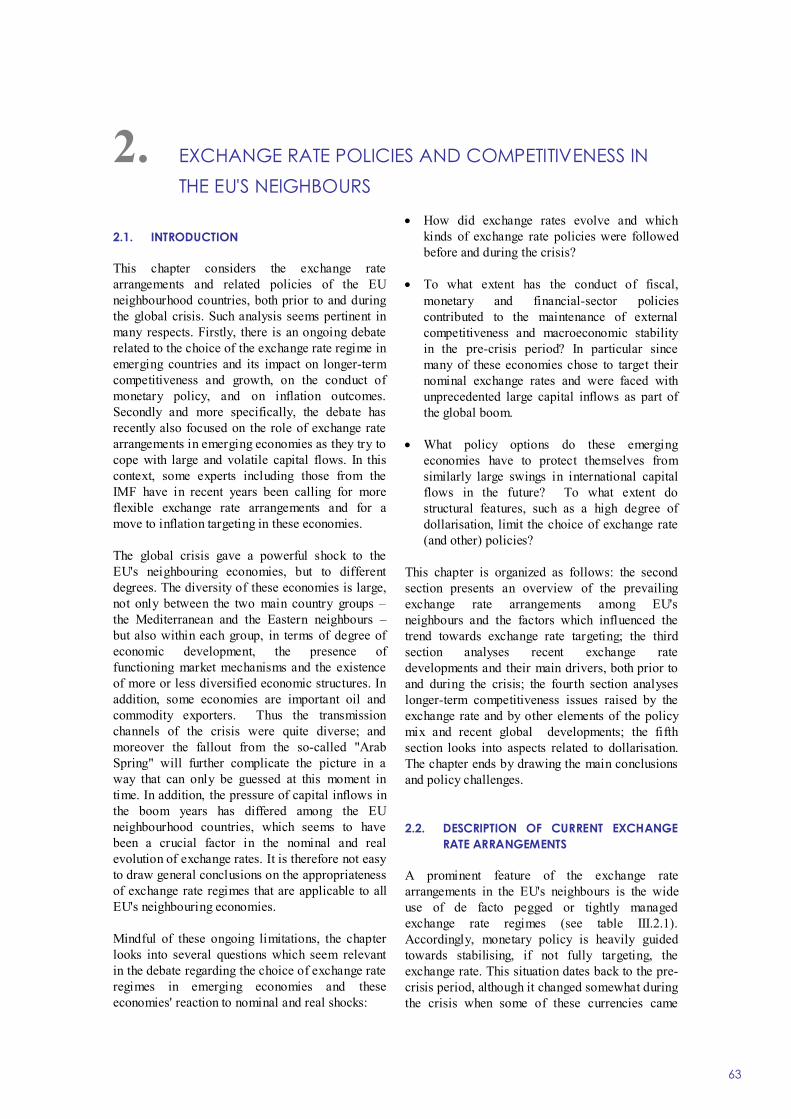
2. EXCHANGE RATE POLICIES AND COMPETITIVENESS IN THE EU'S NEIGHBOURS
63
2.1. INTRODUCTION
This chapter considers the exchange rate arrangements and related policies of the EU neighbourhood countries, both prior to and during the global crisis. Such analysis seems pertinent in many respects. Firstly, there is an ongoing debate related to the choice of the exchange rate regime in emerging countries and its impact on longer-term competitiveness and growth, on the conduct of monetary policy, and on inflation outcomes. Secondly and more specifically, the debate has recently also focused on the role of exchange rate arrangements in emerging economies as they try to cope with large and volatile capital flows. In this context, some experts including those from the IMF have in recent years been calling for more flexible exchange rate arrangements and for a move to inflation targeting in these economies.
The global crisis gave a powerful shock to the EU's neighbouring economies, but to different degrees. The diversity of these economies is large, not only between the two main country groups – the Mediterranean and the Eastern neighbours – but also within each group, in terms of degree of economic development, the presence of functioning market mechanisms and the existence of more or less diversified economic structures. In addition, some economies are important oil and commodity exporters. Thus the transmission channels of the crisis were quite diverse; and moreover the fallout from the so-called "Arab Spring" will further complicate the picture in a way that can only be guessed at this moment in time. In addition, the pressure of capital inflows in the boom years has differed among the EU neighbourhood countries, which seems to have been a crucial factor in the nominal and real evolution of exchange rates. It is therefore not easy to draw general conclusions on the appropriateness of exchange rate regimes that are applicable to all EU's neighbouring economies.
Mindful of these ongoing limitations, the chapter looks into several questions which seem relevant in the debate regarding the choice of exchange rate regimes in emerging economies and these economies' reaction to nominal and real shocks:
• How did exchange rates evolve and which kinds of exchange rate policies were followed before and during the crisis?
• To what extent has the conduct of fiscal, monetary and financial-sector policies contributed to the maintenance of external competitiveness and macroeconomic stability in the pre-crisis period? In particular since many of these economies chose to target their nominal exchange rates and were faced with unprecedented large capital inflows as part of the global boom.
• What policy options do these emerging economies have to protect themselves from similarly large swings in international capital flows in the future? To what extent do structural features, such as a high degree of dollarisation, limit the choice of exchange rate (and other) policies?
This chapter is organized as follows: the second section presents an overview of the prevailing exchange rate arrangements among EU's neighbours and the factors which influenced the trend towards exchange rate targeting; the third section analyses recent exchange rate developments and their main drivers, both prior to and during the crisis; the fourth section analyses longer-term competitiveness issues raised by the exchange rate and by other elements of the policy mix and recent global developments; the fifth section looks into aspects related to dollarisation. The chapter ends by drawing the main conclusions and policy challenges.
2.2. DESCRIPTION OF CURRENT EXCHANGE RATE ARRANGEMENTS
A prominent feature of the exchange rate arrangements in the EU's neighbours is the wide use of de facto pegged or tightly managed exchange rate regimes (see table III.2.1). Accordingly, monetary policy is heavily guided towards stabilising, if not fully targeting, the exchange rate. This situation dates back to the pre-crisis period, although it changed somewhat during the crisis when some of these currencies came

European Commission The EU's neighbouring economies: coping with new challenges
64
under pressure. The only notable exception was Israel, which already had an independent float and a fully-fledged inflation targeting (IT) regime before the crisis. Among the two main groups, the Mediterranean region displays a higher share of de facto or de jure pegs than the Eastern neighbours. Moreover, during the crisis it was the latter group that did more to increase exchange rate flexibility, for reasons that will be highlighted below.
Mediterranean countries
Nearly all the countries in the Mediterranean region except Israel are subject to exchange rate anchors. Jordan and Lebanon peg their currencies to the US Dollar, Libya and Syria to the SDR, while Morocco and Tunisia set their exchange rates against a basket in which the euro has a dominant weight. Algeria and Egypt use tightly-managed floats against the US Dollar. Algeria aims at maintaining the real effective exchange rate close to an equilibrium level consistent with external stability and which minimizes the risk of misalignment stemming from oil price volatility and the euro/US Dollar exchange rate. At the same time, Egypt has gradually allowed more flexibility to its exchange rate as part of a planned transition towards IT.
Historically, the choice of fixed exchange rate regimes in the region was largely based on the advantages that external anchors could deliver to relatively small and open economies (1) with insufficiently developed instruments for monetary policy transmission (2), with a low degree of financial integration with the outside world, with a bad track record in terms of domestic inflation and monetary policy credibility, and with relatively plentiful international reserves (3). Daly and Sami (2009) have investigated empirically the determinants of the choice of exchange rate regimes in 15 MENA countries during 1977-2007, using two sets of variables – one emanating from the optimum currency area (OCA) theory and another one based on other macroeconomic
(1) Egypt does not fit so well in this category, however. (2) In particular with relatively shallow financial markets
and/or a high degree of dollarisation (note that Lebanon has a more developed and sophisticated financial sector, but at the same time is highly dollarized).
(3) This especially applies to the oil producers (Algeria and Libya), which have seen their foreign exchange reserves surge over the last few years.
variables. They found that the exchange rate regime choices were largely consistent with the predictions of the OCA theory. Among the other explanatory macroeconomic variables, the results showed that high international reserves played a major role in explaining the choice of fixed exchange rate regimes among the MENA countries.
Overall, Mediterranean economies were able to contain inflationary pressures during the last two decades by pegging their currencies to a relatively low-inflation currency – mainly the US Dollar – and by relying on high interest rate policies to defend their exchange rates. Elbadawi and Kamar (2006), for example, show that the pegged regime led to a reduction of inflation inertia for Jordan, Tunisia and Morocco; whereas for Egypt, which abandoned pegging in 2003, evidence is mixed. In recent years, there has been a desire to move towards more flexibility. Neaime (2008) explains that some central banks in the region have developed their foreign exchange markets and allowed them to play a greater role in determining the exchange rate. Some countries also opened their financial sectors to foreign players and further liberalized capital movements, which highlighted the drawbacks of exchange rate targets in this respect. In parallel, Egypt, Morocco and Tunisia have expressed their intention to gradually move towards an IT regime. It is obvious that enhanced monetary independence cannot be sought in a context of freer capital flows and more sophisticated financial sectors without greater exchange rate flexibility. This search for alternative policy anchors was motivated by the threats to external competitiveness caused by appreciation pressure on real exchange rates, by inflationary pressures in the context of increasing global capital flows, and by several currency crises that occurred in the 1990s (4).
Despite this longer-term trend towards higher exchange rate flexibility, the crisis did not trigger significant changes to the existing exchange rate arrangements in the region, unlike amongst the Eastern neighbours. Yet interestingly enough, Israel could again be seen as an exception. It moved somehow against the general trend by increasing its discretionary interventions in the exchange rate market during the global crisis, (4) For example, in Egypt, Jordan, Lebanon or Turkey.

Part III Thematic Issues
65
following significant appreciation pressures. The relative stability of exchange rate regimes in the Mediterranean neighbours during the crisis can be explained primarily by the relative benign exchange rate pressures (compared to the Eastern neighbours, for example); primarily due to low exposure of financial sectors to global financial markets, generally modest levels of foreign currency denominated debt (1), and well-established sources of external financing (e.g. remittances, financial assistance from international agencies, etc). In addition, when depreciation pressures did occur, they could be handled rather easily due to the relatively high levels of international reserves (2) and the use of various monetary policy instruments. Therefore, significant changes in the exchange rate regimes or in the values of the pegged rates were not necessary.
What mattered most in our view for the exchange rate stability of the region during the global crisis - as we shall try to explain in the following sections - was the fact that in the years immediately preceding the global crisis, the real exchange rate appreciation of these currencies together with the
(1) One exception is Lebanon, which had an external debt ratio
of about 160% of GDP at the end of 2010. (2) Further boosted by the IMF's special SDR allocation in
September 2009.
accompanying inflows of international capital were not as large as in their Eastern counterparts. Therefore the reversal tide of international capital and the accompanying depreciation pressures were much more limited.
Eastern neighbours
In contrast to the Mediterranean countries, the exchange rate policies of the Eastern neighbours underwent significant changes during the crisis. Before the crisis, exchange rates were pegged or tightly managed against the US Dollar in most of these countries; with conventional pegs in Azerbaijan, Belarus and Ukraine, and managed-float arrangements in Georgia, Moldova and Russia which allowed only for small fluctuations of the respective exchange rates. The Armenian dram had also been quite stable against the US Dollar in 2007-2008. Consistently with this, monetary policies were also largely targeting the exchange rates. The preference for heavily managed exchange rates, with outcomes close to a fixed peg in some cases, reflects the Mediterranean countries' use of exchange rate anchors in order to bring down the pervasive inflation during the early stage of the transition. Other reasons explaining the "fear of floating" in these countries are the high levels of liability dollarisation, the potential output costs in case of excessive exchange rate volatility,
Table III.2.1:
De facto regime Reference currency Fluctuation band Monetary policyChange of regime during the crisis
Eastern neighboursArmenia Floating n.a. Inflation targeting Yes
Azerbaijan Conventional peg de jure to EUR/USD, de facto to USD n.a. Exchange rate targeting No
Belarus Conventional peg USD ± 2% Exchange rate targeting YesGeorgia Managed float USD n.a. Exchange rate targeting Yes
Moldova Floating USD n.a. Transition to inflation targeting YesRussia Managed float USD n.a. Exchange rate targeting YesUkraine Peg USD n.a. Exchange rate targeting YesMediterranean countriesAlgeria Managed float USD n.a. Monetary targeting No
Egypt Managed float USD n.a. Exchange rate targeting NoIsrael Floating n.a. Inflation targeting YesJordan Conventional peg USD n.a. Exchange rate targeting NoLebanon Conventional peg USD ± 6.5% Exchange rate targeting NoLibya Conventional peg SDR n.a. Exchange rate targeting No
MaroccoConventional peg (basket) EUR/USD n.a. Exchange rate targeting No
Syria Broad Peg SDR n.a. Exchange rate targeting No
TunisiaConventional peg (basket) EUR/USD n.a. Exchange rate targeting No
Sources:Commission Services based on IMF and National Authorities
Exchange rate arrangements in the EU's neighbour countries

European Commission The EU's neighbouring economies: coping with new challenges
66
and other unresolved problems regarding monetary transmission (1). As regards compatibility with OCA theory, von Hagen and Zhou (2002) find less OCA-based support for pegging in the case of Eastern Neighbours as compared to the support from stabilization arguments. In any case, the level of foreign reserves seems to play a minor role with respect to other emerging countries.
However, during the global crisis the situation changed significantly; primarily because of the need to accommodate the large depreciation pressures, which accompanied the reversal of capital flows and the deleveraging process which began to unfold in the banking sector in some countries. Therefore a move towards more flexible exchange rate arrangements and currency devaluations occurred in several economies of the EU's Eastern neighbours.
Russia’s monetary and exchange rate policy framework has often been referred to as a de facto nominal exchange rate peg. Monetary policy has pursued two goals over the past decade: to reduce inflation, and to limit the real appreciation of the rouble. For the latter, intervention in the foreign exchange market has been the central bank's main instrument. In February 2005 the Russian central bank decided to peg the Russian rouble against a USD-EUR basket with a 10% weight for the euro (thus a 90% weight for the US Dollar). Later in 2005, the Bank of Russia increased the weight of euro to its current level of 40%. During the crisis the exchange rate was allowed to depreciate sharply, but only after the central bank lost about USD 200 bn in reserves trying to defend the de facto peg (2). Going forward, a more flexible exchange rate policy would allow Russia to conduct a more independent monetary policy in order to counter inflationary pressures and pursue other macroeconomic objectives. Therefore the central bank is likely to continue its efforts to allow for somewhat greater exchange rate flexibility.
(1) For example: the relationship between monetary
aggregates, inflation and output is less subject to reliable econometric specifications; in practice the independence of central banks is weaker; directed credits was a problem in a few countries; etc. See also Keller and Richardson (2003).
(2) Russia first engineered a controlled depreciation of the rouble during the last quarter of 2008, before letting the exchange rate adjust to market pressures in the first quarter of 2009.
In March 2009, Armenia returned to a floating exchange rate regime and, as a result, the dram depreciated by about 20% vis-à-vis the US Dollar. In January 2009, Belarus changed the peg of the rouble to a basket of currencies including the euro, the US Dollar and the Russian rouble; while the band was expanded to ± 10% relative to the value of the basket. In April-May 2011, renewed exchange rate pressures led first to a widening of the fluctuation band to ± 12%, and then to a sharp depreciation of the rouble by about 36% as a dual exchange rate market took hold. The fluctuation band was also narrowed to ±2%. Georgia had introduced a de facto exchange rate peg to the US Dollar in the wake of the August 2008 armed conflict, but later allowed the exchange rate to depreciate substantially (3) and gradually moved to a more flexible exchange rate regime. However, a certain level of intervention by the monetary authorities persisted, and the level of intervention increased again in May 2010 to contain the rate of depreciation. In June 2010 the authorities reduced the level of intervention on the exchange market, allowing a depreciation of the currency by around 10% against the US Dollar. Under pressure, Moldova and Ukraine also allowed their exchange rates to fall sharply, even though central banks attempted to slow the pace of depreciation. Eventually, Moldova allowed more exchange rate flexibility at a depreciated value. Ukraine reverted to a de facto peg fixed at a weaker rate, while committing to a gradual transition to a floating currency and to domestic price stability as the primary monetary target.
The choice of the exchange rate regime
In briefly presenting the exchange rate arrangements in the EU's neighbours and their evolution through the crisis, we have also touched upon some of the considerations that informed the choice of those exchange rate regimes. There is a wide body of economic literature highlighting the pros and cons of the various exchange rate regimes, but we will not dwell extensively on it here. For the purpose of the chapter, we will focus on some considerations regarding the link between the choice of the exchange rate policy and capital flows. This seems particularly relevant in the current global context of large and volatile capital
(3) A 13% depreciation of the lari took place during the second
week of November 2008.

Part III Thematic Issues
67
flows, which may impact negatively the stability of the neighbouring economies.
Until recently, soft pegs were viewed favourably and were widely adopted by many developing economies; in particular as a nominal anchor within the framework of stabilisation programmes. However, in the context of the currency crises of the last decade, the stabilisation role of the soft pegs was brought under increased scrutiny by the economic literature; especially in light of the deeper integration of international capital markets. The concept of the open-economy trilemma (1) emphasizes the inherent difficulties encountered by soft pegs. In many cases, the adoption of a soft peg was viewed as a way to have both fixed exchange rates and domestic monetary policy for a country with a high degree of capital mobility. In practice, it has become increasingly difficult to respond to domestic and external shocks that impact the equilibrium exchange rate given higher international flows of capital, and countries with soft pegs are now more prone to speculative attacks. As a consequence, after the financial crises in East Asia, Russia, Turkey and Argentina, policy discussions began to favour corner solutions: namely hard pegs and free floats. Yet in his seminal article, "No Single Currency Regime is Right for All Countries or at All Times" (1999), Frankel acknowledges the new trend favouring corner solutions but emphasizes that for some countries, during certain time spans (particularly when large-scale capital flows are not an issue), intermediate solutions may also be appropriate.
However, both fixed exchange rates and free floats are subject to various risks in terms of vulnerability to the accumulation of imbalances and incidence of currency crises. Large capital inflows are under normal circumstances associated with an appreciation of the real exchange rate; this will occur no matter what the exchange rate regime is. However, the real appreciation is brought about in different ways: under a free-floating regime, the nominal exchange rate adjusts in order to keep the balance of payments in equilibrium; whereas under a fixed regime, the onus lies entirely on the adjustment of relative prices (of non-traded versus
(1) According to which it is impossible for a country
simultaneously to have a fixed exchange rate, perfect capital mobility, and a monetary policy guided towards domestic objectives.
traded goods). In the case of inherent rigidities in the adjustment of prices, adjustments towards a new equilibrium may be slower, implying higher costs in terms of output loss (recessions) than under the flexible exchange rate option. However, nominal exchange rate fluctuations can also have harmful consequences (e.g. in cases of balance-sheet mismatches, high dollarisation, etc). In addition, policy interventions and public expectations may also play an important role
When it comes to dealing with large capital inflows, it has been argued that pegged exchange rates may induce a problem of moral hazard as investors make a one-way bet counting on the ability of the authorities either to defend the pegged exchange rate or bail-out vulnerable financial institutions. A credible fixed exchange rate eliminates (or reduces the propensity to hedge) foreign currency risk, and encourages domestic firms and banks to borrow on international capital markets at more advantageous interest rates. Subsequent over-borrowing may lead to increased consumption and speculative bubbles that are unwarranted by the evolution of fundamentals. In the process, the banking sector may become too leveraged in a currency for which the domestic central bank cannot act as a lender of last resort. The ensuing capital outflows and deleveraging pressures in the financial sector put strain on the authorities to restore macroeconomic and financial stability which may entail a significant fiscal cost.
Given that capital flows to developing countries have risen considerably since the early 1980s, increasing the potential for large and sudden reversals in net flows (as it happened in the current crisis), managing the appreciation pressures of volatile capital inflows becomes of paramount importance. At least in theory, capital inflows are easier to deal with under more flexible exchange rates, where uncertainty and two-way bets can discourage the more volatile speculative flows. This policy issue remains relevant in the aftermath of the crisis, when the prolonged accommodative monetary policy on a global scale is posing significant challenges in terms of managing large capital inflows in some emerging countries, notably in Latin America and Asia (IMF, 2011b).
An additional factor in favour of flexible exchange rates is that they help to limit the inflationary effects of capital inflows. In practice, the relative

European Commission The EU's neighbouring economies: coping with new challenges
68
price adjustment under pegged exchange rates vis-à-vis the world rarely occurs in a smooth way, as structural rigidities may entrench an inflationary bias. In turn, this may lead to a higher inflation component resulting in very low or even negative real interest rates. In turn, this may feed into higher credit growth and financial sector expansion, exacerbating external vulnerabilities.
While large and volatile capital inflows tend to increase the relative advantage of flexible exchange rates, at the end of the day the pros and cons of fixed versus flexible rates depend a lot on specific country circumstances, and a priori there is no "optimal" solution apparent. Moreover, the choice of the exchange rate regime should not be overplayed, as it is not the only policy decision affecting macroeconomic stability. For example, Calvo and Mishkin (2003) discuss a series of macroeconomic and institutional characteristics deriving from the realities of emerging market economies that might predispose a country to favour either fixed or floating exchange rates. Faced with the multitude of strengths and weaknesses displayed by each exchange rate regime, they conclude that the choice of the exchange rate regime is likely to be of second-order importance. They argue that authorities should concentrate much more on institutional reforms – such as improved bank and financial sector regulation, fiscal restraint, sustainable and predictable monetary policy, and increasing trade openness – rather than treat the exchange rate regime as a primary choice.
Overall, a fixed exchange rate arrangement can serve a developing country well when certain conditions are met (Mussa, Masson, Swodoba, Jadresic, Mauro and Berg, 2000): namely a low degree of involvement with international capital markets; a high share of trade and financial transactions with the country to whose currency it pegs; exposure to similar shocks across the two countries; a need for an external anchor for monetary policy credibility (1); flexible labour and product markets; and high international reserves. As countries evolve towards increased financial integration with the rest of the world, and benefit from lower inflation and enhanced monetary policy transmission, it appears that greater exchange rate flexibility can help them better to (1) In particular when high inflation needs to be tamed.
cope in an environment of large and volatile capital flows. In the remainder of this chapter, we shall try to see whether these theoretical considerations also fit the experience of the EU's neighbours so far.
2.3. RECENT EXCHANGE RATE DEVELOPMENTS
This section presents exchange rate developments in the analysed economies, both in nominal and real terms and before and during the crisis. The evolution of the real exchange rates provides a key measure of external competitiveness, and will be complemented by the analysis of other indicators in the next section which deals exclusively with competitiveness issues.
Mediterranean countries
Before the crisis, nominal exchange rates had been quite stable against the US Dollar (see Graph III.2.1), although with a slightly appreciating trend most visible for the Israeli shekel, the Algerian dinar, the Moroccan dirham and the Tunisian dinar. However, between 2005 and 2007 – just before the global crisis – even these larger nominal appreciations were contained at 10-20% (only the shekel appreciated in the vicinity of 30%), being on average much lower than nominal currency appreciations in several of the Eastern neighbours. During the global crisis, exchange rate swings were generally less pronounced than amongst the Eastern neighbours, and the currencies exhibited remarkable stability. Broadly there was an appreciation against the US Dollar and/or a depreciation against the euro during the initial stage of the crisis from August 2007 to August 2008. This trend was then reversed until Spring 2009, when global financial markets began to stabilise. In 2010, the currencies tended first to depreciate and then to appreciate again against the US Dollar. Even with the start of the "Arab Spring", the currencies concerned did not exhibit much increased volatility (except for the Egyptian pound (2)), confirming the relative stability of exchange rates in the region. The Tunisian dinar depreciated slightly against the euro over the entire
(2) The Egyptian pound remains under pressure, with markets
pricing in depreciation over a 3- to 12-month horizon. This pressure has eased from February, but the drain on foreign assets has persisted.

Part III Thematic Issues
69
period (although the euro is dominant in the pegged currency basket), as the authorities tried to maintain a relatively stable real effective exchange rate. The latter also explains the larger fluctuations of the Tunisian dinar against the US Dollar.
Graph III.2.1:Monthly nominal exchange rates (MED)
80
85
90
95
100
105
110
115
120
125
130
Jan-05
Jul-05
Jan-06
Jul-06
Jan-07
Jul-07
Jan-08
Jul-08
Jan-09
Jul-09
Jan-10
Jul-10
Jan-11
Jul-11
Source : ECOWI N Reuters
Index 31/01/2005=100
Nat. currency/U SD
AlgeriaEgyptI sraelJordanLebanonLibyaMoroccoSyr iaTunisia
Graph III.2.2: Real effective exchange rate (MED)
90
95
100
105
110
115
120
125
Jan-06
Jul-06
Jan-07
Jul -07
Jan-08
Jul-08
Jan-09
Jul-09
Jan-10
Jul -10
Jan-11
Jul-11
Source: ECOWIN Reuters.
Relative CPI,Index
31/01/2006=100
Algeria
Israel
MoroccoTunisia
In terms of developments in real effective exchange rates (see Graph III.2.2), Morocco's currency was the most stable among the Mediterranean countries for which comparable data is available. Tunisia's currency was also quite stable, apart from a temporary trough during 2008. On the other hand, Israel and to a lesser extent Algeria experienced a pre-crisis appreciation of the real effective exchange rate of their currencies. However, this was partially corrected subsequently, particularly in the case of Algeria; and in any case, this appreciation ranged between 10 and 20%, which is much more limited than that experienced by many of the Eastern neighbours.
In a larger historical perspective, most Mediterranean countries did not experience considerable real exchange rate misalignment and preserved the RER close to its equilibrium value (Morocco, Tunisia). The case of Jordan is particularly relevant. Both under the first peg regime (up until 1989) and the crawling band regime (1995), its RER was largely undervalued and only recently, with the return to the hard peg to the dollar, became moderately overvalued. On the other hand, Egypt was forced to abandon its dollar peg due to RER overvaluation in 2003 (Caporale, Amor and Rault, 2009).
The EU's Eastern neighbours
In comparison to the Mediterranean countries, the nominal exchange rates of the EU's Eastern neighbours have shown much higher volatility during the global crisis. They had experienced strong appreciation pressures in the pre-crisis period, followed by large depreciations afterwards. Despite the relatively tight exchange rate regimes, during 2005-2007 the appreciation of the nominal exchange rates (see Graph III.2.3) was quite pronounced in Georgia, Moldova, Russia and especially Armenia, which recorded a nominal appreciation of almost 60% over the period. Moreover, nominal exchange rates fluctuated wildly during the crisis, with heavy depreciation for most of the currencies at the beginning of the crisis followed by some recovery in 2010 and 2011. In Georgia, the currency was devalued against the US Dollar by 13% in November 2008: a successful one-off devaluation by the monetary authorities that managed to stabilise depreciation pressures to some extent. In Belarus, the currency was devaluated by 17% against the US Dollar and by 15% against the euro in January 2009. In the case of Ukraine, Russia and Belarus, the depreciation troughs overshot by far the 2005 starting point. In addition, unlike in Armenia, Georgia, Moldova and Russia where currencies started to appreciate again in the aftermath of the crisis, Ukraine and Belarus stabilized their exchange rates at those significantly depreciated levels. Overall, the sharp drop of the Ukrainian, Russian, Belarusian and Armenian currencies in late 2008/early 2009, losing between 20 and 45% of their values against the US Dollar, reflect a sharp reversal of capital flows and significantly weakened investor confidence. Facing the deterioration in the Russian economy, the Russian

European Commission The EU's neighbouring economies: coping with new challenges
70
rouble was devalued by over 30% year-on-year in February 2009 and reached an 11-year low.
The Belarusian rouble depreciated heavily again in May 2011, losing almost 50% of its value against the US Dollar and the euro on the parallel market and about 36% of its official value. The only currency that remained relatively stable against the US Dollar (only appreciating slightly) from 2005 to 2010 was the Azerbaijan manat, pointing to the country's exceptional strength in terms of economic output and balance of payments developments.
Graph III.2.3: Monthly nominal exchange rates (East)
60
80
100
120
140
160
Jan-05
Jul-05
Jan-06
Jul-06
Jan-07
Jul-07
Jan-08
Jul-08
Jan-09
Jul-09
Jan-10
Jul-10
Jan-11
Jul-11
Source : ECOWIN Reuters.
Index 31/01/2005=100
Nat. Currency/USD
ArmeniaAzerbaijanBelarusGeorgiaMoldovaRussiaUkraine
The evolution of real effective exchange rates (see Graph III.2.4) depicted similarly diverging trends when comparing the pre-crisis and post-crisis periods. However, the magnitude of the real appreciation was much greater compared to the nominal one. Given the targeting of the nominal exchange rates, the appreciation essentially occurred via the inflation differential vis-à-vis these countries' trading partners. During 2006-2008, the real effective exchange rate appreciation reached about 50% in countries like Armenia, Azerbaijan or Moldova, 40% in Georgia, and more than 20% in Russia and Ukraine. These amounts are very large both per se and in comparison with other emerging markets, suggesting an important loss of external competitiveness leading to a likely overvaluation of the currencies. As we will see in the next section, other indicators appear to confirm the hypothesis of a real exchange rate overshoot in the context of growing external imbalances and overheating pressures. Thus the real exchange rate depreciation trends (as opposed to the pre-crisis appreciation trends) which followed early in the crisis can be viewed as a process of restoration of
external competitiveness and correction of broader macroeconomic imbalances. By early 2011, once the pre-crisis appreciation had been partly corrected, real effective exchange rates still remained appreciated relative to 2006 but to a much lower extent. By contrast, in the cases of Ukraine and Belarus the depreciation of their currencies again overshot the previous levels reached in January 2006.
Graph III.2.4: Real effective exchange rate (ENP-East)
80
90
100
110
120
130
140
150
160
Jan-06
Jul-06
Jan-07
Jul-07
Jan-08
Jul-08
Jan-09
Jul -09
Jan-10
Jul-10
Jan-11
Source: ECOWIN Reuters.
Relative CPI, Seasonally-Adjusted,
31/01/2006=100
ArmeniaAzerbaijanBelarusGeorgiaMoldovaRussiaUkraine
This cursory analysis of exchange rate arrangements and exchange rate developments can be summarised by stating that significant differences between the two main groups of EU's neighbours became apparent prior and during the global crisis. The fluctuation of the exchange rates of the Eastern neighbours, both in nominal and real terms, was in general much more pronounced than in the Mediterranean countries. The pre-crisis stronger appreciation trends were followed by stronger depreciation trends during the crisis. This occurred despite the fact that the exchange rate policies in the Eastern neighbours were more flexible at the onset and moved towards even greater flexibility during the crisis. Theoretically, more flexible exchange rates should have better deterred the appreciating pressures stemming from the large international capital flows in the boom years. However, this does not seem to have been the case when comparing the two main country groups. Therefore, in the following section we will try to examine additional factors that may have shaped differently the exchange rate developments in the two regions.

Part III Thematic Issues
71
2.4. TRENDS IN EXTERNAL COMPETITIVENESS
The evolution of exchange rates among the EU neighbours is intrinsically linked to their broader trends in external competitiveness. In this context, the section looks at the possible signs of overheating before the global crisis, that may be visible in these economies' growth patterns, evolution of domestic credit, labour cost developments, external imbalances and export performance. Special attention is given to foreign capital inflows and their channelling into these economies via an expansion of bank sector foreign liabilities: this is a natural counterpart to the widening external imbalances and a major driver of the exchange rate appreciation pressures.
The rather distinct evolution of exchange rates and policies among the two main groups of EU neighbours mirrors to a certain extent differences in their growth patterns. Both country groups experienced strong economic catch-up in the pre-crisis period (European Commission, 2010a), although the Eastern neighbours in particular stand out: annual average GDP per capita (in international US Dollars) grew by 5.6% in the Mediterranean neighbours and by 12.6% in the Eastern neighbours during 2004-2008. The rapid growth of the second group, at double-digit rates, already raises concerns about overheating pressures and unsustainable growth patterns. Further indicators related to the composition of growth, presented below, tend to confirm the unbalanced drivers of growth and the accumulation of macroeconomic imbalances in the Eastern neighbours. When the global crisis hit, the Eastern region plunged into recession with real GDP declining by 5.4%; underperforming the Mediterranean neighbourhood, developing Asia, Latin America and even Central and Eastern Europe (IMF, 2011b) (see Graph III.2.5).
This pre-crisis dual-speed performance can be interpreted in two ways. On the one hand, it would appear that in a context of rapid globalisation, rapid technological innovation and strong growth, the Mediterranean countries did not manage to reap the same growth benefit as the Eastern ones. This is arguably due primarily to domestic policies, which were less conducive to growth in the former than in the latter. Although starting from a lower point, the Eastern neighbours embarked on a process of liberalisation and radical
reforms in the transition and ended up with economies which were on average more open and enjoyed a better business environment.
Graph III.2.5: Real GDP growth (regional comparison)
-14
-9
-4
1
6
11
2005 2006 2007 2008 2009 2010
Source: IMF.
% change
ENP-East
EU27
Developing Asia
Latin America and the Caribbean
A brief look at recent World Bank's Doing Business Reports or at other indicators of the investment climate shows the EU's Eastern neighbours in the top half of the ranking on average, whereas the Mediterranean neighbours are primarily placed in the bottom half ranking (see also the sections on "Economic governance and investment climate" and "Economic factors behind the political unrest in the South Mediterranean"). This suggests that the Eastern countries processed and allocated resources more efficiently and became more attractive destinations for foreign capital in recent years.
At the same time, the growth model of the Eastern neighbours was increasingly based on mobilising foreign savings and the rapid growth went beyond reform-based catch-up. As a result, average current account deficits in the Eastern neighbours (1) surged from about 3% of GDP in 2005 to more than 13% of GDP at their peak in 2008. By contrast, the Mediterranean neighbours which were not oil exporters recorded an average current account deficit below 4% of GDP in 2008. There was sufficient financing to cover the large current account deficits in the Eastern neighbours, a notable source being the rapidly-growing FDI in these countries. However, only a part of this financing went into the tradable sector; while important chunks increasingly went to the non-tradable sector (financial services, real estate and construction), fuelling domestic asset bubbles and strengthening only marginally the export base of these economies.
(1) Except for Azerbaijan and Russia which recorded
surpluses, reflecting their status as net energy exporters and the rise of international energy prices during this period.

European Commission The EU's neighbouring economies: coping with new challenges
72
Overall, the surge in capital flows to the Eastern countries during the boom years was much larger than in the Mediterranean region (see Graph III.2.6; the CIS and MENA country groups are used as proxies for the Eastern and Mediterranean neighbours respectively). To a certain extent, this can also be traced back to the fact that the former group was more advanced in terms of capital account liberalisation. Yet unfortunately, the outflows which followed during the crisis were also quite large in the Eastern neighbours; helping to explain, as noted, both the more pronounced exchange rate appreciation during the boom and the stronger reverse trend in the early phase of the crisis. In Russia, for example, net capital outflows occurred as the corporate sector tried to hedge its large foreign exposure using the tightly-managed exchange rate, and foreign investors reversed their carry trades when a depreciation of the rouble seemed likely.
Graph III.2.6: Total private financial flows, net (USD bn)
-100
-50
0
50
100
150
2003 2004 2005 2006 2007 2008 2009 2010
MENA
CIS
Source: IMF.
After this large drop, net private capital flows started to recover in the CIS countries. However, the CIS region in general lagged considerably behind the renewed wave of capital flowing into Developing Asia and Latin America in 2010/2011 (IMF, 2010c). In contrast, in the Mediterranean region net private financial flows remained positive during the crisis, pointing again to its more stable growth pattern.
As in other emerging markets, the banking sector was instrumental in the transformation of foreign capital inflows into surging domestic credit growth, particularly amongst the EU's Eastern neighbours. Depending on the bank regulations in force regarding lending in foreign currency -
particularly those related to capital, liquidity and reserve requirements - the banking sectors were able to multiply domestic credit denominated into foreign currency to various degrees. This development was very important on several accounts. First of all, it reinforced the degree of dollarisation of these economies (see also the next sub-section) and aggravated currency mismatches in the balance sheet of the household and corporate sectors (1). Second, when foreign capital flows reversed they were accompanied by a loss of bank deposits, exerting a sudden deleveraging pressure on the financial sector. As central banks have only a limited capacity to act as a lender of last resort for the domestic multiplication of credit denominated in foreign currency, the potential loss of official foreign exchange reserves is significant. Dual balance-of-payment and financial-sector crises were recorded in the two most important economies, Ukraine and Russia. In other countries like Moldova and Georgia, smaller deposit withdrawals also took place; although larger problems with banking institutions were avoided.
By contrast, problems in the banking sector have been much more contained in the Mediterranean countries. The Mediterranean economies' integration into global financial markets was also relatively limited through the boom period, as evidenced by the low amount of foreign bank lending to the region. The exposure of domestic banks to banks from the EU and the United States - which were affected strongly by the crisis and were in a deleveraging process - has been fairly low. Therefore the banking sectors managed to weather the global crisis relatively well, having in general sound capital positions and maintaining a reasonable amount of profitability.
The different role played by banks in the two country groups can be illustrated by the exposure of the domestic banking sectors to foreign banks (see Graphs III.2.7 and III.2.8) which had significant consequences regarding financial stability and external competitiveness. Due to the opening-up of their financial sectors and higher penetration of foreign banks, the Eastern neighbours recorded on average a much higher increase in the net claims of foreign banks on the
(1) In turn, this raised additional concerns about the impact on
the financial sector if currencies were allowed to depreciate under exchange rate pressure.

Part III Thematic Issues
73
domestic banking sectors in the boom years, as compared to the Mediterranean countries. Particularly striking is the increase of the banking sector's external exposure by more than 20% of GDP in Ukraine and 10% of GDP in Moldova from 2005 to 2008. By contrast, in several Mediterranean economies like Algeria, Israel, Jordan, Syria and Tunisia, this indicator barely moved or even decreased over the same period.
Graph III.2.7: Foreign banks net claims on domestic banks (% of GDP)
0
5
10
15
20
25
30
Armenia
AzerbaijanBelarus
Georgia
MoldovaUkra
ine
2005 2008 2010 Q1-Q3
Sources: BIS and IMF.
Graph III.2.8: Foreign banks net claims on domestic banks (% of GDP)
0
5
10
15
20
25
30
35
AlgeriaEgypt
Israel
Jordan
Lebanon
MoroccoSyria
Tunisia
2005 2008 2010 Q1-Q3
Sources: BIS and IMF.
As a result, domestic credit growth was very high in many of the EU's eastern neighbours in the boom years, fuelling the unsustainable growth pattern and macroeconomic imbalances. For example, the annual growth rate of domestic credit exceeded 40% in all the featured Eastern economies in 2007. By contrast, credit growth in the Mediterranean countries unfolded at a more sustainable pace in the boom years and in most cases fitted into a 10-20% annual growth band. In general, the level of non-performing loans reached
very high levels in many of the Eastern neighbours, such as Ukraine, Moldova and Armenia. Much of this credit boom of the Eastern economies went into private consumption, which grew strongly and distorted the composition of growth in many of the Eastern neighbours. The domestic demand boom in emerging Europe was particularly pronounced in the Baltic and European CIS countries – Belarus, Ukraine, Russia and Moldova and the growth pattern became increasingly vulnerable to a sudden decline in capital inflows (IMF, 2010b).
As data on the evolution of unit labour costs as an indicator of external competitiveness was generally not available, we chose to use the development of wages - expressed in US Dollars - as a proxy (see Graph III.2.9). The annual growth rate of average wages in the manufacturing sector has been much higher in the Eastern neighbours than in the Mediterranean ones. Moreover, as wages grew at an average growth rate of almost 30% annually during 2006 and 2008, productivity growth was unable to keep up with real wage growth, therefore exerting real appreciation pressures on the currencies of the Eastern economies. Moreover, growth pressures on private sector wages came also from the public sector, which grew strongly in many of the Eastern neighbours together with the level of public spending as a share of GDP. By contrast, the ratio of public spending to GDP has remained on a stationary trend in most of the Mediterranean economies, and has even decreased in countries like Israel, Lebanon or Syria.
Graph III.2.9:Average monthly wage in manufacturing
05
1015202530354045
2006 2007 2008Source: ILO.
y-o-y, % change
Av erage ENP-EastAv erage ENP-MED
When it comes to the evolution of exports (in volume terms, see Graph III.2.10), the picture is rather uniform and does not reveal major differences between the two country groups. On average exports were growing at a steady pace

European Commission The EU's neighbouring economies: coping with new challenges
74
before the crisis in both regions, followed by a sharp drop and a subsequent rebound in the crisis. At first sight, this would not be indicative of a fundamental change in external competitiveness. However, if we treat Azerbaijan's outstanding performance under special circumstances as an outlier (real exports grew at a neck-breaking speed of around 40% annually during 2005-2007), then the average performance of the Eastern neighbours appears less favourable than originally thought. A loss of speed in comparison with the Mediterranean countries' performance becomes evident. Moreover, this general evolution of exports in the Eastern countries masks a relative underperformance in terms of exports of goods, which have declined as a share of GDP from 2003 to 2007 in all the four countries – Moldova, Ukraine, Russia and Belarus – surveyed by the IMF (2010b). This suggests a relative loss of external market share and competitiveness in the tradable sector, which is consistent with the high increase in real wages over that period. In addition, the decline of exports in the crisis started earlier and was deeper in EU's Eastern neighbours vis-à-vis the Mediterranean group.
Graph III.2.10:Export volume growth rate
-20,0
-10,0
0,0
10,0
20,0
2005 2006 2007 2008 2009 2010
Source: IMF
% changey-o-y
Average ENP-East (w/o Azerbaijan)Average ENP-MED
In conclusion, developments in terms of external competitiveness point to a gradually worsening situation in the pre-crisis period amongst the EU's Eastern neighbours. Our brief analysis shows that in general, the large capital inflows exerted upward pressure on the real exchange rates, wages, domestic credit growth and private and public consumption, displaying overheating signs relative to the speed and composition of growth. Mediterranean countries remained more shielded from the building-up of such macroeconomic imbalances, being less exposed to international
capital flows and accumulating fewer foreign liabilities.
2.5. DOLLARISATION
At the outset, dollarisation is the result of macroeconomic and financial instability and the fear of wealth confiscation via high inflation rates, which is usually accompanied by currency depreciation. However, the currency substitution process is characterised by a high degree of inertia; or, to use a more academic term, by "hysteresis". This means that significant dollarization ratios can persist even after the initial conditions that led to their emergence (macroeconomic instability) have disappeared or diminished.
Both groups of neighbouring economies have passed through a phase either of very high inflation or of stubborn moderate inflation. The Eastern neighbours suffered hyperinflation or very high inflation rates at the beginning of their transition to a market economy in the early 1990s. This happened following the break-up of the rouble zone, when the newly-created central banks had not yet established their monetary credibility. The Mediterranean partners were confronted with moderate but sticky inflation in the 1980s. In terms of hysteresis, the experience seems to differ somewhat among the two groups. In the EU's Eastern neighbours' economies, dollarisation has remained high; whereas in the Mediterranean countries countries it has generally declined to very low levels in recent years, with the notable exception of Lebanon.
Several theories explain the emergence and persistence of dollarisation. The early literature found that currency substitution occurred in the face of high and volatile inflation and exchange rate depreciation. More recent analysis focuses on the asset substitution aspect. From this point of view, dollarisation is related to minimizing portfolio variance and exploiting market failures related to asymmetric information, implicit guarantees and institutional weaknesses (Levy-Yeyati, 2005). As regards the persistence of dollarisation, the so-called "hysteresis", this has been observed in many emerging economies including from former Soviet Union, Latin America and the Western Balkans (Temprano, 2003). It can be attributed to several factors,

Part III Thematic Issues
75
including the time lapse necessary for the authorities to regain credibility and financial innovation. Credibility seems to be a crucial issue in explaining hysteresis, as the recent experience of Serbia shows. Jelašić (2010) describes how the very high degree of euroisation in Serbia (more than 90% of deposits are FX denominated) could not be reversed even during the stable years of 2005-06, when yields offered on Serbian Dinar saving instruments were even of 25% per annum and the domestic currency slightly appreciated. Rappoport (2009) also shows that as devaluation takes place during downturns, consumers can use foreign currency denominated contracts to smooth consumption; although this makes firms more prone to default in case of a sudden devaluation. Once a critical mass of contracts is reached, a central bank will find it optimal to minimize exchange rate fluctuations in order to avoid mass default. Monetary policy, in a certain sense, provides insurance to consumers, and this is consistent with the massive intervention of central banks in the exchange rate market ("fear of floating").
Financial dollarisation in the Eastern neighbours has continued to be a reality even after the early stages of transition, both for assets and liabilities. Dollarisation of assets is particularly widespread, either in the form of dollar-denominated bank deposits or dollar bills under the proverbial mattress. Liabilities (bank loans) have also been dollarized. Before the global financial crisis of 2008/2009, a process of de-dollarisation had been taking place in the Eastern countries. Nevertheless, this process had been rather gradual, as the growing foreign capital inflows into the banking sector further supported the dollarisation process and acted as a counterbalance to the increasing confidence of the population in the domestic currency. Therefore, as of 2007, the average share of foreign currency deposits in total was still around 40% in the Eastern neighbours (see Graph III.2.11). This share was in excess of 50% in Georgia and Azerbaijan.
During the global crisis, the de-dollarisation process reversed dramatically as many of the region's currencies depreciated heavily. Deposit-holders again sought refugee in foreign currencies, by transforming deposits held in domestic currency into foreign currency ones. In Ukraine, where a high level of dollarisation had been caused by the
high inflation and exchange rate volatility of the 1990s and by the extensive use of dollars in the shadow economy (Curtis E., Gardner R. and Waller C. J., 2005), the share of foreign currency deposits in total deposits jumped by more than 10% points in just three months during the onset of the crisis (September to December 2008).
Graph III.2.11: Dollarisation of bank deposits (ENP-East)
20
40
60
80
2006 2007 2008 2009 2010
Source: National Cental Banks and own calculations.
% of total
A rmeniaA zerbaijanBelarusGeorgiaMoldovaRussiaUkraine
Similar developments took place in all the economies, the most striking case being Armenia where the ratio of foreign currency deposits surged from about 35% in 2007 to around 68% in 2009. During 2010, we again witnessed a reduction in the share of foreign currency deposits as the financial situation stabilized; but less so in Armenia and Belarus, where the depositor apprehension has not eased.
The relevant role played by exchange rate dynamics, both in terms of volatility and fluctuations, for recent developments in dollarisation is well illustrated by the charts III.2.12 and III.2.13.
Graph III.2.12: Volatility of exchange rate and dollarisation
-10
-5
0
5
10
15
20
25
0 0,02 0,04 0,06 0,08 0,1 0,12 0,14 0,16
Variat ion Coefficient (daily)
Dollarization (d% of deposits)
2006-2008
2008-2010Linear (2006-2008)
Linear (2008-2010)
Source: ECOWIN Reuteurs.

European Commission The EU's neighbouring economies: coping with new challenges
76
On the one hand, exchange rate movements directly influence the degree dollarisation as the value of dollars in terms of domestic currency affects their share of deposits, ceteris paribus. On the other hand, appreciation and depreciation influence the real return of dollar deposits. The relationship between the exchange rate and dollarisation in Eastern countries has been object of more rigorous empirical studies. Using a model of transaction costs, Loiseau-Aslanidi (2008), for example, analyzes dollarisation in Georgia between 1995 and 2007 and finds that exchange rate changes predict the level of dollarisation better than alternative explanations such as inflation and interest rate differentials.
Graph III.2.13: Depreciation and dollarisation
-10
-5
0
5
10
15
20
25
30
-0,6 -0,5 -0,4 -0,3 -0,2 -0,1 0 0,1 0,2 0,3 0,4
Cumulated Depreciation
Dol
lariz
ariza
tion
(d%
of d
epos
its)
2006-20082008-2010Linear (2008-2010)Linear (2006-2008)
Source: ECOWIN Reuteurs.
In terms of bank loans, dollarisation also remains high in the Eastern neighbours. In Armenia, more than 50% of total bank assets were denominated in foreign currency as of 2010. In Ukraine, the foreign currency share of total loans increased sharply in the crisis – from 51% to 59% in the fourth quarter of 2008 – but fell back to the initial level in the course of 2009. In Georgia, the dollarisation of credit had declined in parallel with the dollarisation of deposits from almost 90% of total loans in 2004 to about 65% in 2008, but jumped again by about 10 % points in the crisis. Foreign currency loans also remained in excess of 40% of total loans in Moldova, after having fluctuated during the crisis.
In contrast, dollarisation in the Mediterranean neighbours was not only much lower than in the EU's Eastern neighbours at the onset of the crisis, but continued to decline during the global crisis in most countries. This may reflect the lower degree of macroeconomic instability experienced by these
countries during the recent crisis, which did not dent confidence in the banking sectors, and their fixed exchange rate arrangements (Sturm and Sauter, 2010). Overall, banking sectors in the region showed a positive development of their deposit base in the wake of the global financial turmoil, and dollarisation levels have not increased.
Among the EU's Southern neighbours, deposit dollarisation is relatively low, the biggest shares of foreign currency deposits in total deposits being recorded in Lebanon (at about 60% in 2010) and Jordan (at around 20% in 2010). In Lebanon, the phenomenon began to emerge after the banking crisis in the 1960s and peaked during the civil war years (1975-1990) due to the deterioration of the economic conditions and the sharp increase in inflation (Mueller, 1994). In the following years, hysteresis, the persistence of political instability and the recent conflict have perpetuated the high dollarization ratios. Both in Lebanon and in Jordan the share of foreign currency deposits has shown a downward trend since 2007; a trend that continued despite the global crisis.
Graph III.2.14:Dollarisation of bank deposits (ENP-MED)
0%
10%
20%
30%
40%
50%
60%
70%
80%
2005 2006 2007 2008 2009 2010
% of total
AlgeriaEgyptIsraelJordanLebanonSyria
Source: National Central Banks and own calculations
On the lending side, dollarisation is also relatively limited, as the two sides of the balance sheet go hand in hand. Unlike in the Eastern neighbours as described above, foreign currency credit to the private sector is not a major financial stability concern. Lebanon stands out again, with a very high share of credit denominated in foreign currency (mainly in US Dollars) which slightly declined to about 80% of total in the crisis. Other countries such as Egypt, Israel and Jordan also have a moderate level of foreign currency credit, varying between 15% and 25% of total. On the other hand, in Morocco for example, foreign

Part III Thematic Issues
77
currency loans represent less than 3% of total loans.
In summary, the levels of dollarisation in the two main country groups are not only different, but also behaved differently during the global crisis. In the Eastern neighbours, dollarisation is quite high and increased further with the crisis. This had negative implications for the stability of the financial sectors during the crisis, for the stability and choice of the exchange rate arrangements, and for the conduct of monetary policy. The move towards increased exchange rate flexibility during the crisis was constrained by the high degree of dollarisation and was accompanied by a serious increase in the banking sector's NPLs. Against this background, most of the Mediterranean neighbours seem better positioned to move towards inflation targeting, as dollarisation remains at subdued levels and allows them a more effective use of an independent monetary policy.
2.6. CONCLUSIONS AND POLICY ISSUES
This chapter has presented the rather different evolution of exchange rates of Eastern neighbours vis-à-vis the Mediterranean ones during the crisis: while the first group of countries faced strong exchange rate depreciation pressures and a significant economic downturn during the crisis, the Mediterranean neighbours exhibited remarkable stability both in terms of currencies and economic activity. This was arguably a result of the divergent economic developments in the pre-crisis period: whereas the Mediterranean countries grew strongly, but at rates which did not pose a material risk to macroeconomic stability; the Eastern neighbours moved towards an unsustainable growth model, dependent to a large extent on high and volatile types of international capital flows.
As regards exchange rate arrangements, pegs and tightly managed exchange rates were prevalent in the EU's neighbours both before and during the crisis. In the Eastern neighbours the arrangements were more flexible than in the Mediterranean neighbours, and further moved in this direction during the crisis. Theoretically, higher exchange rate flexibility should have helped these countries better to cope with the pressure of international capital inflows, by alleviating the moral hazard of
a "one-way bets". In reality this has not happened, because a) the de facto exchange rates were still quite rigidly managed and the investors had already developed corresponding expectations; and b) the size of capital inflows appears to have been so large that exchange rate arrangements did not suffice to smooth out this process. In particular, within the group of the Eastern neighbours the overheating pressures applied to all economies regardless of the specificities of their exchange rate arrangements. It remains an open question to what extent the real appreciation of the currencies and the gradual erosion of external competitiveness could have been mitigated if fully floating exchange rate arrangements had been in place.
One lesson that can be drawn from the experience of the EU's neighbours in the crisis is that the choice of the exchange rate arrangements, even if credible and well-founded by all possible considerations, cannot solve all problems, in particular if other powerful external factors are at work. In addition, other domestic policies seem to be equally, if not more important to secure macro-financial stability and to avoid the emergence of unsustainable imbalances. In that sense, the notion of Calvo and Mishkin (2003), i.e. that the choice of the exchange rate may be of a second-order importance, seems to be valid also for the experience of the EU's neighbours.
But what are the appropriate domestic policies at hand to support whichever exchange rate regime has been put in place? Which policymaking tools are available to deal with high and volatile capital inflows? This remains a very hot policy issue in the context of lax monetary policies in the developed economies that can lead to destabilizing capital flows for the emerging markets (1). A few policy considerations appear relevant in this context:
First, the financial sector is key in channelling foreign capital inflows into domestic credit and investments. Given the potential of domestic fractional reserve banking systems to multiply foreign currency inflows into leveraged domestic (1) This applies in particular for several countries in Latin
America and Asia, which weathered the crisis well and are again confronted with renewed capital inflow pressures in an international environment of accommodative monetary policy.

European Commission The EU's neighbouring economies: coping with new challenges
78
credit, any outflows can easily result into a deflationary spiral and a shock to the banking sector in the host economy. The experience of some Eastern neighbours who recorded dual balance of payment and bank crises illustrates this risk, and the need for tighter macro-prudential policies. Strengthening capital and liquidity requirements, financial sector supervision and lending administrative measures can all help to slow down the speed of domestic credit to sustainable rates.
At the same time, the stability of the financial sectors was further challenged by the high degree of dollarization in both country groups. If dollarisation gradually declined in the Mediterranean neighbours, it remained quite high in the Eastern ones and increased further with the crisis. This has constrained the move towards more exchange rate flexibility and strengthened the need for official assistance for fear of large balance sheet losses and capital outflows in the financial sector.
Second, fiscal and monetary policies (to the extent that the latter is available as a policy tool) need to display counter-cyclical characteristics; or at least not add to domestic imbalances when the recycling of foreign savings already exerts strong overheating pressures. It was very easy not only for some of the Eastern neighbours but also for other developed economies to misinterpret the strength of their structural fiscal position in the boom years, putting additional pressure on domestic demand and wages and thus weakening their external competitiveness. The use of higher reserve requirements for foreign currency liabilities may also represent a very powerful tool to moderate the banking sector's capacity to pyramid credit over foreign currency liabilities, which is prone to reversals and for which domestic central banks cannot act as a lender of last resort.
Third, countries like Brazil and Chile have also experimented with imposing various administrative hurdles to short-term capital inflows. To the extent that capital controls are well targeted they may deter to a certain extent primarily the "hot money" flows. At the same time, there is a risk for regulatory arbitrage and the efficiency of such instruments has been debated
over the years (1). Therefore, capital controls should be deployed as a last resort and only temporarily.
Fourth, implementing structural reforms remains equally important. On one hand, an attractive business environment can ensure that a reasonable share of capital inflows goes into the tradable sector, so that higher indebtedness goes hand in hand with a higher capacity to service external debt (2) . On the other hand, flexible labour and product markets favour a smooth adjustment of relative prices in the economy, minimising the real exchange rate appreciation pressures and the excessive growth of domestic credit.
In conclusion, the experience of the Eastern neighbours showed once again that living with very large capital inflows in the context of catching-up economies and tightly managed exchange rates represents a formidable challenge. The obvious lesson from the crisis is that a better use of the entire range of policy instruments is needed in order to ensure sustainable growth. At the same time, the experience of the Mediterranean countries is not an optimal one either. Despite the fact that these countries have enjoyed macroeconomic stability through the crisis, their relative economic autarchy had a price to pay in terms of missed growth opportunities. That could certainly be one explanation for the recent uprisings in these countries.
(1) In a recent change of tone, the IMF released guidelines on
capital controls at the beginning of 2011. It also argued, via its Chief Economist, in favour of a permanent and carefully calibrated infrastructure for capital controls that can be implemented at various tax rates, in-keeping with the perceived degree of harm produced by inflows.
(2) However, this does not rule out potential misinvestments even in the tradable sector, in case lax monetary policies are artificially boosting international capital flows and a global boom.

Part IV Country analysis

1. ALGERIA
80
• Economic growth recovery picked up in Algeria during 2010, although at a slow pace.
• The reversal in oil prices during the fading-out of the global crisis boosted oil revenues and improved the government balance, which nevertheless remained negative after many consecutive years of strong surpluses.
• The impact of the recent regional crisis on the Algerian economy is estimated to have been moderate during 2011, on account of the country’s relatively low degree of trade and financial openness.
Macroeconomic and financial developments
Following a period of high hydrocarbon revenues, Algeria was affected by the fall in oil prices caused by the global economic and financial crisis of 2008-2009. The reversal in oil prices as the world economy recovered has contributed to Algeria’s recovery during 2010, although at a lower pace than expected. Economic growth accelerated to 3.3% in 2010 from less than 2.4% in 2009. Economic growth is expected to accelerate to 3.7% in 2011.
After peaking at a record level of 5.7% in 2009, mainly driven by substantial fresh food price rises, average inflation declined to 4.3% in 2010 in response to price stabilization and the effective absorption of excessive bank liquidity by the Bank of Algeria (BA). Inflation is, however, forecast to pick up again to 5% in 2011; driven by increased public spending, an intensification of speculation in the supply chain and the introduction of import restrictions.
The government balance improved in 2010, after dropping to negative territory in 2009 following many consecutive years of strong surpluses.
The fiscal deficit is estimated to have narrowed to nearly 3.8% of GDP in 2010 from 6.8% of GDP in 2009, as the rebound of hydrocarbon revenues and the substantial cuts in capital spending outpaced an increase in current expenditure, which was mostly used to grant a marked increase in the civil service
Graph IV.1.1: Algeria - Fiscal balances, public debt, current account
-60
-41
-21
-2
17
2007 2008 2009 2010 2011projectionSources: EIU, IMF and own calculat ions.
fiscal balance current account
non-hydrocarbon
primary balance% GDP
8
10
12
public debt % GDP
Graph IV.1.2:Algeria - Exchange rates
85
93
100
108
115
123
Jan-08 Jun-08 Dec-08 May-09 Nov -09 Apr-10 Oct-10 Mar-11 Sep-11
Sources: ECOWIN Reuters.
Euro per dinar USD per dinar index 1/1/08=
100
Graph IV.1.3:Algeria - Exports & imports of goods
-60
-30
0
30
60
Jan07
May07
Sep07
Jan08
May08
Sep08
Jan09
May09
Sep09
Jan10
May10
sept-10
Note: Includes only trade w ith the EU and US due to lack of data.Source: IMF DoTS.
y-o-y, 3mma, %, DZD, nominal
exports
imports

Part IV Country analysis, Algeria
81
wage bill. The budget balance is forecast to remain in deficit in 2011, on the back of continuously large expansionary fiscal spending. However, large available fiscal savings, increased revenues from hydrocarbon exports, greater efficiency in tax administration and stabilized capital expenditures are expected to contribute to rebalance the budget by 2013.
In response to the government balance improvement, public debt stabilized to 10.3% of GDP, whereas external debt dropped to the exceptionally low level of 2.8% of GDP in 2010 from 3.8% of GDP in 2009. This solid external debt position, along with the foreign exchange reserves of far more than 100% of GDP, provide solid buffers to Algeria to accommodate external shocks. Official reserves are estimated to have risen by about USD 12 billion since end-2009 reaching USD 161 billion by end-2010 (corresponding to more than 3 years of imports of goods and services).
The current account surplus, that had disappeared in 2009 as a result of the drop in energy prices and the global demand, expanded to 8.5% of GDP in 2010. The expansion was due to the sharp global rise in oil prices that more than offset the reduction in crude oil production during 2010, leading –together with increasing external demand – to a substantial expansion of hydrocarbon export revenues. During 2010, hydrocarbon export revenues increased by 27%, thereby easily outpacing imports growth (1.3%). In response to the FDI control measures adopted in 2009, FDI outside the hydrocarbon and financial sectors fell by about 60 percent in 2009 and did not recover in 2010.
The exchange rate regime of Algeria remains a managed float with no pre-announced path, giving the central bank discretion to intervene in the foreign exchange markets. The authorities aimed to maintain the real effective exchange rate close to equilibrium. The sharp decline in world oil prices and the increasing uncertainty in the financial markets during the financial crisis negatively affected the Algerian currency. However, the exchange rate policy pursued during 2010 allowed for an appreciation of the real effective exchange rate in line with the recovery of hydrocarbon prices.
Banks in Algeria are generally well capitalized and profitable, but bank intermediation remains low. The growth in credit to the public sector has remained at a high level but growth in credit to the private sector slowed reflecting the imposition of a ban on consumer lending since August 2009. Algerian banks do not rely on external financing and continue to benefit from a healthy growth in deposits, despite this growth's moderate slowdown in 2010. One issue of concern, however, is the high non-performing loans ratio in public banks' loans to public enterprises and the private sector.
The bond market in Algeria is shallow and there is no well-functioning stock market. This, in addition with the low degree of international financial integration, means that the private sector lacks easy access to funds for financing their projects. Cross-border banking figures show that bank loans from abroad are only 1% of GDP. Cross-border banking even diminished before the global crisis.
The impact of the regional crisis on the Algerian economy is estimated to have been moderate during 2011 on account of the country’s relatively low degree of trade and financial openness. Being a major oil and gas exporter, Algeria has in fact benefited by the sustained oil and gas price increases since 2010, and the country continues to enjoy a strong reserve position. Existing protectionist measures on trade and capital flows combined with limited dependence on remittances from regional countries have so far enabled weathering the region’s current difficulties well.
Policy reform measures
Recent IMF technical assistance has contributed to progress in increasing non-hydrocarbon revenues and improving tax administration. Modernization of the budget systems is continuing, but requires further significant efforts in some areas for improved control and greater efficiency.
The good performance of the 2005-2009 Public Investment Program (PIP) pursued in 2009 helped improve infrastructure and enhance growth potential for Algeria during 2010. The ongoing hydrocarbon sector investment program and the new 2010-2014 PIP under the supervision of a monitoring National Commission (Caisse Nationale d’Equipements et de Développement,

European Commission
The EU's neighbouring economies: coping with new challenges
82
CNED) are expected to maintain the growth rate of NHGDP at 5% levels in the medium-run.
In the financial sector, recently-implemented measures, such as the new banking accounting system based on IAS/IFS principles, contributed to better disclosure of financial information. The 2010 amendment of the Law on Money and Credit (LMC) was also meant to ensure financial stability. Further reforms in the financial sector are planned for the near future. More forceful implementation of the 2007 Financial Sector Assessment Program (FSAP) will support the modernization of the financial system; whilst the Bank of Algeria is expected to establish a new bank rating system in order to improve the assessment, management, and control of credit risk. In addition, the establishment of a central credit register for individuals' risk is planned for 2011 as a response to limited lending and credit risk. Other measures aim to develop lending for small and medium sized enterprises (SMEs), and mortgage loans to individuals.
Algeria could benefit from WTO accession. Further integration into the global economic flows, deeper structural reforms and economic liberalisation could lead to better trade opportunities and higher economic growth.
Social development and poverty
Although oil production is a significant source of wealth for Algeria, average GDP per capita is remarkably low and only in 2008 it reached the peak level of 3,200 euros. Moreover, the national income distribution is highly skewed and the poverty rate is high, with almost half of the population living below the poverty line.
Despite its healthy public finances in the past, Algeria has ranked poorly on human development indicators. Life expectancy at birth is just 72, adult illiteracy exceeds 30% of the population, more than 25% of the population does not enrol in education and more than 5% of the population will not reach the age of 40.
On the back of solid non-hydrocarbon growth (about 6% over the past decade), unemployment has fallen continuously, reaching 10.2% at the end of 2009 from a peak level of almost 30% in 2000. Yet it still remains high, especially among the
youth mainly, due to sluggish progress in private sector development. The non-hydrocarbon sector in Algeria is inward-oriented, has limited capacity for innovation and improving competitiveness and is largely sustained by public spending. Furthermore, the lack of stock market along with the low degree of financial intermediation limits the financing possibilities of the private sector. Furthermore, most newly created jobs are temporary and are therefore not sustainable. Carefully-distributed public investment in critical sectors, such as the weak industrial sector, or the agricultural sector where domestic supply cannot meet demand, should therefore help boost employment and relieve poverty.
Risks and outlook
Admittedly, the Algerian economy has a solid debt and reserves position that increases resistance to external shocks, such as the regional crisis in the Southern Mediterranean region during 2011. However, the global financial crisis of 2008-2009 showed that the main vulnerabilities of the economy remain its low diversification and its dependence on oil and gas. Hydrocarbon exports account for almost 98% of total exports and two thirds of budgetary revenues, rendering the external and budget balance vulnerable to fluctuations in hydrocarbon prices.
Poverty in Algeria is still high, and GDP per capita is extremely low despite the abundant revenues obtained during the last few years. After the economic shock from the recent sharp global slowdown, Algeria may suffer from more protectionist measures, such as constraints on foreign companies in Algeria, which entail a cost for growth. The recently introduced measures under the new budget law are harmful, as they deter foreign investors and impede the diversification of the economy. Under such a scenario, international cooperation, opening of markets and continuing the privatisation processes could potentially accelerate economic growth. A higher growth path is within reach, but requires financial markets to be broadened and deepened for the optimal channelling of funds to the economy.
Along with the risk of protectionism, there remain the negative effects of heavy government intervention. The lack of transparency in
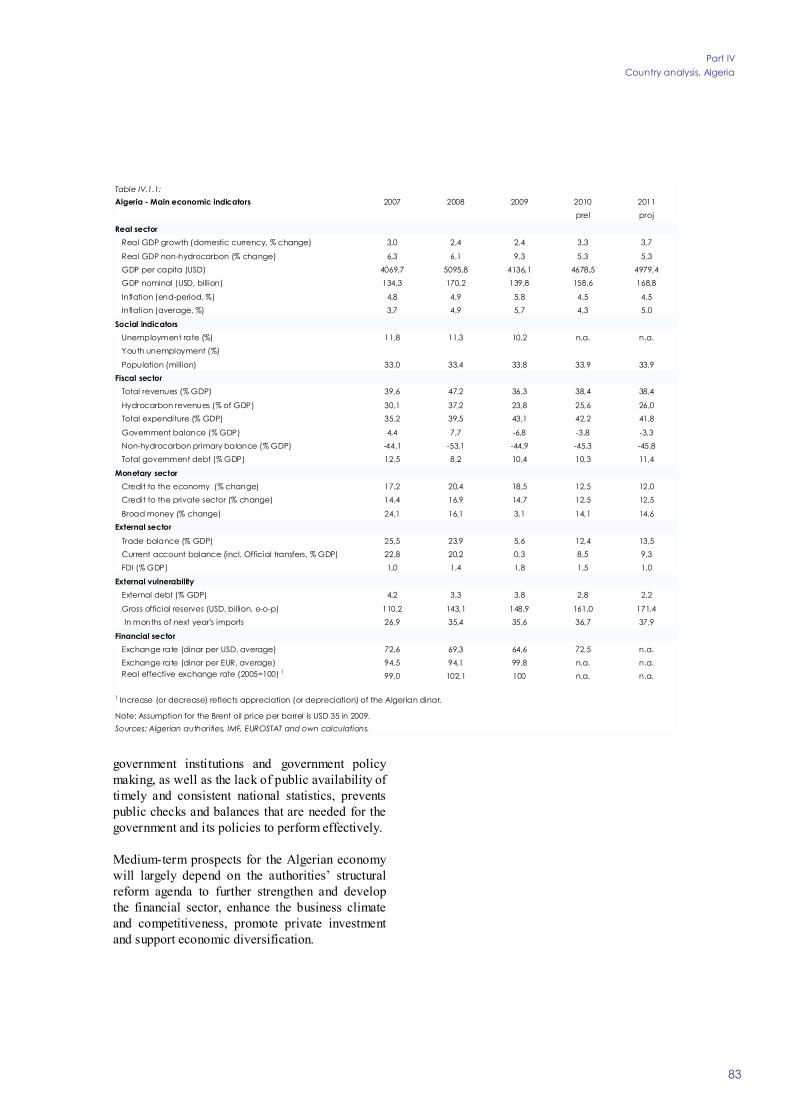
Part IV Country analysis, Algeria
83
government institutions and government policy making, as well as the lack of public availability of timely and consistent national statistics, prevents public checks and balances that are needed for the government and its policies to perform effectively.
Medium-term prospects for the Algerian economy will largely depend on the authorities’ structural reform agenda to further strengthen and develop the financial sector, enhance the business climate and competitiveness, promote private investment and support economic diversification.
Table IV.1.1:Algeria - Main economic indicators 2007 2008 2009 2010 2011
prel proj
Real sector Real GDP growth (domestic currency, % change) 3,0 2,4 2,4 3,3 3,7
Real GDP non-hydrocarbon (% change) 6,3 6,1 9,3 5,3 5,3 GDP per capita (USD) 4069,7 5095,8 4136,1 4678,5 4979,4 GDP nominal (USD, billion) 134,3 170,2 139,8 158,6 168,8
Inflation (end-period, %) 4,8 4,9 5,8 4,5 4,5 Inflation (average, %) 3,7 4,9 5,7 4,3 5,0
Social indicators Unemployment rate (%) 11,8 11,3 10,2 n.a. n.a. Youth unemployment (%)
Population (million) 33,0 33,4 33,8 33,9 33,9Fiscal sector Total revenues (% GDP) 39,6 47,2 36,3 38,4 38,4
Hydrocarbon revenues (% of GDP) 30,1 37,2 23,8 25,6 26,0 Total expenditure (% GDP) 35,2 39,5 43,1 42,2 41,8
Government balance (% GDP) 4,4 7,7 -6,8 -3,8 -3,3 Non-hydrocarbon primary balance (% GDP) -44,1 -53,1 -44,9 -45,3 -45,8 Total government debt (% GDP) 12,5 8,2 10,4 10,3 11,4
Monetary sector Credit to the economy (% change) 17,2 20,4 18,5 12,5 12,0 Credit to the private sector (% change) 14,4 16,9 14,7 12,5 12,5
Broad money (% change) 24,1 16,1 3,1 14,1 14,6External sector Trade balance (% GDP) 25,5 23,9 5,6 12,4 13,5 Current account balance (incl. Official transfers, % GDP) 22,8 20,2 0,3 8,5 9,3 FDI (% GDP) 1,0 1,4 1,8 1,5 1,0
External vulnerability External debt (% GDP) 4,2 3,3 3,8 2,8 2,2
Gross official reserves (USD, billion, e-o-p) 110,2 143,1 148,9 161,0 171,4 In months of next year's imports 26,9 35,4 35,6 36,7 37,9
Financial sector Exchange rate (dinar per USD, average) 72,6 69,3 64,6 72,5 n.a. Exchange rate (dinar per EUR, average) 94,5 94,1 99,8 n.a. n.a. Real effective exchange rate (2005=100) 1 99,0 102,1 100 n.a. n.a.
1 Increase (or decrease) reflects appreciation (or depreciation) of the Algerian dinar.
Note: Assumption for the Brent oil price per barrel is USD 35 in 2009. Sources: Algerian authorities, IMF, EUROSTAT and own calculations.

2. ARMENIA
84
• After a steep downturn, the Armenian economy recorded a modest recovery of 2.1% of GDP in 2010.
• Inflation surged to 7.3% on the back of a poor agricultural output and of a ban of wheat exports from Russia.
• The international community continued to support Armenia to address its external financing needs.
• Oligopolistic structures continued to be dominant in many sectors of the economy.
Macroeconomic and financial developments
In 2010, the Armenian economy recovered from the sharp downturn of 14.2% in 2009 - the first recession since 1993 - but the pace of recovery remained modest. Real GDP grew by 2.1%, driven by a recovery in services (4.4%) and industry (9.5%) which benefited from the rise in prices of metals. Construction recorded a small growth of 3.7% compared to the sharp contraction by 42% in 2009. Growth accelerated in the first semester of 2011 and is expected to reach 4.6% at the end of 2011.
Domestic and external supply shocks caused by the sharp decline in domestic agricultural output and Russia's decision to ban wheat exports, owing to the negative impact of the drought and fires, brought the inflation rate to 9.4% year-on-year in December 2010 and to 8.9% in April 2011 from 7% in January 2010. The Central Bank of Armenia raised the reference interest rate from 5% in December 2009 to 7.25% in May 2010 in five steps. Since May 2010 the reference interest rate remained unchanged as the pace of recovery slowed down in the second semester of 2010. Nevertheless, the central bank raised it to 7.75% in February 2011 and to 8.5% in April 2011 over the threat posed by resurgence in food price inflation. In September 2011 the reference interest rate was lowered to 8% as inflation pressures eased.
After the depreciation of Dram by 22% in March 2009, the authorities have moved towards a free
Graph IV.2.1: Armenia - GDP growth and remittances
-7,8
-4,6
-1,4
1,8
5,0
8,2
Q4/09 Q1/10 Q2/10 Q3/10 Q4/10 Q1/11
Source: IMF and Central Bank of Ar menia.
GDP growth year on year, %
262
315
368
420
473
526
Remittances inflows,
USD million
Graph IV.2.2: Armenia - Fiscal balance, public debt, current account
-16,0
-12,3
-8,6
-4,9
-1,22007 2008 2009 2010
2011projection
Sources: Armenian authorit ies, IMF, EU staff calculat ions.
Fiscal balanceCurrent
account% GDP
16,1
23,4
30,7
37,9
45,2
Public dept% GDP
Graph IV.2.3 :Armenia - Exchange rates
73
82
91
100
109
118
Jan-09 May-09 Oct-09 Feb-10 Jul-10 Dec-10 Apr-11 Sep-11
Sources: ECOWIN.
Euro per armenian dram
Dollar per armenian dram
Index 1/1/09 = 100

Part IV Country analysis, Armenia
85
floating exchange rate regime. However, the exchange rate market for the Armenian Dram is small and highly volatile, thus leading to occasional foreign exchange interventions by the central bank to limit the excess exchange rate volatility. In 2010 the Armenian Dram (AMD) appreciated by 4% against the US Dollar and by around 12% against the EUR, boosted by an improvement in export earnings and remittance inflows. Although foreign reserves in December 2010 were at a sufficient level (around USD 1.859 billion), a need for reserve built-up cannot be excluded given the persisting high levels of the current account deficit (around 14% of GDP in 2010) and the weak stream of external inflows to the economy.
The fiscal easing of 2009 was reversed during 2010 on the back of the economic recovery. As a result, the general government deficit was reduced to 4.6% of GDP in 2010 compared to 7.9% of GDP in 2009. The reduction in the deficit was driven by both a substantial increase of 13.6% in tax revenues, supported by the economic recovery, and an increase in government spending limited to 3.3%. Nevertheless, the tax-to-GDP ratio deteriorated from 22.8% in January 2010 to 16.2% in December 2010 while on a yearly basis it increased from 19.4% in 2009 to 19.7% in 2010. This indicates high tax evasion, widespread underreporting of corporate earnings and possible under-taxation of some sectors such as agriculture. The public debt-to-GDP ratio nearly tripled, from 16.1% of GDP in 2008 to 40% in 2010, as a result of the counter-cyclical measures and the flow of financial assistance from the international community in the form of loans. The external debt represents around 90% of the total public debt, thus increasing the exchange rate vulnerability and the dependence on concessional financing in addressing future financing needs. The fiscal position continued to improve in the first six months of 2011. Revenues increased by 9.8% while expenditures rose by 6.6%.
Exports rose by 42.4% in 2010, to just over USD 1 bn, after having contracted by 35.7% in 2009. Higher global prices and increased demand for the country's main exports (metals and mineral products) were the primary export drivers. Imports rose by 13.9%, totalling almost USD 3.8 bn. The sharp increase in exports was not sufficient to offset the growth in imports, resulting in a larger
trade deficit (on a customs basis) of almost USD 2.8 billion, up from USD 2.6 billion in 2009. The surplus on current transfers increased by 8.7% boosted by increased remittance inflows, as the outlook for Russia (the main destination for Armenian migrant workers) improved in 2010. As a result, the current-account deficit as a percentage of GDP narrowed to around 14% in 2010, after expanding to 16% in 2009. Positive trends in the external sector continued in the first seven months of 2011, with exports growing by 38.4% and imports growing by 7.7% year-on-year.
The banking sector is well capitalised and has exhibited resilience to stress-tests. As a result of the economic recovery, the ratio of non-performing loans dropped in March 2011 to 3.5% from 5% in August 2010 and from 10% in 2009. Nevertheless, financial intermediation remains sub-optimal as the private sector's access to credit is hampered by high dollarization and high lending rates. Lending rates decreased only marginally to around 17.3%, partly due to the currency mismatch between deposits (around 68% of total deposits are foreign currency denominated) and assets (around 56% of total assets are foreign currency denominated).
Policy reforms and measures
In view of the surge in inflation, the Central Bank of Armenia stepped up its efforts to improve the transmission channels of the monetary policy. To this end, preparations for the active management of liquidity and the development of transactions in dram-denominated securities advanced.
In the area of tax administration, measures have been taken to reduce corruption and increase tax compliance by simplifying and streamlining reporting requirements and by applying regulation consistently to all taxpayers through published normative acts approved by the Ministry of Finance. An appeal body dealing with legal and procedural disputes of taxpayers was also established. Processing time for VAT refund claims was brought below 90 days. To ensure fiscal consolidation and place the debt on a downward path, the authorities re-introduced and strengthened the Medium Term Expenditure Framework in 2010 and adopted a new debt management strategy. The adoption of a new law on internal audit will also accelerate efforts for the

European Commission
The EU's neighbouring economies: coping with new challenges
86
implementation of a new Public Internal Financial Control strategy across the government.
Regarding the banking sector, the risk management and supervisory frameworks were enhanced, including through contingency planning. Prudential regulations to specifically address currency-induced credit risk were issued, including increased loan-loss provisioning requirements and higher risk weights in capital requirements for foreign currency loans. Progress was also made regarding the establishment of the Committee for Financial Stability and the coordination of crisis management banking policies among policy makers.
Armenia's efforts to improve business environment were reflected to World Bank Doing Business report 2012 by gaining the 55th place from the 61st place one year earlier. However, significant weaknesses remain in the area of paying taxes, getting electricity, trading across the borders, protecting investors.
Social development and poverty
As a result of the economic crisis the implementation of the Sustainable Development Programme on poverty reduction continued to be suspended in 2010. The official unemployment rate was 6.2% in June 2011. Young people and women continued to be particularly affected, with respectively 19% and 75% of official unemployment. Armenia adopted social dialogue related amendments to the Labour Code in June 2010.
In the field of social inclusion and protection, Armenia adopted in December 2010 amendments to the Law on State Pensions and a package of laws ensuring transition to a funded pension scheme, including a minimal safety net for those who do not contribute, indexed to CPI, a basic pension based on years of contributions, indexed to CPI and a funded pension component reflecting individual contributions that is invested and paid in the form of annuities.
Risks and outlook
In 2011, the pace of recovery is expected to accelerate to around 4.6% benefiting from improved conditions in agriculture and
construction and the ongoing recovery in the Russian economy: an important source for investments and remittances. Nevertheless, more long-term growth prospects are still challenging, due to lack of diversification, low-competitiveness and the closed borders with two out of the four neighbouring countries.
Inflationary pressures are expected to remain significant during 2011 despite central bank's commitment to tighten the monetary policy. On average, inflation is expected to reach 9% in 2011 from 7.4% in 2010, depending on the improvement in domestic agricultural output and the lift of ban of Russia's wheat exports. In the long-run, careful fiscal policies and strengthening of internal market competition will be essential for further inflation containment.
The fiscal consolidation is expected to continue in 2011, narrowing the fiscal deficit to around 4% of GDP. The reduction in the fiscal deficit is projected to be driven by a limited (around 7%) increase in expenditures, although social spending will increase more, and a stronger (about 10%) increase in revenues. Given fiscal constraints, efforts to achieve better targeting of the anti-poverty and social programmes should step up. A crucial factor for a sustainable fiscal position will be the planned reforms in tax and customs administration, aiming to enhance revenue collection.
In 2011, Armenia's exports will continue to benefit from high global prices and increased demand for metals and mineral products. Thus, despite an increased demand for imports - led by improved outlook in domestic demand and in capital intensive sectors – the trade deficit is expected to narrow to 22.5% of GDP in 2011. Based on an increased flow of remittances, the current account deficit is also expected to narrow to around 11.5% of GDP in 2011, which is still high.
The international community will continue to support Armenia in maintaining macroeconomic stability and sufficient external financing. In this respect, Armenia is expected to receive from the European Union EUR 100 million (including EUR 35 million in grants) in the context of the Macro-financial assistance programme signed in February 2011.

Part IV Country analysis, Armenia
87
Table IV.2.1:Armenia - Main economic indicators 2007 2008 2009 2010 2011
prel. proj.Real sector
Real GDP growth (domestic currency, % change) 13,7 6,9 -14,2 2,1 4,6 GDP nominal (Dram, billion) 3149 3568 3103 3462 3837 GDP nominal (EUR, billion) 6,7 8,0 6,1 7,0 8,5 GDP nominal (USD, billion) 9,2 11,7 8,5 9,3 10,8 GDP per-capita (EUR) 2081 2470 1916 2184 2658
GDP per-capita (USD) 2857 3612 2671 2895 3362 Inflation (average) 4,4 9,0 3,5 7,3 9,4Social indicators
Unemployment (off. registered, average, %) 6,7 6,3 6,9 7,0 6,8 Poverty rate (% population) 25,0 23,5 24,6 34,1 n.a. Income inequality (Gini, %) 33,8 n.a. n.a. 30,2 n.a. Population (million) 3,2 3,2 3,2 3,2 3,2Fiscal sector
Total revenues (including grants, % GDP) 20,1 20,5 21,1 21,2 21,7 Total expenditure (% GDP) 22,4 22,2 28,9 26,2 25,6 Central govt. balance (% GDP) -2,2 -1,2 -7,9 -4,6 -3,9 Gross public debt (% GDP) 16,1 16,2 40,6 39,9 45,2 share of foreign currency debt (% of total public debt) 86,7 83,7 88,9 87,7 88,5Monetary sector
Dollarisation in bank deposits (%) 35,6 43,8 68,3 68,6 n.a.External sector
Current account balance (% GDP) -6,4 -11,8 -16,0 -14,0 -11,5 Trade balance (% GDP) -17,4 -22,8 -24,4 -23,1 -22,5 Remittances (net inflows, private USD million) 850 1062 733 844 975
Remittances (% GDP) 9,2 9,1 8,6 9,1 9,1 Foreign direct investment (net, in USD million) 701 940 725 569 641 Foreign direct investment (net, % GDP) 7,6 8,1 8,5 6,1 6,0External vulnerability
External public debt (in million USD) 1449 1577 2967 3336 3700 External public debt (% GDP) 15,7 13,5 34,7 36,0 36,9
Debt service ratio (% of exports of goods and services) 7,4 7,8 5,4 4,9 4,8 Gross reserves (excl. gold, USD million) 1659 1407 2004 1859 1872 In months of next year's imports 4,2 4,6 5,7 4,8 4,7Financial sector
Exchange rate (DRAM per EUR, average) 467,8 447,3 506,1 495,4 451,1 Exchange rate (DRAM per USD, average) 342,1 305,8 363,1 373,7 356,6
Real effective exchange rate (%, + denotes appreciation) 15,3 11,5 -6,0 n.a. n.a.UN Human development index 2005 2009 2010
Human development index 0,669 0,693 0,695 n.a. n.a.
Sources: IMF, EIU, Armenian authorities, UN.

3. AZERBAIJAN
88
• After exceptionally rapid growth in the pre-crisis period, driven by Azerbaijan's oil economy, GDP growth decelerated to 5% in 2010 and 0.9% in the first half of 2011. Although the economy withstood the impact of the global crisis well, the fallout occurred primarily via the fall in the external demand for oil and lower oil prices.
• The government started to roll back the expansionary fiscal policy in 2010, but changed course in 2011. Public spending was cut by more than 2% of GDP in 2010, but the fiscal deficit excluding transfers from the SOFAZ oil fund remained large at around 15% of GDP and widened further in 2011.
• The current account surplus is growing again on higher energy prices together with the assets of SOFAZ the state oil fund.
Macroeconomic and financial developments
In recent years, the oil sector had been the main driver of the economy, making Azerbaijan one of the world’s fastest-growing economies. The impact of the global economic downturn was also less severe than in other countries in the region, cushioned by a strong fiscal expansion. However, real GDP growth decelerated sharply to 5% in 2010, while the non-oil sector expanded faster than the oil sector (7.9% against 1.8% in real terms). In the first half of 2011, real growth decelerated faster to 0.9% y-o-y, while the non-oil sector advanced by 7.2% y-o-y and the oil sector shrunk. The oil sector had expanded by an annual average of 37% in the years 2005-2009 and currently accounts for more than half of GDP and over nine tenths of exports. But oil production has reached its peak and the sector will slow down until new investments, particularly in gas, are finalised. In 2010 nominal GDP grew by a notable 20%, while the GDP deflator strongly outpaced domestic inflation thus revealing the strong dependency of the economy and budget on international oil prices.
In terms of growth drivers, net external demand became a major contributor to real GDP growth again in 2010, after the global crisis strongly
Graph IV.3.1: Azerbaijan - GDP and production
0
10
20
30
Jan-07 Jan-08 Jan-09 Jan-10 Jan-11
Annual real GDP growth
%
-3
10
23
35
48
Total GDPNon-oil GDP
y-o-y, %
Sources: State Stat ist ics Committee and Nat ional Bank of Azerbaijan.
Graph IV.3.2:Azerbaijan - Fiscal balance, SOFAZ transfers, current account
-5,0
0,0
5,0
10,0
15,0
20,0
25,0
30,0
2007 2008 2009 2010 projection2011
Sources: IMF, EIU and Azeri authorit ies.
Fiscal balanceSOFAZ transfersCurrent account
balance% GDP
Graph IV.3.3:Azerbaijan - Exchange rates
90
95
100
105
110
115
120
125
130
Jan-08 Jun-08 Dec-08 May-09 Nov-09 Apr-10 Oct-10 Mar-11 Sep-11
Source: Ecowin Reut ers.
Euro per Azeri manat
US dollar per Azeri manat
Index 1/1/08 = 100

Part IV Country analysis, Azerbaijan
89
affected exports via waning energy demand in 2009. Exports of goods and services rebounded and grew by 14.5% in 2010, driven by increasing global demand and higher oil and gas prices. In a similar way, gross fixed capital formation turned positive and grew by 6% after having declined at a double-digit rate in 2009. The investment recovery was linked to a slight recovery in foreign direct investment. Private and public consumption contributed positively to growth; although the latter slowed down significantly in comparison to 2009, primarily on the account of more restrained public spending.
On the supply side, industrial production (1) expanded by only 2.6% in 2010, impacted negatively by a slowdown in the oil sector. The growth of oil extraction increased by only 2.9% compared with 11% in 2009. By contrast, gas production accelerated rapidly and expanded by 11.2% in 2010. As the growth of the mining subcomponent of industrial output slowed to 1.7%, the overall production was supported by a 9% expansion in the much smaller manufacturing sector. This explains the faster advancement of the non-oil GDP in 2010, together with the robust expansion of the wholesale and retail trade by 8.8% and of the construction sector by 20.3%. The rebound of the construction sector benefitted from ongoing investments and the base effect. The agricultural sector contracted by 2.2% following the floods which hit the country in early 2010.
Economic growth is expected to moderate further to below 2% in 2011, as a slight decline in the oil extraction is projected and as the fiscal consolidation is likely to continue. It may entail a further diversification of the economy into manufacturing and services, in particular as the authorities designated 2011 the "year of tourism".
Average inflation rose rapidly to 5.7% in 2010, driven largely by rising global food prices, but remained below the double-digit rates recorded in the boom years. Higher energy prices and the loose fiscal policy also contributed to the resurgence of inflationary pressures in the last months of 2010. Average inflation is expected to reach 10% by end-2011, signalling the need for a less expansionary policy mix. Year-end inflation peaked in February at 9.3% and gradually fell to 7.6% in July. The (1) Measured on the basis of gross industrial output
annual increase of the monthly average wage moderated to around 9% (3.1% in real terms) after the very high growth rates recorded in the recent economic boom. This underpins external competitiveness, benefitting primarily the non-oil sector which saw a healthy growth of exports recently. The official unemployment rate increased slightly to a still very low 1% of the labour force.
At the onset of the crisis, the Central Bank of Azerbaijan (CBA) took important steps to loosen monetary policy and ease liquidity conditions, as restricted access to global capital markets and falling deposits obliged the banking sector to scale back lending. In response to inflationary pressures, the CBA raised the refinancing rate by 1 percentage point in November 2010 and by further 2 points in March 2011 to 5%. The increase followed a period of significant monetary easing, in which the refinancing rate had been reduced by 13 percentage points since October 2008. The CBA also increased the reserve requirements on banks' external and domestic liabilities from 0.5 to 2% at the beginning of 2011. The Manat remained stable against the US Dollar, at Manat 0.8: USD 1, helped by higher oil prices and a growing CA surplus. In addition, the sizeable financial account outflows of more than USD 6 bn recorded under "other investments" in 2009 declined significantly last year. After having declined by about USD 2 bn in the first quarter of 2009, the official reserves of the CBA grew steadily over 2009 and 2010.
The 2010 budget targeted a narrowing of the non-oil deficit at the same time as allowing for tax cuts. The budget deficit remained broadly similar as in 2009 at around 15% of GDP, excluding transfers from SOFAZ (0.9% of GDP including SOFAZ transfers). However, the fiscal consolidation process was reflected in lower public spending by around 2.3% of GDP compared to 2009, as government consumption was reined back. Revenue declined as a percentage of GDP compared to 2009, influenced by the effect of several tax reductions effective from January 2010. The budget execution was better than expected in the first quarter of 2011, as global oil prices were higher than projected. The authorities amended the 2011 budget target in May, partially increasing public sector wages and social spending and partially increasing investment. Due to the heavy reliance of the budget on transfers from SOFAZ,

European Commission
The EU's neighbouring economies: coping with new challenges
90
the deficit excluding these transfers would widen beyond the previous 15% of GDP.
The Azeri financial sector weathered the global crisis well due to a strong capital base and limited links with the international financial sector. In a sign of potential weakness, non-performing loans rose sharply in 2010, albeit from a low base, to 4.7% of all loans and reached 5.2% at the end of March 2011. The growth rate of credit to the private sector further moderated to about 9% at the end of 2010, after the unsustainable high rates recorded in the boom years, and became negative in the first quarter of 2011. The crisis-related increase in the dollarization of bank deposits was reversed in 2010. A new law on non-bank credit institutions was implemented in February 2010, improving the legal framework and strengthening the central bank’s supervision of the sector.
In spite of the weak expansion in oil production, the trade surplus increased to about 38% of GDP in 2010 on the back of higher oil prices boosting export revenue. The assets of the State Oil Fund of the Republic of Azerbaijan (SOFAZ, the overseas windfall fund) rose to US$22.8bn at the end of 2010 and to US$30bn at the end of June 2011. It represents more than 50% of GDP and five times the size of the public external debt. The current account surplus rose to an estimated 26% of GDP compared to 23.7% in 2009.
Policy reforms and measures
In order to diversify the economy, the authorities committed to improve the business environment and to enhance competitiveness through further progress with tax, customs and financial sector reforms. The development of the agricultural sector was further supported by legislation to increase the number of imported goods necessary for agricultural production which are exempt from VAT and customs duties. Housing and transport infrastructure were further improved, in particular the North-South and the East-West railway corridors. Preparations for the restructuring and privatisation of the banking sector dominant International Bank of Azerbaijan is underway.
Azerbaijan was ranked 55th in the Global Competitiveness Report 2011-2011 out of 142 countries – thus improving two places compared to last year. Health and primary education, goods
market efficiency and the development of financial markets remain among the biggest weaknesses of the economy. Corruption and access to financing are considered among the most problematic factors for doing business, while the low-crime environment and government stability are among the positive traits. Azerbaijan ranked 66th in the World Bank's Doing Business 2012 report, which is better than many of its Eastern Europe peers or even some EU economies. The report did not record any particular progress in the main reform areas during the previous year. At the beginning of 2011, the authorities began implementing measures to reduce corruption as part of a wider anti-corruption policy. According to the corruption perceptions index of Transparency International (TI), Azerbaijan ranks 134th out of 180 countries, signalling a relatively high level of corruption despite some progress compared to the 143rd place occupied in 2009. It affects negatively the investment climate by reducing competition in some economic sectors and weakening the enforcement of property rights.
Social development and poverty
The spectacular growth rates averaging 20% during 2003-2008 led to a rapid decline in the official poverty rates, from about 45% in 2003 to 13.2% in 2008. Despite the global crisis, the poverty rate further declined to 10.9% in 2009 and 9.1% in 2010, helped by the increase in public spending. In 2010, the per-capita income grew by almost 12% in nominal terms and by 6% in real terms. The government has increased wages and social entitlements also in 2011 given the sensitivities raised by the unrest in MENA countries. Accordingly, the SOFAZ oil-fund will continue to strongly support the state budget in 2011. Officially registered unemployment remains low while the government aims to increase the share of the agricultural sector to 10% of GDP by 2015 as poverty is concentrated in rural areas.
Risks and outlook
Azerbaijan’s high reliance on hydrocarbons (1) remains the economy’s major vulnerability in the long run. Therefore, the diversification of the
(1) The oil sector provides around 95 % of country's total
export earnings, 50 % of its GDP and around 60 % of its budget revenue.

Part IV Country analysis, Azerbaijan
91
economy remains a strategic challenge underpinning the need for further structural reforms and opening of the economy to more competition. Government support in the form of concessional loans to SMEs, various incentives in the agricultural sector, higher investment in infrastructure, education, health and tourism is helpful in lifting up the non-oil GDP. At the same time, more efforts are necessary to improve the business environment and ensure a level playing field for investors in order to enhance domestic and foreign investment in the non-oil economy.
Over the medium term, growth prospects remain robust and the hydrocarbon sector is set to expand further due to large investments in the vast Azeri-Chirag-Guneshli oil fields and the Shahdaniz gas field. However, the recent sharp deceleration of real GDP growth limits the prospects for a stronger economic rebound in the near future. In addition, the unresolved dispute with Armenia over Nagorno-Karabakh still poses a further political risk to economic stability.
Table IV.3.1:
Azerbaijan - Main economic indicators 2007 2008 2009 2010 2011
prel. proj.Real sector Real GDP growth (domestic currency, % change) 25,0 10,8 9,3 5,0 1,5
Non-oil GDP (real growth, % change) 11,3 15,7 3,2 7,9 n.a. GDP nominal (EUR, billion) 22,8 33,2 30,8 39,1 41,2
GDP nominal (USD, billion) 31,2 48,9 42,9 51,9 58,1 GDP per capita (EUR) 2647 3778 3457 4344 4527
GDP per capita (USD) 3628 5559 4821 5762 6380 Inflation (avg.) 16,7 20,8 1,5 5,7 n.a.Social indicators
Unemployment rate (officially registered only) 0,9 0,9 0,9 1,0 1,0 Nominal average wage (% change) 42,0 24,2 8,6 9,1 n.a.
Domestic population (million) 8,6 8,8 8,9 9 9,1Fiscal sector
Total revenue (% GDP) 22,4 26,8 29,9 27,4 26,4 Total revenue (excl. SOFAZ transfers, % GDP) 19,1 17,3 15,6 13,2 12,1
Total expenditure (% GDP) 22,6 26,6 30,6 28,3 27,9 Budget balance (% GDP) -0,2 0,2 -0,7 -0,9 -1,5
Budget balance (excl. SOFAZ transfers, % GDP) -3,5 -9,3 -15,0 -15,1 -15,8
External public debt (% GDP) 7,7 6,5 7,9 10,2 n.a.Monetary sector
Domestic credit to private sector (% change) 96,8 55,2 17,4 9,0 n.a. Broad money (M3) (% change) 71,4 44,0 -0,3 24,3 n.a.
Degree of monetisation (M3/GDP, %) 22,0 21,2 24,5 25,3 n.a. Dollarisation in bank deposits (%) 51,3 59,3 58,9 51,3 n.a.External sector
Current account balance (% GDP) 28,9 33,6 23,7 26,1 28,5 Trade balance (% GDP) 48,8 47,0 34,0 38,2 36,1
Net FDI inflows (% of GDP) -16,4 -1,1 0,3 1,0 n.a.External vulnerability
Total external debt (% GDP) 21,3 19,1 19,9 21,4 20,8 External debt to exports (% GDP) 31,3 27,5 37,5 36,9 37,2
Total international reserves (% of GDP) 13,7 13,2 12,5 13,4 n.a.Financial sector Lending rate 19,1 19,8 20,0 19,6 n.a.
Exchange rate (local currency per EUR, average) 1,18 1,21 1,12 1,06 1,11 Exchange rate (local currency per USD, average) 0,86 0,82 0,81 0,80 0,79
Real effective exchange rate (% chg., + is app.) 6,9 28,1 -5,5 10,5 n.a.
Sources: Azeri authorities, IMF, WB and own calculations.

4. BELARUS
92
• In 2010, Belarus experienced a strong economic recovery but it has not been sustainable due to the vulnerable external position and lax fiscal and monetary policies.
• Pressures on official reserves and local currency intensified in early 2011, leading to a strong exchange rate adjustment of 36% in May.
• Purchasing power of the population dwindled as inflation accelerated in May and in September 2011. The annual estimate of 38% could be significantly surpassed.
• Despite a strong increase of the key policy rate of the Central Bank to 30%, the shadow exchange rate further depreciated in mid-September 2011.
Macroeconomic and financial developments
Compared to its neighbours, Belarus was much less affected by the global crisis, with GDP still growing in 2009 - albeit very little at 0.2% - and activity rebounding in 2010 by 7.6%. However, this strong economic momentum has not been sustainable given pressures to correct the widening external imbalances and slow progress in structural reforms.
Inflation pressures intensified at the end of 2010, and the average consumer price inflation reached 7.7% in 2010. Government finances have been under pressure due to the deteriorating terms of trade in energy, with general government deficit reaching 1.8% of GDP in 2010. Also Belarus' current account deficit continued to grow, reaching 15.5% of GDP in 2010. The deficit was financed through borrowing from the IFIs and by accessing the international markets. The measures included the last tranche of the IMF loan of USD 670 million paid in March 2010, the proceeds from the USD 1 billion Eurobond issued in summer 2010, and a bond of around USD 250 million placed on the Russian market in December 2010. However, with access to international capital markets being insufficient and the IMF programme of USD 3.5 bn being completed in March 2010, the National
Graph IV.4.1: Belarus - GDP and production
0
3
5
8
10
Jan-07 Jun-07 Nov-07 Apr-08 Sep-08 Feb-09 Jul-09 Dec-09 May-10 Oct-10 Mar-11 Aug-11
Annual real GDP growth
%
-25
-12
1
15
28
41
Manufacturing productiony - on - y %
Sources: National St atistical Committee of Belarus and IPM Research Centre
Graph IV.4.2: Belarus - Fiscal balance, public debt, current account
-16,0
-11,0
-6,0
-1,0
4,0
2007 2008 2009 2010 2011projection
Source: Min istry of St at ist ics and Analysi s of Belarus.
Fiscal balanceCurrent account
% GDP
5,0
15,0
25,0
35,0
45,0
Public dept% GDP
Graph IV.4.3: Belarus - Exchange rates
30
40
50
60
70
80
90
100
110
120
Jan-08 Jun-08 Dec-08 May-09 Nov-09 Apr-10 Oct-10 Mar-11 Sep-11
Sources: ECOWIN Reut ers.
Euro per belarusian ruble
Dollar per belarusian ruble Index 1/1/ 08 = 100

Part IV Country analysis, Belarus
93
Bank of Belarus had to borrow foreign currency amounting to USD 3.8 bn from domestic commercial banks.
Since late 2010, the country has been facing a significant external financing gap that has put pressure on the country's international reserves and the exchange rate. Official reserves went down from USD 5.7 bn in early December 2010 to USD 4 bn in early March 2011. In March the authorities decided to stop supporting the domestic exchange rate, and pressures on the local currency and international reserves intensified in April-May 2011. The multiple exchange rate practice that then emerged led to a stand-still on the official exchange rate market. Only few essential products such as medicines and gas are traded at the official exchange rates. With pressure on the currency further intensifying, on 12 May 2011 the NBB widened the fluctuation band for the Belarusian rouble against a basket of foreign currencies from +/-8% to +/-12%. However, these policy measures did not succeed in re-establishing confidence, and on 24 May 2011 the authorities used a drastic measure to stabilise the situation by devaluing the centre of the fluctuation band of the currency basket by 36% (from 3100 to around 5000 rouble for 1 USD). However, this devaluation was not accompanied by the abolition of the multiple exchange rate practice, with shadow exchange rate remaining 15-20% below the official rate(1).
In mid-September 2011, the exchange rate was freed during the additional trading sessions at the National Stock Exchange. While the official exchange rate on the main trading session remained at its previous level of 5335 rouble to USD, the market-driven exchange rate reached 8600 rouble per USD. The authorities plan to unify the official and the shadow exchange rate at around 7000 rouble per USD by the end of 2011.
(1) The previous devaluation of the Belarusian currency dates
back to January 2009, when the rouble was devalued by 20% against the US Dollar. The devaluation was a prior action to the IMF programme. Another prior action was a switch from a peg to the US Dollar (in place since 2003) to the euro/dollar/Russian rouble basket, which better reflected the structure of Belarus' trade and financial flows. At the same time, a fluctuation band of +/-5% was allowed to increase flexibility and facilitate shock absorption. Due to pressures on the currency related to large current account deficit and volatile capital inflows, the fluctuation band was widened to +/- 10% in the first half of 2009 and re-centred at a lower central rate at the end of 2009.
Real GDP grew by 11% (year-on-year) in the first six months of 2011. Growth started to slow down in July; annual growth in 2011 is expected to be around 5% due to the lower domestic demand. Due to expansion in bank credit and growth in the monetary base as well as due to nominal exchange rate devaluation, consumer price inflation peaked in May (reaching 16.3% m-o-m). Purchasing power of the population dwindled further as inflation accelerated in September to 13.6% m-o-m. By end September, inflation reached 75% for the first nine months of 2011, meaning that the previous annual estimate of 38% could be significantly surpassed.
To reduce the inflationary pressures, stabilise the exchange rate and attract foreign capital inflows, the National Bank of Belarus raised the base refinance rate between mid-March and mid-September 2011 in several steps from 10.5% to 30%. Price controls (retail markup ceilings) on key foodstuffs and "socially important" goods and services were introduced in April 2011 and extended in May, and have since been maintained.
The majority of companies lack foreign currency. In addition, they are obliged to sell 30% of export proceeds to the state at the official exchange rate. Many private companies, unable to purchase foreign currency to pay for imported materials, have sent workers on temporary leave.
Policy reforms and measures
At 30% of GDP, the share of the private sector in the Belarus economy remains very low. The share of the private sector is even lower in the banking sector. Also, 30% of prices in the consumer price inflation are administratively set and there are still significant limits to currency convertibility and foreign trade transactions. Furthermore, in state-owned banks, directed lending practices in which lending decisions of banks are not based on the profitability and project risks but rather on government guidelines are still widely used.
Yet Belarus, which remains the only state-led economy in Europe, did make some progress in introducing market mechanisms in 2010. Amended legislation improved the legal framework for privatisation and a new agency for privatisation was set up. Furthermore, a share of financial sector was privatised. Prices were further liberalised and

European Commission
The EU's neighbouring economies: coping with new challenges
94
administrative controls on business were reduced. A Presidential Directive on "Development of entrepreneurial initiative and promotion of business activity" adopted in December 2010 is perceived as a strong signal for a new wave of economic liberalisation. It is expected to reduce state control and introduce further market-economy elements. As far as business climate is concerned, according to the 2012 World Bank's Doing Business indicators, Belarus ranked 69th out of 183 countries. Progress was achieved mainly in the areas of registering property, protecting investors and paying taxes. At the same time, enforcing contracts became more difficult.
In December 2010, after the resolution of a long row over energy issues between Russia and Belarus, the two countries and Kazakhstan signed a declaration on the establishment of a Common Economic Space. Since July 2010, within the framework of the Eurasian Economic Space, Belarus, Russia and Kazakhstan make up a Customs Union which has a common external tariff structure with a number of temporary exemptions. In July 2011, customs inspections were transferred to the common external border of the Customs Union.
Social development and poverty
According to the UN Human Development Index, a composite index measuring average achievement in basic dimensions of human development such as health, education, income, inequality and poverty, in 2010, Belarus ranked 61st out of the 169 countries covered (with an index value of 0.732 on a scale ranging from 0 to 1). The country is thus leading in human development in the Eastern Neighbourhood region: GNI per capita in purchasing power parity was at USD 12.926 in 2008, absolute poverty has been low (below 2% of the populations lives on less than USD 1.25 per day in PPP), and relative poverty has been limited with 17.4% of the population living below the national poverty line).
Risks and outlook
The external financing needs of the country remain significant. In 2011 the current account deficit was originally expected to decrease somewhat due to latest energy agreement with Russia; but due to the recent devaluation the current account deficit is
expected to remain high, decreasing only slightly from 15.5% in 2010 to 13.4% in 2011. The financing of the current account deficit will become more difficult, as FDI inflows are expected to significantly decelerate due to economic instability.
Belarus placed a Eurobond of USD 800 million in January 2011; however, recent events have probably damaged seriously its capacity to access the markets again in 2011. On 31 May, spreads on Belarus sovereign debt widened by 50 basis points, as measured by JP Morgan EMBI Global index. Belarus' level of international reserves remained critically low. In late April, the reserves stood at USD 3.7 bn. In June, Belarus agreed with the Russia-dominated Eurasian Economic Community over macro-economic stabilisation loans of USD 3 bn (USD 1.24 bn in 2011, USD 760 mn in 2012 and USD 1 bn in 2013), to be paid out of the Community's Anti-Crisis Fund. The loan is linked to a programme of economic reforms and privatisation that should amount to USD 7.5 bn over three years. The first tranche of USD 800 mn was disbursed in June 2011. The second tranche of USD 400 mn is scheduled for October 2011.
In late May, Belarus requested from the IMF a loan of USD 3.5 bn for a period of 3-5 years. An IMF mission to Belarus took place on 1-14 June 2011. The mission was formally a post-programme monitoring mission, but it did also engage in negotiations on the requested new programme, without, however, reaching an agreement. The next discussions on a possible IMF loan took place in early October 2011.
To overcome the currency crisis, the authorities plan drastically to reduce the financing of government programs and to establish market principles for lending by government-controlled banks. Furthermore, privatisation of around 180 Belarusian companies is planned. The authorities also announced that the general budget deficit will be balanced in 2011.
A careful management of external debt should be another key priority. Gross public debt is expected to almost double from 26.5% of GDP in 2010 to 46% of GDP in 2011. The share of short-term debt is high, with a bulk of debt repayments falling on 2012-13.

Part IV Country analysis, Belarus
95
Table IV.4.1:
Belarus - Main economic indicators 2007 2008 2009 2010 2011
prel. proj.
Real sector Real GDP growth (% change) 8,6 10,2 0,2 7,6 5,0
GDP nominal (EUR, billion) 30,7 41,3 33,5 41,2 40,2
GDP nominal (USD, billion) 45,3 60,8 49,3 54,7 55,6
GDP per-capita (EUR) 3368 4302 3522 4388 4278 GDP per-capita (USD) 4668 6329 5185 5818 5919
Inflation CPI (average) 8,4 14,8 13,0 7,7 38,0
Social indicators Unemployment (%) 1,0 0,8 0,9 0,9 0,7
Population (million) 9,7 9,6 9,5 9,4 9,4
Fiscal sector Total revenue (% GDP) 47,1 46,5 42,4 41,9 37,0
Total expenditure (% GDP) 46,6 45,1 43,1 43,7 37,0
General government balance (%GDP) 0,4 1,4 -0,7 -1,8 0,0
Gross public debt (% GDP) 11,4 13,4 21,7 26,5 46,0
Monetary sector Credit to the economy (% change) 48,5 50,0 27,9 38,1 44,9 Private sector credit (% total credit) 76,3 76,1 74,1 75,5 75,9
Broad money (change in %) 25,8 11,3 12,6 28,3 13,3
Degree of monetisation (M3/GDP, %) 25,2 23,9 27,7 30,9 23,4
Foreign currency deposits of total deposits (%) 38 39 49 51 52
External sector Current account balance (% GDP) -6,7 -8,6 -13,0 -15,5 -13,4 Trade balance (% GDP) -8,9 -10,3 -14,1 -16,7 -11,8
FDI (net, % GDP) 4,0 3,5 3,6 2,4 1,2
External vulnerability Gross external debt (% GDP) 27,7 25,0 44,9 52,4 n.a.
Gross reserves, period end (USD, million) 4182 3061 5653 5031 6500 Reserves (months of next year's imports) 1,2 1,2 1,8 1,2 1,4
Financial sector
NBB refinancing rate (%) (year average) 10,5 10,4 13,9 11,8 19,2
Exchange rate (rouble per EUR, average) 3167,0 3143,0 4106,0 3951,1 n.a.
Exchange rate (rouble per USD, average) 2146,1 2136,4 2789,5 2978,5 n.a.
Real effective exchange rate (- appreciation) -3,9 1,6 -4,5 -4,9 n.a.
Sources: Belarus Ministry of Statistics and Analysis, NBB, UNDP, WDI, IMF and Commission.

5. EGYPT
96
• The Egyptian economy expanded by 5.1% of GDP in FY2010 compared to 4.7% of GDP in FY2009, led by an increase in investment spending supported by government stimulus measures.
• The political upheaval in spring 2011 has affected the short-term growth outlook. Tourism revenues dropped sharply, FDI inflows have been affected and remittances have fallen due to the conflict in Libya where many Egyptians are employed. Private consumption has also been subdued due to strikes, higher commodity prices, and lower remittances.
• The general government deficit expanded to 8% of GDP in FY2010 from -6.6% of GDP in FY2009, mainly on account of lower tax revenues, a hike in public sector salaries and higher spending on subsidies.
• A key priority is the consolidation of public finances to ensure fiscal sustainability, underpin macroeconomic stability and encourage the development of the private sector. In this respect, further structural reforms are needed to expand the tax base and reduce government consumption.
Macroeconomic and financial developments
The democratic uprising which began at the end of January 2011 has had a significant negative impact on the Egyptian economy. Economic growth declined to -4.2% in the first quarter of 2011 compared to growth rates of +5-6% for previous quarters. GDP is expected to grow by between 1-2% in FY2010-2011 and 3.2% in FY2011-2012. On the domestic side of the economy, strikes in many sectors, and the closure of shops and banks has badly affected private sector activity and consumption. The disruption to private sector activity has hit government revenues, while government spending on food and fuel subsidies has increased due to the steep rise in international commodity prices. On the external side of the economy, there has been a collapse in tourism revenue, which has also had a negative
Graph IV.5.1: Egypt - Output and expenditure on GDP (annual % change)
-30
-20
-10
0
10
20
30
40
2007 2008 2009 2010 2011 proj.
Source : EIU.
0
1
2
3
4
5
6
7
8
Private consumptionGovernment consumptionGross fixed investmentExports of goods & servicesImports of goods & servicesReal GDP
Graph IV.5.2: Egypt - Fiscal balance, public debt and current account
-12,5
-10,1
-7,7
-5,3
-2,9
-0,5
2007 2008 2009 2010 2011 proj
Source: EIU.
fiscal balancecurrent
account% GDP
73
78
83
88
93
98
public debt % GDP
Graph IV.5.3:Egypt - Share prices and exchange rates
30405060708090
100110120130140150
Feb-09Jun-09
Oct-09Jan-10
May-10Sep-10
Dec-10Apr-11
Aug-11
Sources: ECOWIN Reuters.
MSCI Egyptindex 1/1/08=100
828894100106112118124130136142148
EUR per EGP USD per EGP
index 1/1/08=100

Part IV Country analysis, Egypt
97
impact on many related sectors as tourism represents around 11% of GDP. International investor confidence has been dented, resulting in capital outflows from the government bond and equity markets, higher government borrowing costs, and a sharp fall in FDI inflows. The economy has also suffered from the fallout of the Libyan conflict, which has affected remittances and contributed to a rise in unemployment.
The current account balance deteriorated rapidly in the first quarter of 2011, but due to a strong performance in the second half of 2010, the negative impact on FY2010-2011 as a whole was contained. The current account deficit is set to be around 2% for FY2010-2011, similar to the previous year. It is likely to deteriorate to around -2.4% of GDP in FY2011-2012 partly due to subdued tourism revenue. There were substantial capital outflows in the first quarter of 2011, linked to equity and government bond markets, including $6 billion in foreign holdings of treasury bills. The stock market has fallen by around 40% since the start of 2011, and closed temporarily, but appears to have stabilised following progress on the political front. Egypt will face significant external financing needs for the next fiscal year FY2011-2012, as the economy still suffers the negative effects of the spring uprising and regional instability. Foreign direct investment fell sharply in FY2010-2011, by around 75%, compared to a year earlier, and will take a long time to recover due to continued risk aversion and political uncertainty.
The Egyptian central bank (CBE) intervened in the foreign exchange markets to halt a slide in the EGP-USD exchange rate, which has limited the pound's fall to about 3% since the start of the uprising. Since the start of 2011, official currency reserves have fallen sharply from around $36 billion to around $27.2 billion as of end of May 2011. Reserves are continuing to decline at an underlying rate of about $1.3 billion per month. The current level represents about 5 months of imports of goods and services. Unofficial reserves, held by commercial banks, have also fallen sharply, from an estimated US$7.2 billion in December 2010 to around US$200 million in February. At the end of January, Moody's cut its rating on government debt to Ba2 from Ba1, and changed the outlook from stable to negative. Similarly, Standard and Poor's cut Egypt's long-
term foreign and local currency debt rating to BB and BB+ respectively, both with a negative outlook. Treasury bill yields have risen by some 200 basis points following the start of the unrest increasing borrowing costs. In March 2011, the CBE announced that it would keep its deposit and lending rates at the current level due to the expected slowdown in economic growth, despite the upside risk on inflation from rising international food prices. At the same time, the CBE started to issue regular repurchasing agreements in March 2011 in order to keep short-term interest rates down and inject liquidity into the interbank market. The CBE started to ease monetary policy at the beginning of 2009 as inflation began to come down, falling to 9.9% in the summer of 2009 having peaked at 23.7% in August 2008. The CBE last cut its rates in September 2009, when the overnight deposit and lending rates were reduced by 25 basis points each, to 8.25% and 9.75% respectively. The discount rate was left unchanged at 8.5%.
There has been some disruption to the banking sector, including a strike of bank employees in February which closed banks for a week. The CBE imposed restrictions on individuals' withdrawal limits (EGP 50.000) and working hours of high street branches to avert against the possibility of a bank run. No formal controls have been imposed on capital outflows but the pace of outflows has been slow as they have been scrutinized by the authorities for criminal links. Although the Egyptian banking sector has remained relatively stable, the level of non-performing loans (NPLs) has started to rise indicating that there may be difficulties ahead. The CBE extended the period needed to classify a loan as non-performing from thirty days to three months after a payment has been due.
The fiscal deficit is set to deteriorate to about 10% of GDP in FY2010-2011 from 8% in FY2009-2010. This is the result of a strong fall in revenues due to weak economic activity in the first half of 2011, as well as the impact of government stimulus measures. The cost of supporting food and fuel subsidies has also risen. The Egyptian cabinet submitted a revised budget proposal to the Supreme Council of the Armed Forces (SCAF) at the start of July, which would imply a contraction in the deficit to 8.6% of GDP in FY2011-2012.

European Commission
The EU's neighbouring economies: coping with new challenges
98
Central government debt is expected to rise to about 85% of GDP in FY2010-2011. External debt is estimated to increase slightly to 16.2% of GDP in FY2011-2012. Around 25% of government expenditure is devoted to debt service, which has increased as government bond yields have risen following the start of the unrest. Most government debt is denominated in Egyptian pounds, with short-term maturities leading to a high rollover need. In the current risk-averse environment, the government is facing increasing challenges even on the domestic market to roll over existing debt and to lengthen maturities. This led the Egyptian government to seek loans and debt relief from international creditors.
Inflation has started to rise again after falling steadily since 2008. The CPI rose to 11.5% in March 2011. Upward pressure has been generated by higher global commodity prices, the depreciation of the Egyptian pound and increases to public sector salaries. Inflation is expected to continue rising in the short-term, but depressed economic activity, including weak consumer spending, will offset some of the upward pressure. Official unemployment remained broadly stable in 2010 but has risen to an estimated 11.9% in May 2011 due to the impact of the unrest.
Policy reforms and measures
Progress on structural reforms has been partially delayed following the uprising in spring 2011 as the authorities attempt to assuage immediate demands. Several key reforms were undertaken in 2010. A new Public Private Partnership (PPP) law was introduced in 2010, primarily designed to boost investment in infrastructure through awarding PPP contracts. In 2010, the Central Bank of Egypt strengthened banking supervision by enforcing minimum capital requirements, improving the assessment of state owned banks, providing resolution to non-performing loans, and working towards introducing the Basel II framework. Continued reforms to strengthen financial intermediation and competition are necessary to boost investor confidence, bring down elevated lending rates, and support private sector development. Egypt’s rank in the World Bank’s 2012 Doing Business Report fell two places to 110th, compared to last year, mainly due to low marks for dealing with construction permits, paying taxes, and enforcing contracts.
The CBE has been taking gradual steps towards introducing an inflation targeting regime by strengthening its monetary policy framework and improving transparency. In this respect, it launched a core inflation index to supplement the CPI published by the statistical office, because the CPI basket is made up of many regulated items. The current instability in the exchange rate should not deter the CBE from the objective of inflation targeting, given Egypt's history of high and variable levels of inflation.
In 2010 proposals to restructure the pension and healthcare systems continued to advance, with the aim of improving the pension system’s sustainability and efficiency and improving the quality of health care by adopting universal healthcare insurance. These proposals, along with other major reforms, are likely to be put on hold until scheduled general elections are held in the autumn of 2011.
Social development and poverty
Official employment figures may be masking a deeper problem concerning labour market structural rigidities, as the informal economy still absorbs two thirds of entrants to the labour market and over half the population is under 24 years old. The 2010 Global Competitiveness Report(1) ranked Egypt 133rd out of 139 countries on the efficiency of its labour market, which is hindered by structural rigidities and skills shortages, the latter linked to poor education standards and low levels of vocational training. Due to Egypt's high rate of population growth, the labour market has to absorb an estimated 600,000 to 800,000 new entrants annually. Further efforts should be made to expand the private sector in order to generate greater employment opportunities.
Risks and outlook
The current account deficit may deteriorate significantly reflecting much lower tourism revenues, higher commodity prices and currency depreciation, the impact of disruptions on production on exports, and a fall in remittances following the conflict in Libya.
(1) World Economic Forum (2011).

Part IV Country analysis, Egypt
99
The Central Bank will face a monetary policy dilemma between the urge to support growth during a period of weakened economic activity and the desire to combat rising inflationary pressure and defend the exchange rate.
The consolidation of public finances has been a long-term challenge, including the need to scale down food and energy subsidies, rein in the public sector wage bill, reduce interest spending on
government debt, and expand the tax base through the introduction of a fully-fledged system of VAT. In the short term, progress may be hampered as the government attempts to meet short-term expectations. Rising spending on subsidies, an announced hike in public sector wages and a fall in tax and customs receipts from weak economic activity are likely to push the deficit higher.
Table IV.5.1:Egypt - Main economic indicators 2007 2008 2009 2010 2011
proj. Real sector Real GDP growth (% change) 7,1 7,2 4,7 5,1 1,2
GDP (Egyptian pounds, billion) 745 896 1039 1223 1207
GDP nominal (EUR, billion) 96,6 112,1 134,6 163,9 151,3
GDP nominal (USD, billion) 132,2 164,8 187,3 217,4 211,4
GDP per-capita (EUR) 3934 4217 4367 4548 4268
GDP per-capita (USD at PPP) 5508 5904 6114 6367 5975 Inflation (CPI, avg) 9,5 18,3 11,8 11,1 14,2
Inflation (eop) 8,6 20,2 9,9 10,7 13,5
Social indicators Unemployment (official rate, avg, %) 8,9 8,7 9,4 9,7 12,2 Domestic population 80,1 81,5 83,0 84,6 86,2Fiscal sector 1
General government balance (% of GDP) -7,3 -6,8 -6,6 -8,0 -10,5
General government debt (% of GDP) 101,0 85,0 80,9 81,2 92,0Monetary sector
Domestic liquidity M2D (% change) 20,2 19,1 9,4 20,2 19,0
Broad Money M2 (% change) 19,1 10,5 9,5 12,4 35,9
Credit to private sector (%) 12,3 12,6 5,1 3,8 n.a.External sector Current account balance (% GDP) 0,4 -0,8 -1,7 -2,0 -2,4
Trade balance (% GDP) -15,5 -16,2 -12,0 -10,9 -11,4
FDI (net, % GDP) 8,1 7,5 3,6 3,7 2,3
Remittances (% GDP) 4,8 5,1 4,1 4,2 n.a.External vulnerability Total external debt (% GDP) 24,8 19,8 16,9 15,9 16,0
Gross reserves (USD, billion) 28,5 34,5 31,2 35,1 25,0
Import cover of reserves (months) 5,3 6,7 7,0 7,6 5,0Financial sector
Exchange rate (LE per EUR, avg) 7,71 7,99 7,72 7,46 7,98
Exchange rate (LE per USD, avg) 5,63 5,43 5,55 5,63 6,10
Official discount rate (eop, %) 9,0 10,0 9,0 8,50 n.a.
1 Fiscal year ending June.
Sources: Central Bank Egypt, Ministry of Finance Egypt, IMF, EIU, own calculations.

6. GEORGIA
100
• In the aftermath of the double shock of the military conflict with Russia of August 2008 and the global crisis, the Georgian economy is showing strong signs of recovery.
• High inflation remains one of the main concerns.
• In line with its commitments, the country has preserved a prudent fiscal policy stance and made progress in increasing flexibility of its exchange rate.
• A limited recovery in FDI inflows is weakening Georgia's external position.
Macroeconomic and financial developments
In the aftermath of the double shock of the military conflict with Russia of August 2008 and the global crisis, the Georgian economy is showing signs of recovery. After two years of low or negative growth, the year 2010 saw a strong revival of economic activity with real GDP growing by 6.3%. Economic activity recovered due to a significant growth in exports as well as public investments. Manufacturing and construction as well as trade and services remained the largest sectors of the economy. Tourism is expected to be one of the most dynamic sectors in 2011. Real GDP growth in 2011 was at promising 5.8% in the first quarter and at 4.9% in the second quarter. Annual growth is projected to reach 5.5% in 2011. Tourism is expected to be one of the most dynamic sectors in 2011. Still, Georgia's GDP per capita in 2010 remained below its 2008 level. Georgia remains the second poorest country in the EU's Eastern Neighbourhood, after Moldova.
On the back of the strong economic recovery, the government tightened its budgetary and monetary policies. The fiscal deficit was reduced from 9.2% of GDP in 2009 to 6.6% in 2010. In 2011, the budget deficit is expected to decrease to 3.7% of GDP. The tightening of the monetary policy began in summer 2010, with the key policy interest rate
Graph IV.6.1: Georgia - GDP and production
-4
0
4
8
12
I 07 IV 07 III 08 II 09 I 10 IV 10 III 11
Sources: National Stat ist ical Office Georgia and Commission.
Annual real GDP growth
%
-35
-22
-9
5
18
31
Manufacturing production
y-o-y, %
Graph IV.6.2:Georgia - Fiscal balance, fiscal debt, current account
-25
-20
-15
-10
-5
02007 2008 2009 2010 2011 proj
Sources: IMF, Georgian aut horit ies, Commission.
Fiscal balanceCurrent account% GDP
20
30
40
50
Public debt% GDP
Graph IV.6.3: Georgia - Exchange rates
84
88
92
96
100
104
108
112
116
120
124
128
132
Jan-08 Jun-08 Dec-08 May-09 Nov-09 Apr-10 Oct-10 Mar-11 Sep-11
Sources: ECOWIN Reuters.
Dollar per georgian lari
Euro per georgian lari Index 1/1/ 08 = 100

Part IV Country analysis, Georgia
101
being moderately increased. However, while CPI inflation in 2010 was 7.1% on average, it picked up at the end of 2010 and reached 14.3% y-o-y in May 2011 due to increased international prices for food and gas. Monthly inflation came down since its peak in May, yet annual inflation for the first eight months of the year was 11.2%. In order to bring down inflation pressures, the monetary authorities gradually increased the base interest rate by cumulative 300 basis points to 8% in February 2011. Prudential requirements were also tightened, with liquidity requirements increasing in October 2010, regulatory capital requirements in January 2011 and higher reserve requirements on US Dollar-denominated liabilities in February 2011.
While the economic recovery is taking hold, the external economic situation remains vulnerable due to a large current account deficit. By weakening domestic demand, the crisis contributed to a halving of the current account deficit in 2009. However, the deficit remains very large, at 9.6% of GDP in 2010, and it is expected to widen to 10.8% of GDP in 2011. Despite a significant recovery of export volumes, trade deficit reached 22.2% of GDP in 2010 thus remaining practically unchanged in comparison to 2009. Georgia's exports continue to suffer from the trade embargo imposed by Russia in 2006. Georgia's exports to the EU countries have remained low and the possibilities offered by the GSP+ remain under-exploited. Growth in tourism revenues and remittances that amounted together to almost 14% of GDP allowed significantly to reduce the current account deficit.
As far as the financing of the current account is concerned, FDI inflows were negatively affected by the crisis and declined in 2010 in comparison to the previous year. They only reached USD 575 million (5% of GDP) thus remaining below the 2009 figure of USD 660 million (6.1% of GDP). This disappointing performance of FDI inflows reflects a low investor confidence and loss of steam in the privatisation process, as many of the most attractive state companies and assets have already been sold. FDI inflows amounted to USD 377 mn in the first half of 2011, only a marginal increase in comparison to 2010. In 2011, FDI is expected to remain subdued at around USD 700 mn. Also, for the later years, the expectations that the FDI will return to their pre-crisis rate of 12%
of GDP per year are low; rather a rate of around 6% is considered more realistic.
The National Bank of Georgia (NBG) reduced its level of interventions on the exchange market in 2009, however in 2010, due to stronger downward but then also upward exchange rate pressures on the lari, the level of market interventions somewhat increased. In early 2011, abating exchange rate pressures allowed the NBG to reduce its interventions on the foreign exchange market and to build up official reserves. By the end of 2010, official reserves were at USD 2.3 bn corresponding to 3.8 months of next year's imports. In early 2011, monetary authorities accumulated official reserves that reached USD 2.8 bn by April 2011 and remained at that level since then. A vulnerability in the balance of payments relates to a relatively high level of external debt (at 61.9% in 2010) and, in particular, a strong recent increase in external public debt. The latter increased from only around 20.9% of GDP in 2008, to around 31.4% of GDP in 2009 and reached 34.1% of GDP in 2010.
While the overall public debt situation has been under control, with an affordable public debt stock (83% of outstanding external public debt having concessional IDA terms) and low interest rate (68% of external public debt being on fixed interest rate and a portfolio average weighted interest rate of 2.04%), a significant vulnerability of Georgia's debt management related to a need for a debt roll-over in the coming years. Substantial external debt repayment obligations become due in 2013-15, with a peak in 2013 reflecting the repayment of the Eurobond of USD 500 mn issued in 2008 as well a substantial repurchases under the IMF’s Stand-By Arrangement. In order to improve the amortisation profile and reduce the bunching of debt repayments in 2013, the authorities accessed the international capital markets in early April 2011. Georgia issued a Eurobond of USD 500 mn with ten-year maturity and in parallel redeemed USD 417 mn of the existing Eurobond. This successful debt rollover was possible due to an improvement in Georgia's sovereign debt ratings which are back to their pre-crisis levels of B+.
The capacity of the authorities to tap the domestic debt market remains limited. The government re-started issuing Treasury bills in 2009, but the volume remains very small. Until 2011, Treasury

European Commission
The EU's neighbouring economies: coping with new challenges
102
bills with six-month, one-year and two-year maturity and with a coupon interest rate of 10%, 12% and 14%, respectively, were issued. By the end of 2010, the stock of domestic debt reached GEL 873 mn or USD 490 mn.
In September 2008, the IMF approved an 18-month Stand-By Arrangement for Georgia worth USD 750 mn. In August 2009 the Stand-By Arrangement and the financing package increased, bringing the total Stand-By Arrangement programme to USD 1.17 bn. The programme remained on track until its expiration in mid-June 2011; but following the seventh and the eighth programme reviews in January 2011, the authorities did not draw the instalments that amounted in total to around USD 400 mn, as the central bank deemed it unnecessary in view of a significant accumulation of foreign currency reserves in early 2011.
Policy reforms and measures
Since the 2003 Rose Revolution Georgia has made significant progress in a number of legal and regulatory reforms. The tax system has been simplified and public finance management was brought closer to international practices. Customs regime has been liberalised, while important anti-corruption measures have been taken and the regulatory business environment has substantially improved.
In 2010 the reform efforts were intensified in some areas, whereas others continued to lag behind the ambitious reform plans of the government. One policy field that has been at the heart of government's reform efforts has been public finance management. In line with the policy conditionality of the macro-financial assistance, internal and external audit reforms continued, as well as reforms in budget formulation and public procurement. In the area of budget preparation, the Budget System Law was replaced by a more comprehensive Budget Code in January 2010. To advance the introduction of the programme-based budgeting, pilot projects were implemented in six line ministries. In public procurement, the law was amended better to reflect the introduction of the e-procurement mode in December 2010. Georgia also made some progress in the area of public revenue management. A new, simplified Tax Code was approved in September 2010.
In the area of trade and of trade-related regulatory reforms, progress was rather limited. A dialogue with the EU on the preparation for the start of negotiations on a deep and comprehensive free trade area continued, but reforms in key trade-related regulatory and institutional areas, such as sanitary and phyto-sanitary measures, technical regulations etc., remained insufficient.
The Financial Supervision Agency was merged with the National Bank of Georgia in December 2009 and the National Bank was appointed the single regulator of financial sector. The Bank’s sanctioning power has been strengthened. The financial supervision has gradually moved towards a risk-based system. In the field of statistics, a new law ensuring a higher independence of the National Statistical Office entered into force in February 2010. However, financial resources of the Statistical Office remained very limited putting at risk the quality of statistical data in the country.
Georgia's company law introduced an efficient registration system for new enterprises that allows a company to register within half a day. As far as business climate is concerned, according to the World Bank's Doing Business indicators, Georgia recently improved its global ranking from 17th to 16th, in particular due to improvement in starting a business, access to credit, investor protection and paying taxes.
Social development and poverty
According to the UN Human Development Index, Georgia ranked 74th out of the 169 countries covered (with an index value of 0.698 on a scale ranging from 0 to 1). According to most recent data, despite its good performance in life expectancy at birth (at 72.0 years) and adult literacy (99.7%), the country is at the low end compared with other Eastern Neighbourhood countries: GDP per capita in purchasing power parity was at USD 5,074 in 2010, absolute poverty has been high (13.4% of Georgians live on less than USD 1.25 per day in PPP) and so has relative poverty (more than half of the population lives below the national poverty line). A high unemployment rate of around 16% is certainly one of the major causes of poverty.

Part IV Country analysis, Georgia
103
Risks and outlook
High inflation remains one of the main concerns in the macroeconomic management area. After its peak in May of 14.3%, CPI inflation came down to 7.2% in August and it is expected to stabilise further. While the main policy rate was kept stable at 8% from February to July 2011, the monetary authorities lowered it to 7.5% by August. However, the National Bank, consistent with its
medium-term inflation objective, is required to be prudent in its monetary policy choices.
Furthermore, Georgia needs to address bottlenecks in its labour markets. Active labour market policies need to be introduced to allow a larger part of the population to take advantage of post-crisis growth.
Table IV.6.1:Georgia - Main economic indicators 2007 2008 2009 2010 2011
prel. proj.Real sector Real GDP growth (domestic currency, % change) 12,3 2,3 -3,8 6,4 5,5 GDP nominal (EUR, billion) 7,4 8,7 7,8 8,8 9,9
GDP nominal (USD, billion) 10,2 12,8 10,8 11,7 13,8 GDP per capita (EUR) 1679 1987 1777 1998 2251 GDP per capita (USD) 2327 2918 2448 2655 3136 GNI per capita, USD 2.324 2881,8 2428,4 2.587 n.a. Inflation (period average) 9,2 10,0 1,7 7,1 9,5Social indicators Population (million) 4,4 4,4 4,4 4,4 4,4
Unemployment rate (ILO definition) 13,3 16,5 16,9 16,3 16,2Fiscal sector Total revenue (incl. grants) (% GDP) 29,3 30,7 29,3 28,5 27,3 Total expenditure (% GDP) 34,0 37,0 38,4 35,3 31,3 Current expenditure 25,8 28,4 30,0 26,4 23,7 General government balance (% GDP) -4,7 -6,3 -9,2 -6,6 -3,7 Public debt (% GDP) 21,5 27,6 37,3 39,5 41,1
Monetary sector Domestic credit to private sector (period end) (% GDP) n.a. 31,9 29,2 30,8 n.a. Broad money (M3) (% change) 49,7 14,3 -6,3 14,5 16,0 Degree of monetisation (M3/GDP, %) 23,7 24,1 21,6 26,3 31,2 Deposit dollarisation (period end) 65,0 64,6 73,6 71,1 70,6
External sector Current account balance (% GDP) -20,0 -22,6 -11,2 -9,6 -10,8
Trade balance (% GDP) -26,8 -29,8 -22,3 -22,2 -23,8 Exports of goods and services 31,1 28,7 29,8 35,2 36,9 Imports of goods and services 57,9 58,3 48,9 52,9 16,8 Foreign direct investment (% GDP) 16,4 12,2 6,1 5,0 5,5 Import cover of reserves (months) 2,2 3,4 1,2 3,8 4,5
External vulnerability External public sector debt, period end (% GDP) 18,0 20,9 31,4 34,1 35,1 Public external debt service ratio1 3,5 3,4 5,2 4,4 5,3 External debt, period end (% of GDP) 35,7 44 58,1 61,9 62 MLT external debt service in percent of exports 11,9 16,0 23,6 16,6 18,7 Gross reserves (USD million), period end 1361 1480 2110 2264 2800
Financial sector Monetary policy interest rate (period average) 7,7 10,6 6,3 6,1 8,0 Market rate of interest on loans (period average) 18,8 21,9 22,6 19,5 n.a. Exchange rate (lari per EUR, average) 2,3 2,2 2,3 2,4 n.a.
Exchange rate (lari per USD, average) 1,7 1,5 1,7 1,8 n.a. Real effective exchange rate (Index Dec-95=100)2 110 126 124 119 125
1 External debt service as % of exports of goods and services.2 REER is calculated as a weighted average of Real Exchange Rates of 12 main trade partner countries.
Sources: IMF, UN, Georgian authorities and Commission.

7. ISRAEL
104
• The recovery of the Israeli economy was among the strongest amongst developed countries with GDP growing by 4.7% in 2010.
• Due to its close link with the West, the economy was not affected by the political turmoil in the Arab countries. In the first semester of 2011 GDP grew by an estimated annualised 4.7%.
• Despite the positive macroeconomic performance, incidences of poverty, income disparity and low-paid jobs remain high relative to other developed economies.
Macroeconomic and financial developments
The recovery of the export-oriented Israeli economy from the global economic downturn was much faster than in the major developed economies. Output expanded by 4.7% in 2010, reflecting a strong rebound of private consumption (5.2%) and recovery in fixed investment (11.6%). The recovery encompassed most industrial sectors of the economy, leading to an expansion of the industrial output by 8.7%. This strong growth profile continued in the first quarter of 2011 with GDP growth accelerating to 6.8% and unemployment falling to 6% from 7.5% in 2009. However, the external sector subtracted from growth, despite the very good performance of exports which rose by 21%.
Average inflation decreased to 2.8% in 2010 from 3.3% in 2009. The appreciation of the exchange rate helped curb imported inflation. The main inflation drivers were rising prices for housing (+17%) and food. Excluding these factors core inflation was around 1.1%. The government took measures to alleviate the housing shortage and prevent the expansion of the real estate bubble. Among these measures were the tightening of mortgage lending criteria, reducing the taxation of capital gains on land, and setting incentives to the contractors for quicker completion of projects. Since September 2009 the Bank of Israel raised interest rates by a cumulative 275 basis points to reach 3.25% in May 2011, as inflation peaked-up to 4% in the first quarter of 2011.
Graph IV.7.1: Israel - Real sector and trade in 2010
1,8
2,6
3,5
4,3
5,1
6,0
6,8
Q4/09 Q1/10 Q2/10 Q3/10 Q4/10 Q1/11 Q2/11
Real GDP growth% y-o-y
-7,8
-3,5
0,8
5,1
9,4
13,7
18,0
Sources: CBI, CBS Israel, EIU.
Imports (cif)Exports (fob)
% y-o-y
Graph IV.7.2: Israel - Fiscal balance, public debt and current account
-5,4
-3,6
-1,8
0,0
1,8
3,6
2007 2008 2009 2010 2011(projection)
Sources: IMF and Minist ry of Finance Israel.
Fiscal balanceCurrent
account% GDP
72
73
74
75
76
77
78
79
Public dept% GDP
Graph IV.7.3:Israel - Share prices and exchange rates
88,4
98,4
108,4
118,4
128,4
138,4
148,4
158,4
168,4
178,4
188,4
198,4
208,4
Jan-09May-09
Oct-09
Feb-10Jul-10
Dec-10Apr-11
Sep-11
Sources: CBI, TASE.
Tel Aviv 100 Share Index
index 1/1/ 2009 = 100
88
94
100
106
112
118
124
EUR per Shekel USD per Shekel index 1/1/2009 = 100

Part IV Country analysis, Israel
105
In 2010 the shekel continued to appreciate (5.8% against the US Dollar and 12.7% against the EUR), supported by the strong recovery of the economy, the current account surplus and the wide interest rate differential with key developed economies. The Bank of Israel continued to intervene in the foreign exchange markets to prevent damage to exports from a fast appreciation. As a result, foreign reserves increased to USD 70 billion (EUR 52.5 billion). This policy entailed considerable sterilization costs and threatened the credibility of the free floating exchange rate regime.
The fiscal deficit narrowed to around 3.7% of GDP in 2010 from 5.1% of GDP in 2009 on the back of the economic recovery and the effective restraint of public expenditures. Being mainly the result of buoyant tax revenue—up by 7.5% in real terms—this deficit level was well below the original 2010 budget ceiling of 5.5% of GDP, and is likely to improve further in 2011 given the 7.8% increase in real terms of the tax revenues for the period January-April 2011. The yield of ten-year government bonds moved above 5% in February 2011, as a result of the spreading turmoil in the Arab Middle East and North Africa. The Ministry of Finance increased the transferability and liquidity of its bonds, including a first listing on the New York stock exchange in early 2010.
The external sector was challenged by the 15% real appreciation of the shekel against the US Dollar in 2010. The surge in imports and in the price of fuels had an impact on the trade balance which recorded a deficit of 1.5% of GDP. Nevertheless, the current account balance remained positive, even though the surplus slightly narrowed to 2.7% of GDP from 3.9% of GDP in 2009. The surge in imports continued in the first five months of 2011, with imports increasing by 30.2% and exports increasing by 14.5% year-on-year.
Israeli banks appear well-capitalised and liquid. The number of impaired loans fell while capital adequacy ratios improved in 2010. The equity and bond markets – which account for nearly half of the financing of the corporate sector – have risen above pre-crisis levels albeit with lower trading volumes. As a result, the performance of insurance and pension portfolios and solvency ratios in the non-banking sector strengthened significantly.
Israel joined the OECD in 2010 and enjoys one of the most friendly business climates in the world. However, its ranking in the World Bank Doing Business report 2012 declined slightly from position 32 in 2010 to position 34 in 2011. The main weaknesses were in areas like registering property and dealing with construction permits.
The authorities introduced a 10% reserve requirement on local banks' derivative transactions with non-residents, aiming to limit the influx of foreign currency and the resultant persistent upward pressure on the shekel. In view of the tightening of the monetary stance, this measure partly mitigates the risk that arises from a further widening interest-rate differential with key developed economies, which would fuel an even bigger inflow of short-term capital.
A series of regulatory and supervisory measures implemented in 2010 should contribute to further strengthen the stability of banks and non-bank financial institutions. Banks were required to increase core capital by at least 7.5%, while measures concerning the supervision, transparency and risk management were implemented in the non-bank sector and institutional investors. However, stress testing procedures can be further improved, as well as the supervision in the corporate bonds market. Coordination between the three regulatory bodies of the financial sector should be further enhanced, as many market operators are active in various supervisory fields.
A new Bank of Israel Law was passed in March 2010. The law established a monetary committee and administrative council within the bank, to deal specifically with monetary policy and administrative decisions.
Additional spending constraints - going beyond the two-year budget fiscal rules - have been imposed on most ministries, in order to finance higher transportation subsidies. However, the key risk of an escalation in defence spending on the back of the recent political turmoil in the region remains.
A new taxation structure for the energy sector has been submitted for Parliament's ratification. The new scheme is expected to boost the government's share of oil and gas revenue to between 52% and 62%, from around one-third at present. This development can facilitate the implementation of

European Commission
The EU's neighbouring economies: coping with new challenges
106
several policy options, like the reduction of public debt or even the establishment of a sovereign wealth fund.
Social development and poverty
Economic recovery in 2010 resulted in the drop of the unemployment rate to 6.6% the lowest unemployment rate since 2008. However, the majority of the newly-employed found jobs in the public service and only few in the business sector.
Relative to other developed economies, social policies are faced with deep socio-economic cleavages characterised by high poverty and low employment. By comparison to the OECD average, the dimensions of poverty in Israel are twice as high with regard to the incidence of poverty, while the Gini index of inequality in Israel is higher by approximately 22%. The incidence of poverty among families, persons and especially children increased in 2009 to 20.5% (+0.6 percentage points), 25% (+1.3 percentage points) and 36.3% (+2.3 percentage points) respectively.
While the poverty rate for the general Israeli population is around 10%, it is particularly high among the 20% of the population who are Arab-Israelis- whose poverty rate is around 53.5%- and among the 8% of ultra-Orthodox Jews, whose poverty rate is around 56.9%. Poverty is attributed to poor education and low labour force participation of large segments of the population, but it is also exacerbated by the high degree of earnings disparity and the incidence of low-paid jobs.
Transfer payments (including direct taxes) extricated 26.2% of persons and 13.4% of children from poverty. This effect was reduced by approximately one-half relative to 2002 (before the cutback in benefits); it is also considerably less pronounced than the average parallel effect in the OECD countries.
Risks and outlook
In the second half of 2010, Israel's decisive economy rebound was supported by strong domestic demand which appeared as the main growth driver rather than exports. The pace of growth of private consumption, coming from the
low base of the previous years and supported by low interest rates, is likely to moderate in the future. Also, with exports accounting for 40% of GDP, foreign demand will remain a crucial factor for growth in 2011 (which is likely to be maintained close to 4.7%). However, the exploitation of large natural gas reserves is expected to boost fixed investments in the medium-term.
Inflationary pressures are expected to rise to around 3.4% in 2011, supported by sustained upward trends in the housing market and increasing capacity constraints in the economy. Imported inflation is also expected to fuel prices' rise on the back of higher oil and non-oil commodity prices. Monetary policy is expected to take an expansive stance, particularly if global pricing pressures affect the domestic economy and the shekel becomes less attractive as a result of the turmoil in the Arab neighbouring countries.
Fiscal consolidation is expected to continue, in order to bring fiscal deficit to 3% of GDP in 2011 and support monetary policy in its fight against inflation. Under the two-year budget for 2011-12, the authorities are committed to ensuring fiscal discipline by establishing biannual targets on the fiscal deficit and ceilings of 2.7% per year on real expenditure growth. In this context, the public debt is expected to remain in downward path and to decline to 72.5% of GDP in 2011. The relative strength of the shekel will also help to ease servicing costs in local-currency terms, as around 80% of Israel's external debt is denominated in USD. On the other hand, a further deterioration in security situation could push up defense costs and increase public spending.
The trade deficit is expected to widen in 2011, as expenditure on fuel imports - which account for nearly one-fifth of total imports - increase on the back of higher world oil prices. However, the surplus on the current account is expected to reach a comfortable level of 1.5% of GDP, thanks to the continued strong performance in business service exports mainly on software and other high-tech-related products.

Part IV Country analysis, Israel
107
Table IV.7.1:
Israel - Main economic indicators 2007 2008 2009 2010 2011
prel. proj.Real sector Real GDP growth (domestic currency, % change) 5,3 4,2 0,8 4,7 4,7
GDP nominal (NIS, bil lion) 690 726 768 811 871 GDP nominal (EUR, billion) 123 137 142 149 160
GDP nominal (USD billion) 168,0 202,3 195,4 217,1 237,4 GDP per capita (EUR) 17052 18800 19184 19543 20717
GDP per capita (USD) 23333 27712 26405 28566 30831 Inflation (end of period) 3,4 3,8 4,0 2,8 3,4Social indicators Unemployment 7,3 6,1 7,7 6,6 6,5 Poverty rate (% of households) 20,5 20 20,5 n.a. n.a. Human development index n.a. n.a. 0,871 0,872 n.a. Life expectancy at birth, annual (years) 80,7 n.a. n.a. 81,2 n.a. Gini index (%) 39,2 n.a. n.a. 39,2 n.a. Population (million) 7,2 7,3 7,4 7,6 7,7Fiscal sector Central govt. revenues (% GDP) 33,8 31,3 28,1 28,9 29,3
Central govt. expenditures (% GDP) 34,1 33,7 33,2 32,8 32,3 Central govt. balance (% GDP) -0,3 -2,4 -5,1 -3,7 -3,0 General govt. balance (% GDP) -0,4 -2,6 -5,5 -4,3 -3,2
Total public debt (% GDP) 77,7 76,7 77,6 75,5 72,8 of which foreign currency external debt (as %) 19,0 13,9 14,4 14,7 14,1Monetary sector Domestic credit to private sector (change %) 6,7 9,2 -0,6 6,5 n.a. Broad money (M3, % change) 12,9 8 14,1 4 n.a. Narrow money (M1, % change) 15,3 14,1 50,9 13 n.a.External sector Current account balance (% GDP) 2,9 0,8 3,9 2,7 1,2
Trade balance (% GDP) -1,3 -1,4 2,4 -1,5 -0,6 Foreign direct investment (net, % GDP) 1,2 0,9 1,4 -1,2 -1,0External vulnerability Gross reserves (excl. gold, USD billion) 28,6 42,5 60,6 67,3 74,0
External debt (% GDP) 53,9 43,2 47,1 45,1 44,2Financial sector BOI policy rate (average, %) 3,90 3,70 0,80 1,62 3,00 Lending rate of bank credit (average %) 6,9 6,6 4,2 4,4 n.a. Exchange rate (local currency per USD, end of period) 3,85 3,8 3,78 3,55 3,71
Exchange rate (local currency per EUR, end of period) 5,62 5,29 5,41 4,79 4,49 NEER (period average) 3,4 11,1 -4,6 3,6 n.a. REER (period average) 1 11,4 -1,8 3,6 n.a.
Sources: IMF, Ministry of Finance of Israel, Bank of Israel, CBS, EIU.

8. JORDAN
108
• After a drop in output growth in 2009, the Jordanian economy gained momentum in 2010, but was significantly affected by the regional crisis during 2011.
• The government deficit narrowed to around 6.2% of GDP in 2010, on account of a steep fall in capital expenditures that outpaced revenues contraction. Despite the fiscal consolidation efforts of the previous year, the emergency economic measures adopted in early 2011 (about 2% of GDP) have impacted heavily on the state budget.
• Unemployment, especially among educated youth, remains at stubbornly high levels, after nearly a decade of remarkable growth in economic activity.
Macroeconomic and financial developments
The Jordanian economy gained momentum in 2010, backed by increased investment spending and external trade activity, but the recovery is set to be gradual and in line with the recovery of key regional trading partners. Real GDP growth rose to 3.1% in 2010 from 2.3% in 2009, mainly due to expanded activity in the agricultural sector and services. Private consumption continued to grow at a rate similar to that of 2009, helped by reductions in individual taxation and higher remittances but constrained by tighter government finances. While demand from major export markets remained subdued, it was offset by rising demand from Iraq. Export earnings were also boosted by strong growth in the tourism sector. Gross fixed investment grew after contracting in 2009, despite government cuts to capital expenditure as a part of a fiscal consolidation drive.
The Jordanian economy has been significantly affected by the regional crisis during 2011, notably through a reduction in tourism revenues and foreign capital inflows and through the increase in oil prices; although its relatively high dependence on trade, remittances and financial flows from the oil-exporting Gulf Cooperation Council (GCC) countries provides a partial offset. In light of these
Graph IV.8.1: Jordan - Contributions to real GDP-growth
-50,0
-40,0
-30,0
-20,0
-10,0
0,0
10,0
20,0
30,0
40,0
50,0
2007 2008 2009 2010 2011 projSource: Commision services.
%
Privateconsumption
Gov ernmentconsumption
Gross f ixedinv estment
External Balance
S tockbuilding andmeasurementerrorsReal GDP Growth
Graph IV.8.2: Jordan - Fiscal balance, public debt, current account
-18,0
-13,5
-9,0
-4,5
0,02007 2008 2009 2010 2011 proj
Sources: EIU and IMF.
Fiscal balanceCurrent
account% GDP
50,0
53,0
56,0
59,0
62,0
65,0
68,0
71,0
74,0
Public dept% GDP
Graph IV.8.3: Jordan - Share prices and exchange rates
60
70
80
90
100
110
120
130
140
150
Jan-08 Jun-08 Dec-08 May-09 Nov-09 Apr-10 Oct-10 Mar-11 Sep-11Sources: ECOWIN Reuters.
Jordan Amman Main share
Index 1/1/ 08 = 100
92
96
100
104
108
112
116
120
124
Euro perjordan dinar
USD per jordan dinar
Index 1/1/08 = 100

Part IV Country analysis, Jordan
109
developments, the Jordanian authorities foresee a real GDP growth rate of 3.5% for 2011.
Inflation rose to 5% by the end of 2010 from 2.7% in end-2009, mainly driven by the rise in imported commodity and energy prices and the decline in food and fuel subsidies. Inflation is forecast to remain at 5% on average in 2011 in light of sustained fuel and commodity price increases.
The fiscal balance improved during 2010 in response to the economic rebound and fiscal consolidation measures. The general government deficit contracted to 5.4% in 2010 from 8.5% in 2009, largely due to substantial cuts in capital expenditure that more than offset the revenues decline from the individual and corporate taxation reform implemented in January 2010 and the drop in external grants. Nevertheless, the net outstanding public debt increased to 58.7% of GDP in 2010 from 55.8% of GDP in 2009, partly on account of a surge in external public debt that reached 23.6% of GDP, as compared to 21.7% in the previous year. As opposed to the fiscal consolidation efforts of 2010, the emergency economic relief measures of early 2011, combined with the country’s gas supply problems related to the Egyptian pipeline and the reversal of government subsidies, have put new pressures on the state budget. The public deficit is projected to remain at 5.5% of GDP in 2011, despite the cost of the recent economic measures representing about 2% of the Jordanian GDP.
In the external sector, rising food and fuel prices led to deterioration of the trade balance during 2010 and expanded the current account deficit to 7% of GDP up from 5% in 2009, in spite of the rebound in tourism revenue and remittances. FDI inflows increased only marginally during 2010, but recorded a slight decline during the first months of 2011. On the back of rising fuel and commodity prices and lower tourism activity, the current account deficit is projected to widen to 7.4% of GDP in 2011, in spite of expectations for a rebound in foreign grants and exports.
The reserves position of Jordan remains comfortable after the successful first-time issuance of a USD 750 million five-year Eurobond in November 2010. International reserves reached the record level of USD 12.6 billion in end-2010 (equivalent to 11.5 months of next’s years imports
of goods and services) from USD 11.0 billion (8 months) in end-2009. However, reserves declined by more than 10% during the first five months of 2011, following the overall deterioration of the external sector of the economy.
Jordan's banking sector is in general well capitalized, with sound indicators and a relatively low rate of non-performing loans. The banking system's capital adequacy ratio is well above the Basel II 12% requirement, and recently-conducted stress tests indicate limited risk to interest rate and liquidity shocks, and limited interbank contagion. The country’s twenty-three banks, which adopted the Basel II Accord in 2008, have benefited from recent growth in the corporate sector and have limited exposure to international property and equity markets. In line with Action Plan objectives, the Jordanian central bank (CBJ) maintained its policy of strengthening banking-sector supervision; continuing with the implementation of Basel II standards, in particular risk management, as well as introducing an off-site bank monitoring information system and a private credit bureau (supervised by the CBJ) to promote bank and non-bank private credit flows. The policy interest rates were reduced 7 times between November 2008 and February 2010 in order to stimulate aggregate demand, whereas bank reserve requirements were declined 3 times by 1% each to reach 7%. However, in April 2011 the CBJ raised key interest rates in order to curb inflationary pressures.
To support private sector development, the CBJ recently issued new temporary regulations facilitating SMEs’ access to bank credit. The scheme guarantees interest rates 1% below those offered to the best clients, provided that the individual loans do not exceed 1.5 million JOD. This measure is a step forward improving Jordan’s competitiveness, which fell in 2010 according to estimations by several reports.
The regional unrest had also a negative impact on financial indicators. Moody’s and Standard & Poor downgraded Jordan's sovereign bonds in February from Baa3 to Ba2 and from BBB to BB+, respectively. The Amman stock exchange index recorded losses of almost 10% on its market value (the worst performance since September 2004) and the Jordanian dinar depreciated by 4% against the euro during the first half of 2011.

European Commission
The EU's neighbouring economies: coping with new challenges
110
Policy reforms and measures
Jordan has made remarkable progress in structural reforms and capacity-building, including strengthening the legal framework for public-private partnerships (PPP) and promoting draft regulations to lower the cost of credit information. The Jordanian government implemented a tax reform in January 2010 to reduce the level of income and corporate taxation, leading to a decline in tax revenues of about 0.5% of GDP. The emergency economic measures adopted in early 2011 included: the cancellation of the special sales tax of 6% on kerosene and diesel; the reduction in the tax on 90-octane gas from 18% and 12%; financial support to the military and civil service consumer corporations; financing of income-generating projects in underprivileged areas; pricing measures for overpriced basic food items; the waiving of requirements for recruitment in the Ministries of Education, Health and Social Development/Women’s affairs; salary increases for public sector employees, servicemen and pensioners; the decision to maintain subsidies for bread, gas cylinders, barley, fodder, water and electricity; the decision not to increase electricity tariffs in 2011; and the decision to lower by 1% the interest rate on loans of the Agricultural Credit Corporation.
The Jordanian government is continuing with a programme of Public Finance Management (PFM) reform. The concepts of result-oriented budgeting (ROB), a GFSM 2001-compliant budget classification and chart of accounts, GFMIS (Government Financial Management Information System) and an MTEF (Medium Term Expenditure Framework) for the years 2008-2010 have been introduced, as well as an amended debt law which provides for a ceiling of debt-to-GDP ratio of 60%. The MTEF includes setting a partial ceiling of expenditures for each ministry according to national priorities, through the introduction of efficient Internal Control Units, and the clear separation of Internal Control Units' functions in line ministries from the Audit Bureau's functions. Amendments to the Audit Bureau Law are currently being drafted, in order to strengthen the Audit Bureau as a Supreme Audit Institution and ensure more autonomy according to international best practice (INTOSAI).
Furthermore, a series of regulatory bodies have been created in several sectors: telecoms, energy, civil aviation and public transport. Supervision of the banking sector has also increased in response to the global financial crisis, including greater cooperation with foreign supervisory agencies and onsite inspections of overseas subsidiaries of domestic banks.
Social development and poverty
Despite the persistently strong economic growth rates of 2000-2008, the unemployment rate remains at stubbornly high levels and declined only marginally in 2010 (to 12.5% of the labour force, from 12.9% in 2009). Persistent unemployment is mainly due to a significant lack of employment opportunities in the private sector, and to labour market rigidities. Unemployment amongst graduates is particularly high at 19%. This labour market trend has been attributed to a range of factors: a long term decline in public sector employment that is not being offset by private sector employment growth; the presence of a large number of foreign workers in important industrial sectors, such as manufacturing, telecommunications and construction; a rapidly-growing population with 70% of Jordanians under the age of 30; and skills mismatches between young educated people and market demand.
The government is aiming to boost employment in SMEs by setting-up a development and employment fund, while a more sustainable reduction in youth unemployment will require increased investment in education, further labour market reforms and an improvement of the business environment.
The official poverty rate is 14.5 %. The Jordanian authorities are adopting a local development approach to poverty reduction, co-ordinated by a central committee specifically created for this purpose. A draft social security law aims to reform the pension system. It will also introduce universal social security insurance for all workers by 2011, as well as maternity and unemployment allowances.
Risks and outlook
With an urbanization rate of 78% and with 35% of the population under the age of 14, Jordan can be

Part IV Country analysis, Jordan
111
transformed into a high-wage, knowledge-based economy. However, Jordan faces serious macroeconomic vulnerabilities, stemming mainly from a persistently large current account deficit driven by a narrow export base and the dependence of the economy to the growth path of the Gulf countries. As a result of its relatively small industrial sector and lack of raw materials, Jordan has historically run large trade deficits. Although the trade deficit has generally declined over the last years, it is still substantial (it was close to 25% of GDP in 2010) and may be driven up again if international commodity prices continue to rise. In this respect, the expansion and diversification of a relatively narrow export base remains paramount.
The other main challenges of the Jordanian economy are to increase private sector activity to promote growth and raise employment. The government had targeted a gradual decrease in the deficit to 3% of GDP by 2012 within a medium-term budgetary framework (MTEF). However, the recent regional and domestic social crisis has already relaxed the fiscal stance of authorities, interrupting their efforts to place public finances on a more stable footing. The challenge for Jordan is to preserve macroeconomic stability while promoting social cohesion and putting in place structural reforms. To address the country’s increasing financing needs, authorities currently rely heavily on foreign grants, FDI inflows and the issuance of Islamic bonds.
Table IV.8.1:Jordan - Main economic indicators 2007 2008 2009 2010 2011
prel proj
Real sector Real GDP growth (% change) 8,9 7,2 2,3 3,1 3,5
Inflation (consumer prices, average, %) 5,4 14,9 -0,7 5,0 5,0
Inflation (consumer prices, end of period, %) 5,7 9,6 2,7 5,8 5,2
GDP per-capita (USD) 2881 3721 3984 4250 4569 GDP (Jordanian dinar, billion) 12,1 16,1 17,8 19,2 21,1
GDP (USD, billion) 17,0 22,7 25,1 27,2 29,7Social indicators Unemployment (recorded, average, %) 13,1 12,7 12,9 12,5 12,3
Human development index 0,8 n.a. n.a. n.a. n.a.
Population (in million) 5,9 6,1 6,3 6,4 6,5
Fiscal sector General government revenues (incl. grants, %GDP) 32,5 29,1 25,1 23,8 23,3
General government expenditures (% GDP) 38,3 34,5 33,6 29,2 28,8
General government balance, incl, grants (% GDP) -5,8 -5,4 -8,5 -5,4 -5,5 Net public debt (% GDP) 67,5 58,3 55,8 58,7 64,6
External sector
Current account balance (incl. grants, % GDP) -17,6 -9,6 -5,0 -7,0 -8,3 Trade balance (% GDP) -37,9 -31,6 -24,5 -25,1 -24,0
FDI (net, % GDP) 11,2 12,4 9,4 9,0 9,0 Remittances (% GDP) 15,1 12,1 10,7 10,7 10,0Monetary sector Broad money (% change) 10,6 17,3 9,3 9,9 n.a. Credit to private sector (% change) 15,3 14,8 0,5 7,9 n.a.External vulnerability External public debt (% GDP) 43,6 22,6 21,7 23,6 16,5
Gross reserves (USD, billion) 7,9 8,9 11,0 12,6 12,8
Import cover of reserves (months) 4,7 5,8 8,0 11,5 n.a.Financial sector Exchange rate (JOD per USD, period average) 0,7 0,7 0,7 0,7 0,7 Exchange rate (JOD per EUR, period average) 0,9 1,0 1,0 0,9 0,9
Real effective exchange rate (% change, + is apprec,) -2,5 5,5 n.a. n.a. n.a.
Sources: Ministry of Finance Jordan, IMF, World Bank, EIU and Commission

9. LEBANON
112
• Despite its resilience to the global crisis of 2008-2009, partly reflecting prudent macroeconomic challenges, the Lebanese economy has been seriously affected by the recent domestic and regional unrest, notably the conflict in Syria.
• During 2010, capital inflows increased international reserves and boosted financial services and construction. By contrast, financial flows and reserves experienced a downward trend during the first half of 2011.
• Despite the recent formation of government five months after its collapse, the economic situation remains vulnerable; especially on the fiscal side, given the exceptionally high fiscal deficit and public debt.
• Limited progress in structural reforms reflects the uncertain political situation.
Macroeconomic and financial developments
The Lebanese economy showed great resilience to the global financial crisis despite the politically uncertain environment. The main reason for this was the economy’s low dependence on international markets and the implementation of prudent banking regulations. Buoyant economic activity in construction, tourism, commerce and the financial services sector led to a growth rate of 8% in 2010 from 9% in the previous year. More recently, real GDP growth has been weakened by the domestic political instability and upheaval in the Arab countries. Tourism revenues and exports fell by 15% and 8.5% respectively during the first quarter of 2011, when the Lebanese economy is estimated to have contracted by 3-5%. GDP growth is projected to slow to around 2.5% in 2011.
Inflation pressures, stemming mainly from fuel and commodity price increases, intensified during 2010, pushing inflation up to 5% from 1.2% in 2009. Inflation is forecast to reach 6.5% on average in 2011, given the sustained price increases of energy, raw materials and food items.
Graph IV.9.1:Lebanon - GDP growth and CPI inflation
0
1
2
3
4
5
6
7
8
9
10
2007 2008 2009 2010 2011 proj
Source: I MF.
Real GDP (%, average)
0
2
4
6
8
10
12
Inflation (%, average)
Graph IV.9.2: Lebanon - Fiscal balance, public debt, current account
-11,4
-8,6
-5,7
-2,9
0,02007 2008 2009 2010 2011 proj
Sources: Minist ry of Finance Lebanon, IMF, WB and Commission.
fiscal balancecurrent account
% GDP
132
137
141
146
150
155
159
164
168
173
177
public debt% GDP
Graph IV.9.3: Lebanon - Exchange rate and stock market
70
85
100
115
130
145
Jan-08 Jun-08 Dec-08 M ay-09 Nov-09 Apr-10 Oct-10 Mar-11 Sep-11
Sources: ECOWIN Reut ers.
BLOMIndex 1/1/ 08 = 100
90
95
100
105
110
115
120
125
Euro per lebanese pound
USD per lebanese pound
Index 1/1/08 = 100

Part IV Country analysis, Lebanon
113
The government budget deficit widened to 8.7% of GDP in 2010 from 8.1% in 2009, partly on account of expansionary policies including substantial investments in electricity generation, and other government expenses that more than outweighed buoyant fiscal revenues. The fiscal deficit is projected to widen further to 10.1% of GDP in 2011-12, in light of weaker business activity that will squeeze revenues and lower spending on capital projects due to lack of political consensus. Lebanon’s public debt is exceptionally high, although it is steadily declining partly reflecting the remarkably high growth rates of the economy. Ample bank liquidity so far helped to sustain demand for government bonds, but a slowdown in deposit growth could tighten the financing constraints of the government. In 2010, public debt fell to 139% of GDP from 148% of GDP in 2009, while the external debt-to-GDP ratio went down to 160% in end-2010 (from 171% in end-2009). Despite its downward trend, Lebanon’s public debt remains among the highest in the world and almost half of it is denominated in foreign currency.
On the external sector of the economy, oil price increases and the rebound in imports led to deterioration of the current account balance (excluding foreign grants), which recorded a deficit of 11.3% of GDP in 2010, up from 9.7% in 2009. The current account deficit is expected to widen further to 16.2% of GDP in 2011-12, in light of sustained oil price increases. To limit the exposure to external shocks, the Banque du Liban retains a comfortable level of international reserves. During the last few years, abundant capital inflows have enabled the accumulation of foreign currency reserves which reached the record level of EUR 32.2 billion in 2010 (corresponding to 10.3 months of next year’s imports of goods and services), as compared to EUR 26.8 billion in 2009. Direct financial stability risks are mitigated by the current strong reserve base, substantial gains in deposits, and continued high liquidity ratios in the banking sector; factors which also boost the credibility of the currency peg. The sustainability of financial flows and diversification of assets remain important challenges, however.
Policy reform measures
On the back of Lebanon's long-lasting political stalemate, economic policymaking has been
largely undermined, leading to delays in key reforms.
During 2010 macroeconomic policies have been strong, but progress in growth-enhancing structural reforms, including raising the value added tax (VAT) rate, eliminating extra-budgetary funds, and overhauling the budget process, has been rather poor. Revising the heavily-subsidised electricity system is an urgent priority given the frequent power shortages. In addition, modernizing tax administration and public financial management, and reforming the water and telecommunications sectors remain key elements of Lebanon’s reform agenda. Privatization of the two state-owned mobile phone operators and restructuring of the heavily subsidised state-owned electricity provider, Electricité du Liban (EDL), have been put on ice reflecting ongoing uncertainty about market conditions, and are not expected before 2012. Nevertheless, a 20% cut in subsidies to EDL was achieved in 2010, due to the substitution of the provider’s imported fuel oil by Egyptian gas. A 25% stake in the national air carrier MEA, held by the central bank, was announced to be floated in 2010; thus delaying the time path for full privatisation.
Fiscal reforms, including expanding revenue collection, are necessary to reduce the large public debt stock since the costs of servicing the debt weigh heavily on the budget (above 10% of GDP in recent years). However, the adoption of fiscal consolidation measures, such as the shrinkage of the public sector or the privatization of state enterprises, hinge on an unreformed political system. The draft 2010 budget entailed an increase in capital spending of 2.4% of GDP, including substantial investments in electricity generation, but an increase in VAT rate was not feasible due to the lack of political support.
With respect to public finance management, progress with improving budgetary planning and control has been limited. This concerns measures aimed at improving budget formulation and execution, as well as plans to improve cash management and implement a single treasury account. The 2010 budget that was approved in April 2010 includes some provisions on fiscal accountability, but it does not include a multi-annual fiscal framework.

European Commission
The EU's neighbouring economies: coping with new challenges
114
In view of the large weight of the financial sector in the Lebanese economy, international agreements on actions to improve oversight and reduce systemic risk in the global financial sector will have an impact in the years to come. Against this background, the Banque du Liban and IMF agreed to have a new Financial Stability Assessment in 2010. This would be valuable to identify vulnerabilities in the Lebanese financial system and to benchmark against new standards of oversight that are being implemented internationally. The high interest rates charged by commercial banks on domestic loans reflect the high spreads against international interest rate benchmarks that support deposit and reserve inflows. Spreads also mirror high risk premia and heavy government borrowing. However, the ensuing high interest rates and conservative lending policies hinder lending to domestic industries, in particular small and medium-sized enterprises.
More generally, many impediments to a conducive business climate remain unresolved. Hence the ranking of Lebanon according to several business climate measures remained poor in comparison with regional peers, many of which made progress in recent years. It is crucial that the authorities proceed with reviving the stalled reform agenda to make growth in the country less dependant on a few industries only, such as finance, and to develop growth potential in other sectors. Despite relatively favourable macroeconomic developments in the last year, the fiscal deficit and public debt remain high, and progress with fiscal consolidation to reduce the hefty burden of public debt service remains a key priority to ensure sustainability.
Social development and poverty
The latest available figures from the Ministry of Social Affairs and the United Nations Development Program date back to 2004. It was estimated that nearly 28% of the population (approximately 1 million Lebanese) qualified as poor, with 8% (300 000 individuals) living in extreme poverty. The need for better targeted social spending is increasing in view of the rising income inequality.
Risks and outlook
Despite the overall resilience of the Lebanese economy to global headwinds in 2010, the economic situation remains vulnerable on several accounts. A weaker real GDP growth of around 5.8% is projected for the following years due to political instability, with services driving growth in the private sector. Despite the continued buoyancy in economic activity, key fiscal ratios are expected to deteriorate in the next years, driven by higher debt servicing costs. The deficit on the current account is projected to remain at around 10% of GDP. Despite the BdL’s current ability to defend the peg, substantial imbalances in the public finances and external accounts could affect the credibility of the exchange rate peg in the longer term. The economy is currently directly affected by the political and social unrest in the Arab world, given that its main trading partners are the countries of the Middle East and North Africa. Lebanon is dependent on imported hydrocarbons for almost all its energy needs, making the country particularly vulnerable to international oil price increases. Apart from political risks and the slow global upswing, economic vulnerability stems from the high public and external debt, the reliance on just a few sectors to provide the bulk of growth, uncertainty about the persistence of foreign inflows in a situation where banks continue to have maturity mismatches, and possible inflation risks also in view of rising commodity prices.

Part IV Country analysis, Lebanon
115
Table IV.9.1:
Lebanon - Main economic indicators2007 2008 2009 2010 2011
prel. proj.
Real sector Real GDP growth (market prices, % change) 7,5 8,5 9,0 8,0 2,5
Nominal GDP (in billions of U.S. dollars) 25,1 29,9 34,5 39,1 42,5
GDP per-capita (USD) 5976 7119 8214 9093 9884
Inflation (consumer price, average) 4,1 10,8 1,2 5,0 6,5
Social indicators Population (million) 4,2 4,2 4,2 4,3 4,3
Fiscal sector General government revenues, incl. grants (% GDP) 24,0 23,8 24,6 24,1 24,1
General government expenditures (% GDP) 34,9 33,4 32,7 32,8 33,7
General government balance, incl. grants (% GDP) -10,8 -9,6 -8,1 -8,7 -9,6
General government primary balance incl. grants (%GDP) 1,7 1,4 3,0 1,5 0,5
Total government debt (% GDP) 168,0 157,0 148,0 139,0 137,0
Monetary sector Broad money (% change) 1 10,9 15,5 23,2 12,0 12,0
Credit to the private sector 15,8 18,5 15,1 18,0 9,7
Interest rates, 2-year treasury bill yield (average, %) 8,7 8,6 7,6 5,8 6,3
External sector Current account balance, excl. official transfers (% GDP) -7,6 -9,7 -9,7 -11,3 -11,2
Trade balance goods and services (% GDP) -18,2 -17,9 -16,2 -15,9 -15,9
FDI (% GDP) 7,5 8,8 10,7 10,0 9,7
Import cover of reserves (months) 4,9 7,9 10,3 10,3 10,3
External vulnerability Total external debt (% GDP) 194,1 172,0 171,0 160,0 162,0
Financial sector Stock of money M1 (% change) 7,7 19,3 13,4 18,4 13,1
Stock of money M2 (% change) 12,4 14,8 19,6 12,3 10,4
Exchange rate (L£ per EUR, end-period) 2066,4 2217,8 2094,9 n.a. n.a.
Exchange rate (L£ per USD, end-period) 1507,5 1507,5 1507,5 1507,5 1507,5
Real effective exchange rate (% change, + is apprec.) -4,6 1,3 n.a. n.a. n.a.
Stock market index (end-period) 1501,8 1178,3 1565,8 1475,6 n.a.
1 Defined as currency in circulation plus resident and non-resident deposits.
Sources: Ministry of Finance Lebanon,Banque du Liban, IMF, World Bank and Commission.

10. LIBYA
116
• After strong growth in 2010 helped by a rise in oil prices and production, the Libyan economy will suffer a deep recession in 2011 as a result of the armed conflict.
• Fiscal and external balances improved in 2010, but they are likely to deteriorate significantly in 2011.
• Progress in macroeconomic policies was significant prior to the conflict, but the development of the private sector economy remains a challenge together with macro-stabilisation once the conflict ends.
Macroeconomic and financial developments
The Libyan economy is one of the least diversified economies in the world. It is highly dependant on country's oil reserves: hydrocarbons account for about 96% of export revenues, 80% of government receipts and 60% of GDP. Opposition to economic reforms by the Libyan authorities has limited foreign investment to the oil and gas sector and left the non-oil private sector underdeveloped. An exception was the privatisation of some large public stakes in the banking sector over the last few years. Given its over-dependency on hydrocarbons, Libya's fiscal and current accounts are moving in parallel with fluctuations in oil prices and oil output.
As a result of the sharp increase in oil production, overall GDP grew by around 4.2% in 2010 compared to a contraction of 2.3% in 2009 due to restrictions in oil output decided by the OPEC. Non-hydrocarbon growth also strengthened to about 7% as a result of large public expenditures. However, unemployment remained high, particularly among the country's youth.
Inflation is estimated to have picked up to about 4.5% in 2010, as higher oil revenue increased domestic liquidity and international commodity prices went up. To counter the impact of higher global food prices, the government abolished taxes and custom duties on locally-produced and imported food products as of January 2011.
Graph IV.10.1: Libya - Inflation and oil production
0,2
2,0
3,9
5,7
7,5
9,4
08Q4 09Q1 09Q2 09Q3 09Q4 10Q1 10Q2 10Q3 10Q4
Source: EIU.
Inflation % y-o-y
0,37
0,59
0,81
1,03
1,25
1,47
1,69
Oil production in m barrels per day
Graph IV.10.2: Libya - Fiscal balance, public debt and current account
-11
-4
4
12
20
28
35
2007 2008 2009 2010 2011projection
Sources: IMF, EIU.
Fiscal balanceCurrent
account% GDP
0,0
1,1
2,1
3,2
4,2
5,3
6,3
7,4
8,4
Public dept% GDP
Graph IV.10.3:Libya - Exchange rates
93
98
103
108
Jan-09 May-09 Oct-09 Feb-10 Jul-10 Dec-10 A pr-11 Sep-11
Sources: ECOWIN Reuteurs.
Euro perlibyan dinar
USD per libyan dinar
Index 1/1/09=100
Part IV Country analysis, Libya
117
The currency is pegged to the IMF’s special drawing rights (SDR) and is managed through tight official controls, which restricts monetary policy flexibility. In 2010, the Libyan dinar appreciated by around 7% against the EUR and depreciated slightly around 2% against the US Dollar. According to the IMF staff report published in February 2011, the dinar’s exchange rate was broadly aligned with fundamentals. Since the beginning of the conflict and until mid-September 2011, the dinar had weakened by around 0.3% against the EUR and by around 1.3% against the US Dollar. However, the stall in oil revenue and the freeze on the assets of the Qadhafi regime had negatively affected liquidity.
After a steep decline in 2009, the fiscal surplus is estimated to have increased to 12.9% of GDP in 2010. This was mainly the result of an increase in oil revenue following the increase in international oil prices. In 2010 compared to 2009, current expenditure increased by an estimated 19%, largely due to full explicit accounting of energy subsidies and a 15% increase in the wage bill. The prioritization of investment projects has allowed for a decrease in capital expenditure by an estimated 18%.
The current account surplus increased to an estimated 20% of GDP in 2010 from 15.6% of GDP in 2009, as a result of the increase in oil prices. However, the current account is expected to record a deficit of around 11% of GDP, as oil exports stopped in mid March 2011 and only some small quantities of around 250.000 bpd were being produced for internal consumption. As the full recovery of the oil exports could take more than a year, the timely de-freezing of Libya's foreign assets will be necessary for country's economic stabilisation.
Broad money is estimated to have grown by about 10% in 2010, roughly similar to 2009. According to the IMF, commercial bank lending to the private sector and nonfinancial public enterprises has been constrained by lack of adequate borrower documentation, tightening of regulation, and high liquidity at public enterprises. Public enterprises' demand for bank services was largely limited to letter of credits and guarantees. Financial intermediation is weak compared to neighbouring countries.
Policy reforms and measures
Economic reform in Libya has been limited as regards the diversification of the economy and the development of the private sector, with the exception of some privatisation in the banking sector. In addition, after the fighting broke out, reforms have been put on hold and their resumption will depend on the outcome of the current conflict.
In 2010 a new preliminary banking licence was issued to the Italian Bank UniCredit, while the Bahrain-based Arab Banking Corporation (which is majority Libyan-owned) purchased a 49% stake in Libya’s Mediterranean Bank. Further efforts to increase the share of the private sector in the economy appear necessary, in order to allow for an efficient allocation of production factors.
Some de-regulation of interest rates took place in 2010 and competition was encouraged. Efforts to restructure and modernize the Central Bank of Libya were underway with assistance from the IMF. A new 28-day certificate of deposit was introduced and an overnight facility was established, as steps to enhance the monetary policy framework.
However, capital, insurance and financial markets are still underdeveloped in Libya and are playing a limited role in the economy. According to the IMF, there are no markets for government or private debt, while the foreign exchange market is small. The establishment of a Single Treasury Account, still not in place, will bring about a major improvement in expenditure control and cash management. Efforts to improve economic and financial statistics should continue.
Prior to the eruption of violence in mid-February, the government had stated its intention to streamline the bureaucracy, and was in the process of laying-off 340,000 workers to the private sector to facilitate effective wage and employment policies that would address the needs of a young and growing labour force.
Ten new laws were introduced in 2010 to improve the business and investment environment, but were awaiting implementing regulations when fighting broke out. The success of the new laws would anyway require effective inter-agency coordination

European Commission
The EU's neighbouring economies: coping with new challenges
118
and open consultation with the legal and business communities, with permanent bodies to monitor and assess implementation.
While oil exploration had been successful, discoveries of new oil reserves were limited despite the award of dozens of oil exploration permits. Four companies decided in October 2009 not to renew their exploration licences for a further five years. Due to the armed conflict, foreign companies have evacuated their employees and suspended operations.
In order to counter the impact of higher global food prices, the government abolished, on 16 January 2011, taxes and custom duties on locally-produced and imported food products. Later in January 2011, the government also announced the creation of a large multi-billion dollar fund for investment and local development that would focus on providing housing for the growing population.
Social development and poverty
According to unofficial estimates, unemployment was above 20 % in 2010 - the highest rate in the Maghreb region. Libya’s workforce is dominated by the public sector, which employs around 50 % of the total labour force. The scarcity of scientific and technically-skilled staff remains a core human resource issue, while the employment problem is compounded by the high rate of population growth and the lack of private sector development.
Nevertheless, abundant oil revenues had offered the Libyan people a significantly higher standard of living compared to neighbouring countries. Thus Libya has the highest ranking in the UN Human Development Index among African countries, and the second highest GNI per capita in the European Neighbourhood Policy area (according to the World Bank Atlas Method). However, due to uneven distribution of oil benefits, certain social groups (e.g. top civil servants, military officers and politicians) enjoyed much higher living standards than average citizens. An increase in the employment rates of Libyan nationals, along with the expansion of private sector activity and the fairer distribution of the oil wealth, should be a core objective of any future government in Libya.
Risks and outlook
Given Libya's over-dependency on hydrocarbons, the economy is expected to contract sharply (by around 28%) depending on the duration of the repairs and the evolution of oil prices. Resumed activity in the hydrocarbons sector will depend heavily on the extent of the repairs needed and on the return of foreign oil workers and foreign oil companies, who have withdrawn from the country citing security concerns. It is estimated that oil-exporting activity could take more than a year to resume to the pre-conflict level. Thus foreign direct investments are expected to decline steeply in 2011. Nevertheless, the potential for the non-oil sector to grow rapidly, albeit from a low base, is large once reforms towards the strengthening of market mechanisms and privatization are accelerated.
Given that it will take at least a year until oil exports will resume in full capacity, Libya could experience a fiscal deficit of around 7% of GDP or even larger, depending on the evolution of oil prices. Capital expenditure is expected to stagnate in the short term, but when political stability returns it is expected to increase quickly to respond to the pressing needs for resumption of oil exports.
Inflation is expected to pick-up to 6.8% in 2011, mainly due to the shortages that Libya – which imports 75% of its food supplies – will face due to the armed conflict. Higher international commodity prices are also expected to fuel inflation, which will be further increased if government subsidies under any future government are sliced.
The current account is expected to record a deficit around 11% of GDP in 2011, as Libya's exports are dominated by hydrocarbons. Nevertheless, this will depend on the progress in the resumption of oil exports and on the evolution of oil prices. The deficit in services account is expected to narrow significantly as foreign oil companies have suspended their activities.

Part IV Country analysis, Libya
119
Table IV.10.1:Libya - Main economic indicators
2007 2008 2009 2010 2011
prel. proj.Real sector Real GDP growth (% change) 6,0 2,8 -2,3 4,2 -28,0
GDP (EUR, billion) 51,7 67,0 48,7 60,1 47,3
GDP (USD, billion) 73,3 95,2 68,8 79,6 55,6
GDP per capita (EUR) 8344 10628 7609 9240 7398
GDP per capita (USD) 11823 15111 10750 12246 8688
GDP (Libyan Dinars, billion) 92,6 116,5 86,2 100,3 62,5
Inflation (average, %) 6,2 10,4 2,4 4,5 6,8
Social indicators Unemployment (off. registered, average, %) n.a 17,0 20,7 20 n.a
Life expectancy at birth (years) 73,6 73,8 n.a 74,5 n.a
Adult l iteracy (% ages 15 and older) 86,2 86,8 n.a 88,4 n.a
Human development index n.a n.a n.a 0,755 n.a
Population (in millions) 6,2 6,3 6,4 6,5 6,4Fiscal sector General government revenues (% GDP) 66,0 70,1 59,3 61,0 22,0
of which: Oil - revenues (% GDP) 59,8 63,4 52,8 55,0 16,0
General government expenditures (% GDP) 37,4 39,8 52,3 48,1 29,7
Overall balance, (% GDP) 28,6 30,3 7,0 12,9 -7,3
Non - oil balance (% GDP) -31,1 -33,1 -45,9 -42,1 -12,0
General government debt (% GDP) 5,4 4,9 4,3 7,3 8,5Monetary sector Broad money (M2, % change) 37,3 47,3 11,1 10,0 n.a
Credit to the economy (% change) 6,9 7,2 3,7 2,8 n.a
Net credit to the government (% change) -60,9 -22,2 -17,7 -16,5 n.aExternal sector Current account balance (% GDP) 41,7 41,7 15,6 19,9 -11,4
Trade balance (% GDP) 43,3 43,2 21,9 28,2 -9,3
Oil exports (in USD million) 47,8 60,7 35,7 46,3 8,3
Oil exports (in % GDP) 65,2 63,8 51,9 58,2 14,9
FDI (net, % GDP) 2,0 0,8 -2,6 1,6 n.a
External vulnerability Total external debt (% GDP) 6,7 5,8 8,5 7,9 10,0
Total foreign assets (including LIA assets, in USD billion) 100,4 127,2 137,3 152,4 124,4
of which: gross official reserves (USD, billion) 79,4 92,3 98,7 105,4 71,9
In months of next year's imports 38,2 40,9 38,1 36,9 22,0
Financial sector Lending rate (average, %) 6,3 6,0 6,0 6,0 n.a
Exchange rate (LD per USD, mid FY) 1,2 1,3 1,2 1,2 n.a
Exchange rate (LD per EUR, mid FY) 1,8 1,7 1,8 1,7 n.a Real effective exchange rate (%, + is apprec.) 0,7 4,5 5,4 -0,5 n.a
Sources: IMF, EIU, EUROSTAT and Commission.

11. MOLDOVA
120
• After a severe economic downturn in 2009, the economy staged a robust recovery in 2010 and the first quarter of 2011, also supported by the IMF Stand-By Agreement and donor assistance.
• Against the background of the economic rebound, fiscal consolidation was accelerated and the budget deficit came in well below target at 2.5% of GDP in 2010.
• Policymaking continuity, the acceleration of structural reforms and improved political stability remain key challenges.
Macroeconomic and financial developments
The global crisis hit the Moldovan economy hard, as massive capital inflows during 2006-2008 enhanced macroeconomic vulnerabilities. GDP contracted by 6% in 2009, reflecting a sharp decline in domestic demand and exports. Moreover, political uncertainty due to repeated elections in 2009 delayed the policy response to the crisis including a needed fiscal adjustment. As a result, external and financial sector weaknesses pressed the country to conclude an IMF financing arrangement under the combination of the Extended Fund Facility (EFF) and the concessional Extended Credit Facility (ECF) in January 2010. The IMF package, worth approximately SDR 370 million (EUR 420 million) spread over three years, together with the European Union complementary macro-financial assistance of EUR 90 million, helped restore investor confidence and macroeconomic stability.
Against this background, the Moldovan economy staged a robust recovery. Real GDP grew by 6.9% in 2010 and accelerated further to 7.5% in the first half of 2011, driven by a rebound in private consumption and investment. Private consumption grew significantly by 9% in 2010 and accelerated to 11.4% in the first half of 2011, helped by higher remittances inflows. Government consumption rose by only 0.3% in real terms in 2010, as fiscal restraint took hold. Gross fixed capital formation rebounded strongly at a double-digit rate in both periods. On a sectoral basis the recovery was
Graph IV.11.1: Moldova - GDP and industrial production
-10
-5
0
5
10
jan-07 sep-07 maj-08 jan-09 sep-09 maj-10
Sources: ECOWIN Reut ers.
Real GDP% y-o-y
-30
-20
-10
0
10
20
30
Leading indicator
% 3mma y-o-y
Graph IV.11.2:Moldova - Fiscal balance, fiscal debt, current account
-17
-13
-9
-4
02007 2008 2009 2010
2011projection
Sources: Moldovian aut horit ies and IMF.
fiscal balancecurrent
account% GDP
21
25
29
33
37
public debt % GDP
Graph IV.11.3: Moldova - Exchange rates
85
93
100
108
115
123
130
Jan-08 Jun-08 Dec-08 May-09 Nov -09 Apr-10 Oct -10 Mar-11 Sep-11
Sources: ECOWIN Reut ers.
Euro per moldovan leu
USD per moldovan leu Index 1/1/08 = 100

Part IV Country analysis, Moldova
121
broad-based, with agriculture, industry and services all growing after contractions in 2009. Although exports rebounded strongly by 12.8%, they were outpaced by imports and external demand subtracted again from growth in 2010.
In 2010, industrial production grew by 7%, of which manufacturing advanced by 8%. Although wine output only increased by about 6%, the overall food subsector was up by 8.8%. The construction sector recovered somewhat and grew by 7.3%. Average inflation bounced back to a 7% annual growth in the CPI index in 2010; driven by the increase in domestic demand, global and local food and energy prices. Big contributors were the adjustments in domestic energy prices, and the increases in VAT and excise taxes part of the fiscal consolidation process. In August 2011, e-o-p inflation rose to 9.2% from 8.1% at the end of 2010, while core inflation stood at 4.1%. As illustrated by the first-half data, the economic recovery is set to continue in 2011 with GDP real growth projected at 6%. Strong domestic demand may lead to a widening of the current account deficit, while average inflation is likely to decline only moderately.
The authorities have focused policy on ensuring macroeconomic stability and fiscal consolidation. Fiscal policy was significantly tightened in 2010. The government succeeded to reduce the deficit to 2.5% of GDP from 6.3% in 2009. The economic recovery as well as regulatory rises in taxation contributed to an increase in revenues of 17% compared to 2009. The 2010 budget included increases in VAT on gas, and higher excise duty on tobacco products, luxury cars, alcoholic beverages and perfumes. In addition, public spending for general public services and debt servicing costs declined. The budget adopted for 2011 foresees a further reduction of the deficit to 1.9% of GDP, while public spending will return below 40% of GDP after a record 45.3% of GDP in 2009. Government debt increased moderately to 26.3% of GDP at the end of 2010.
In response to mounting inflationary pressure, the National Bank of Moldova (NBM) reversed the trend of monetary easing by raising the base lending rate twice in 2010 to 7% and to a further 10% in August 2011. It also adopted a more explicit policy of inflation targeting in 2010, with a target of 5%±1.5 percentage points for end-2012.
In 2011, the NBM increased also bank reserve requirements from 8 to 14%, expecting that domestic inflationary pressures would intensify later in 2011. In the second half of 2010 and early 2011, the leu appreciated slightly against the US Dollar (although it depreciated vs. the euro) as the external side started to improve. The NBM intervened occasionally in the market to smoothen the appreciation of the leu and replenish the official reserves, which grew by almost USD 300 million (covering about 4.5 months of imports at the end of 2010) and by another USD 280 million until September 2011. External debt increased by 2% points to 82% at the end of 2010.
The high trade deficit expanded by about 2.5% points to above 38% of GDP in 2010. The increase was, however, offset by a rise in remittances and labour income and current transfers to the government. The current account deficit rose moderately as a share of GDP from 8.6% in 2009 to 9% in 2010. It was financed by higher FDI inflows (at 3.4% of GDP), a recovery of other private inflows, particularly in the banking sector and complemented by the loan disbursements under the IMF programme and other official lending. In the first quarter of 2011 the current account deficit widened by about USD 90 million and is expected to remain slightly above 11% of GDP in 2011. External financing came mostly from private sources and included a substantial drawdown of external deposits by the banking sector, but also an increase in FDI. The banking system remains well capitalised (1), and the large amount of non-performing loans declined from 16.4% in 2009 to 9.3% as of July 2011. However, a high proportion of foreign-currency-denominated loans (43%) and deposits (46%) heighten exchange rate vulnerability. The growth rate of private credit turned positive to about 13% in 2010 and accelerated to about 15% as of July 2011 based on higher FX lending. Lending rates remain high at above 15% p.a. while the spread between lending and deposit rates increased significantly in the crisis.
Policy reforms and measures
The new Moldovan government remains committed to advance both structural reforms and its European integration agenda, but political (1) With a capital adequacy ratio at about 30% in March 2011.

European Commission
The EU's neighbouring economies: coping with new challenges
122
uncertainty has somewhat hampered progress and expectations were not always met. Its main priorities are to consolidate and increase the efficiency of public finances, to improve the business environment, and to modernize the country's institutions and infrastructure. These reforms are embedded in the Economic Stabilisation and Recovery Programme for 2009-2011, supported by multilateral and bilateral donors.
With respect to fiscal policy, the government aimed at cutting the public sector wage bill, reducing non-essential current spending, and increasing tax revenue by improving tax administration and broadening the tax base. In 2010, the government intensified the reform of public procurement and public internal financial control (PIFC), including the introduction of internal audit units and approval of core PIFC legislation. The government also introduced new legislation to improve the financial sustainability of the social insurance system. The rates of social security contributions for employers were reduced. In order to increase efficiency in the education sector, several schools will be merged.
The government has continued to take actions to create an investment- and export-friendly business environment, advance liberalization and deregulation, and prepare for further privatisations in key areas such as telecommunications, rail and air sectors. The financial sustainability of the utility sector was improved as tariffs were increased in several municipalities. A restructuring plan for the energy sector is being prepared with the World Bank and the IMF. A number of formal and informal export and import restrictions were removed in 2010. The government also simplified licensing requirements, and procedures for business registration and liquidation. The VAT regime was simplified by extending nationally the option to receive VAT refunds for purchases of investment goods effective from 2011. Business overhead costs were lowered by reducing the frequency of inspections of enterprises by state agencies and by simplifying access to digital signatures. In order to promote trade, one-stop-shop business services linked to customs administration were extended. A private credit bureau was introduced and the insolvency law was amended to grant priority to secured creditors. The enforcement of judgements was made more
efficient by introducing private bailiffs. In the first half of 2011 further legislation under "Guillotine-2" was passed in order to simplify procedures for launching business activities. Thus, Moldova improved an impressive 18 positions and came in the 81st out of 183 economies in the 2012 World Bank Doing Business Report. At the same time, the World’s Economic Forum’s Global Competitiveness Report for 2011-12 ranked Moldova the 93th out of 142 countries. It is less competitive than most countries in Eastern Europe and the former Soviet Union. Overall, the most problematic factors for the investment climate are considered to be political instability, corruption, access to finance and an inefficient public sector.
Social development and poverty
As Moldova is relatively poor, the recession affected heavily the living standards of the population. The impact was, however, alleviated by the multilateral and bilateral official financing which supported domestic demand and set the stage for the economic recovery. After having dropped by around 6% in euro terms in 2009, GDP per capita bounced back by about 12% in 2010. Still, it only reached a low level of about EUR 1,230. The ratios between the average monthly salary/income and the minimum subsistence receded in 2010, but they remain well above the 2007-2008 levels. Unemployment has continued to rise compared to 2008 and 2009, and reached about 7.4% of the labour force (ILO definition) in 2010. It increased further to 9.4% in the first quarter of 2011, but declined to 6.2% in the second quarter of the year. The activity rate was below 45% on account of the large segment of the population working abroad. Social spending thus remains a major component of public expenditure (about 70% of the 2011 budget including spending on culture). As the economic adjustment programme encompasses measures to increase utility tariffs and streamline subsidies, targeted compensations have been put in place.
Risks and outlook
As the economic recovery gained speed in 2010, growth is likely to remain robust during 2011-2012. Nonetheless, downside risks remain relative to the strength of the global economic recovery, i.e. with respect to external demand for the Moldovan exports and remittances that support the

Part IV Country analysis, Moldova
123
recent pick-up in private consumption. The surge in international food and energy prices is also inducing domestic inflationary pressures, and the central bank took several steps to alleviate them. As the robust recovery of domestic demand is supported by the IMF EFF/ECF arrangement and donors' aid, keeping the programme on track, continuing fiscal consolidation and accelerating structural reforms remain key challenges. Economic progress is also needed to reverse worker migration, which shrinks the pool of the labour force and the country's attractiveness for FDI; in particular as unemployment has not receded in line with the very good economic
performance in 2010 and the first half of 2011. Improving political stability is very important for a better perception of the business environment by foreign investors. This would imply solving the recurrent issue of electing the president and making progress with the Transnistrian settlement. Remaining bottlenecks for a higher growth potential include, among others, road infrastructure, availability of skilled workforce, export-import procedures, access to credit, and investor protection.
Table IV.11.1:
Moldova - Main economic indicators2007 2008 2009 2010 2011
prel. proj.Real sector Real GDP growth (domestic currency, % change) 3,0 7,8 -6,0 6,9 6,0
Industrial production volume (% change) -1,3 1,5 -21,1 7,0 7,0 GDP nominal (EUR, billion) 3,2 4,1 3,9 4,4 5,6
GDP per-capita (EUR) 902 1160 1097 1229 1564
Inflation (average) 12,4 12,7 0,0 7,4 7,9 Inflation (end-year) 13,3 7,3 0,4 8,1 9,5Social indicators Unemployment (ILO definition, %) 5,1 4,0 6,4 7,4 n.a.
Population (millions) 3,6 3,6 3,6 3,6 3,6
Poverty rate (% of population) n.a. n.a. n.a. n.a. n.a.Fiscal sector Total revenues (% GDP) 41,7 40,6 38,9 38,3 37,8
Total expenditures (% GDP) 42,0 41,6 45,3 40,8 39,7 General government balance (% GDP) -0,2 -1,0 -6,3 -2,5 -1,9
Gross public debt (% GDP) 26,8 21,3 24,4 26,3 25,1Monetary sector Domestic credit to the private sector (% GDP) 39,1 39,9 39,5 37,5 n.a.
Domestic credit to the private sector (% change) 51,7 20,3 -4,9 12,7 n.a. Broad money (M3, % change) 39,8 15,9 3,2 13,4 n.a.
Degree of monetisation (M3/GDP, %) 51,2 50,3 54,1 51,6 n.a.
Dollarisation in bank deposits (%) 43,3 41,1 49,3 45,6 n.a.External sector
Current account balance (% GDP) -15,2 -16,2 -8,6 -9,0 -11,2
Trade balance (% GDP) -51,9 -52,9 -35,7 38,1 -39,6
FDI (net, % GDP) 12,1 11,7 2,3 3,4 4,5 Remittances (% GDP) 33,7 31,0 22,0 23,3 n.a.External vulnerability
External public and private debt (% GDP) 75,6 67,1 80,0 82,1 n.a. External public debt (% GDP) 20,9 15,5 15,9 18,9 18,3
International reserves (USD, million) 1334 1672 1480 1718 1890Financial sector Real effective exchange rate (%, + is apprec.) 13,9 24,6 -14,6 3,7 n.a.
Exchange rate (Moldovan leu per EUR, avg) 16,5 15,2 15,5 16,4 14,8 Exchange rate (Moldovan leu per USD, avg) 12,1 10,3 11,1 12,3 11,7
Sources: authorities of Republic of Moldova, IMF, EBRD, WB, NBM, Commission services.

12. MOROCCO
124
• GDP growth decelerated in 2010 to 3.7%, from 4.9% in 2009. The slowdown was mainly on account of weaker private consumption growth while the external side of the economy started to grow again. Growth in the economy is expected to increase in 2011 partly due to greater government investment spending.
• The general government balance deteriorated to -4.3% of GDP, partly on account of increased government investment and higher subsidy spending.
• The demonstrations against the government in Spring 2011, in the context of the regional uprisings, are likely to have greater medium-to long-term effects on the economy than short-term negative impact.
• The Moroccan economy is still held back by social factors such as high levels of rural poverty and illiteracy, which need to be addressed to support growth and economic diversification. The substantial trade deficit, driven by a narrow export base, remains a significant macroeconomic vulnerability.
Impact of the regional unrest
Compared to other countries in the Maghreb region, the Moroccan economy has been less affected by social unrest. In the short term, the regional unrest could dent consumer confidence, curbing private consumption growth which is also being squeezed by higher international commodity prices. However, on the external side of the economy, tourism receipts rose in the first quarter of 2011 by over 7%, year-on-year; possibly due to a substitution effect given that neighbouring countries have been unstable. It is too early to tell if the recent terrorist attack in Marrakech will seriously damage the tourism industry going forward. There have been reports of Moroccan workers being evacuated from Libya; but not on a large enough scale to seriously affect the level of remittances, which is expected to be higher than in 2010.
Graph IV.12.1: Morocco - Output and expenditure on GDP (annual % change)
-20
-15
-10
-5
0
5
10
15
20
2007 2008 2009 2010 2011 proj.
Source : EIU.
0
1
2
3
4
5
6
Private consumptionGovernment consumptionGross fixed investmentExports of goods & servicesImports of goods & servicesReal GDP
Graph IV.12.2: Morocco - Fiscal balance, public debt, current account
-17
-15
-13-11
-9
-7-5
-3
-12
2007 2008 2009 2010 2011 proj
Source: EIU.
Fiscal balanceCurrent
account% GDP
52
56
59
63
67
Public dept% GDP
Graph IV.12.3: Morocco - Share prices and exchange rates
76
82
88
94
100
106
112
118
124
130
Nov-07Mar-08
Jun-08Sep-08
Dec-08Apr-09
Jul-09Oct-09
Jan-10Apr-10
Aug-10Nov-10
Feb-11May-11
Sources: ECOWIN Reut ers.
Morocco All Share Index
(MASI)Index 1/1/ 08 = 100
84
88
92
96
100
104
108
112
Euro per MAD Dollar per MAD Index 1/1/08 = 100

Part IV Country analysis, Morocco
125
Exported goods as a whole rose by 20% in the first quarter of 2011, mainly due to the phosphate sector, indicating that the production capacity of the export sector has not been impaired by demonstrations. Over the medium-term, government plans to consolidate public finances are likely to be put on hold to assuage further unrest. The government has increased subsidy spending on wheat, sugar and oil, in order partly to absorb higher international commodity prices, and is raising capital expenditure to improve housing and infrastructure. Moves to improve the efficiency of public expenditure, in particular regarding the sizeable wage bill, may also be deferred. Therefore, while short-term growth is being supported by fiscal policy, the government's strategy could lead to difficulties going forward as there will be less room to apply counter-cyclical fiscal policy and the economy may not reap the benefit of public sector reforms.
Macroeconomic and financial developments
The Moroccan economy grew by around 3.2% in 2010, compared to 4.9% in 2009. The slowdown was mainly on account of weak growth in the agricultural sector. Having expanded rapidly in 2009, following a bumper harvest, the sector was partially hit by flooding affecting fruit crops. Other sectors of the economy performed more strongly: the mining sector expanded rapidly, linked to external demand for phosphates, while there was also solid growth in fisheries, utilities, and tourism. The weaker performance of the agricultural sector contributed to a moderation in private consumption growth, as around 40% of the workforce are still employed in the sector, which accounts for 15% of GDP. Investment and exports started to regain momentum after sharp falls in 2009, and FDI inflows increased by an estimated 20% compared to 2009.
The current account deficit expanded to 7.1% of GDP, from 5.8% of GDP in 2009. Export earnings were boosted by strong demand for raw phosphate and phosphate-based products, with signs of further expansion in the sector. The state-controlled phosphate producer, Office Chérifien des Phosphates, is implementing a significant expansion programme aimed at raising production by 70%. Also, an agreement was reached with
Agence Française de Développement to build a slurry pipeline from the Khouribga mines to transport phosphates for export. The increase in export earnings was, however, offset by the increase in the value of imports reflecting rising commodity prices, which led to a widening of the trade deficit. Import costs for crude oil and liquefied petroleum gas increased significantly, as well as the bill for food staples such as wheat. The deterioration in the trade balance was partially compensated for by increases in remittances and tourism receipts, at 7.7% and 6.3% respectively. Over the longer term, action needs to be taken to boost the export base, as the value of exports is still only half the value of imports and are strongly concentrated in phosphate-based goods (16% of all exported goods), leaving the economy vulnerable to an external shock.
Average inflation (CPI) in 2010 was 1.4%, up from 1% in 2009. Inflation picked up slightly, mainly on account of higher food and fuel prices; although price increases were partly absorbed by the government through subsidies, shifting some of the burden onto public finances. The government suspended import duties on wheat, to counter external supply restrictions linked to droughts in Europe and the ban on wheat exports from Russia. Domestic wheat production also declined placing further pressure on prices.
Despite the slight increase in inflationary pressure, the Bank al-Maghrib (BAM) chose not to tighten monetary policy and maintained its discount rate at 3.25%. In March, the BAM also lowered reserve requirements from 8% to 6% and, in a sign of growing international confidence, Morocco was assigned investment grade status by Standard and Poor's Rating Agency in March 2010. In September, the government also issued the first government bonds on the international market for three years: EUR 1 billion in ten-year Eurobonds, which were oversubscribed and mainly purchased by European and US investors. The government indicated that international bond issues would become more frequent, as Morocco intends to increase the proportion of external debt to 25% of total public debt. Foreign reserves were also boosted by the sale of a stake in the privately- owned telecoms operator, Meditel, to France Telecom. Foreign reserves increased slightly in 2010, remaining at a comfortable level of about 6 months of imports and more than the level of

European Commission
The EU's neighbouring economies: coping with new challenges
126
external debt. The index of the Casablanca Stock Exchange (CSE) increased by 30% during 2010, but has slipped back 12% since the start of 2011 following the regional unrest.
The Moroccan Dirham gradually appreciated 6% against the US Dollar in 2010 and was stable against the euro. The central bank (BAM) sets the rate of the MDH against a currency basket dominated by the euro. The BAM continues to see the benefits of using the currency as a macroeconomic anchor and tool against inflation, while gradual steps have been taken to lessen currency controls with the aim of introducing an inflation targeting regime and fully-floating currency in the future.
Average unemployment rose in 2010 to 9.8% of workforce, from 9% in 2009, while there were signs of improvement towards the end of the year. This is nearer to the long-term average of just under 10%. Unemployment is mostly concentrated in urban areas, where the level is estimated to be 14% compared with 3.8% in rural areas. This large gap is due to a lack of employment opportunities for the young educated urban population, whilst a high level of subsistence farming supports employment in the countryside. An estimated 20% of the urban active population aged 25-34 and nearly one-third of the urban young aged 15-24 are unemployed, which is driving emigration toward Europe.
The fiscal deficit expanded in 2010 to 4.3% of GDP from 2.1% of GDP in 2009. On the revenue side, indirect taxes and customs duties rebounded after having fallen sharply in 2009; whilst at the same time, direct taxes decreased reflecting the impact of reductions in tax rates effective from January 2010. On the expenditure side, the government continued to invest strongly in infrastructure, targeting the construction of 150,000 new housing units by 2013, and there was upward price pressure on fuel and food subsidies. Spending on subsidies rose to around 2% of GDP: still well below the level in 2008 of 5% of GDP. The level of debt increased to 60% of GDP in 2010, from 57% of GDP in 2009.
Policy reforms and measures
Mindful of the need to address social unrest, the government is likely to raise public expenditure
over the medium term, in particular on housing, infrastructure, education and health. This may mean that plans for fiscal consolidation are temporarily put on hold.
The government has launched the Maroc Vert and Halieutis plans to upgrade the agriculture and fisheries industries respectively. The Halieutis programme aims to improve the management and international competitiveness of the fisheries sector, including three new fisheries centres in Tangier, Agadir and Laâyoune-Dakhla, to exploit growing external demand,. The programme aims to create 20,000 jobs in the fishing industry by 2020. The government is also aiming to increaase investment in the energy sector, in particular alternative energy sources, in order to reduce dependence on energy imports. A new ten-year tourism plan aimed at doubling tourist arrivals, Vision 2020, was also launched.
In line with the goal of modernizing the financial system, the authorities continued to implement Basel II standards; in particular on banking supervision, by strengthening the BAM's capacity in stress testing and macro-prudential analysis.
Morocco climbed 21 places in the World Bank’s 2012 Doing Business Report to 94th, making it this year’s top reformer, due to improvements in dealing with construction permits, protecting investors’ rights and paying taxes.
Social development and poverty
Social problems in Morocco remain acute, although social indicators have improved since the authorities decided to prioritise the fight against poverty. Official poverty dropped from 14% in 2005 to 9% in 2010, although its distribution is highly unequal with strong variations between urban and rural poverty (two-thirds of poor people live in rural areas). An additional 25% of the population living above the poverty line is considered economically vulnerable. Morocco ranks 114th (out of 177 countries) in the UN 2009/10 Human Development Index - the lowest of the ENP countries, which highlights its relative human underdevelopment compared to countries with similar GDP per capita.
Although the government allocates over a quarter of government expenditure to education, and

Part IV Country analysis, Morocco
127
enrolment and literacy rates are rising, adult illiteracy still affects almost 40% of the population aged over 15 years old. Only half of the rural population have access to proper healthcare and less than a fifth have access to sanitation and safe water. Morocco has one doctor per 1800 people (compared to one per 1200 in Tunisia and one per 450 in Jordan and Egypt). These statistics underline the need to develop a comprehensive social protection strategy targeted at the poor, and to continue to improve the quality and participation rates in education.
Risks and outlook
The Moroccan economy is expected to strengthen in 2011 as private consumption regains momentum and the government continues to boost investment. In terms of downside risks, further social unrest might weaken consumer confidence as well as hitting tourism revenues and potentially FDI inflows. Private consumption would also be restrained by a continuation of the recent trend of steeply rising commodity prices. Weak growth in the European Union, which is Morocco’s main export market and where an equivalent of 20% of Morocco's domestic workforce is employed, will also hamper export growth and remittances.
Table IV.12.1:
Morocco - Main economic indicators2007 2008 2009 2010 2011
proj.
Real sector Real GDP growth (% change) 2,7 5,6 4,8 3,7 4,3 GDP per capita (USD) 2407 2812 2892 3164 2926
GDP nominal, (EUR billion) 55 60 66 69 72
GDP nominal, (USD billion) 75,2 88,9 91,37 91,3 95,7
GDP per capita (EUR) 1709 1997 2053 2246 2077
GDP per capita (USD at PPP) 4076 4344 4546 4683 4844
Inflation (CPI, avg) 2,0 3,7 1,0 1,0 2,7
Social indicators Unemployment (official rate, avg, %) 9,8 9,6 9,1 9,1 9,2
Domestic population (million) 31,2 31,6 32,0 32,3 32,7
Fiscal sector Government balance (% GDP) 0,2 0,4 -2,1 -4,3 -6,2 Total government debt (% GDP) 62,6 56,8 56,9 61,7 66,9
Monetary sector Credit to the economy (% change) 29,2 23,4 12,0 10,0 n.a.
Credit to the economy/GDP (in %) 69,7 76,9 80,6 84 n.a. Broad money (Money + quasi money, % change) 16,1 10,9 8,0 8,0 n.a.
Degree of monetisation (M3/GDP, % change) 7,8 4,7 -4,9 1,0 n.a.
External sector Exports of goods (% GDP) 20,1 22,9 15,4 17,8 20,9
Imports of goods (% GDP) -39,0 -44,8 -33,3 -37,2 -42,4
Trade balance (% GDP) -18,8 -21,9 -17,9 -19,4 -21,5
Current account balance (% GDP) -0,3 -6,4 -5,9 -7,0 -8,0 FDI (net, % GDP) 2,9 2,3 0,8 2,5 n.a.
External vulnerability Total external debt (% GDP) 27,3 23,4 26,2 29,7 30,7
Gross reserves (USD billion) 24,7 22,7 23,6 24,6 23,0
Import cover of reserves (months) 6,2 7,5 6,9 6,7 6,4
Financial sector Exchange rate (MAD/EUR, average) 11,2 11,39 11,22 11,13 11,31
Exchange rate (MAD/USD, average) 8,19 7,75 8,06 8,40 8,04
Official discount rate (eop, %) 3,25 3,50 3,25 3,25 3,25
Sources: IMF, Morrocan Ministry of Finance, EIU and own calculations.

13. OCCUPIED PALESTINIAN TERRITORY
128
• The economy of the occupied Palestinian Territory continued to grow in 2010, helped by a further relaxation of restrictions on movement of goods and access to people in the West Bank, the lifting of some import controls in Gaza, and the effect of international donor aid.
• GDP rose by 9% compared to 6.8% in 2009. Fiscal performance was broadly in line with the 2010 budget. The recurrent fiscal deficit narrowed to 16% of GDP in 2010 from 26% in 2009.
• Although private sector activity picked up in 2009 in the West Bank, a sustainable economy in the Palestinian territory still hinges on the complete removal of movement and access restrictions. In real terms, GDP in the Palestinian territory is still well below the level of ten years ago.
Macroeconomic and financial developments
In 2010, GDP of the occupied Palestinian territory (oPt) rose by 9% compared to 6.8% in 2009. Growth was due to a further relaxation of restrictions on movement of goods and access to people in the West Bank, the lifting of certain import controls in Gaza, and the impact of international donor aid. Public services, construction, agriculture and external trade all expanded, while manufacturing remained subdued.
The economy of Gaza grew rapidly at the start of the year, driven by inflows of humanitarian aid as well as goods entering through tunnels at the Egyptian border. While Israel allowed some construction material to enter the region in addition to food and consumer products, restrictions still remain on many capital goods and exports, which will hamper a sustainable recovery. Growth in the West Bank was also supported by donor aid, as well as the further removal of restrictions on goods and access, and an increase in the number of Palestinians working in Israel. A large amount of donor aid continued to be channelled into small-scale infrastructure projects, including the construction and rehabilitation of
Graph IV.13.1: oPt - Fiscal balance, current account, budget support
-30
-23
-15
-8
02007 2008 2009 2010 2011 proj.
Sources: National aut horit ies, IMF.
Fiscal balanceCurrent
account excl. transfers
% GDP
15
17
20
22
24
26
29
31
33
External budget support
for recurrent budget% GDP
Graph IV.13.2: oPt - Share prices and exchange rates
40
70
100
130
Jan-08 M ay-08 Oct-08 Feb-09 Jul-09 Dec-09 Apr-10 Sep-10 Jan-11 Jun-11
SE Al Quads Index
1/1/08=100
88
94
100
106
112
118
Source: ECOWIN Reut ers.
USD per EGP, USD per LEP ,
USD per Shekelindex
1/1/08=100
roads, water networks, sewage systems, schools, clinics and residential housing.
The relaxation of restrictions on goods and access between urban areas in the West Bank helped to boost internal trade, while those restrictions with East Jerusalem were maintained. Over ten per cent of obstacles to movement of goods and persons, such as check points, were removed, leaving an estimated five hundred obstacles in place in the West Bank. The Palestinian Bureau of Statistics reported a strong rise in the number of Palestinians working in Israel, where wages are typically more than double the level in the West Bank. While

Part IV Country analysis, Occupied Palestinian Territory
129
these factors helped boost private sector activity, the economies of both the West Bank and Gaza still remain severely constrained, particularly the tradables sectors. Real GDP is more than 10% below the level of 1999 and at least 40% below in Gaza. The revival in economic activity has therefore come from a low base and is still held back by current restrictions. For example, in the West Bank, agriculture is hindered by sanctions on some raw materials, considered to pose a threat to security and lack of access to the majority of land. Consequently, while agricultural output has risen, it still only accounts for around 5.5% of GDP, compared to 13% in 1994.
In Gaza, the strong growth in 2010 was partly on account of a significant base effect, given the severe disruption to economic activity from the conflict in 2009. Construction was the main driver of growth, while agricultural and industrial sectors also expanded modestly. Despite the easing of the blockade in June 2010, imports of raw materials and capital goods are still heavily restricted, and the ban on exports continues to depress the economy. While imports rose in 2010, they are still well below the level before the siege in August 2007 and mainly consist of basic items such as foodstuffs, rather than raw materials and intermediate goods for manufacturing which are essential for a sustainable recovery. Even if the blockade is entirely lifted, substantial investment will be required to revive the region.
Inflation rose slightly during 2010 compared to 2009. This was mainly on account of a sharp rise in food prices toward the end of 2010, and occurred despite the easing of import restrictions in Gaza as well as tighter monetary policy in Israel. The FAO has estimated that 96% of staple food items are imported, in addition to other food commodities used for production; hence the economy is highly exposed to shifts in international food prices, which have returned to the levels of 2008.
In the West Bank unemployment fell to 15% of the total labour force, while in Gaza it remains at around 40%. Wages increased by an estimated 3% in West Bank, although the impact on purchasing power was offset by higher inflation and the appreciation of the shekel against the US dollar in which much income is denominated (e.g. from donor aid and remittances). Wages remained flat in
Gaza. Due to the 2009 military conflict (1) and continuing blockade of Gaza, the economy there remains almost totally reliant on government expenditure and international aid. The blockade has led to an expansion of the informal sector in Gaza, partly operating through a tunnelling system at the Egyptian border. The public sector remains an important employment provider, accounting for 14% of total employment in the West Bank and 50% in Gaza. Average wages in the private sector are around 50% higher in the West Bank than in Gaza.
Palestinian export volumes remain small and out of proportion with imports. Exports are estimated to have increased by around 8% in 2010, and imports by 6%, compared with 2009. External trade is dominated by construction and agricultural goods. The trade gap was roughly -60% of GDP in 2010, highlighting the extent of the external imbalance in the Palestinian economy and the need to urgently expand the export-oriented private sector.
Fiscal performance was broadly in line with the 2010 budget. The recurrent fiscal deficit narrowed to 16% of GDP in 2010 from 26% in 2009. However, due to lower than expected international aid, the Palestinian Authority (PA) was obliged to borrow from domestic banks and accumulate arrears on existing loans. External budget support makes up 40% of public expenditure and net lending. The PA plans progressively to consolidate public finances in order to reduce reliance on international aid and encourage private sector growth. At the same time, the PA aims to make public expenditure more effective by shifting resources away from wages and subsidies and toward investment. The draft Palestinian National Plan (PNP) for 2011-13 envisages a steady reduction in the recurrent budget deficit to about 4% of GDP by 2013.
The banking sector has been largely unaffected by the global economic crisis, due to limited exposure to global financial markets and conservative lending practices. However, the sector has built up substantial credit exposure to the PA and its to employees. This makes the sector particularly
(1) Direct losses resulting from the military conflict in Gaza
have been estimated at $1.9 billion by the Palestinian Central Bureau of Statistics.

European Commission
The EU's neighbouring economies: coping with new challenges
130
sensitive to public finances. The banking sector also continued to face an ongoing problem of excess liquidity, as Israeli banks do not accept cash deposits from banks in the West Bank. In 2010, the Palestinian Monetary Authority (PMA) continued to implement Basel II standards, including guidelines on the disclosure of financial information and regulations governing mergers.
Policy reforms and measures
The PA is committed to fiscal retrenchment and promotion of the private sector economy, while also aiming to make public expenditure more effective by shifting resources away from public sector wages and subsidies towards more efficient spending on investment. To this end, the PA has maintained strict controls on government employment and wages, and has substantially reduced utility subsidies. The management of public finances had also been strengthened: a General Accounting Department was established at the Ministry of Finance, and a new computerized accounting system links the Ministry of Finance to line ministries.
The PA has also begun a review of the efficiency and sustainability of the pension system, which will examine provisions governing the age of retirement and the statutory replacement rates.
The PMA has continued to advance reforms in preparation for carrying out the functions of a central bank. In 2010, the PMA further strengthened its supervision and regulatory framework and moved closer to the implementation of Basel II standards. A new system introduced to track bounced checks was supplemented by a centralised credit-scoring system in July 2010, which is being used to support private sector lending by Palestinian banks. In November 2010, the PMA introduced an electronic payment system to increase its payments' efficiency and reduce liquidity risk. A new law guaranteeing the independence of the PMA was drawn up and will be submitted for approval in 2011.
The PA aims to continue with structural reforms, in order to increase efficiency in the public sector, reduce dependency on international aid, and support private sector activity. In this respect, a number of important reforms are planned,
including streamlining social assistance, privatizing electricity distribution, enhancing the legal and regulatory framework for businesses, improving the sustainability of the public pension system, and implementing civil service reform.
Social development and poverty
In real terms, GDP in the Palestinian territory is still well below the level of ten years ago before the imposition of restrictions on movement and access by Israel, and the region remains mired in poverty. Real GDP is estimated to have declined by a cumulative 13 percent from 2000 up to 2008 (or 30 percent in per capita terms, given the high population growth). The overall poverty rate in the Palestinian territory is estimated to be 57%, with around 80% of people in Gaza living beneath the poverty line. Following the military conflict and continuing blockade, living standards in Gaza have fallen markedly. A report by the United Nations in November 2009 estimated that over 60% of Gaza’s population are currently food-insecure, and an additional 16% are vulnerable to food insecurity.
Risks and outlook
The growth outlook for 2011 depends crucially on the further removal by Israel of restrictions on movement and access in the West Bank and Gaza. If restrictions are gradually removed, allowing the reconstruction effort in Gaza to go ahead and trade to resume between the West Bank and Israel, real GDP growth in 2011 may accelerate.
Israel is overwhelmingly the Palestinian territory's main trading partner, with which it conducts over three quarters of external trade and through which is the only transit route for wider trade, as the Palestinian Territory has no functioning port or airport.
Therefore, the role of Israel remains vital to the expansion and diversification of the Palestinian export sector. Although private sector activity picked up in 2010 in the West Bank, a sustainable economy in the Palestinian territory still hinges on the complete removal of movement and access restrictions.

Part IV Country analysis, Occupied Palestinian Territory
131
Table IV.13.1:oPt - Main economic indicators 2007 2008 2009 2010 2011
proj.Real sector Real GDP growth (% change, 2004 market prices) -1,2 7,1 7,4 9,3 9 Nominal GDP (USD, billion) 6,108 6,158 7,395 7,395 8,45
Nominal GDP (EUR, billion) 4,46 4,19 5,30 5,57 6,17 Nominal GDP per capita (USD) 1296 1597 1565 1827 2113 Nominal GDP per capita (EUR) 1204 1102 1360 1394 1543 Inflation CPI (% average) 2,7 9,9 2,8 3,7 4,0Social indicators Unemployment rate (avg, %) 22 26 25 24 21 Domestic population 3,7 3,8 3,9 4,0 4,0Fiscal sector 1
Revenue (% GDP) 24,4 25,7 25,9 26,1 25,4 Total expenditure (% GDP) 48,2 47,2 51,8 41,6 38,2
Public sector wage bill (% GDP) 24,6 23,8 23,8 21,8 20,2 Non-wage expenditure (%GDP) 13,3 16,1 21,9 16,6 16,1 Net lending (%GDP) 10,3 7,3 6,1 3,2 1,9 Government balance before external support (% GDP) -26 -21,6 -25,9 -16 -12,8 Total external support incl. for development (% GDP) 21,6 32,4 28,5 17,3 17,4External sector2
Exports of goods and nonfactor services (% GDP) 10,3 14,4 12,5 13,1 15,4
Imports of goods and nonfactor services (% GDP) 68 67,2 67,5 65,4 68,8 Net factor income (% GDP) 14,6 9,8 9,4 7,8 7,1 Trade balance (% GDP) -57,7 -52,8 -55 -52,3 -53,4 Current account balance (% GDP, excl. off. transfers) -22,4 -23,6 -26,6 -26,2 -26,3 Official transfers (% GDP) 21,6 32,4 28,5 17,3 17,4 Current account balance (% GDP, incl. off. transfers) -0,8 8,7 1,9 -8,9 -8,9Financial sector Credit to the private sector (annual % change) -3,4 22,9 34,8 27,3 25,4
Private sector deposits (annual % change) 14 5,7 22,1 18,8 17,9 Israeli Shekel (per USD, eop) 4,11 3,6 3,75 3,8 3,7 Jordanian Dinar (per USD, eop) 0,71 0,71 0,71 0,71 0,71
1 On a commitment basis.
Source: IMF.
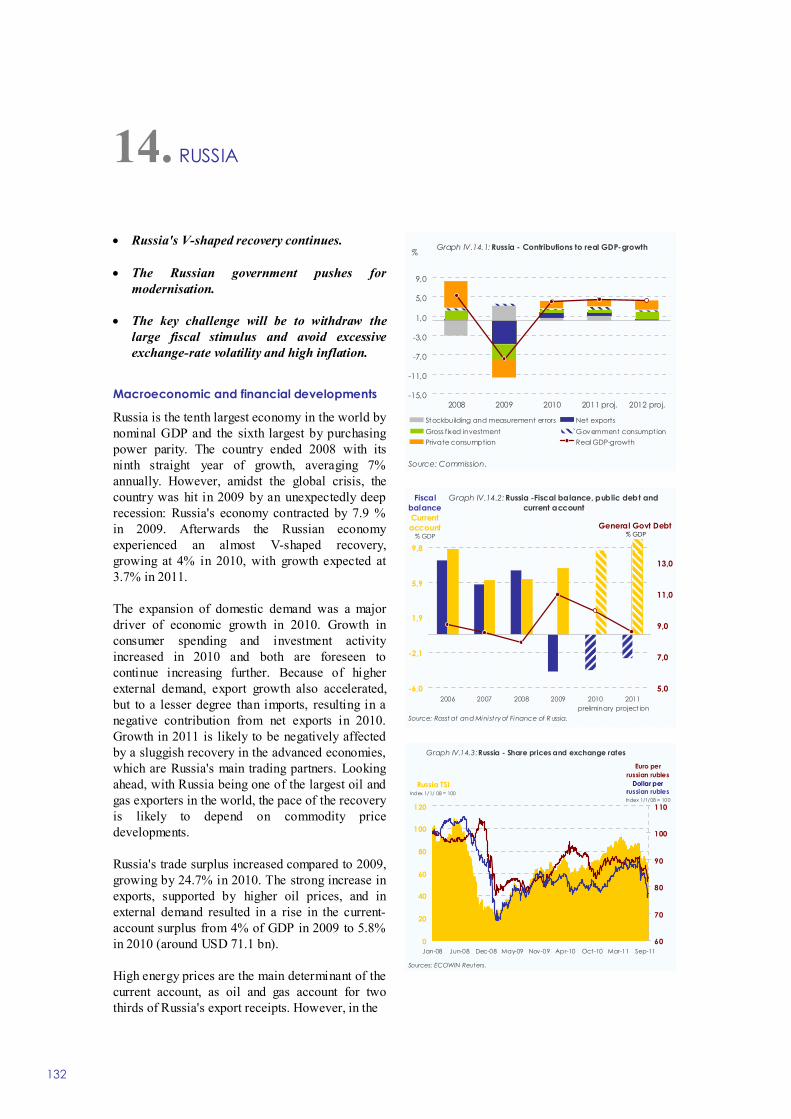
14. RUSSIA
132
• Russia's V-shaped recovery continues.
• The Russian government pushes for modernisation.
• The key challenge will be to withdraw the large fiscal stimulus and avoid excessive exchange-rate volatility and high inflation.
Macroeconomic and financial developments
Russia is the tenth largest economy in the world by nominal GDP and the sixth largest by purchasing power parity. The country ended 2008 with its ninth straight year of growth, averaging 7% annually. However, amidst the global crisis, the country was hit in 2009 by an unexpectedly deep recession: Russia's economy contracted by 7.9 % in 2009. Afterwards the Russian economy experienced an almost V-shaped recovery, growing at 4% in 2010, with growth expected at 3.7% in 2011.
The expansion of domestic demand was a major driver of economic growth in 2010. Growth in consumer spending and investment activity increased in 2010 and both are foreseen to continue increasing further. Because of higher external demand, export growth also accelerated, but to a lesser degree than imports, resulting in a negative contribution from net exports in 2010. Growth in 2011 is likely to be negatively affected by a sluggish recovery in the advanced economies, which are Russia's main trading partners. Looking ahead, with Russia being one of the largest oil and gas exporters in the world, the pace of the recovery is likely to depend on commodity price developments.
Russia's trade surplus increased compared to 2009, growing by 24.7% in 2010. The strong increase in exports, supported by higher oil prices, and in external demand resulted in a rise in the current-account surplus from 4% of GDP in 2009 to 5.8% in 2010 (around USD 71.1 bn).
High energy prices are the main determinant of the current account, as oil and gas account for two thirds of Russia's export receipts. However, in the
Graph IV.14.1: Russia - Contributions to real GDP-growth
-15,0
-11,0
-7,0
-3,0
1,0
5,0
9,0
2008 2009 2010 2011 proj. 2012 proj.
Source: Commission.
%
Stockbuilding and measurement errors Net exportsGross fixed investment Government consumpt ionPrivate consumption Real GDP-growth
Graph IV.14.2: Russia -Fiscal balance, public debt and current account
-6,0
-2,1
1,9
5,9
9,8
2006 2007 2008 2009 2010preliminary
2011project ion
Source: Rosst at and Minist ry of Finance of Russia.
Fiscal balanceCurrent account
% GDP
5,0
7,0
9,0
11,0
13,0
General Govt Debt% GDP
Graph IV.14.3:Russia - Share prices and exchange rates
0
20
40
60
80
100
120
Jan-08 Jun-08 Dec-08 May-09 Nov-09 Apr-10 Oct-10 Mar-11 Sep-11
Sources: ECOWIN Reuters.
Russia TSIIndex 1/1/ 08 = 100
60
70
80
90
100
110
Euro per russian rubles
Dollar per russian rubles Index 1/1/08 = 100

Part IV Country analysis, Russia
133
medium term, export volume growth of the oil and gas sector is limited by sluggish productivity and lack of further investments in maintenance.
A large output gap, temporarily falling food prices until July 2010, and continuous rouble appreciation have kept a lid on inflation, which fell for twelve consecutive months (from 12% in July 2009 to a post-Soviet-era low of 5.5% a year later). Inflation edged up to 8.2% in August 2011, largely driven by higher food prices, while growth in non-food prices slowed from 9.7% in 2009 to 5% in 2010 (1).
The room for manoeuvre in fiscal policy was large before the recession, and has largely been used to offset the shortfall in private demand. In 2009, the general government deficit came in at 5.9% of GDP. The budget deficit narrowed in 2010 to 4.1% of GDP, as a consequence of slightly declining government expenditures (however, still remaining at high levels), high oil prices and Russia's economic recovery.
0
100
200
300
400
500
600
700
00 01 02 03 04 05 06 07 08 09 10 11
Graph IV.14.4: Russia - Foreign-exchange reserves
bn. USD
Source: CBR
On the monetary policy side, after ten interest rate cuts in the last seven months of 2009, the CBR further reduced its refinancing rate four times in 2010, from 8.75% in February to a record-low 7.75% in June. Since then the overnight rate has been kept unchanged, and the CBR signalled that it had put an end to monetary easing. On 25 February 2011, in the light of high inflationary expectations (1) Food prices represent about 40% of the CPI basket in
Russia.
and rising oil prices, the Central Bank of Russia (CBR) increased the refinancing rate to 8%. Reserve requirements were also increased on 1 April 2011, to reach 5.5% for liabilities of credit institutions. Due to high inflationary risks, the refinancing rate was increased to 8.25% as of 3 May 2011.
Spurred by aggressive monetary easing during the first half of 2010, domestic credit to the private sector started to recover in 2010. Non-performing bank loans rose during the crisis, but appeared to have peaked in the summer and declined to 6% by the end of 2010. The Russian banking sector seems to be in a relatively sound position to manage these non-performing loans, as the average capital adequacy ratio rose from around 13% in mid-2008 to around 18% by March 2011. The recent increase in inflation has pushed real interest rates into negative territory, which may slow down the growth in bank deposits and thereby constrain bank lending.
The CBR manages the rouble against a dollar/euro basket made up of 55 cents of a dollar and 45 cents of a euro. In 2010, as the exchange rate stabilised, the CBR scaled back its intervention in currency markets and started replenishing foreign exchange reserves. In March 2011 the CBR intervened again, with monthly FX purchases still well below the levels seen in spring 2010. The rouble now lies within the central bank's range of 33.4-36.4 against the basket (2). Russia is the third-largest foreign exchange reserve holder (after China and Japan) and one of the five largest gold reserves holders. As of end-June 2011, Russia's foreign-exchange reserves reached USD 484 bn.
Policy reforms and measures
Like other countries, Russia enacted an extensive set of policy measures, including the provision of liquidity as direct support to the banking sector, a discretionary fiscal stimulus for the economy (with a very significant component of social expenditure, including pension and unemployment benefit hikes), as well as a more flexible exchange rate. Some of these measures were discontinued as the economic situation stabilised, including the auctioning of fiscal funds to banks by the Ministry
(2) The value of the bi-currency basket stood at 34.6525
roubles as of February 2011.

European Commission
The EU's neighbouring economies: coping with new challenges
134
of Finance and the provision of uncollateralised short-term funds by the CBR.
In 2010 the Russian government stepped up privatisation efforts, and approved a privatization plan for 2011-2013 which includes the top ten state-owned assets and could bring an extra 1 trillion roubles. Also, the list of strategic enterprises for which privatisation requires presidential approval has been reduced, and the government has promoted the appointment of independent directors to the boards of state-owned enterprises. However, the degree of control by the state still remains significant in Russia due to the large extent of public ownership and influence on economic activity. This depresses competition, and thereby hinders innovation and productivity growth.
Modernisation is needed in order for Russia to enhance its competitiveness in the global economy. Russia needs to diversify its economy with a view to reducing its dependence on natural resources and raw materials. A new initiative, the Partnership for Modernisation, was launched in June 2010 between the EU and Russia. For the EU, modernisation also entails in-depth governance reforms and enhancing the independence of the judiciary system and eradicating corruption. During the Partnership for Modernisation’s first year of implementation, projects have been jointly agreed upon in those areas which are not politically sensitive: expanding opportunities for investment, strengthening cooperation and exchanging best practices on energy efficiency, or identifying technical regulations for aligning Russian and EU standards. At the same time, there has been no substantial progress in those areas which are considered highly sensitive for either partner.
Risks and outlook
The economic outlook remains highly correlated to changes in oil prices, in particular as sizeable energy output growth through increased production is unlikely to materialise. At the same time, investment recovery is mild and not strong enough to meet Russia’s large investment needs to support higher potential growth. With a contribution to GDP in 2010 of around 20%, Russian investments remain well below many other emerging economies.
Regional governments had stimulated employment during the crisis (under pressure from the central government) by keeping industrial workers on the payroll. However, they may lose the ability to continue supporting the labour market in the coming years. Federal resources allocated last year to support regional governments are depleting, and there will be fewer incentives for local businesses to continue paying for an excessive supply of workers.
Under the current budget proposals for 2011-13, the federal budget deficit is set to shrink to 3.6% of GDP in 2011 and to less than 2.5% of GDP by 2013. This is in line with the Commission forecast, in which a deficit of 3.2% and 2.6% of GDP in 2011 and 2012 respectively are projected. Despite improved fiscal rules and continuous budgetary surpluses in the years preceding the crisis, the gradual pace of consolidation poses the risk that fiscal policy could become pro-cyclical. The key challenge will be to withdraw the large fiscal stimulus and avoid excessive exchange-rate volatility and high inflation. According to the Medium Term Expenditure Framework, the budget is expected to return to balance by 2015.
The Reserve Fund, which was set up to save part of the oil windfall and to reduce the vulnerability of the budget against oil-price volatility, is being depleted. As a result, 2011-12 budget deficits will increasingly be financed through issuing domestic debt.

Part IV Country analysis, Russia
135
Table IV.14.1:Russia - Main economic indicators 2006 2007 2008 2009 2010 2011
prel. proj.
Real sector Real GDP growth (domestic currency, % change) 7,7 8,1 5,6 -7,9 4,0 3,7 GDP nominal (EUR, billion) 789,1 949,4 1137,5 885,9 1105,4 1247,7 GDP nominal (USD, billion) 990,6 1285,0 1680,3 1241,1 1328,5 1554,4
GDP per-capita (EUR) 5536,3 6688,9 8044,9 6288,5 7839,8 8849,1 GDP per-capita (USD) 6961,5 9152,8 11701,0 8614,0 10437,5 13542,9 Inflation CPI (average, %) 9,7 9,0 13,7 10,5 9,0 7,8
Social indicators Unemployment (%) 7,2 6,1 6,2 8,4 7,5 n.a. Population (million) 142,5 141,9 141,4 140,9 141,0 141,0
Fiscal sector Total revenue (% GDP) 40,7 40,8 41,4 36,1 36,9 36,5 Total expenditure (% GDP) 32,4 35,3 34,2 40,3 41,0 39,2 Central government balance (% GDP) 8,3 5,6 7,1 -4,3 -4,0 -2,7
Gross public debt (% GDP) 9,0 8,5 7,8 10,9 9,9 9,2 General govt non-oil balance (% GDP)
Monetary sector Private sector credit (% change) 48,7 50,8 36,5 2,4 12,9 n.a. Private sector credit (% total credit) 143,7 158,0 170,2 132,6 113,6 n.a. Broad money (% M2) 48,4 43,5 0,8 17,7 31,1 n.a. Degree of monetisation (M2/GDP, %) 33,3 39,2 31,1 38,8 43,6 n.a.
Dollarisation in bank deposits (%) 37,6 38,7 44,0 53,9 42,3 n.a.External sector Current account balance (% GDP) 9,6 6,1 6,2 7,4 9,5 10,8
Trade balance (% GDP) 14,1 10,2 10,7 9,0 10,7 11,7 FDI (% GDP) 3,0 4,3 4,5 2,9 3,1 n.a. Import cover (months) 21,6 25,1 16,9 26,1 21,4 n.a.
External vulnerability External debt (public plus private, % GDP) 28,8 31,7 30,6 37,6 31,9 n.a. Debt service/exports (%) 0,9 1,2 1,1 1,5 1,2 n.a. Gross reserves (excl. gold, USD, billion) 295,6 466,8 411,8 416,6 443,6 n.a.
Reserves/M2 (%) 3,3 5,2 4,6 4,6 4,9 n.a.Financial sector Short-term interest rate (average, %) 3,9 5,0 5,8 9,2 6,6 n.a.
Exchange rate (rouble per EUR, end of period) 34,1 35,0 36,4 44,1 40,3 n.a. Exchange rate (rouble per USD, end of period) 27,2 25,6 24,9 31,7 30,4 n.a. Real effective exchange rate (2000=100) 163,6 172,7 184,9 169,5 185,8 n.a.
Sources: Reuters, Rosstat, CBR, BIS, IMF and Commission.

15. SYRIA
136
• Economic activity in Syria picked up slightly in 2010, with a growth rate reaching 3.2%, but this relative good performance is likely to be discontinued in 2011 following the unrest in the country.
• The economic activity has been supported by the fiscal policies adopted by the government in order to mitigate the effects of the crisis.
• The programme of reform implemented by the government in order to modernize the country will likely be put on hold in 2011, to avoid expansion of further unrest.
Macroeconomic and financial developments
Syria is faced, since March 2011, with continuous unrest after the fall of the governments of Tunisia and Egypt. The political situation is expected to have significant negative consequences for the economic activity in the coming months. This is unfortunate timing, as the latest indicators showed a recovery of the Syrian economy in 2010 with GDP growth reaching 3.2%, despite a fourth consecutive poor harvest and the stagnation in oil production. This relatively good performance was driven by strong internal demand supported by the fiscal stimulus policy. This has mostly translated into buoyant activity in the construction and the financial sectors. Exports have been boosted by the recovery in Syria's traditional economic partners. FDI had also risen significantly as Syria became more open with Western and regional states after a long period of isolation, but the near term prospects are not looking bright anymore.
Government expenditure grew by 10% in 2010 compared to the previous year, in order to stimulate internal demand and cushion the effects of the global and regional crisis. The authorities' fiscal strategy was to contain the overall budget deficit below 5% of GDP. In 2010 the raising prices of oil and the reform of the taxation system have provided additional revenues to the national budget. This situation explains how the budget deficit was reduced to 3.2% of GDP (from 8 % in 2009). The public debt position continued to deteriorate as debt grew to 22.4% of GDP in 2010
Graph IV.15.1: Syria - GDP and production
-14,0
-10,5
-7,0
-3,5
0,0
3,5
7,0
10,5
14,0
17,5
2006 2007 2008 2009 2010 2011
Source: EIU.
%, y-o-y
GDP Growth Agriculture Industry Serv ices
Graph IV.15.2:Syria - Fiscal balance, public debt and current account
-5,0
-2,5
0,0
2,5
2007 2008 2009 20102011
projection
Sources: Syrian aut horit ies, IMF and EIU.
Fiscal balanceCurrent
account% GDP
24
26
28
Public dept% GDP
Graph IV.15.3: Syria - Exchange rates
88
100
112
124
136
Jan-08 Jun-08 Dec-08 May-09 Nov-09 Apr-10 Oct-10 M ar-11 Sep-11
Sources: ECOWIN Reut ers.
Euro per syrian pound
USD per syrian pound
Index 1/1/ 08 = 100

Part IV Country analysis, Syria
137
although this situation is considered as "manageable" by national authorities.
Services balance contributed to reduce the current account deficit to 1.3 % of GDP in 2010, from 2.8% in 2009. Agriculture has been faced with four consecutive years of severe drought. The cotton harvest in 2010 was disappointing, with production down by 25%. Since 2008 Syria's industrial sector has also suffered from the falling global demand. Weaker exports, together with the opening of the Syrian market for imports, explains why Syria's trade deficit increased significantly during the last years, reaching 5.3% of GDP for 2010.
The services sector constitutes half of GDP and continues to grow. Since its opening to the private sector in 2004, the insurance market has experienced a significant growth with an increase of 14.4% in 2009 compared to 2008. The tourism industry was also expanding strongly, with more than 8 million visitors in 2010, and the number of tourists was expected to grow significantly in the coming years. However, the recent social unrest has put an end to this trend, at least for the near future.
Inflation officially rose by 4.4 % in 2010 (with a strong increase during the final quarter, especially in food prices) and is expected to surge to 8.5% in 2011 in response to soaring global commodity prices, and to the increase in consumer demand that will result from the increase of wages and tax cuts decided by the government in order to appease the protestors.
The impact of the global financial crisis on the banking system has been limited, due to its low degree of exposure to toxic loans and the prudent policy of the National Bank of Syria. Despite the implementation of a new legislation in order to modernize the financial sector and improve intermediation, the current system is still dominated by state-owned banks (holding three-quarters of total assets) and intermediation remains at a low level. As of September 2009, there were twelve private banks, including two Islamic banks. The Central Bank of Syria reduced deposit interest rates to a range of 5-7% in order to stimulate lending activity for investments, particularly from private-sector banks. The loan/deposit ratio of Syria's private banks is only 50%, giving the banks the possibility to increase substantially their
lending activity. Furthermore the average non-performing loans ratio is low. The unrest that has swept the country obliged the National Bank to an increase of 300 basis-points, in May 2011, in order to stop the heavy withdrawal of deposits from private banks. New rates have been adopted by several banks (in compliance with official instructions) who are now offering a standard 6% on deposits (up from 3%). The Damascus Stock exchange reopened in March 2009 after a closure of forty years, and rose by 75% in 2010, becoming one of the best-performing markets in the world. Later, in the first semester of 2011, the local index (Damascus Weighted Index) decreased by 35%. The national currency is pegged to the IMF'S special drawing rights since 2007 and is tightly managed by the Central bank. The authorities are unlikely to let the national currency float freely, and consider exchange rate stability as a priority. During the first semester of 2010 the relative weakness of the euro caused the Syrian Pound to depreciate against the US Dollar; although it recovered in the second semester, resulting in an estimated average exchange rate of S£ 46.4 for 1USD in 2010 but then slipped about 15% against the US Dollar since the beginning of the unrest in 2011. The foreign exchange reserves cover, at the end of 2010, was around 17 months of import, giving the authorities the possibility to control the evolution of the currency.
Policy reform measures
The transformation of Syria's centrally planned economy has been decided in the early 2000's. Real progress has been registered in the financial sector with the licensing of private banks and insurance companies. The opening of the financial sector has improved the confidence of economic operators and largely stimulated competition between banks. The sector's prospects are promising, as it appears that several private banks have largely exceeded their initial projections. Trade has also been liberalized with the signing of the Greater Arab Free Trade Area (GAFTA) and a Free Trade Agreement with Turkey. More recently, new legislation was adopted simplifying investment procedures, relaxing foreign-currency restrictions, introducing new accounting standards and streamlining the tax system in order to fight tax evasion (according to estimates, informal activity represents up to 40% of economic activity and is not registered in official statistical data). It

European Commission
The EU's neighbouring economies: coping with new challenges
138
must also be noted that Syria obtained, in May 2010, the status of observer at WTO. These reforms have helped the country to become gradually more integrated into the global economy.
The Syrian economy requires significant legislative and administrative reforms in every sector, but the political unrest that is affecting the country is likely to have a negative impact on the reform process at least in the short run. The decision to introduce VAT in 2011, which had been delayed several times, has been indefinitely suspended. The reorganisation of the public sector and state-owned firms, which are largely inefficient, has also been put on hold to avoid possible unrest against the social consequences of such a policy. Reforms are moving forward, albeit slowly, and Syria must still be classified as a state-controlled economy despite the changes of the recent years.
Social development and poverty
The growth of GDP of the period 2006-2010 resulted in an improvement in the living conditions of Syrians, mainly in the cities. Nevertheless, as of 2010, 13% of the population still lived below the poverty line with less than USD 1 per day (30 % with less than USD 2 per day). Regional discrepancies are large. Rural areas in the north-east of the country are suffering the consequences of the drought affecting the agriculture, which is the only source of revenue of these regions.
The economic reforms introduced in the country also explain the decrease of poverty, especially in urban areas, with new opportunities for private firms and the creation of better-paid jobs. Several programmes have been launched in order to reduce poverty, to strengthen social protection, to support the fight against tuberculosis and AIDS, and to enhance career guidance for young people. The result is that Syria made significant progress in several areas such as life expectancy, primary school enrolment (especially for girls), immunization rates and child mortality. Gender indicators such as women's political participation; show that conditions in Syria are better than in most of the countries of the region. In this context Syria ranks 111th out of 169 countries according to the UN's Human Poverty Index.
Nevertheless, progress made in human development must be safeguarded in the framework of the economic reform. There is a risk in the short and medium term, with the decrease of revenues coming from oil reserves, the surge of inflation and the cut in food and energy subsidies, that the most vulnerable will see their situation worsen. The high rate of unemployment, and especially youth unemployment, is a very serious concern for Syria. The impact of the strong population growth, of about 2.7% annually, has been cushioned by the government's investment in education, health services, and housing.
Risk and outlook
Since March 2011, Syria has been faced with unexpected popular protests in the context of spreading unrest against the authoritarian regimes of the region. The Baath party, which has been running the country for decades, seems unable to offer new perspectives, and the government's reaction has been a mixture of concession to appease the protestors and repression, suggesting uncertainty. The political situation will most likely have significant negative consequences for the Syrian economy. The strong increase in wages in the public sector and the reintroduction of subsidies decided by the government, equivalent to more than 15% of total annual expenditure for 2011, will have a negative impact on the state budget. For the private sector, the increase in minimum salaries will cause a strong rise in unemployment and undoubtedly inflation will surge. The closure of borders with surrounding countries, combined with the sanctions decided on by the international community in response to the repressive policy of the regime, will offset the efforts that have been made to diversify the economy and gain access to regional markets. Export revenues will rapidly decrease, affecting the trade balance. The tourism industry will indubitably be affected and remittances will also fall in the coming months, contributing to the deterioration of the country's current-account balance.
The objectives of the reform policy implemented by the government were to tackle the economic constraints of the country - the decline in oil production, high unemployment and inflation, rising budget deficits and fast population growth - by offering an attractive environment to foreign

Part IV Country analysis, Syria
139
investors (the needs of Syria are estimated at USD 50 billion over the next five years) for developing new economic sectors of activity. The likely putting on hold of the reform process, combined with deterioration in public finances in the context of strong political instability, is a clear deterrent for potential investors, particularly for those coming from outside the Gulf countries.
Table IV.15.1:Syria - Main economic indicators 2007 2008 2009 2010 2011
projReal sector Real GDP growth (% change) 4,2 5,2 2,9 3,2 0,2
GDP nominal (SYR £, billion) 2019 2355 2401 2608 2853
GDP nominal (EUR, billion) 28,7 35,9 36,4 42,4 43,5 GDP nominal (USD billion) 40,4 50,6 51,4 59,3 60,9
GDP per capita (EUR) 1400 1694 1663 1886 1952 GDP per capita (USD) 1972 2386 2343 2656 2730 Inflation (period average) 3,9 15,7 3,8 4,4 8,5Social indicators Unemployment (officially registered) 8,4 8,6 9,2 9,7 8,1
Population (annual growth rate %) 3,4 3,3 3,2 2,7 2,6 Human development index 0,742 n.a. n.a. n.a. n.a. Population (million) 20,8 21,3 21,8 22,5 23,1Fiscal sector Total revenues (% GDP) 22.7 21.4 22,1 19.3 22,6
Total expenditure (% GDP) 25.8 23.3 26,1 24.1 30,3
Central govt, Balance (% GDP) -3,1 -1,9 -8,0 -3,2 -7,7 Gross public debt (% GDP) 28,7 25,4 28,0 22,4 34,5Monetary sector Credit to private sector (% change) 20,2 25,8 18,0 20,0 n.a. Credit to private sector (% of GDP) 15,1 15,0 18,3 21,2 n.a. Broad money (M2) (% change) 9,8 19,0 13,0 13,0 7,5 Degree of monetisation (M2/GDP, %) 65,5 66,9 74,1 78,5 n.a.External sector Current account balance (% GDP) 1,1 -1,4 -2,8 -1,3 -3,4 Trade balance (% GDP) -1,3 -3,9 -5,8 -5,3 -5,7
Remittances (% of GDP) 2,1 1,7 1,5 1,3 1,8 Foreign direct investment (% GDP) 2,8 4,2 3,7 3,2 2,7 Import cover of reserves (months) 11,6 9,4 10,5 9,4 8,4External vulnerability External public debt (% GDP) 17,0 14,1 14,6 14,4 13,4
Gross reserves (USD billion) 17 17,1 17,6 17,6 17,2Financial sector
Exchange rate S£:US$ (end-period) 48,1 46,5 45,6 46,7 46,9
Lending rate 10.0 10.2 10 10 9
Real effective exchange rate (in %) 4,9 9,0 n.a. n.a. n.a.
Sources: Syrian authorities, IMF and EIU,

16. TUNISIA
140
• The recovery of the Tunisian economy from the global crisis continued in 2010 at a moderate pace.
• Since late 2010, the political crisis in the Southern Mediterranean region and the social unrest in Tunisia have had a direct negative impact on the economy.
• High unemployment, especially among young graduates, remains a challenge for the Tunisian labour market.
Macroeconomic and financial developments
The recovery of the Tunisian economy from the consequences of the global economic crisis - a recovery that started already in the second part of 2009- continued in 2010 at a moderate pace due to limited pick-up of internal demand. In 2010 real GDP growth reached 3.1%, similar to 2009 levels. The rebound in 2010 was due to external demand for manufacturing exports, in particular in the mechanical, electrical and textile industries. The performance of the agricultural sector, on the other hand, remained weak. Since December 2010 the Tunisian economy has been suffering from the consequences of a deep internal political and social crisis and the conflict in neighbouring Libya. In light of these developments, macroeconomic forecasts were downgraded, with expected real GDP growth not exceeding zero for 2011.
Consumer price inflation picked up to 4.4% in 2010 up from 3.5% in 2009, mainly due to the rising food prices and expanded credit to the economy. The Central Bank of Tunisia kept its key policy rate unchanged at 4.5% since early 2009, when it was lowered. To reduce the pressures of excess liquidity, bank reserve requirements were raised twice in 2010, in March and in May. In February 2011, inflation pressures eased to around 2.9% (y-o-y) due to the slowdown in the economic activity that accompanied the social unrest of late 2010, readjusting the expected average inflation rate for 2011 to 3.5%.
Graph IV.16.1: Tunisia - Real GDP growth and industrial production
0,0
2,0
4,0
6,0
2006 2007 2008 2009 2010 2011
Sources: EIU and Tunisian aut horit ies.
Real GDP-growth
%
90
95
100
105
110
115
120
125
130
135
140
Industrial production
index Jan '06 =100
%
Graph IV.16.2:Tunisia - Fiscal balance, public debt and current account
-8,1
-6,8
-5,5
-4,2
-2,9
-1,6
-0,3
2007 2008 2009 2010 2011 proj
Sources: IMF, WB and Tunisian aut horit ies.
Fiscal balanceCurrent
account% GDP
40,0
41,6
43,1
44,7
Public debt% GDP
Graph IV.16.3:Tunisia - Exchange rate and stock market developments
100
115
130
144
159
174
189
203
218
Jan-08 Jun-08 Dec-08 May-09 Nov-09 Apr-10 Oct-10 Mar-11 Sep-11
Sources: ECOWIN Reuteurs.
Tun Stock Exchange Index
Index 1/1/08 = 100
79
86
93
100
107
Euro pertunisian dinar
Dollar per tunisian dinar Index 1/1/08 = 100

Part IV Country analysis, Tunisia
141
In response to the subdued growth prospects and increasing social demands, the government continued in 2010 the implementation of its fiscal stimulus package; focusing mainly on increasing public investment in infrastructure, education, energy and health, but also on supporting some critical economic sectors, such as tourism. Furthermore, to support the exporting companies, the state took over part of their social security contributions and export insurance payments. Following the expansionary fiscal policies pursued in 2010, the general government fiscal deficit increased marginally to 3.1% of GDP. Public debt retained its decreasing trend and declined further to 40.4% of GDP in 2010, from 42.8% of GDP in 2009. External debt decreased marginally to 48.6%, from 49.4% in 2009. Recent expansionary fiscal policies (costing 2% of GDP), including the reversal of subsidies in the phase of rising food and fuel prices, have put significant pressures on the 2011 state budget. In light of these developments, and given the reduction of revenues as a result of decelerating growth, the general government deficit is expected to widen to 4.1% of GDP in 2011 when the public and external debt will almost reach 42% and 50% of GDP respectively.
On the external side, the country's position deteriorated in 2010 reflecting several factors. The strong growth rate in exports, especially in the first quarter of the year, was outstripped by an even stronger growth rate in imports of capital goods and intermediate products, leading to an expansion of the trade deficit. Furthermore, receipts from the tourist industry and remittances declined by 7.5% and 4.5% respectively. As a result, the current account deficit widened to 4.8% of GDP in 2010 from 2.8% of GDP in 2009. The external position of the economy further deteriorated in 2011 due to constrained external financing, related to the political and financial uncertainty. Tourism revenues declined dramatically by 50% during the first four months of the year, and remittances recorded a sharp drop following the repatriation of thousands of Tunisian workers from Libya. The rise in oil and cereal prices worsened the trade balance, despite the depreciation of the dinar that boosted Tunisian exports, thereby contributing to an overall worsening of the current account deficit estimated at 5.7% of GDP in 2011.
International reserves showed a downward trend in the course of 2010, that gathered momentum in early 2011 following the outbreak of the political crisis and the deterioration of the balance of payments. International reserves fell to USD 9.5 billion in end-2010 (corresponding to 5 months of next year’s imports of goods and services) from USD 10.6 billion in end-2009 (6.7 months of imports) and are projected to decline further to USD 9.0 billion by the end of 2011; partly on account of a 20% foreseen decline in FDI inflows and tighter bank liquidity constraints.
The exchange rate regime is classified as stabilized management, de facto targeting a real effective exchange rate in line with economic fundamentals. Exchange rate pressures, were relatively limited during 2010, but intensified somewhat in early 2011. The Tunisian dinar (TND) was on a sharp depreciating trend vis-à-vis the US Dollar for the first half of 2010 but appreciated in the second half of the year, whereas the TND/EUR exchange rate was relatively stable during 2010. The Tunisian currency depreciated by 3.5% against the euro by the end of June 2011, compared to the exchange rate at the outbreak of the crisis, thus benefiting exports, whose performance was remarkably good during the first half of the year.
Tunisian banks benefited from a healthy growth in deposits during 2010, and remained profitable overall partly due to limited reliance on external financing. Credit to the economy continued to expand during 2010 and financial soundness indicators continued to improve. However, since the beginning of 2011, bank liquidity constraints have generally become tight given the exceptionally low deposits and loan repayment ratios. To increase liquidity and support domestic growth, and against the background of shrinking inflation (3.1% in May 2011 against 4.8% in May 2010), the Tunisian Central Bank reduced the Bank reserves requirements from 5% to 3% in June and its interest rate from 4.5% to 3.5% in September 2011.
The domestic and regional unrest has also had a significant negative impact on the Tunisian stock exchange, as reflected in the permanent losses of the Tunis stock market index (15% on TUNINDEX market value 6 months after the outbreak of the crisis). The financial market was further affected by the downgrading of Tunisia’s

European Commission
The EU's neighbouring economies: coping with new challenges
142
sovereign debt ratings in January 2011 and the widening of bonds spreads.
Policy reform measures
Tunisia has made significant progress over the last two decades in promoting reforms that strengthen the competitiveness of the economy, enhance trade openness and supporting business environment. A continuation of reforms seems necessary. The dialogue on liberalising trade in services, agricultural and maritime products between Tunisia and the EU has continued, albeit slowly. In the meanwhile, to limit trade dependence on the EU, Tunisia has signed a trade agreement with the West African Economic and Monetary Union (WAEMU) and is negotiating trade agreements with the Central African Economic and Monetary Community (CAEMC) and other countries in Africa and the MENA region.
The fiscal stimulus measures introduced in 2009 helped the economic activity rebound witnessed during 2010. Additional measures were also taken to modernize the financial sector and enhance supervision of credit institutions, although the level of non-performing bank loans is still high. Furthermore, there is still room for improvement in deepening the foreign exchange market and increasing the effectiveness of monetary policy transmission.
Despite the overall progress in structural reforms, the recent labour market policy reforms have so far failed to address the serious imbalance between the actual skills of graduates and the demand for skills in the economy, and remaining labour market rigidities. As a result, unemployment, especially among the educated youth, remains persistently high and further efforts for job creation are needed. On the other hand, given the relatively high tax burden on the corporate sector and the high rates of customs duties, additional measures are needed for enhancing competitiveness, diversifying exports and providing additional protection for investors.
The social crisis of late 2010 and the deteriorating labour market conditions encouraged the promotion of a large fiscal stimulus of about 2% of GDP, including: a) around EUR 250 mn for supporting the most vulnerable population; b) EUR 0.9 bn of additional public investment planned at
the regional level; and c) rescheduling of tax payment obligations of enterprises worth of EUR 360 mn. Further to the recovery plan, measures for regional development, financial sector stabilisation (together with the Central Bank of Tunisia) and the establishment of the regulatory framework for micro-finance are envisaged.
Social development and poverty
When medium-term developmental trends are considered, Tunisia offers a mixed picture. Its GDP per capita has steadily increased over the last two decades at a rate of 3.4% per year and life expectancy at birth is relatively high, reaching 74.3 years in 2010. The UN measure of extreme poverty, the Human Poverty Index, has also shown some improvement since the mid-2000s: the percentage of people who are vulnerable to death at an early age and lack access to basic economic provisions such as nutrition and clean water decreased from 17.9% to 15.6%, while only 3.8% of the population is classified below the poverty line (2005 estimate). On the other hand, according to the UN Human Development Index (HDI) - a central international measure of wellbeing - Tunisia's position deteriorated from 0.780 in 2009 to 0.683 in 2010, placing the country at the 81st out of 169 countries and areas.
Unemployment, especially among young university graduates, remains a key structural weakness of the Tunisian economy. Labour market rigidities are backed by a strong demographic growth (1% per year), an even stronger growth rate of the abundant labour force (1.8% per year) and the low female participation in the labour force. In 2010, official unemployment reverted to its steady level of 14%, after falling to 13.3% in 2009. Emigration to OECD countries has been an important way to reduce the pressures on the Tunisian labour market. Adult illiteracy has been decreasing but still remains high, amounting to 16.6% of total population in 2010.
These factors have contributed to the escalation of socio-economic pressures in late 2010-early 2011 that gave rise to a wave of social unrest. In 2011, the labour market situation is expected to further worsen. While fewer new jobs will be created, the tourism sector that currently employs more than 350,000 people is expected to experience an important labour shedding. On the other hand,

Part IV Country analysis, Tunisia
143
under the currently-pursued fiscal plan, 20,000 jobs would be created in the public sector by the end of 2011.
Risks and outlook
Although economic activity has shown some signs of recovery during the third semester of 2011 given the rebound in tourism, non-manufacturing industries, agricultural production and exports, the main challenges of the Tunisian economy raised in the short-term are related, inter alia, to the rising external financing pressures, the loss of the momentum of economy, increased unemployment
and the decline in domestic demand. Additional risks stem from the loss in investor confidence, the growing rate of non-performing bank loans (NPLs) and the economic and social pressures exerted on the state budget.
The challenge for the economy is to preserve macroeconomic stability in order to contain public finances, inflation and current accounts, while promoting social cohesion and putting in place structural reforms.
Table IV.16.1:Tunisia - Main economic indicators 2007 2008 2009 2010 2011
prel. proj.Real sector Real GDP growth (domestic currency, % change) 6,3 4,5 3,1 3,1 0,0 GDP nominal (USD, billion) 38,9 44,9 43,5 44,3 48,9
GDP per capita (USD) 3486 4346 4171 4125 4195 Inflation (period average) 3,4 4,9 3,5 4,4 3,5Social indicators Unemployment (recorded, average, %) 14,1 14,2 13,3 14,0 14,1 Population (million) 10,2 10,3 10,4 10,5 10,7 Human Poverty Index (HPI-1, %) 15,6 n.a. n.a. n.a. n.a. Inequality (Gini index consumption/ income) 40,8 n.a. n.a. n.a. n.a. Life expectancy at birth (years) 74,2 74,3 74,5 n.a. n.a.
Human development index 0,769 0,774 0,78 n.a. n.a.Fiscal sector General government revenue, excl. grants (% GDP) 27,4 29,6 29,0 29,5 30,4 Total expenditure and net lending (% GDP) 30,2 30,3 31,6 32,6 34,5 General government balance (% GDP) -2,8 -0,7 -2,6 -3,1 -4,1 Total public debt (% GDP) 45,9 43,3 42,8 40,4 41,7
Monetary sector Credit to the economy, % change 9,8 14,0 10,3 11,3 n.a. Broad money (% change)1
12,5 14,4 13,0 10,6 6,5 Velocity of circulation (GDP/M3, deposit money banks) 1,62 1,52 1,5 1,45 n.a. Interest rate (money market rate, %, e-o-p) 5,1 4,9 4,1 4,05 n.a.External sector Current account balance (excl. grants, % of GDP) -2,4 -3,8 -2,8 -4,8 -5,7 Trade balance (% GDP) -7,4 -8,9 -8,5 -10,9 -10,4 Foreign direct investment (% GDP) 4,0 5,7 3,3 3,3 3,9
Import cover of reserves (months) 5,0 4,4 6,7 6,0 5,0 Terms of trade (- deterioration) -2 0,8 8 -4,1 1,3External vulnerability Total gross external debt (% of GDP) 51,8 45,9 49,4 48,6 49,5 Debt service ratio2 13,2 8,6 11,9 10,7 11,6 Gross reserves (USD billion, e-o-p) 7,9 9,0 10,6 9,5 9,0 Exchange rate (hryvnia per EUR, average) 1,75 1,8 1,88 n.a. n.a.
Exchange rate (hryvnia per USD, average) 1,28 1,23 1,35 n.a. n.a. Real effective exchange rate (percentage change) -2,8 -0,9 n.a. n.a. n.a.
1Broad money (M5) is defined to include nonresident deposits2 Public external debt service as % of exports of goods and services.
Sources: IMF,WB, Tunisian authorities and Commission.

17. UKRAINE
144
• Following the sharp crisis-related contraction in 2009, Ukraine’s economy entered a phase of recovery in 2010 with a return to economic growth, lower inflation, a stabilisation of the hryvnia and a narrowing of the public deficit.
• However, the rebound in investment has remained timid despite a favourable base effect, raising some doubts about the medium-term sustainability of the recovery.
• While the government has implemented some structural reforms, concerns over the operating environment for businesses still abound, in particular regarding red tape and a lack of transparency in dealings with the administration.
Macroeconomic and financial developments
Ukraine was among the EU neighbourhood countries hardest hit by the global economic crisis. From late 2008 it suffered a parallel balance-of-payments and banking crisis, and output contracted by nearly 15% in 2009. In 2010 Ukraine’s economic fortunes improved in parallel with the rebound in much of the rest of the world, and in the wake of a stabilisation in the domestic political situation following the presidential election early in the year and the subsequent formation of a majority government.
The Ukrainian recovery was initially export-led, but spread to domestic demand over the course of 2010. Official labour market figures reflect this upturn: unemployment (ILO methodology) declined from 9.6% in 2009 to 8.8% in 2010, while the number of jobs rose slightly (0.4%). As a consequence of an improved economic and labour market situation, household consumption, rising by 7.0% in real terms, turned into the mainstay of economic growth in 2010, which came to 4.2%.
Economic indicators for the first months of 2011 point to a continuation of the recovery. However, there are some preliminary signs that its composition has moved further towards consumption, away from productive investment
Graph IV.17.1: Ukraine - GDP and production
-40
-30
-20
-10
0
10
20
2008 2009 2010 2011
Source: Stat e Stat ist ics Committ ee of Ukraine.
-20
-15
-10
-5
0
5
10
Real GDP (y/y % change)Industrial production volume (y/y % change)
Graph IV.17.2: Ukraine - Fiscal balance, public debt, current account (% GDP)
-10-9-8-7-6-5-4-3-2-10
2007 2008 2009 2010 2011f
Sources: IMF, NBU.
05101520253035404550
General government balance (inc. Naftogaz)Current account balanceGeneral government debt (right-hand scale)
Graph IV.17.3: Ukraine - Share prices and exchange rates
0
20
40
60
80
100
120
Jan-0
8
Jun-08
Dec-08
May-0
9
Nov-09
Apr-10
Oct-10
Mar-1
1
Sep-1
1
Sources: Ecowin Reut ers.
405060708090100110120130
PFTS Stock MarketIndex:
1/1/2008=100
Euro per Ukrainian hryvnia
USD per Ukrainian hryvniaIndex:
1/1/2008=100

Part IV Country analysis, Ukraine
145
and net exports. For example, industrial production growth reached 8.5% y-o-y in January-May 2011, compared with an expansion of 10.8% in 2010 as a whole. While exports registered a strong 19.0% year-on-year expansion in real terms in the first quarter of 2011, they were far outstripped by imports, which grew more than twice as fast (39.3%). The surge in imports appears in line with rising consumption expenditure (consumer spending returned to double-digit growth of 12.7% y-o-y in the first quarter of 2011 for the first time since before the crisis). By contrast, investment spending, having recovered only timidly in 2010 (4.9% – despite a favourable base effect stemming from a stark crisis-related contraction of 50.5% in 2009), has remained lacklustre, with growth of just 4.5% in the first three months of 2011.
This hesitant recovery in investment may in part reflect severe problems in the operating environment for companies, along with persistent difficulties with access to financing. Loans by domestic banks to non-financial companies barely increased in real terms in 2010, as the Ukrainian banking system continued to grapple with a non-performing loan ratio in excess of 15% and posted a consolidated net loss of UAH 13.0 billion. Bank recapitalisation and resolution remain on the agenda following the crisis-related nationalisation of three banks in 2009 (a fourth bank was put into receivership under an administrator appointed by the NBU). Indeed, an NBU audit in late 2010 revealed that these banks required further substantial injections of state resources; so the authorities presented a plan to create a “bad bank”, which would make the failed banks viable again by taking over their non-performing assets.
Encouragingly, the NBU managed to control inflation relatively well by historical standards in 2010. Following three years of double-digit increases in consumer prices, average headline inflation in 2010 came to 9.4%. Core inflation was even slightly lower at 8.6%, as part of the headline price pressure stemmed from increases in excise taxes and administered prices, notably for gas and communal heating services, in line with the IMF programme (see below). In 2011 consumer price inflation first benefited from a favourable base effect, but then returned to double digits, partly on the back of a rise in international food and energy prices. It is forecasted to reach 9.3% for the year average.
In its fiscal policy, Ukraine also broadly followed the consolidation course agreed with the IMF. At just over 5% of GDP, the general government deficit was even lower than the programme target of 5.5% in 2010, although this positive development was offset by the higher-than-mandated deficit of state-owned Naftogaz, which occurred despite the gas price hikes implemented under the programme. General government debt stood at approximately 41% of GDP, a notable deceleration after the steep increases seen during the crisis years 2008 and 2009.
On the external front, the positive adjustment of the current account that had resulted from the crisis-related contraction of imports during 2009 continued through the first half of 2010, before starting to reverse as domestic demand picked up. The current account slipped back into deficit in Q3 2010, i.e. even before the start of the heating season that traditionally entails higher gas imports for Ukraine.
Positively, the country was able to tap various sources of external financing. Notably, this included a return to capital markets with USD 5.25 billion of sovereign Eurobonds issued between September 2010 and June 2011. Some Ukrainian corporates and sub-national public entities also succeeded in raising funds on international markets again. Furthermore, the central government secured a USD 2 billion revolving loan from a Russian state-owned bank in June 2010 and, most importantly, a new Stand-by Arrangement (SBA) with the IMF in July 2010, worth USD 15 billion and running to end-2012 (following the stalling of the preceding SBA in November 2009 over Ukraine’s lack of compliance with agreed programme parameters). Meanwhile, negotiations between Ukraine and the EU on a macro-financial assistance loan of EUR 610 million were launched in 2010, but have yet to be concluded.
The combination of multilateral, bilateral and private external borrowing by the government, along with a gradual return of external lending to private borrowers in Ukraine, allowed the NBU to replenish its foreign exchange reserves from a low of USD 24.1 billion in early 2010 to USD 37.8 billion at end-June 2011, while keeping the hryvnia broadly stable against the US Dollar, which de facto continues to serve as the anchor for the NBU’s monetary policy.

European Commission
The EU's neighbouring economies: coping with new challenges
146
Policy reforms and measures
The Ukrainian government launched a number of structural reforms in 2010. As part of the IMF programme, Ukraine passed a pension entitlement reform in July 2011. Furthermore, Ukraine committed vis-à-vis the IMF to a reorientation of monetary policy towards domestic price stability as the primary objective, even if the resulting gradual relaxation of the de facto exchange rate peg to the US Dollar has not yet become apparent. Finally, changes in the NBU law demanded by the IMF strengthened the central bank’s independence (a reform also contained in the EU-Ukraine Association Agenda).
In a separate development monitored closely both by the IMF and the EU, the Ukrainian government reduced the arrears on VAT refunds to companies that had existed for many years and swollen to unprecedented levels during the crisis. However, the government-issued VAT bonds, with which this reduction was achieved, were controversial in the business community, as companies felt compelled to sign up despite a coupon inferior to market yields. There were also complaints about preferential treatment of companies with close ties to the authorities, while other enterprises reported that part of their VAT refund claims were not recognised and remained unpaid. Moreover, contrary to the government’s claim that it has addressed the VAT refund problems in a durable manner, a renewed build-up of arrears has been reported by companies since late 2010. In part reflecting these problems with VAT refunds, Ukraine ranks a poor third-from-the-bottom in terms of the payment of taxes in the World Bank’s Doing Business study (181st out of 183 countries surveyed). The controversy about the VAT bond scheme was part of a general picture of growing concern on the part of businesses about the operating and investment environment in Ukraine in the final part of 2010, in particular regarding red tape and a lack of transparency in dealings with the administration. Ukraine's overall ranking in above-mentioned Doing Business report is last among all EU neighbours (152nd), reflecting in particular problems in the areas of property and business registration and dealing with construction permits.
Other key pieces of legislation in the government’s economic reform agenda have been laws on public procurement and the functioning of the gas market
(providing notably for the unbundling of Naftogaz and the end of its domestic monopoly), as well as a new Tax Code and Budget Code, on the basis of which the authorities drew up a 2011 budget in line with the consolidation benchmarks agreed with the IMF. However, in many areas, there are problems or delays with the implementation and enforcement of new laws, which can therefore not unfold their desired impact on the business climate. For example, this has been the case for the public procurement law, as well as the Tax Code, while many businesses also still complain about arbitrary customs valuation procedures, despite WTO-compliant legislation.
Social development and poverty
According to the UN Human Development Index (which includes health and education indicators alongside per capita income), Ukraine is ranked 69th out of the 169 countries covered (with an index value of 0.71 on a scale ranging from 0 to 1) and has reached a high level of human development. The country is in the middle range compared with other CIS countries: GNI per capita in purchasing power parity was just over USD 6,000 in 2009 (having exceeded USD 7,000 prior to the crisis), life expectancy at birth stands at 68.3 years, adult literacy is 99.7%, and absolute poverty is low (only 2% of the Ukrainian population lives on less than USD 2 per day – the official World Bank measure).
Notwithstanding these indicators, Ukraine’s economy was hit hard by the collapse of the Soviet system: following the demise of many of the Soviet-era industries in the 1990s, today’s per capita income is still around 25% lower than in 1990. As in other Eastern European countries, the early transition experience of deteriorating living conditions might explain the fast pace at which the population has been shrinking in Ukraine. Over the past decade, it declined by 0.7% per year.
Risks and outlook
Overall, 2010 was a successful year for Ukraine in terms of domestic economic stabilisation and the return to international creditworthiness. However, the lack of a convincing rebound in investment, the apparent return to unbalanced growth that is overly reliant on consumption, along with persistent problems in the operating environment for

Part IV Country analysis, Ukraine
147
businesses, call into question the medium-term sustainability of the recovery. With inflation remaining higher than in the main trading partners, the current account deficit widening again and
large debt roll-over requirements looming, the country may continue to depend on official
external financial support if it is to avoid a recurrence of a drain on its foreign currency reserves, as happened during the crisis in 2008-09.
Table IV.17.1:Ukraine - Main economic indicators 2007 2008 2009 2010 2011
prel. proj.Real sector Real GDP (% change) 7,9 2,3 -14,8 4,2 4,7
Real private consumption (% change) 17,0 12,8 -15,0 7,0 7,4 Real gross fixed capital formation (% change) 23,9 -1,2 -50,5 4,9 7,7
Net exports (contribution to real GDP growth) -9,1 -6,0 11,0 -3,2 -3,5
GDP nominal (EUR billion) 104,3 122,9 84,4 104,1 116,4 GDP nominal (USD billion) 142,7 180,0 117,2 137,9 162,9
GDP per capita (EUR) 2235 2650 1829 2266 2536 GDP per capita (USD) 3060 3881 2540 3001 3575
GNI per capita (PPP current prices, US$) 6890 7270 6180 n.a. n.a.Social indicators Population (million) 46,6 46,4 46,1 46,0 45,9
Life expectancy at birth (years) 68,2 68,3 n.a. n.a. n.a.
Unemployment (ILO definition) 6,9 6,9 9,6 8,8 8 Activity rate (% of working age pop. in paid work) 71,7 72,3 71,6 72,0 n.a.
Employment (% change) 0,8 0,3 -3,7 0,4 n.a.Fiscal sector Total revenue (% GDP) n.a. 44,3 42,2 42,2 n.a.
Total expenditure (% GDP) n.a. 47,3 47,6 45,6 n.a. General govt. balance (% GDP) inc. Naftogaz -2,0 -3,2 -8,7 -6,5 -3,5
Public debt (% GDP) 12,3 20,5 35,3 41,3 42,4Monetary sector Consumer price inflation (year average) 12,8 25,2 15,9 9,4 9,3
NBU policy rate (year-end) 8,00 12,00 10,25 7,75 10,00 Broad money (M2) (% change) 50,8 31,0 -5,4 23,1 n.a.
Degree of monetisation (M2 in % GDP) 54,3 54,1 53,1 54,5 n.a.External sector Current account balance (% GDP) -3,7 -7,1 -1,5 -2,1 -3,9
Trade balance (% GDP) -7,4 -8,9 -3,7 -6,3 -7,3
Foreign direct investment (net, % GDP) 6,5 5,5 4,0 4,2 3,7 Balance of payments (% GDP) exc. IMF support 6,6 -1,7 -11,7 3,6 1,3External vulnerability indicators Total external debt (% GDP) 56,0 56,5 88,2 85,1 84,9
Total external debt (% of exports) 124,9 118,7 190,6 169,4 159,5
Debt service ratio 18,5 20,5 44,5 31,1 26,4 International reserves (USD billion), year-end 32,5 31,5 26,5 34,6 40,5
Import cover (months of imports) 3,9 6,7 4,4 4,5 5,1 Reserve cover (% debt falling due within a year) 86,1 68,9 68,3 73,0 76,4Financial sector
Dom. bank loans to private sector (stock, % GDP) 56,6 72,4 72,4 60,7 n.a. Foreign currency deposits (% total deposits) 32,3 43,9 48,3 42,6 n.a.
Exchange rate (hryvnia per EUR, average) 6,91 7,72 10,82 10,51 11,14
Exchange rate (hryvnia per USD, average) 5,05 5,27 7,79 7,94 7,96 Real effective exchange rate (2005=100) 105,6 115,2 96,8 99,4 102,0
Sources: IMF, World Bank, NBU, State Statistics Committee of Ukraine, Commission staff calculations.

REFERENCES
148
Abedini, N. and J. Peridy (2007), "The Greater Arab Free Trade Area: An estimation of trade effects", Journal of Economic Integration 23 (4): 848-872.
Albers R. and Peeters M. (2011), "Food and energy prices, government subsidies and fiscal balances in South Mediterranean countries", European Economy - Economic Papers No. 437 (Brussels: Directorate General for Economic and Financial Affairs).
Assaad R. and Barsoum. G. (2007), "Youth Exclusion in Egypt: In Search of “Second Chances”", Middle East Youth Initiative Working Paper No. 2 (Wolfensohn Center for Development at the Brookings Institute, and Dubai School of Government).
Bhattacharya R. and Wolde H. (2010), "Constraints of Growth in the MENA Region, IMF", IMF Working Paper No. 10/30 (Washington, DC: International Monetary Fund).
Boudarbat B. and Ajbilou A. (2007), "Youth Exclusion in Morocco: Context, Consequences and Policies", Middle East Youth Initiative Working Paper No. 5 (Wolfensohn Center for Development at the Brookings Institute, and Dubai School of Government).
Brach J. (2008), "Constraints to Economic Development and Growth in the Middle-East and North Africa", GIGA Working Paper No. 85.
Calvo G. and Mishkin F. (2003), "The Mirage of Exchange Rate Regimes for Emerging Market Countries", Working paper No. 9808 (Cambridge, MA: National Bureau of Economic Research).
Caporale G. M., Hadjamor T. and Rault C. (2009), "International Financial Integration and Real Exchange Rate Long-Run Dynamics in Emerging Countries: Some Panel Evidence", William Davidson Institute, Working Paper No. 970. (Michigan: The William Davidson Institute).
Chaaban J., "The Impact of Instability and Migration on Lebanon's Human capital", in Generation in Waiting: The Unfulfilled Promise of
Young People in the Middle East, eds. Dhillon N. and Yousef T. (Brookings Institute, 2009).
Curtis E., Gardner R., Waller C. J., (2005), "Dollarization in the CIS: the Case of Ukraine", Magisterium 18, 4-13.
Daly S. and Sami M. (2009), "Determinants of Exchange Rate Practices in the MENA Countries: Some Further Empirical Results", William Davidson Institute Working Paper No. 952. (Michigan: The William Davidson Institute).
Deutsche Bank (2010), "North Africa – Mediterranean Neighbours on the rise", Deutsche Bank Research May 31.
EBRD (2010), "Transition Report 2010: Recovery and Reform", EBRD Flagship Reports (London: EBRD).
Elbadawi I. and Kamar B., "The Great Debate on Exchange Rate Regimes: Why Should the Mena Region Care?" (paper presented at the 12th Economic Research Forum Conference, Cairo, Egypt, December 17-21, 2005).
European Commission (2008), "European Neighbourhood Policy: Economic review of EU Neighbouring Economies", European Economy Occasional Papers No. 40 (Brussels: Directorate General for Economic and Financial Affairs).
European Commission (2009), "Impact of the Global Crisis on Neighbouring Countries of the EU", European Economy Occasional Papers No. 48 (Brussels: Directorate General for Economic and Financial Affairs).
European Commission (2010a), "The EU's Neighbouring Economies: Emerging from the Global Crisis", European Economy Occasional Papers No. 59 (Brussels: Directorate General for Economic and Financial Affairs).
European Commission (2010b), "Labour Markets Performance and Migration Flows in Arab Mediterranean Countries: Determinants and Effects", European Economy Occasional Papers No. 60 (Brussels: Directorate General for Economic and Financial Affairs).

References
149
Favero C.A., Giavazzi F. and Missale A., "Egypt and the Crisis", in Vol. II of Egypt and the Global Economic Crisis: A Preliminary Assessment of macroeconomic Impact and Response (Washington, DC: World Bank, 2009), Annex 2.
Frankel J. (1999), "No Single Currency Regime is Right for All Countries or at All Times", NBER Working Paper No. 7338 (Cambridge, MA: National Bureau of Economic Research).
Gonzales, P., Williams, T., Jocelyn, L., Roey, S., Kastberg, D. and Brenwald, Highlights From TIMSS 2007: Mathematics and Science Achievement of U.S. Fourth- and Eighth-Grade Students in an International Context (NCES 2009–001Revised) (Washington, DC: National Center for Education Statistics, Institute of Education Sciences, U.S. Department of Education, 2008).
Guillaume D., Zytek R. and Farzin M. R., (2011), "Iran-The Chronicle of the Subsidy Reform", IMF Working Paper No. 11/167 (Washington DC: International Monetary Fund).
International Monetary Fund (2010a), "Regional Economic Outlook: Middle East and Central Asia", Regional Economic Reports (Washington, DC: International Monetary Fund).
International Monetary Fund (2010b), "Regional Economic Outlook: Europe. Building Confidence", Regional Economic Reports (Washington, DC: International Monetary Fund).
International Monetary Fund (2010c), "World Economic Outlook. Recovery, Risk, and Rebalancing", World Economic and Financial Surveys (Washington, DC: International Monetary Fund).
International Monetary Fund (2011a), "Regional Economic Outlook: Middle East and Central Asia", Regional Economic Reports (Washington, DC: International Monetary Fund).
International Monetary Fund (2011b), "World Economic Outlook. Tensions from the Two-Speed Speed Recovery: Unemployment, Commodities, and Capital Flows", World Economic and Financial Surveys (Washington, DC: International Monetary Fund).
International Monetary Fund (2011c), "Economic transformation in MENA: Developing on the promise of shared prosperity", in Staff Report, Deauville, France, G-8 summit (Washington, DC: International Monetary Fund).
International Monetary Fund (2011d), "Middle East and North Africa: Economic Outlook and Key Challenges" (paper submitted to Deauville Partnership Ministerial Meeting, International Monetary Fund, Washington, DC).
Jelašić R., "Serbia: On the De-euroization Road to the Euro", in The Euro and Economic Stability, eds. Nowotny E., Mooslechner P., Ritzberger-Grünwald D. (Austrian National Bank and Edward Elgan Publishing, 2010).
Kabbani N. and Kamel N., "Tapping into the Economic Potential of Young Syrians during a Time of Transition", in Generation in Waiting: The Unfulfilled Promise of Young People in the Middle East, eds. Dhillon N. and Yousef T. (Brookings Institute, 2009)
Kabbani N. and Kothari E. (2005), "Youth Employment in the MENA Region: A Situational Assessment", Social Protection Discussion Paper No. 534 (Washington, DC: World Bank).
Kaufmann D., Kraay A. and Mastruzzi M. (2010), "The Worldwide Governance Indicators: A Summary of Methodology, Data and Analytical Issues", World Bank Policy Research (Washington, DC: World Bank).
Keller P. and Richardson T. (2003), "Nominal anchors in the CIS", IMF Working Paper No. 179 (Washington, DC: International Monetary Fund).
Levy-Yeyati E. (2005), "Financial Dollarization: Evaluating the Consequences", Business School Working Papers (Buenos Aires: Universidad Torcuato Di Tella).
Loiseau-Aslanidi O. (2008), "Dollarization in Transition Economies: New Evidence from Georgia", CERGE-EI Working Paper No. 366.
Mueller J. (1994), "Dollarization in Lebanon", IMF Working Paper No. 94/129. (Washington, DC: International Monetary Fund).

European Commission The EU's neighbouring economies: coping with new challenges
150
Mussa M., Masson P., Swodoba A., Jadresic E., Mauro P. and Berg A. (2000), "Exchange Rate Regimes in an Increasingly Integrated World Economy", IMF Occasional Paper No. 193 (Washington, DC: International Monetary Fund).
Neaime S. (2008), "Monetary Policy Transmission and Targeting Mechanisms in the MENA Region", Working Paper No. 395 (Institute of Financial Economics).
Rappaport V. (2009), "Persistence of Dollarization after Price Stabilization", Journal of Monetary Economics, 56 (7).
Sturm, M., Gartner, F. (2007), "Fiscal policy in Mediterranean Countries: developments, structures and implications for monetary policy", ECB Occasional Paper Series No. 69 (Frankfurt: European Central Bank).
Sturm M. and Sauter N. (2010): "The impact of the global financial turmoil and recession on Mediterranean countries' economies", ECB Occasional Paper Series No. 118 (Frankfurt: European Central Bank).
Temprano-Arroyo H. (2003), "Prospects for Regional monetary Integration in Latin America: A view from EU", Comparative Economic Studies 45, 384-420.
Von Hagen J. and Zhou J. (2002), "The Choice of Exchange Rate Regimes: An Empirical Analysis of Transition Economies" ZEI Working Paper No. B- 03 (Bonn: Center for European Integration Studies).
World Bank (2008), "The Road not Travelled: Education Reform in Middle East and North Africa", MENA Flagship Report on Education (Washington, DC: World Bank).
World Bank (2009a), "Governance Matters VIII: Aggregate and Individual Governance Indicators, 1996-2008", World Bank Policy Research Working Paper No. 4978 (Washington, DC: World Bank).
World Bank (2009b), "World Bank Doing Business Report 2010: Reforming through difficult times", Global Report (Washington, DC: World Bank).
World Bank (2011), "Doing Business 2012: Doing Business in a More Transparent World ", Global Report (Washington, DC: World Bank).
World Economic Forum (2011), "The Global Competitiveness Report 2011-2012", Reports (Geneva: World Economic Forum).