Embed Size (px)
Citation preview

Coorong District Council
Roads Asset Management Plan
Version 3.00 – January 2018
Coorong District Council - Roads Asset Management Plan 2018
i
Schedule of Changes & Amendments
Version Date Changes/Amendments
V1.01 29/12/2011 Draft prepared in conjunction with Asset/Service Managers and circulated for internal staff comment.
V1.02 2/03/2012 Updates to plan based on staff feedback. Final Draft for comment.
V2.01 1/11/2016 Regular review of document and data. Moved to updated AMP template.
V3.00 12/01/2018 Updated to align with LTFP
NB: 1. Primary number changes to Versions (e.g. V1.00 to V2.00) will be made when the document
undergoes its regular review and when significant changes are made to standards and guidelines for inspections, intervention levels or work
2. Secondary number changes (V1.00 to V1.01) will apply to minor amendments that do not materially impact the document and are intended only to clarify or update issues.

Coorong District Council - Roads Asset Management Plan 2018
ii
Contents 1 Executive Summary ......................................................................................................................... 1
1.1 Background ............................................................................................................................. 1
1.2 Current State of Council’s Assets ............................................................................................ 2
1.3 Key Achievements ................................................................................................................... 3
1.4 Long Term Asset Financial Planning ........................................................................................ 4
1.5 Action Plan .............................................................................................................................. 6
2 Current State of Council’s Assets .................................................................................................... 7
2.1 Key Indicators .......................................................................................................................... 7
2.2 State of Assets ......................................................................................................................... 7
2.2.1 Sealed Roads ................................................................................................................... 8
2.2.2 Unsealed Roads ............................................................................................................... 8
2.2.3 Kerb & Channel and Footpaths ....................................................................................... 9
3 Levels of Service and Condition Assessment ................................................................................ 10
3.1 Customer Research and Expectations .................................................................................. 10
3.2 Legislative and Statutory Requirements ............................................................................... 11
3.3 Current Levels of Service....................................................................................................... 13
3.4 Maintenance & Operational Levels of Service ...................................................................... 15
3.5 Condition Assessment Framework ....................................................................................... 15
4 Key Achievements ......................................................................................................................... 16
4.1 Asset Management Practice ................................................................................................. 16
4.2 Operational ........................................................................................................................... 16
5 Asset Funding Levels ..................................................................................................................... 17
5.1 Forecast 10-Year Funding Required ...................................................................................... 17
5.1.1 Sealed Roads ................................................................................................................. 18
5.1.2 Unsealed Roads ............................................................................................................. 19
5.1.3 Kerb & Channel ............................................................................................................. 21
5.1.4 Footpath ........................................................................................................................ 22
5.2 Committed Funding .............................................................................................................. 24
5.3 Financial Ratios ..................................................................................................................... 24
6 Action Plan .................................................................................................................................... 26
6.1 AM Document Register ......................................................................................................... 26
6.2 AM Practice Improvements .................................................................................................. 26
6.2.1 Performance Measures ................................................................................................. 26
6.2.2 Improvement Plan ........................................................................................................ 26
6.2.3 Monitoring and Review Procedures ............................................................................. 28
Appendix A – Long Term Financial Plan ................................................................................................ 29

Coorong District Council - Roads Asset Management Plan 2018
1
1 Executive Summary
1.1 Background
The Asset Management Plan is prepared to provide a record of:
The state of Council’s road infrastructure assets at the close of the past financial year;
Key achievements in the past financial year;
The 10-year funding required to achieve Council’s adopted asset performance targets; and
Planned Asset Management activities for the current financial year.
This Plan encompasses the roads asset class, including the following.
Sealed Roads – Surface and Pavement
Unsealed Roads
Kerb and Channel
Footpaths
Council roads are classified for maintenance and renewal purposes in accordance with the following hierarchy.
Road Classification
Functional Definition
Rural Roads & Urban Roads
A A road that carries predominately through traffic.
B A road that carries a mixture of through and local traffic.
C Carries mainly local and some through traffic.
D Provides access to residence and and/or minimal through traffic.
E Provides access to properties, unsealed.
F Unmade or unformed roads.
G Leased roads.
Council footpaths are classified using the hierarchy outlined below based on pedestrian volume, utilisation and likelihood of risk.
Classification Functional Definition
General Footpath Description and Performance Requirements
High Usage Town Centre, shopping precincts footpaths
Concrete footpath, 2.0 to 2.5m wide (minimum) with or without nature strip or
Asphalt footpath, 2.0 to 2.5m wide (minimum) with or without nature strip or
Brick or concrete paved footpath, 2.0 to 2.5m wide (minimum) with or without nature strip

Coorong District Council - Roads Asset Management Plan 2018
2
Classification Functional Definition
General Footpath Description and Performance Requirements
Medium Usage School, Community (i.e. Nursing Homes, Hospitals, Church) areas
Concrete footpath, 1.2m to 2.0m wide (minimum) with or without nature strip or
Asphalt or Spray Seal footpath 1.2m to 2.0m wide (minimum) with or without nature strip
Low Usage Residential areas Concrete footpath, 1.2m to 1.5m wide (minimum) with or without nature strip or
Asphalt or Spray Seal footpath 1.2m to 1.5m wide (minimum) with or without nature strip
Compacted granular unsealed footpath 1.2m to 1.5m wide (minimum) with or without nature strip
These classifications are used to determine priorities for maintenance, repair and renewal.
The Asset Management Plan is to be reviewed as soon as practical after the close of the financial year it is Planning on and before the budgets are set for the financial year following the year in which the Plan is written. Ideally, the Asset Management Plan should be available to an incoming Council following an election.
1.2 Current State of Council’s Assets
The value of the road assets as at 30 June 2017 is shown below
Asset Replacement Value ($)
Written Down Value ($)
Accumulated Depreciation ($)
Annual Depreciation ($)
Sealed Roads 64,662,546 56,808,899 7,853,648 892,190
Unsealed Roads 145,925,224 129,257,981 16,667,243 1,100,871
Kerb and Channel 8,211,109 5,884,566 2,326,543 101,648
Footpaths 2,567,222 1,902,600 664,622 51,477
Totals 221,366,101 193,854,046 27,512,056 2,146,186
The following charts indicate the condition ratings for the above assets.
Condition ratings for the various roads are shown in Section 2.2. The ratings range from 1 = Good to 5 = Close to Failure as follows.1
Condition Index
Community Rating Scale
1 Good
2 Fair
3 Poor
4 Very Poor
5 Close to Failure
1 Condition Information does not reflect community perception on rideability and aesthetics

Coorong District Council - Roads Asset Management Plan 2018
3
1.3 Key Achievements
Council has adopted a program of ongoing desktop update of the Asset Management Plan every year with a comprehensive update every four years.
Council has committed to and successfully completed two rounds of electronic road data auditing. This includes pick up of road, kerb and footpath inventory and condition every four years. The condition is assessed by video imagery of high resolution and includes six road distress failure modes based on the Austroads methodology.
Council has applied a state of the art sophisticated predictive modelling analytical process for determining future funding requirements for renewal of the roads and road side assets. The analytics utilise condition data to project future scenarios and perform what-if analysis. This enables councils to validate and prescribe affordable service levels.
Council has revalued its road network in 2011 and 2015 in full compliance with the Australian Accounting standards.
86.6%
10.7% 2.6% 0.1% 0.0%
Sealed Roads Surface Condition
1
2
3
4
5
90.0%
8.0% 2.0% 0.0% 0.0%
Sealed Roads Pavement Condition
1
2
3
4
5
8.0%
85.6%
4.4% 2.0% 0.0%
Unsealed Roads Pavement Condition
1
2
3
4
5
8.7%
14.7%
69.6%
7.0% 0.0%
Kerb and Channel Condition
1
2
3
4
5
47.6%
18.9%
24.7%
7.3% 1.5% Footpath Condition
1
2
3
4
5

Coorong District Council - Roads Asset Management Plan 2018
4
Council has assessed the impact of the Accounting Standards Board’s interpretation of the residual values for road components and appropriately componentised in 2017.
Council has been able to apply this Asset Management Plan in 2017 to inform the Long Term Financial Plan.
Council has updated its financial ratios in 2017.
1.4 Long Term Asset Financial Planning
The following is the 10 year LTFP adopted by Council as currently the most affordable. The budget is reviewed annually2.
Year Sealed Road ($) Unsealed Road
($) Kerb and Channel
($) Footpath ($)
2017/18 1,079,000 1,190,000 111,000 53,000
2018/19 1,077,000 1,397,000 111,000 51,000
2019/20 1,078,000 1,497,000 111,000 55,000
2020/21 1,077,000 1,597,000 111,000 53,000
2021/22 1,077,000 1,697,000 111,000 51,000
2022/23 1,078,000 1,797,000 111,000 55,000
2023/24 1,078,000 1,897,000 111,000 55,000
2024/25 1,177,000 1,897,000 111,000 52,000
2025/26 1,277,000 1,897,000 110,000 55,000
2026/27 1,377,000 1,897,000 110,000 55,000
Total 11,375,000 16,763,000 1,108,000 535,000
The Councils Long Term Financial Plan has been analysed against the predicted impact of the funding levels on asset condition. Modelling has also been undertaken in recognition of an increased service standard over the next 10 years. The level of funding is required to maintain the average asset condition to a minimum of Fair (Service Level = 2) condition.
The Condition Index and Remaining Useful Lives contained in the Council’s Asset Management System have been used in the budget and condition forecasts.
The predicted Service Level (Condition) for the LTFP is shown below. The budgets have been projected for 20 years to indicate the longer term effect on the asset condition. Further details are included in Section 5.1
2 Projected renewal expenditures are inclusive of applied 9% administration cost.

Coorong District Council - Roads Asset Management Plan 2018
5
The modelling has shown that the following budget levels are required to maintain the assets in an average Fair condition
Year Sealed Road ($) Unsealed Road
($) Kerb and Channel
($) Footpath ($)
2017/18 1,600,000 1,800,000 224,000 79,000
2018/19 1,600,000 1,800,000 224,000 79,000
2019/20 1,600,000 1,800,000 224,000 79,000
2020/21 1,600,000 1,800,000 224,000 79,000
2021/22 1,600,000 1,800,000 224,000 79,000
2022/23 1,600,000 1,800,000 224,000 79,000
2023/24 1,600,000 1,800,000 224,000 79,000
2024/25 1,600,000 1,800,000 224,000 79,000
2025/26 1,600,000 1,800,000 224,000 79,000
2026/27 1,600,000 1,800,000 224,000 79,000
Total 16,000,000 18,000,000 2,240,000 790,000
The above indicates that the following additional annual funding is required.
Asset Class Required Additional Annual Funding
($)
Sealed Road 520,000
Unsealed Road 514,000
Kerb and Channel 113,000
Footpath 25,000
Total: 1,172,000
0.00
0.50
1.00
1.50
2.00
2.50
3.00
3.50
4.00
4.50
5.00
0 1 2 3 4 5 6 7 8 9 10 20
Ave
rage
Lev
el o
f Se
rvic
e
Year
Predicted Service Level
Sealed Road Surface Sealed Road Pavement Unsealed Roads
Kerb and Channel Footpaths

Coorong District Council - Roads Asset Management Plan 2018
6
The Asset Financial Ratios are as follows:
Ratio Road Assets Target
Asset Consumption Ratio 88% Standard is met if the ratio >50%. Standard is improving if the ratio is between 60% and 75%
Asset Renewal Funding Ratio 68% Standard is met if the ratio is between 75% and 95%. And is improving if between 95% and 105% and ACR is within the range 50% to 75%.
The above ratios indicate that the Coorong District Council Roads Asset Consumption Ratio meets desired standards. The Asset Renewal Funding Ratio indicates that additional funding is required to maintain assets in a Fair condition.
1.5 Action Plan
This Asset Management Plan will be reviewed during annual budget preparation and amended to recognise any changes in service levels and/or resources available to provide those services as a result of the budget decision process.
The Plan has a life of 4 years and is due for revision and updating within 2 years of each Council election.
A detailed Action Plan generated from this Asset Management Plan is shown in Section 6.2.2.
Coorong District Council - Roads Asset Management Plan 2018
7
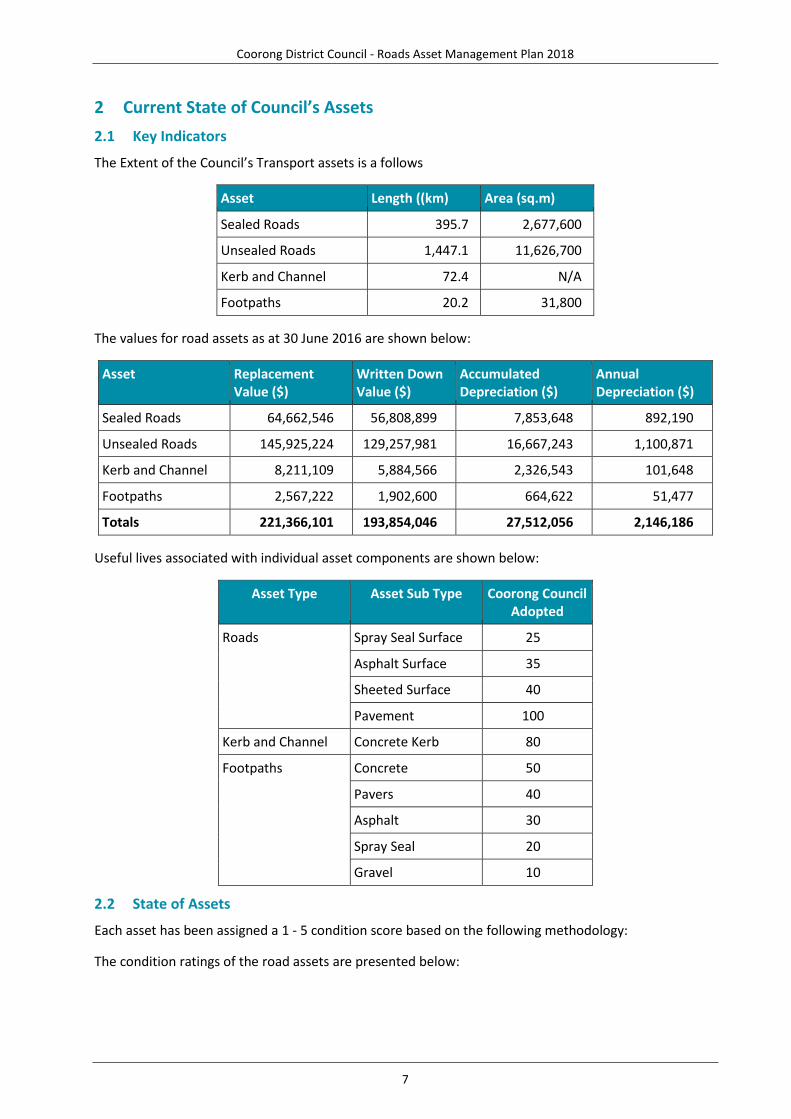
2 Current State of Council’s Assets
2.1 Key Indicators
The Extent of the Council’s Transport assets is a follows
Asset Length ((km) Area (sq.m)
Sealed Roads 395.7 2,677,600
Unsealed Roads 1,447.1 11,626,700
Kerb and Channel 72.4 N/A
Footpaths 20.2 31,800
The values for road assets as at 30 June 2016 are shown below:
Asset Replacement Value ($)
Written Down Value ($)
Accumulated Depreciation ($)
Annual Depreciation ($)
Sealed Roads 64,662,546 56,808,899 7,853,648 892,190
Unsealed Roads 145,925,224 129,257,981 16,667,243 1,100,871
Kerb and Channel 8,211,109 5,884,566 2,326,543 101,648
Footpaths 2,567,222 1,902,600 664,622 51,477
Totals 221,366,101 193,854,046 27,512,056 2,146,186
Useful lives associated with individual asset components are shown below:
Asset Type Asset Sub Type Coorong Council Adopted
Roads Spray Seal Surface 25
Asphalt Surface 35
Sheeted Surface 40
Pavement 100
Kerb and Channel Concrete Kerb 80
Footpaths Concrete 50
Pavers 40
Asphalt 30
Spray Seal 20
Gravel 10
2.2 State of Assets
Each asset has been assigned a 1 - 5 condition score based on the following methodology:
The condition ratings of the road assets are presented below:

Coorong District Council - Roads Asset Management Plan 2018
8
Condition Index
Community Rating Scale
Condition Description
1 Good Only planned maintenance, if any, required
2 Fair Minor maintenance required plus planned maintenance. Consideration may need to be given in following five to seven years to repair or minor renewal of a selected part of the asset.
3 Poor Significant maintenance required. Renewal of part of the asset may be essential within next five years
4 Very Poor Significant renewal/upgrade required within three years.
5 Close to Failure Asset requires immediate renewal or potentially in two to three years, permanent removal from service. Action could be required to prevent public access to the asset and for use of alternative routes.
6 End of Life Asset is not useable and/or obsolete.
2.2.1 Sealed Roads
It is important that adequate funding is applied to the renewal of the surface when required, as this can also have an impact on the rate of deterioration of the pavement.
Also, extreme weather or changed traffic conditions (increased usage and heavy vehicles) can accelerate the deterioration of the road surface and pavement.
Condition Rating Surface
Condition (%)
Pavement Condition (%)
1 – Good 86.6 90.0
2 – Fair 10.7 8.0
3 - Poor 2.6 2.0
4 – Very Poor 0.1 0.0
5 - Close to Failure 0.0 0.0
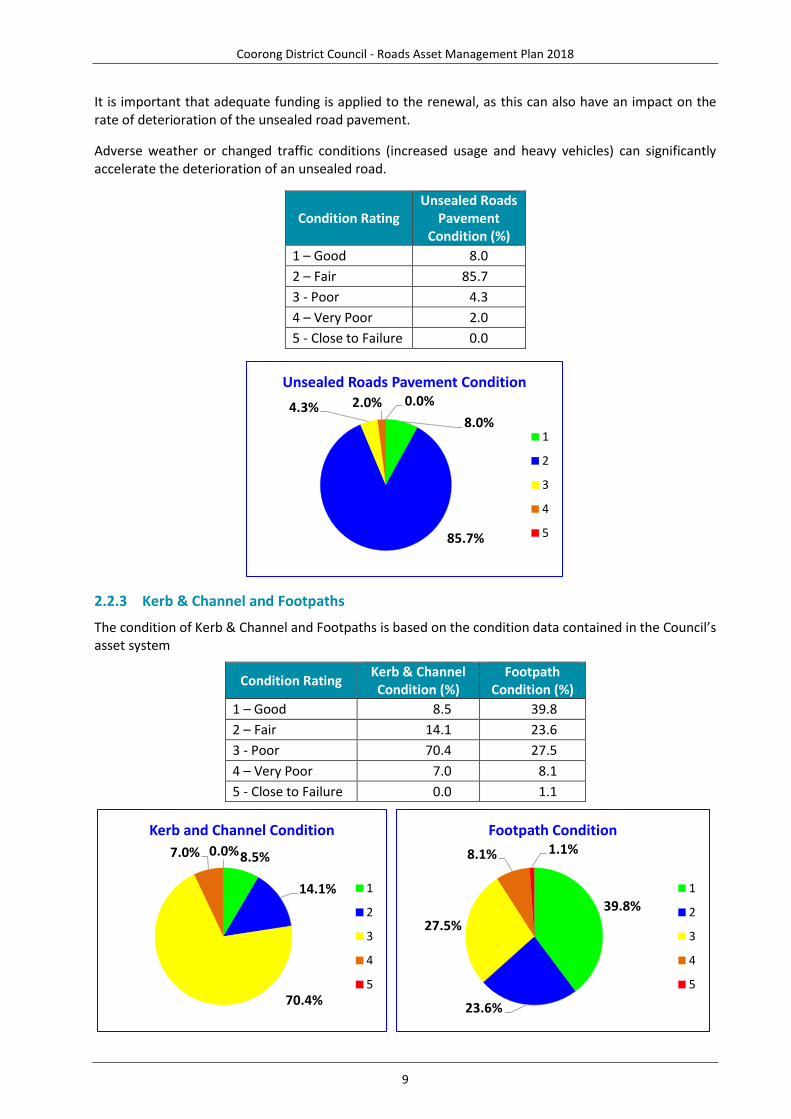
2.2.2 Unsealed Roads
The condition of unsealed roads is based on an audit of the pavement gravel depth.
The condition ratings indicate that most of the unsealed road pavement is in fair condition.
86.6%
10.7% 2.6% 0.1% 0.0%
Sealed Roads Surface Condition
1
2
3
4
5
90.0%
8.0%
2.0% 0.0% 0.0%
Sealed Roads Pavement Condition
1
2
3
4
5
Coorong District Council - Roads Asset Management Plan 2018
9
It is important that adequate funding is applied to the renewal, as this can also have an impact on the rate of deterioration of the unsealed road pavement.
Adverse weather or changed traffic conditions (increased usage and heavy vehicles) can significantly accelerate the deterioration of an unsealed road.
Condition Rating Unsealed Roads
Pavement Condition (%)
1 – Good 8.0
2 – Fair 85.7
3 - Poor 4.3
4 – Very Poor 2.0
5 - Close to Failure 0.0
2.2.3 Kerb & Channel and Footpaths
The condition of Kerb & Channel and Footpaths is based on the condition data contained in the Council’s asset system
Condition Rating Kerb & Channel Condition (%)
Footpath Condition (%)
1 – Good 8.5 39.8
2 – Fair 14.1 23.6
3 - Poor 70.4 27.5
4 – Very Poor 7.0 8.1
5 - Close to Failure 0.0 1.1
8.0%
85.7%
4.3% 2.0% 0.0%
Unsealed Roads Pavement Condition
1
2
3
4
5
8.5%
14.1%
70.4%
7.0% 0.0%
Kerb and Channel Condition
1
2
3
4
5
39.8%
23.6%
27.5%
8.1% 1.1%
Footpath Condition
1
2
3
4
5
Coorong District Council - Roads Asset Management Plan 2018
10
3 Levels of Service and Condition Assessment
3.1 Customer Research and Expectations
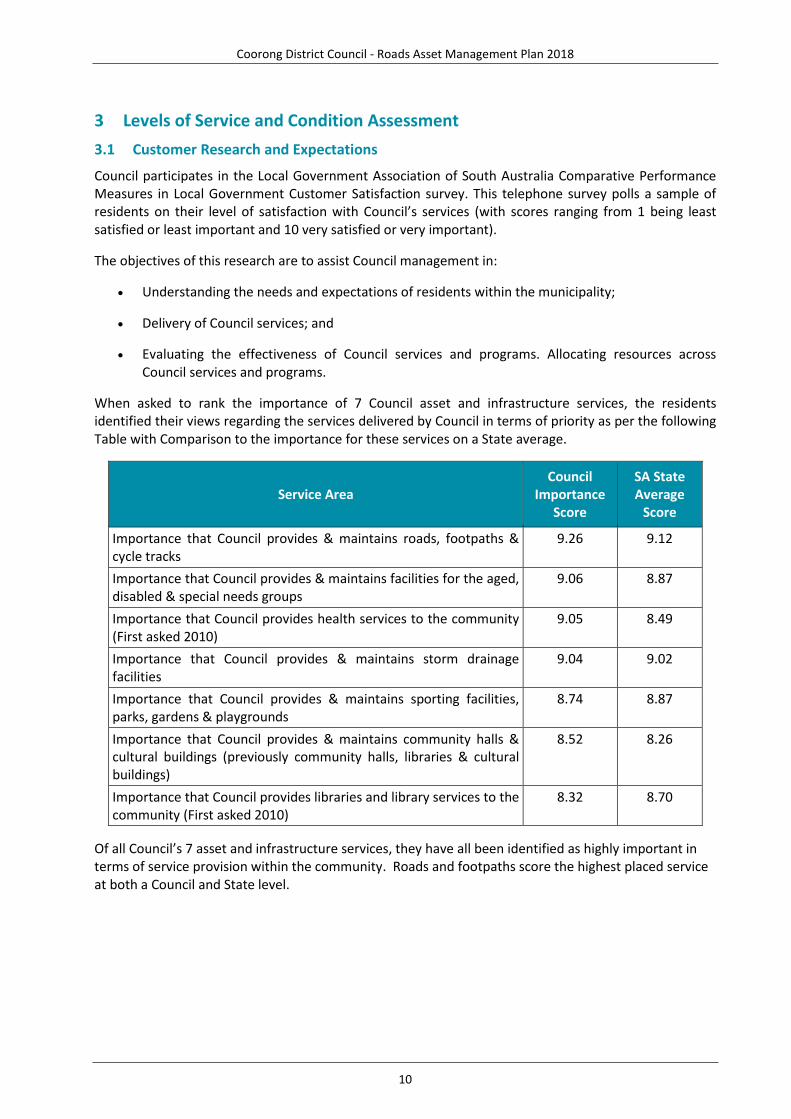
Council participates in the Local Government Association of South Australia Comparative Performance Measures in Local Government Customer Satisfaction survey. This telephone survey polls a sample of residents on their level of satisfaction with Council’s services (with scores ranging from 1 being least satisfied or least important and 10 very satisfied or very important).
The objectives of this research are to assist Council management in:
Understanding the needs and expectations of residents within the municipality;
Delivery of Council services; and
Evaluating the effectiveness of Council services and programs. Allocating resources across Council services and programs.
When asked to rank the importance of 7 Council asset and infrastructure services, the residents identified their views regarding the services delivered by Council in terms of priority as per the following Table with Comparison to the importance for these services on a State average.
Service Area Council
Importance Score
SA State Average
Score
Importance that Council provides & maintains roads, footpaths & cycle tracks
9.26 9.12
Importance that Council provides & maintains facilities for the aged, disabled & special needs groups
9.06 8.87
Importance that Council provides health services to the community (First asked 2010)
9.05 8.49
Importance that Council provides & maintains storm drainage facilities
9.04 9.02
Importance that Council provides & maintains sporting facilities, parks, gardens & playgrounds
8.74 8.87
Importance that Council provides & maintains community halls & cultural buildings (previously community halls, libraries & cultural buildings)
8.52 8.26
Importance that Council provides libraries and library services to the community (First asked 2010)
8.32 8.70
Of all Council’s 7 asset and infrastructure services, they have all been identified as highly important in terms of service provision within the community. Roads and footpaths score the highest placed service at both a Council and State level.
Coorong District Council - Roads Asset Management Plan 2018
11
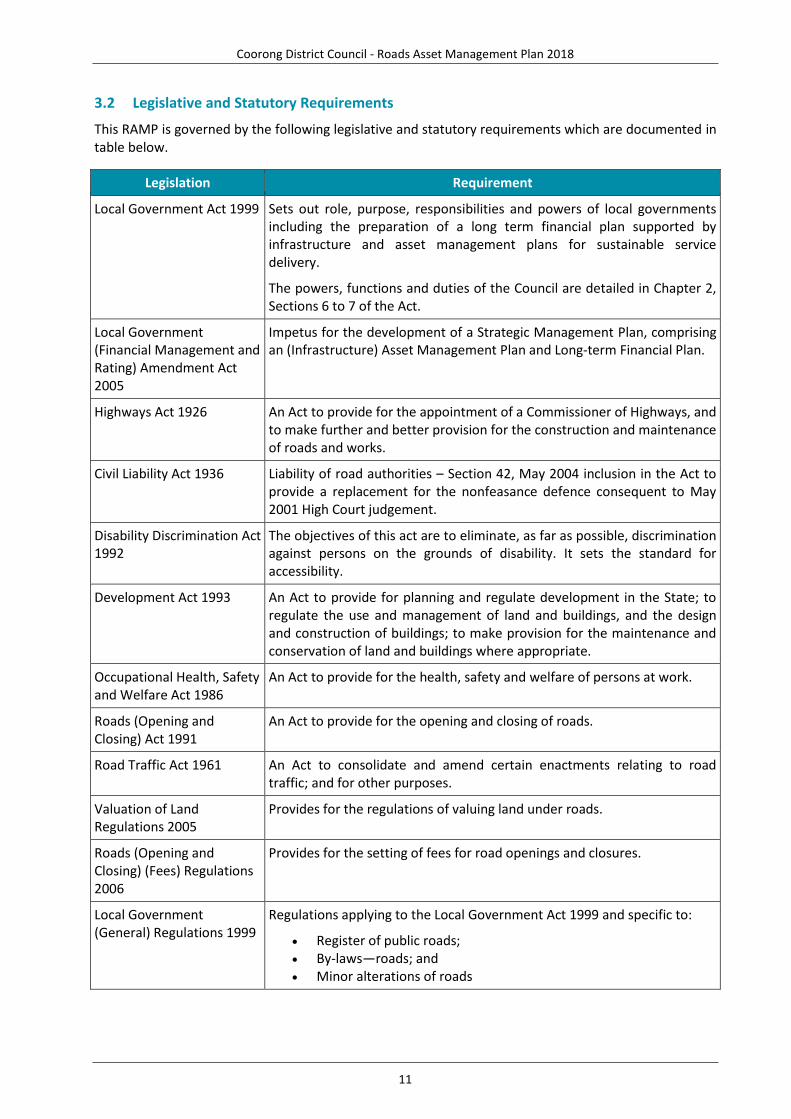
3.2 Legislative and Statutory Requirements
This RAMP is governed by the following legislative and statutory requirements which are documented in table below.
Legislation Requirement
Local Government Act 1999 Sets out role, purpose, responsibilities and powers of local governments including the preparation of a long term financial plan supported by infrastructure and asset management plans for sustainable service delivery.
The powers, functions and duties of the Council are detailed in Chapter 2, Sections 6 to 7 of the Act.
Local Government (Financial Management and Rating) Amendment Act 2005
Impetus for the development of a Strategic Management Plan, comprising an (Infrastructure) Asset Management Plan and Long-term Financial Plan.
Highways Act 1926 An Act to provide for the appointment of a Commissioner of Highways, and to make further and better provision for the construction and maintenance of roads and works.
Civil Liability Act 1936 Liability of road authorities – Section 42, May 2004 inclusion in the Act to provide a replacement for the nonfeasance defence consequent to May 2001 High Court judgement.
Disability Discrimination Act 1992
The objectives of this act are to eliminate, as far as possible, discrimination against persons on the grounds of disability. It sets the standard for accessibility.
Development Act 1993 An Act to provide for planning and regulate development in the State; to regulate the use and management of land and buildings, and the design and construction of buildings; to make provision for the maintenance and conservation of land and buildings where appropriate.
Occupational Health, Safety and Welfare Act 1986
An Act to provide for the health, safety and welfare of persons at work.
Roads (Opening and Closing) Act 1991
An Act to provide for the opening and closing of roads.
Road Traffic Act 1961 An Act to consolidate and amend certain enactments relating to road traffic; and for other purposes.
Valuation of Land Regulations 2005
Provides for the regulations of valuing land under roads.
Roads (Opening and Closing) (Fees) Regulations 2006
Provides for the setting of fees for road openings and closures.
Local Government (General) Regulations 1999
Regulations applying to the Local Government Act 1999 and specific to:
Register of public roads; By-laws—roads; and Minor alterations of roads

Coorong District Council - Roads Asset Management Plan 2018
12
Standards and Specifications
Requirement
Australian Accounting Standards.
Sets out the financial reporting standards relating to infrastructure assets. Standards of particular relevance to Infrastructure Assets include:
AASB 116 Property, Plant & Equipment – prescribes requirements for recognition and depreciation of property, plant and equipment assets
AASB 136 Impairment of Assets – aims to ensure that assets are carried at amounts that are not in excess of their recoverable amounts
AASB 1021 Depreciation of Non-Current Assets – specifies how depreciation is to be calculated
AAS 1001 Accounting Policies – specifies the policies that Council is to have for recognition of assets and depreciation
AASB 1041 Accounting for the reduction of Non-Current Assets – specifies the frequency and basis of calculating depreciation and revaluation basis used for assets
AAS 1015 Accounting for acquisition of assets – method of allocating the value to new assets on acquisition
Engineering Standard Drawings
Council does not currently have any endorsed engineering standards of design and construction however, it does endorse the use of State and National standards which are publicly available. In future, Council will develop a suite of local standards to be adhered to when undertaking maintenance or designing, renewing or construction new road infrastructure.
Austroads Guides, Commentaries and Reports
Austroads works with local government to improve Australia's roads and transport systems, recognising the value and importance of developing the local road component of the national road network.
Australian Standards Provides standards for design and construction and also sets out procedures to meet Australia’s need for contemporary, internationally aligned Standards and related services.
Such as:
Australian Standard 1742.3-1996 – Manual of uniform traffic control devices - Traffic control devices for works on roads
Guide to Traffic Engineering Practice (part 14 Bicycles) Manual of Uniform Traffic Control Devices – Part 3 - Traffic Control Devices
for Works on Roads Integrated Asset Management Guidelines for Road Networks APR202: 2002
Austroads AS/NZS 4360:2004 Risk Management HB 4360:2004 Risk Management Guidelines – Companion to AS/NZS
4360:2004
Australian Rainfall and Runoff
A national guideline document for the estimation of flood flows in Australia.
It should be noted that the above legislative and statutory requirements, regulations, design specifications and standards form the minimum levels of service for Council’s road assets.
Coorong District Council - Roads Asset Management Plan 2018
13
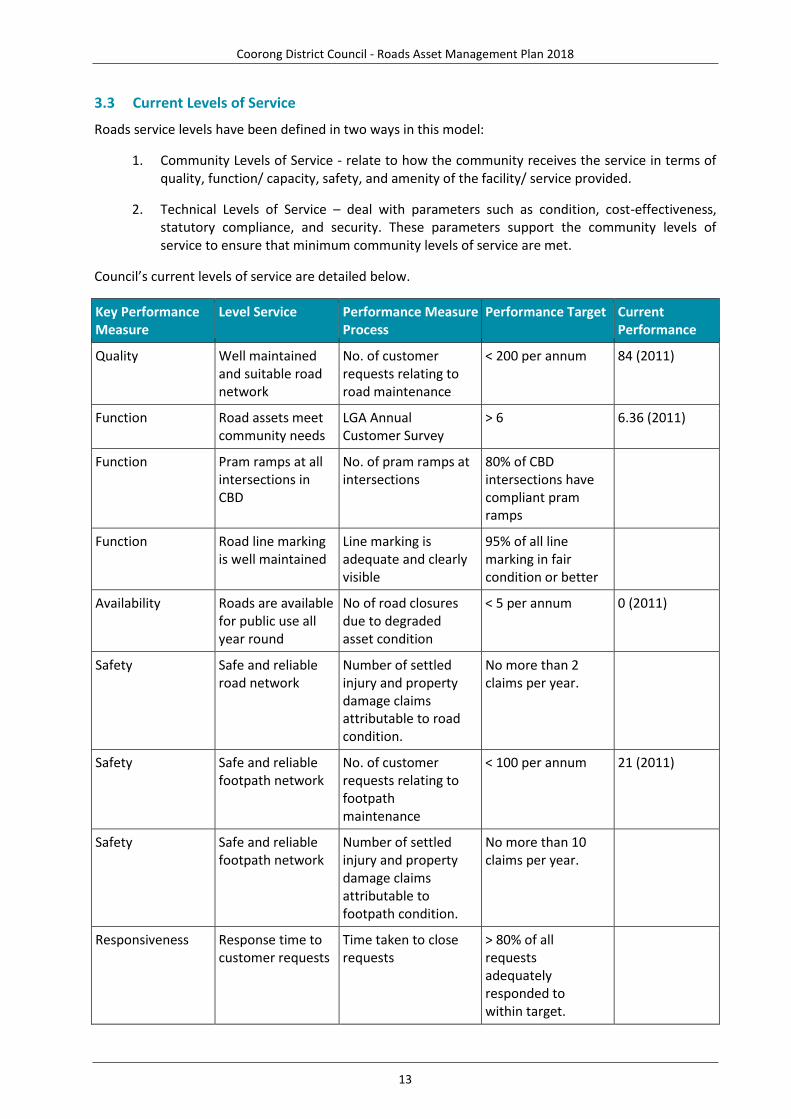
3.3 Current Levels of Service
Roads service levels have been defined in two ways in this model:
1. Community Levels of Service - relate to how the community receives the service in terms of quality, function/ capacity, safety, and amenity of the facility/ service provided.
2. Technical Levels of Service – deal with parameters such as condition, cost-effectiveness, statutory compliance, and security. These parameters support the community levels of service to ensure that minimum community levels of service are met.
Council’s current levels of service are detailed below.
Key Performance Measure
Level Service Performance Measure Process
Performance Target Current Performance
Quality Well maintained and suitable road network
No. of customer requests relating to road maintenance
< 200 per annum 84 (2011)
Function Road assets meet community needs
LGA Annual Customer Survey
> 6 6.36 (2011)
Function Pram ramps at all intersections in CBD
No. of pram ramps at intersections
80% of CBD intersections have compliant pram ramps
Function Road line marking is well maintained
Line marking is adequate and clearly visible
95% of all line marking in fair condition or better
Availability Roads are available for public use all year round
No of road closures due to degraded asset condition
< 5 per annum 0 (2011)
Safety Safe and reliable road network
Number of settled injury and property damage claims attributable to road condition.
No more than 2 claims per year.
Safety Safe and reliable footpath network
No. of customer requests relating to footpath maintenance
< 100 per annum 21 (2011)
Safety Safe and reliable footpath network
Number of settled injury and property damage claims attributable to footpath condition.
No more than 10 claims per year.
Responsiveness Response time to customer requests
Time taken to close requests
> 80% of all requests adequately responded to within target.

Coorong District Council - Roads Asset Management Plan 2018
14
Key Performance Measure
Level Service Performance Measure Process
Performance Target Current Performance
Quality Efficient Capital Works Program
Capital projects completed on time and within budget each financial year.
> 90% programme completed and allocated funds spent.
90% (2010/11)
Quality Sealed Road network condition maintained to an acceptable level.
Routine Condition Assessment
Overall average condition is maintained at 2.0 or better out of 5 for pavements and surface.3
1.09 Pavements (2016)
1.00 Surface (2016)
Quality Unsealed Road network condition maintained to an acceptable level.
Routine Condition Assessment
Overall average condition is maintained at 2.0 or better out of 5 for pavements and surface.3
1.97 (2016)
Quality Footpath network condition maintained to an acceptable level.
Routine Condition Assessment
Overall average condition is maintained at 2.0 or better out of 5 for constructed footpaths.3
2.09 (2016)
Quality Kerb network condition maintained to an acceptable level.
Routine Condition Assessment
Overall average condition is maintained at 2.0 or better out of 5 for kerbs.1
2.46 (2016)
Quality Well maintained unsealed road network
No. of patrol grades per year
80% of all roads graded as per Council’s patrol grading program. 4
3 Based on Condition Assessment scoring range of 1 to 5, with 5 being the worst.
4 The grading program has not been formalised by Council and it is envisaged that as part of this RAMP that it will be formalised and adopted.

Coorong District Council - Roads Asset Management Plan 2018
15
In regards to Technical Levels of Service the Standards for construction of new roads and associated road infrastructure assets and for the expansion, upgrading and renewal of existing infrastructure, takes the following factors into consideration, when determining design and construction aspects:
Functional classification;
Traffic volume and type;
Percentage of trucks;
Bus routes;
Bicycle Lanes; and
Geometric design parameters to allow for the safe and functional movements of traffic.
Council also utilises the following standards and guidelines to ensure a formalised and consistent approach to asset management:
National and State Engineering design standards;
DPTI Standards;
Design criteria based on asset hierarchy (as documented in Section 3.3.1 and 3.3.2);
Relevant Australian Standards and Guidelines (as documented in Section 3.2); and
Australian Rainfall and Runoff Guidelines.
It is proposed that design standards will be considered on a case-by-case basis. Roads and associated infrastructure assets will generally be designed in accordance with the above standards and guidelines.
3.4 Maintenance & Operational Levels of Service
For the Levels of Service delivered on a day to day nature (i.e. responding to customer requests for maintenance faults and responding to breakdowns), refer to Council’s Roads Levels of Service (Refer to Appendix 1).
This RAMP acknowledges the importance of understanding and monitoring the linkage between workload indicators and intervention actions, as a substantial increase in area of road pavements or footpaths which will need to be maintained, can materially impact upon intervention action (and customer satisfaction and duty of care requirements) if not accompanied by a comparable increase in budget allocation or productivity improvement.
Given the outcomes of the internal and external review with respect to Council’s road and associated infrastructure asset maintenance services, the standards of maintenance detailed in this RAMP are considered reasonable and meeting community expectations in the context of responsible and reasonable road and footpath management.
3.5 Condition Assessment Framework
CDC has a documented assessment manual (Refer to Coorong Council Road Data Collection Manual version 1.0.1 with regards to condition rating the road pavements and surfaces, footpaths and kerbs.
Coorong District Council - Roads Asset Management Plan 2018
16
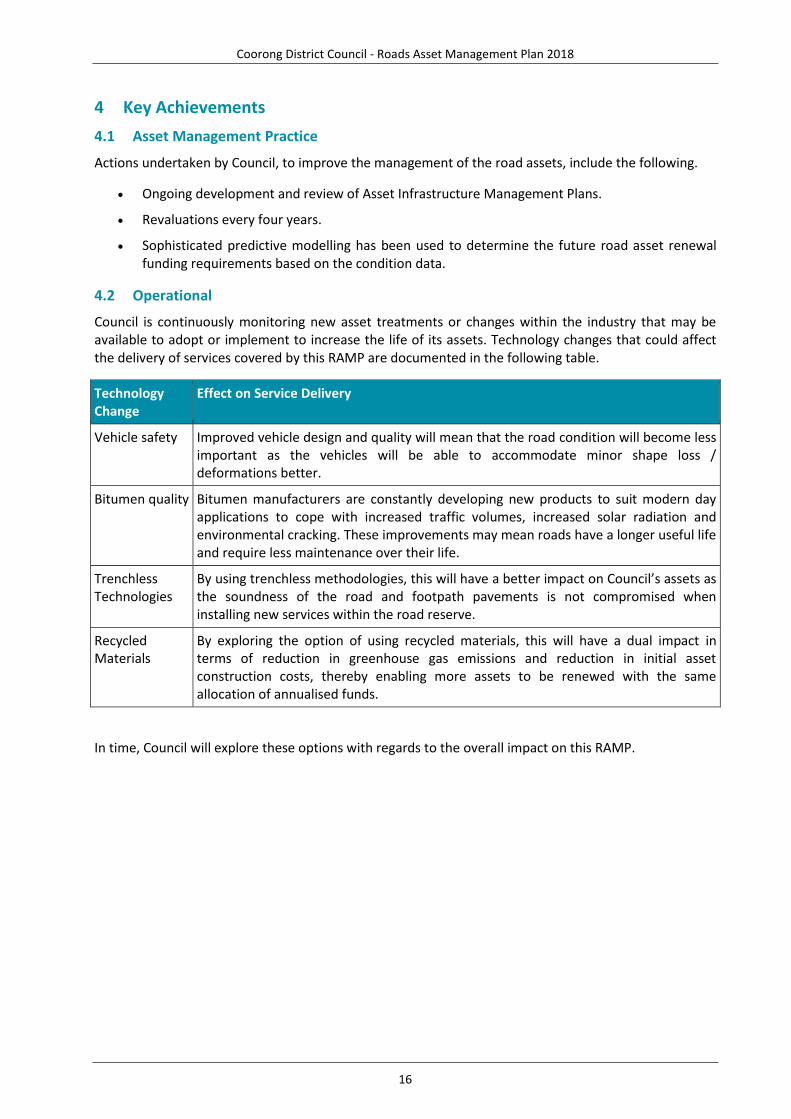
4 Key Achievements
4.1 Asset Management Practice
Actions undertaken by Council, to improve the management of the road assets, include the following.
Ongoing development and review of Asset Infrastructure Management Plans.
Revaluations every four years.
Sophisticated predictive modelling has been used to determine the future road asset renewal funding requirements based on the condition data.
4.2 Operational
Council is continuously monitoring new asset treatments or changes within the industry that may be available to adopt or implement to increase the life of its assets. Technology changes that could affect the delivery of services covered by this RAMP are documented in the following table.
Technology Change
Effect on Service Delivery
Vehicle safety Improved vehicle design and quality will mean that the road condition will become less important as the vehicles will be able to accommodate minor shape loss / deformations better.
Bitumen quality Bitumen manufacturers are constantly developing new products to suit modern day applications to cope with increased traffic volumes, increased solar radiation and environmental cracking. These improvements may mean roads have a longer useful life and require less maintenance over their life.
Trenchless Technologies
By using trenchless methodologies, this will have a better impact on Council’s assets as the soundness of the road and footpath pavements is not compromised when installing new services within the road reserve.
Recycled Materials
By exploring the option of using recycled materials, this will have a dual impact in terms of reduction in greenhouse gas emissions and reduction in initial asset construction costs, thereby enabling more assets to be renewed with the same allocation of annualised funds.
In time, Council will explore these options with regards to the overall impact on this RAMP.

Coorong District Council - Roads Asset Management Plan 2018
17
5 Asset Funding Levels
5.1 Forecast 10-Year Funding Required
Predictive modelling and condition ratings were used to determine the following required renewal expenditure over the next 10 years.
Council has developed a decision logic required for use in prediction that identifies the intervention points to trigger treatments for each service criteria (i.e. Linear Cracking, Edge Defects, Overall Condition, etc.). The results of the modelling are shown below in both the predicted funding requirements and the predicted service level. The funding scenario below is the most affordable current scenario.
Year Sealed Road
($) Unsealed Road
($) Kerb and Channel
($) Footpath
($)
2017/18 1,079,000 1,190,000 111,000 53,000
2018/19 1,077,000 1,297,000 111,000 51,000
2019/20 1,078,000 1,297,000 111,000 55,000
2020/21 1,077,000 1,297,000 111,000 53,000
2021/22 1,077,000 1,297,000 111,000 51,000
2022/23 1,078,000 1,297,000 111,000 55,000
2023/24 1,078,000 1,297,000 111,000 55,000
2024/25 1,077,000 1,297,000 111,000 52,000
2025/26 1,077,000 1,297,000 110,000 55,000
2026/27 1,077,000 1,297,000 110,000 55,000
Total 10,775,000 12,863,000 1,108,000 535,000
0.00
0.50
1.00
1.50
2.00
2.50
3.00
3.50
4.00
4.50
5.00
0 1 2 3 4 5 6 7 8 9 10 20
Ave
rage
Le
vel o
f Se
rvic
e
Year
Predicted Service Level
Sealed Road Surface Sealed Road Pavement Unsealed Roads
Kerb and Channel Footpaths

Coorong District Council - Roads Asset Management Plan 2018
18
A number of scenarios have been analysed for best spend of money as follows.
5.1.1 Sealed Roads
A comparison of the Sealed Road budget and condition for the Current LTFP and Optimal Funding to maintain roads in a Fair condition is shown in the table below
Sealed Road 10 Year Budget
Year Current LTFP
($)
Funding to Maintain Fair Condition
($)
1 1,079,000 1,600,000
2 1,077,000 1,600,000
3 1,078,000 1,600,000
4 1,077,000 1,600,000
5 1,077,000 1,600,000
6 1,078,000 1,600,000
7 1,078,000 1,600,000
8 1,077,000 1,600,000
9 1,077,000 1,600,000
10 1,077,000 1,600,000
Total 10,775,000 16,000,000
20 Year Comparison of Sealed Road Condition for Budget Options
The proposed LTFP funding indicates that the sealed road condition for the proposed LTFP budget deteriorates from an average of 1.06 (Good) to an average of 2.45 (Fair) over 10 years. If this level of funding is maintained over 20 years the average condition deteriorates to an average of 2.87 (Poor).
0.0
0.5
1.0
1.5
2.0
2.5
3.0
3.5
4.0
0 5 10 15 20
Co
nd
itio
n
Year
Sealed Road Condition
LTFP
Maintain Fair Condition

Coorong District Council - Roads Asset Management Plan 2018
19
Under the proposed budget there will be about 50% of the Road Surface in Very Poor or worse condition after 10 years as indicated in the chart below.
To maintain the sealed roads in Fair condition, as indicated by the optimal budget, additional funding of about $520,000 per annum is required.
20 year Sealed Road Surface condition profile for proposed LTFP
The average condition of the pavement deteriorates from Good to Fair/Poor over the next 20 years as indicated below
20 year Sealed Road Pavement condition profile for proposed LTFP
5.1.2 Unsealed Roads
A comparison of the Unsealed Road budget and condition for the Current LTFP and Optimal Funding to maintain road in a Fair condition is shown in the table below
0%
20%
40%
60%
80%
100%
0 5 10 15 20
Qu
anti
ty
Year
Sealed Road Surface Condition
Score 1
Score 2-3
Score 4-EOL
0%
20%
40%
60%
80%
100%
0 5 10 15 20
Qu
anti
ty
Year
Sealed Road Pavement Condition
Score 1
Score 2-3
Score 4-EOL

Coorong District Council - Roads Asset Management Plan 2018
20
Unsealed Road Budgets
Year Current LTFP
($) Funding to Maintain
Fair Condition ($)
1 1,190,000 1,800,000
2 1,297,000 1,800,000
3 1,297,000 1,800,000
4 1,297,000 1,800,000
5 1,297,000 1,800,000
6 1,297,000 1,800,000
7 1,297,000 1,800,000
8 1,297,000 1,800,000
9 1,297,000 1,800,000
10 1,297,000 1,800,000
Total 12,863,000 18,000,000
20 Year Comparison of Unsealed Road Condition for Budget Options
The unsealed road condition for the proposed LTFP budget deteriorates from an average of 1.97 (Fair) to an average of 2.45 (Fair to Poor Condition) over 10 years. If this level of funding is maintained over 20 years the average condition deteriorates to an average of 3.33, indicating a Poor average.
Under the proposed budget there will be about 83% of the assets in Fair to Poor condition after 10 years and 50% in Very Poor or Close to Failure condition after 20 years, as indicated in the chart below.
To maintain the unsealed roads in a Fair condition, as indicated by the optimal budget, additional funding of about $514,000 per annum is required.
0.0
0.5
1.0
1.5
2.0
2.5
3.0
3.5
4.0
0 5 10 15 20
Co
nd
itio
n
Year
Unsealed Road Condition
LTFP
Maintain Fair Condition

Coorong District Council - Roads Asset Management Plan 2018
21
20 year condition profile for proposed LTFP
5.1.3 Kerb & Channel
A comparison of the Kerb & Channel budget and condition for the Current LTFP and Optimal Funding to maintain the assets in a Fair condition is shown in the table below
Kerb & Channel Budgets
Year Current LTFP
($) Funding to Maintain
Fair Condition ($)
1 111,000 224,000
2 111,000 224,000
3 111,000 224,000
4 111,000 224,000
5 111,000 224,000
6 111,000 224,000
7 111,000 224,000
8 111,000 224,000
9 110,000 224,000
10 110,000 224,000
Total 1,108,000 2,240,000
0%
20%
40%
60%
80%
100%
0 5 10 15 20
Qu
anti
ty
Year
Unsealed Road Pavement Condition
Score 1
Score 2-3
Score 4-EOL

Coorong District Council - Roads Asset Management Plan 2018
22
20 Year Comparison of Kerb & Channel Condition for Budget Options
Kerb & channel is predicted to have a relatively steady condition of 2.6 (Fair to Poor) over 10 years. If this level of funding is maintained over 20 years the average condition deteriorates to an average of 3.4, indicating a Poor average.
Under the proposed budget there will be about 83% of the assets in Fair to Poor condition after 10 years and 50% in Close to Failure condition after 20 years as indicated in the chart below.
To maintain a satisfactory level (Fair) of condition, as indicated by the optimal budget, additional funding of about $113,000 per annum is required.
20 year condition profile for proposed LTFP
5.1.4 Footpath
A comparison of the Footpath budget and condition for the Current LTFP and Optimal Funding to maintain footpaths in a Fair condition is shown in the table below
0.0
0.5
1.0
1.5
2.0
2.5
3.0
3.5
4.0
0 5 10 15 20
Co
nd
itio
n
Year
Kerb & Channel Condition for Budget Options
LTFP
Maintain Fair Condition
0%
10%
20%
30%
40%
50%
60%
70%
80%
90%
0 5 10 15 20
Qu
anti
ty
Year
Kerb & Channel Condition
Score 1
Score 2-3
Score 4-EOL
Coorong District Council - Roads Asset Management Plan 2018
23
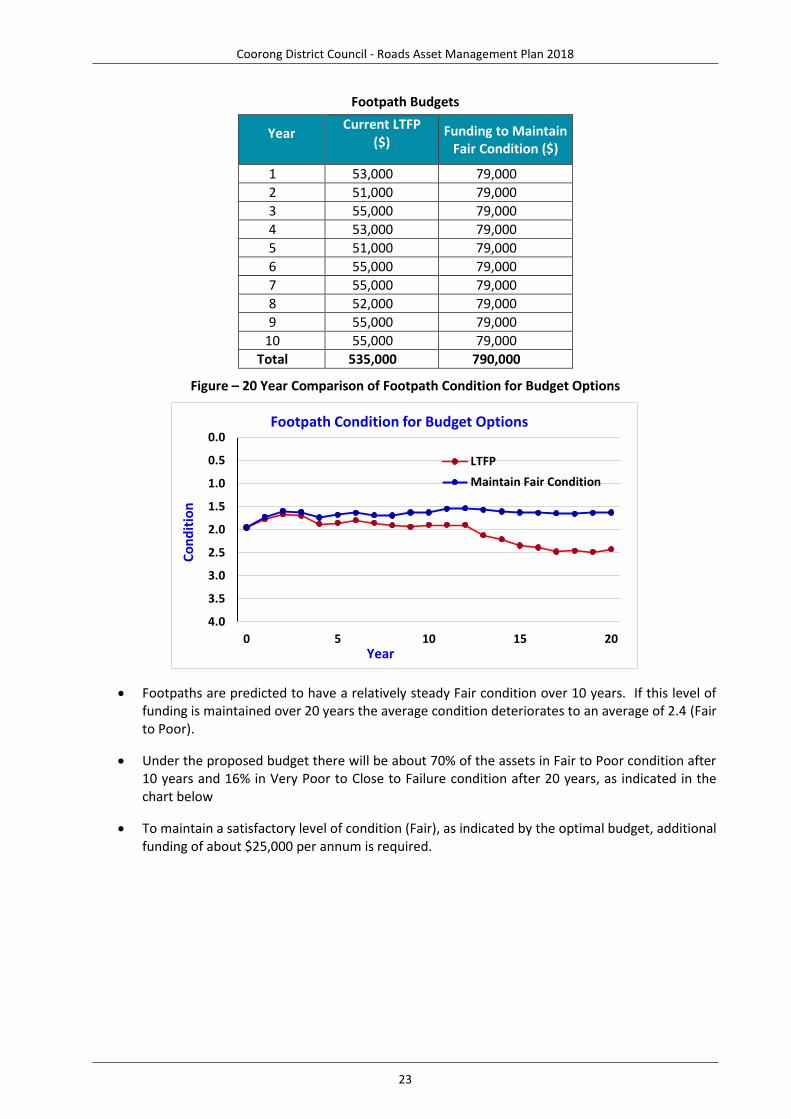
Footpath Budgets
Year Current LTFP
($) Funding to Maintain
Fair Condition ($)
1 53,000 79,000
2 51,000 79,000
3 55,000 79,000
4 53,000 79,000
5 51,000 79,000
6 55,000 79,000
7 55,000 79,000
8 52,000 79,000
9 55,000 79,000
10 55,000 79,000
Total 535,000 790,000
Figure – 20 Year Comparison of Footpath Condition for Budget Options
Footpaths are predicted to have a relatively steady Fair condition over 10 years. If this level of funding is maintained over 20 years the average condition deteriorates to an average of 2.4 (Fair to Poor).
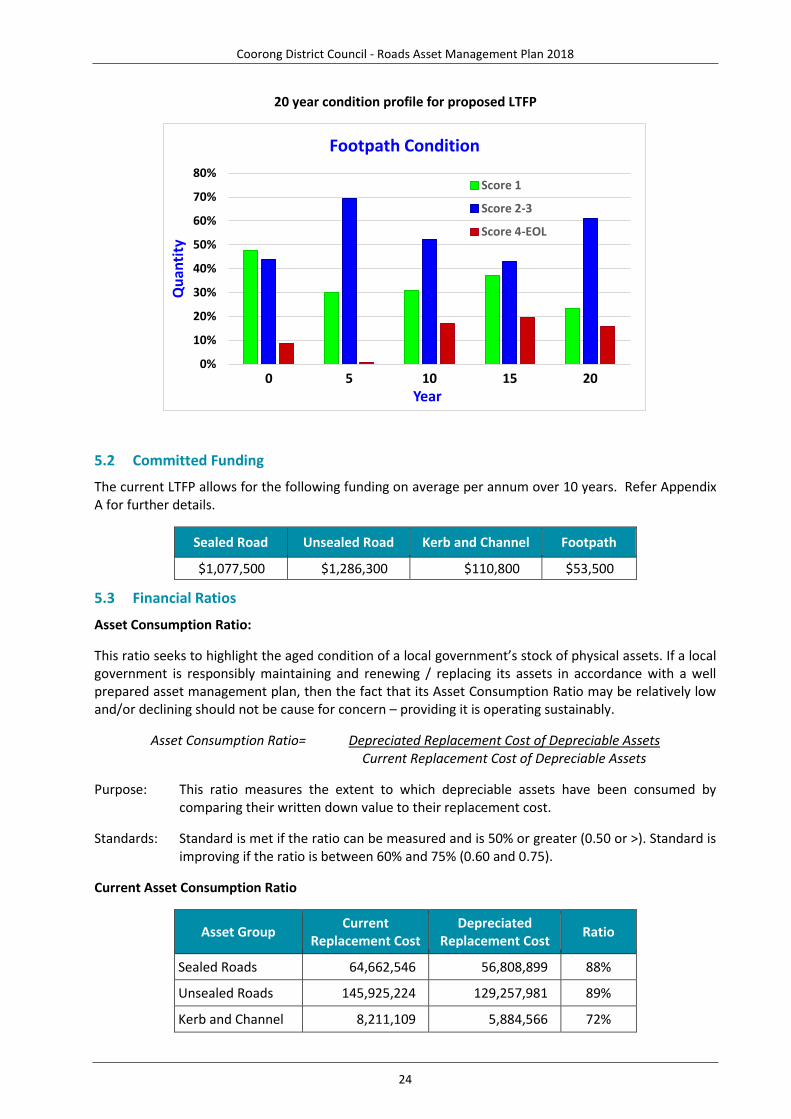
Under the proposed budget there will be about 70% of the assets in Fair to Poor condition after 10 years and 16% in Very Poor to Close to Failure condition after 20 years, as indicated in the chart below
To maintain a satisfactory level of condition (Fair), as indicated by the optimal budget, additional funding of about $25,000 per annum is required.
0.0
0.5
1.0
1.5
2.0
2.5
3.0
3.5
4.0
0 5 10 15 20
Co
nd
itio
n
Year
Footpath Condition for Budget Options
LTFP
Maintain Fair Condition
Coorong District Council - Roads Asset Management Plan 2018
24
20 year condition profile for proposed LTFP
5.2 Committed Funding
The current LTFP allows for the following funding on average per annum over 10 years. Refer Appendix A for further details.
Sealed Road Unsealed Road Kerb and Channel Footpath
$1,077,500 $1,286,300 $110,800 $53,500
5.3 Financial Ratios
Asset Consumption Ratio:
This ratio seeks to highlight the aged condition of a local government’s stock of physical assets. If a local government is responsibly maintaining and renewing / replacing its assets in accordance with a well prepared asset management plan, then the fact that its Asset Consumption Ratio may be relatively low and/or declining should not be cause for concern – providing it is operating sustainably.
Asset Consumption Ratio= Depreciated Replacement Cost of Depreciable Assets Current Replacement Cost of Depreciable Assets
Purpose: This ratio measures the extent to which depreciable assets have been consumed by comparing their written down value to their replacement cost.
Standards: Standard is met if the ratio can be measured and is 50% or greater (0.50 or >). Standard is improving if the ratio is between 60% and 75% (0.60 and 0.75).
Current Asset Consumption Ratio
Asset Group Current
Replacement Cost Depreciated
Replacement Cost Ratio
Sealed Roads 64,662,546 56,808,899 88%
Unsealed Roads 145,925,224 129,257,981 89%
Kerb and Channel 8,211,109 5,884,566 72%
0%
10%
20%
30%
40%
50%
60%
70%
80%
0 5 10 15 20
Qu
anti
ty
Year
Footpath Condition
Score 1
Score 2-3
Score 4-EOL

Coorong District Council - Roads Asset Management Plan 2018
25
Asset Group Current
Replacement Cost Depreciated
Replacement Cost Ratio
Footpaths 2,567,222 1,902,600 74%
Totals 221,366,101 193,854,046 88%
Asset Renewal Funding Ratio
This ratio indicates whether the local government has the financial capacity to fund asset renewal as required, and can continue to provide existing levels of services in future, without additional operating income; or reductions in operating expenses.
The ratio is calculated from information included in the local government’s Long Term Financial Plan and Asset Management Plan; not the Annual Financial Report. For the ratio to be meaningful, a consistent discount rate should generally be applied in Net Present Value (NPV) calculations.
Asset Renewal Funding Ratio = NPV of Planned Capital Renewals over 10 years NPV of Required Capital Expenditure over 10 years
Purpose: This ratio is a measure of the ability of a local government to fund its projected asset renewal / replacements in the future.
Note: A ratio of between 95 and 105% indicates that the local government’s Long Term Financial Plan makes adequate provision to maintain existing levels of service and renew or replace assets. The 95 – 105% measurement is a suitable target if the Asset Sustainability Ratio falls within the 90 to 100% target and the Asset Consumption Ratio falls within the target range of 50 to 75%. A ratio between 50 and 75% indicates that the local government may not be making adequate provision for the future renewal or replacement of its asset base.
Standards: Standard is met if the ratio is between 75% and 95% (or 0.75 and 0.95). Standard is improving if the ratio is between 95% and 105% (or 0.95 and 1.05), and the ACR falls within the range 50% to 75%.
Asset Group Required Capital Renewals over 10
years ($)
Planned Capital Renewal over 10
years ($)
Ratio
Sealed Roads 16,000,000 10,775,000 67%
Unsealed Roads 18,000,000 12,863,900 71%
Kerb and Channel 2,240,000 1,110,000 50%
Footpaths 790,000 534,000 68%
Totals 37,030,000 25,282,900 68%

Coorong District Council - Roads Asset Management Plan 2018
26
6 Action Plan
6.1 AM Document Register
This RAMP is to be read with the following associated Coorong District Council documents:
2016–2020 Strategic Management Plan
Asset Management Policy (Revised May 2016)
Asset Management Strategy (February 2010)
Risk Management Policy
Sustainable Coorong Action Plan 2009-2012
30 Year Plan for Greater Adelaide
6.2 AM Practice Improvements
6.2.1 Performance Measures
The effectiveness of the Asset Management Plan can be measured in the following ways:
The degree to which the required cash flows identified in this AMP are incorporated into Council’s Long Term Financial Plan and Strategic Management Plan;
The degree to which the detailed works programs, budgets, business plans and organisational structures take into account the ‘global’ works program trends provided by the AMP; and
The performance of Council against the Strategic Levels of Service documented in Section 3.
6.2.2 Improvement Plan
The asset management improvement plan generated from this Asset Management Plan shown in the following table.
Craig and David to review and update content and timlelines
Task No
Task Responsibility
Resources Required
Timeline
1. Obtain Council approval of this Plan. DIA In-house June 2017
2. Review activities and response levels of service for proactive and reactive maintenance defects.
DIA In-house Resources &
Budget Allocation
June 2017
3. Assess the structure and resources in the Infrastructure & Assets department, to ensure that the RAMP is implemented.
DIA In-house June 2012
4. Implement a process to update the Asset register for gifted or new assets which have been constructed during the current financial year.
DIA In-house Resources &
Budget Allocation
On-going
5. Implement a process for assets which are renewed or upgraded during the financial year to be updated in Council’s current Asset Register and
MCS and DIA
In-house Resources &
Budget Allocation
On-going

Coorong District Council - Roads Asset Management Plan 2018
27
report on annual financial movements to inform Council’s Finance System.
6. Undertake a complete condition assessment of Council’s road network and update condition information in the Asset Register.
DIA In-house Resources &
Budget Allocation
Dec 2018
7. Test the current levels of service, to measure if these are achievable within the context of Council’s current human and financial resources.
DIA In-house Resources &
Budget Allocation
Dec 2012
8. Develop a suite of engineering standards for maintenance, renewal, upgrade and new assets.
DIA In-house Resources &
Budget Allocation
Dec 2012
9. Review how maintenance requests and response time data is captured and recorded.
DIA In-house Resources &
Budget Allocation
Dec 2012
10. Develop a program for undertaking regular traffic counts and with data integrated and updated in Council’s road asset register.
DIA In-house Resources
On-going
11. Document Council’s decision making framework & criteria for capital works prioritisation.
DIA In-house Resources
Dec 2012
12. Develop a review process to assess existing (live) Road, Kerb & Channel & Footpath condition compared to the prediction modelling outputs.
DIA In-house Resources &
Budget Allocation
On-going
13. Link the RAMP to Council’s Budgeting process, so that impacts of funding levels can be addressed prior to funding allocation
MCS and DIA
In-house Resources &
Budget Allocation
June 2018
14. Undertake an asset inventory and condition inspection of all street furniture on Council’s road network.
DIA In-house Resources &
Budget Allocation
Jun 2015
15. Undertake an asset inventory and condition inspection of all signage on Council’s road network.
DIA In-house Resources &
Budget Allocation
Jun 2015
16. Develop and implement a recording method, so that all identified defects are entered into Council’s database with the identification date.
DIA In-house Resources &
Budget Allocation
Jun 2013
17. Develop and implement a work-completion process so that all work orders are closed out with the appropriate finish dates. This is critical to ensure that Council can demonstrate their compliance with the nominated performance standards
DIA In-house Resources &
Budget Allocation
Jun 2016
18. Formalise and adopt Council’s patrol grading program for unsealed roads.
DIA In-house Resources
On-going
19. Document and adopt a formalised proactive inspection program for Council’s roads, footpath and kerb network. Note: this activity may require either a review of existing staff activities or additional staff to undertake these inspections.
DIA In-house Resources &
Budget Allocation
Jun 2013
DIA = Director Infrastructure & Assets. MCS = Manager Corporate Support
Coorong District Council - Roads Asset Management Plan 2018
28
6.2.3 Monitoring and Review Procedures
This Asset Management Plan will be reviewed during annual budget preparation and amended to recognise any changes in service levels and/or resources available to provide those services as a result of the budget decision process.
The Asset Management Plan has a life of 4 years and is due for revision and updating within 2 years of each Council election.
Coorong District Council - Roads Asset Management Plan 2018
29
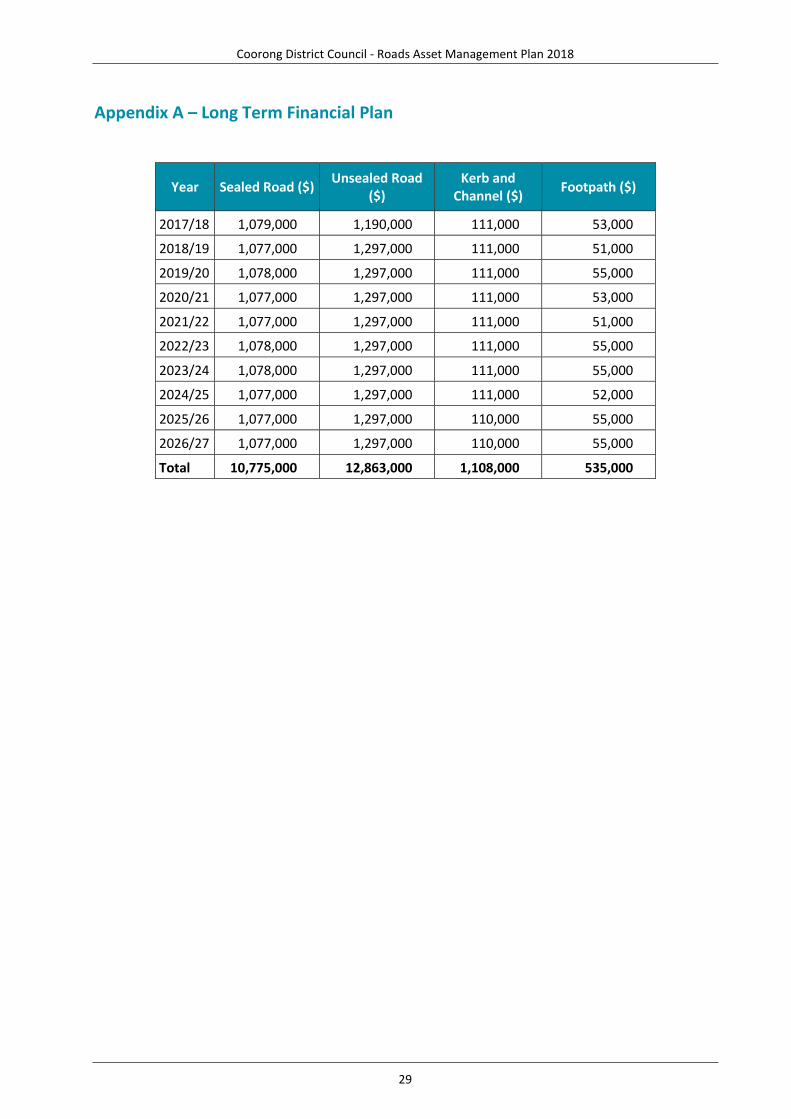
Appendix A – Long Term Financial Plan
Year Sealed Road ($) Unsealed Road
($) Kerb and
Channel ($) Footpath ($)
2017/18 1,079,000 1,190,000 111,000 53,000
2018/19 1,077,000 1,297,000 111,000 51,000
2019/20 1,078,000 1,297,000 111,000 55,000
2020/21 1,077,000 1,297,000 111,000 53,000
2021/22 1,077,000 1,297,000 111,000 51,000
2022/23 1,078,000 1,297,000 111,000 55,000
2023/24 1,078,000 1,297,000 111,000 55,000
2024/25 1,077,000 1,297,000 111,000 52,000
2025/26 1,077,000 1,297,000 110,000 55,000
2026/27 1,077,000 1,297,000 110,000 55,000
Total 10,775,000 12,863,000 1,108,000 535,000