Embed Size (px)
Citation preview

Cooperatives in Economic Development A survey of Economic Development Professionals in
Minnesota and Wisconsin
James Janke
David Trechter
Survey Research Center Report 2014/10
April 2014

Staff and students working for the Survey Research Center at UW-River Falls were instrumental
in the completion of this study. We would like to thank Denise Parks, Shelly Hadley, Caleb
Riedeman, Christine Leiby, Kaylin Spaeth, Katrina Barrett, and Bryce Krull. We gratefully
acknowledge their hard work and dedication.
The SRC would also like to thank Kevin Edberg and Leslie Watson of Cooperative Development
Services for their valuable guidance and input throughout the project.
Special thanks to Eric Ewald of the Economic Development Association of Minnesota, Megan
Purtell of the Wisconsin Economic Development Association and Jim Roth of the Metropolitan
Consortium of Community Developers for distributing the survey invitation and reminder to the
members of their organizations.
Finally, we would like to thank the economic and community development professionals in
Minnesota and Wisconsin who took the time to complete their questionnaires.

Table of Contents
Executive Summary ................................................................................................................ 3
Survey Purpose ....................................................................................................................... 5
Survey Methods ...................................................................................................................... 5
Organizational Characteristics ................................................................................................ 7
Engagement with Cooperatives ............................................................................................ 17
Conclusions ........................................................................................................................... 26
Appendix A – Non-response Bias Test ................................................................................. 28
Appendix B –“Other” Written Responses ............................................................................ 29
Appendix C – Quantitative Summary of Responses by Question ........................................ 37

3
Executive Summary
The purpose of this study was to learn more about cooperatives’ role in economic and
community development programs in communities throughout Wisconsin and Minnesota.
The survey was administered online via Qualtrics survey software. In late March, 2014 and
early April, 2014 invitations were sent to the members of the Economic Development
Association of Minnesota (EDAM), members of the Wisconsin Economic Development
Association (WEDA), members of the Metropolitan (Twin Cities, MN) Consortium of
Community Developers (MCCD), the University of Minnesota-Extension regional community
economics educators, and University of Wisconsin-Extension county educators in the
Community, Natural Resource, and Economic Development program area. The initial invitation
was followed by a reminder one week later. The SRC received 149 replies, which represents a 13
percent response rate. The results provided in this report are expected to be accurate to within
plus/minus 7.5 percent with 95 percent confidence.
Respondents’ Core Services
• Respondents most frequently served rural and urban communities rather than suburban
communities, multi-county regions, rural regional centers, or an entire state. The highest
percentage of respondents served existing small businesses, followed by existing mid-
size or large businesses, public sector agencies, and start-up small businesses.
• Community revitalization and new business development were more frequently in the
mix of services provided by respondents compared to other services such as
research/analysis, infrastructure development, housing, or technical assistance.
• The highest priority goals among respondents are retaining jobs and creating new jobs.
Respondents said their most common types of projects involved small manufacturing and
retail businesses. Housing and agriculturally-related projects were less frequently listed.
• Over two-thirds of respondents said they help start new businesses. The largest
proportion of respondents who help start new businesses said they do not recommend an
ownership model to their clients. Among those who do, the largest percentage suggested
LLCs and S Corps.
• Over 70 percent of respondents are moderately concerned or very concerned about the
negative impacts of inadequate succession planning in their service areas.
Knowledge of Cooperatives
• Half of respondents rated their knowledge of the cooperative business model as no
greater than “low.” A third of respondents said the interest in cooperative businesses in
their service areas is holding steady, but four in ten said they are not sure.
• Half of respondents said they actively serve cooperatives, and over half of respondents
anticipate future opportunities to serve cooperative businesses. Cooperatives comprise
no more than 5 percent of the client base of a large majority of respondents. Respondents

4
are not likely to be aware of developers who specialize in cooperatives or to have pursued
educational programs about cooperatives. Four in ten respondents agreed or strongly
agreed that they would like to expand their abilities to serve cooperatives.
• Half said cooperatives have been suggested as a solution to a community or economic
development challenge in their service areas. The most frequent types of suggested
cooperatives are retail grocery stores and food production.
• Over half of respondents said cooperatives are barely visible or invisible in the business
community at the local and national level and among community and economic
development professionals. Gaps in knowledge about and awareness of cooperatives
were cited as the most common impediment to establishing cooperatives in their service
areas.
Conclusions
The results identified an interrelated challenge and opportunity for the use of the cooperative
business model among community and economic development professionals. Multiple questions
revealed the lack of knowledge and awareness about the cooperative business model, and that
cooperatives are not very visible among the business community and among community and
economic development professionals. Yet over half of respondents anticipate future
opportunities to serve cooperatives, and 40% would like to expand their abilities to serve
cooperatives, suggesting an opening for cooperative development professionals to expand
awareness and use of cooperatives in community and economic development projects.

5
Survey Purpose
The purpose of this study was to learn more about cooperatives’ role in economic and
community development programs in communities throughout Wisconsin and Minnesota. The
survey was sponsored by Cooperative Development Services (CDS), which is a nonprofit
cooperative development center that serves the Upper Midwest. Officials from CDS chose to
work with the Survey Research Center (SRC) at the University of Wisconsin-River Falls to
gather this information.
Survey Methods
The survey was administered online via Qualtrics survey software. In late March, 2014 and
early April, 2014 invitations were sent to the members of the Economic Development
Association of Minnesota (EDAM), members of the Wisconsin Economic Development
Association (WEDA), members of the Metropolitan (Twin Cities, MN) Consortium of
Community Developers (MCCD), the University of Minnesota-Extension regional community
economics educators, and University of Wisconsin-Extension county educators in the
Community, Natural Resource, and Economic Development program area.
Total number of potential respondents from these groups is approximately 1,158.
• EDAM: 600
• WEDA: 448
• MCCD: 48
• University of Minnesota-Extension: 8
• University of Wisconsin-Extension: 54
Since there is some overlap among the membership of these groups, some potential respondents
received multiple invitations. Instructions asked recipients to submit a single response if they had
received more than one invitation.
The initial invitation was followed by a reminder one week later.
The SRC received 149 replies, which represents a 13 percent response rate. The results provided
in this report are expected to be accurate to within plus/minus 7.5 percent with 95 percent
confidence.
Any survey has to be concerned with “non-response bias.” Non-response bias refers to a
situation in which people who do not return a questionnaire have opinions that are systematically
different from the opinions of those who return their surveys. Based upon a standard statistical
analysis that is described in Appendix A, the Survey Research Center concludes that non-
response bias is not a significant concern for this survey.
In addition to numeric data, respondents provided additional written answers and comments.
Appendix B contains the written responses.
Appendix C contains a copy of the survey questionnaire with a complete quantitative summary
of responses by question.

6
The SRC performed statistical tests to see if there were significant differences in the responses of
the survey questions based on the state served and the type of region served. In statistics, a result
is called statistically significant if it is unlikely to have occurred by chance. Statistical
significance is expressed as a probability that the difference is not true. A commonly used
probability standard is .05 (5%). Statistical significance at the .05 level indicates a 5 in 100
probability that the observed difference across demographic groups for a given variable is not
real. It does not mean the difference is necessarily large, important, or significant in the common
meaning of the word. Given a sufficiently large sample, even small differences of opinion across
demographic groups will be statistically significant.
The report will identify those instances where there were differences in the response pattern
within a particular demographic group that would have affected the interpretation of the results.

7
Organizational Characteristics
Respondents were asked to indicate the state or states they serve. The results are shown in Chart
1. Two-thirds of respondents said they serve Wisconsin, about four in ten serve Minnesota, and
eight percent serve other states. Although respondents could choose more than one state, the
results indicate that 92% of respondents serve a single state. Other service areas included Iowa,
Illinois, Michigan, Florida, and nationwide coverage.
8
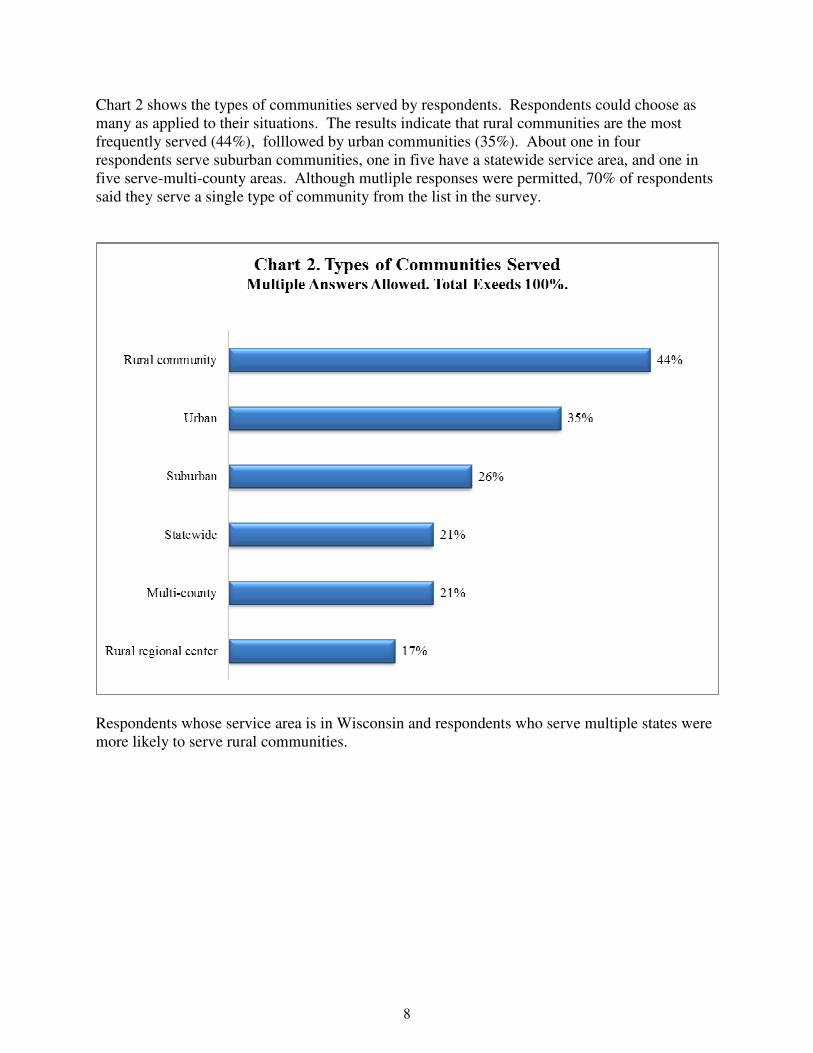
Chart 2 shows the types of communities served by respondents. Respondents could choose as
many as applied to their situations. The results indicate that rural communities are the most
frequently served (44%), folllowed by urban communities (35%). About one in four
respondents serve suburban communities, one in five have a statewide service area, and one in
five serve-multi-county areas. Although mutliple responses were permitted, 70% of respondents
said they serve a single type of community from the list in the survey.
Respondents whose service area is in Wisconsin and respondents who serve multiple states were
more likely to serve rural communities.

9
A similar question asked respondents to indicate the types of clients they serve. Respondents
could choose as many client types as applied. As shown in Chart 3, existing small businesses are
served by about three-fourths of respondents. Roughly 60% of respondents said they serve
existing mid-size or large businesses, public sector clients, and start-up small businesses. About
half the respondents serve start-up entrepreneurs or microenterprises and nonprofit service
providers. Members of low-income communities were indicated by slightly less than half of
respondents. Relatively few respondents said they serve members of ethnically or culturally
diverse communities.
Respondents said they typically serve more than one type of client; 90% chose more than one
client category. Forty-five percent indicated that they serve between two and four types of clients
from the list.
Respondents whose service area is in Wisconsin and respondents who serve multiple states were
more likely to have public sector/public agencies in their clientele.
Respondents with statewide coverage are more likely to serve members of ethnically or
culturally diverse communities. A smaller proportion of respondents who serve urban and
suburban communities serve start-up entrepreneurs/microenterprises and start-up small
businesses. Respondents who serve rural communities and rural regional centers are more likely
to include public agencies in their clientele. Nonprofit direct service providers were more often
among the clientele groups of respondents who serve rural communities.

10
When asked to indicate the types of services they provide, Chart 4 shows the most frequently
chosen services were community revitalization and new business development. Half of
respondents said they provide research and analysis services. Half or slightly less said they
provide market analysis/feasibility studies, business training/technical assistance, and are
involved in public financing/investment and infrastructure development projects.
Real estate site development and mixed use development were farther down the list with 37%
and 30% respectively. Between 15% and 22% of respondents said they provide services related
to multi-family housing, job training/workforce development, and single-family housing.
Nearly all respondents (93%) chose more than one type of service from the list. Fifty-eight
percent said they most commonly provide between two and five types of services. Some services
were more likely be part of clusters offered by the respondent. Those who provide job training
and workforce development were more likely to provide business training or technical
assistance. Mixed-use, single-family housing and multi-family housing formed another cluster.
Respondents who provide market research and/or feasibility studies are likely to provide research
and analysis services. Public finance/investment, community revitalization, and infrastructure
development form a fourth cluster.
Respondents whose service area includes only Minnesota were more likely to work on single
family and multi-family housing projects.

11
Respondents who serve rural communities were more likely to provide research and analysis
services and less likely to provide real estate site development services. Respondents with urban
service areas were more likely to provide services related to mixed-use development and multi-
family housing. A higher percentage of respondents who serve urban areas and suburban areas
included single-family housing among their services. Respondents who have multi-county
service areas were less likely to include community revitalization among their services.

12
As shown in Chart 5, the most common types of businesses or projects were small manufacturing
and retail. These two business types were the only ones indicated by more than half of the
respondents. Slightly less than half of respondents said their projects include large
manufacturing or restaurants/hospitality. “Green” industry businesses were served by about a
third of respondents. Between 20% and 30% of respondents said their projects include
information technology related service businesses, infrastructure development, affordable
housing, and social enterprises. Relatively few respondents said they commonly work on projects
involving market rate housing or agricultural producers.
Ninety percent of respondents said they serve multiple types of businesses/projects, with 52%
serving between two and four types from the list.
Respondents who serve only Minnesota were more likely to include affordable housing among
their projects. Respondents who serve multiple states were more likely to serve large agricultural
producers and large manufacturing firms. Wisconsin respondents were more likely to include
social enterprises among their projects.
Respondents with suburban service areas were more likely to have indicated they work on
market rate housing, affordable housing, and large manufacturing. Respondents with urban
service areas were more likely to have included affordable housing. A higher percentage of
respondents who serve rural communities work on smallholder farming projects but are less
likely to work on information technology/software projects. Respondents with multi-county
service areas were more likely to include projects involving large agricultural producers.

13
Respondents were asked if they help start new businesses. Chart 6 shows that two-thirds of all
respondents said one of their functions includes helping new business start-ups.
Respondents who serve only Wisconsin were more likely to say they help start new businesses.

14
Respondents who answered that they help business start-ups were asked a follow-up question
about the type of ownership model they most often recommend, and the results are shown in
Chart 7. The largest percentage of respondents (43%) said they do not recommend an ownership
model. Among those who make a recommendation, by far and away they most often
recommend a limited liability company/S corporation structure. These economic development
professionals rarely recommend other models such as a not-for-profit corporation,
proprietorship/partnership, investor-owned, cooperative, or C corporation.
15
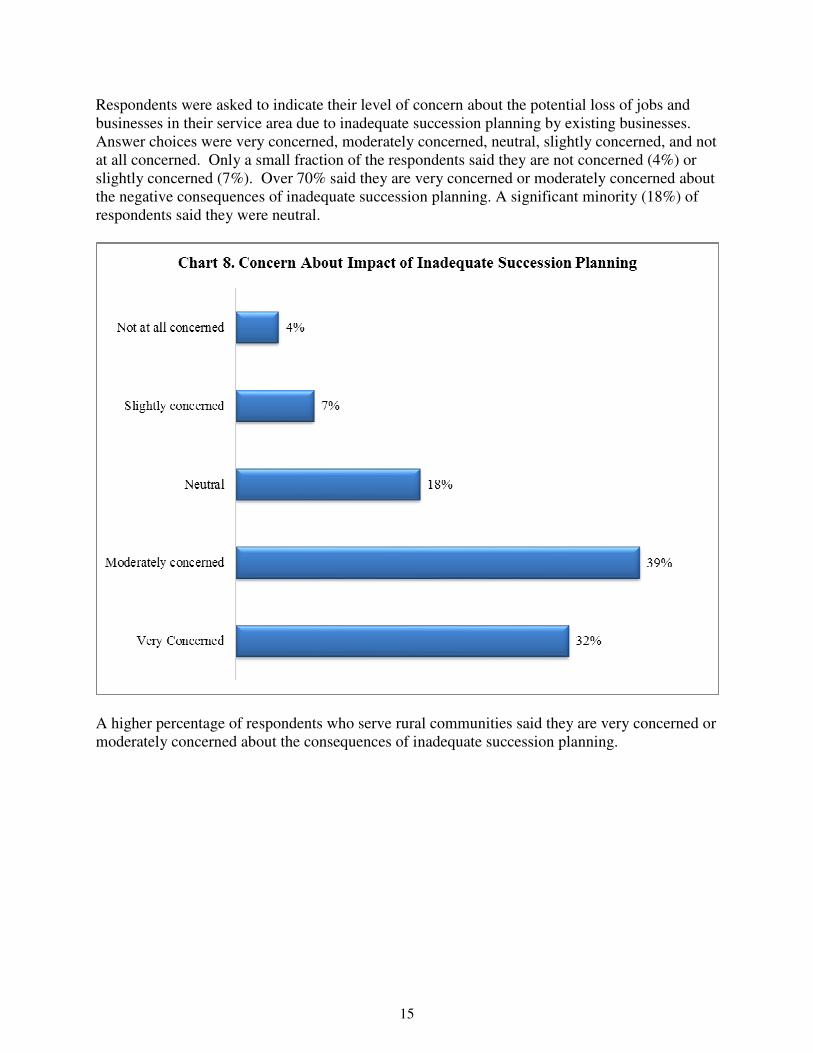
Respondents were asked to indicate their level of concern about the potential loss of jobs and
businesses in their service area due to inadequate succession planning by existing businesses.
Answer choices were very concerned, moderately concerned, neutral, slightly concerned, and not
at all concerned. Only a small fraction of the respondents said they are not concerned (4%) or
slightly concerned (7%). Over 70% said they are very concerned or moderately concerned about
the negative consequences of inadequate succession planning. A significant minority (18%) of
respondents said they were neutral.
A higher percentage of respondents who serve rural communities said they are very concerned or
moderately concerned about the consequences of inadequate succession planning.

16
Respondents were shown a list of 10 community and economic development goals and asked to
select their top four goals in rank order. For purposes of analysis, the SRC assigned four points
to each respondent’s top priority, three points to the second priority, two points to the third
priority and one point to the fourth priority. The SRC calculated the mean number of priority
points for each goal.
The results are shown in Chart 9 and indicate that retaining existing jobs was the highest ranked
goal with a mean score of 2.66 and accounted for 38% of the highest importance selections and
29% of the second-highest selections. Retaining existing jobs was included among their top-four
choices by 84% of respondents.
Creating new jobs was the second-highest goal with a mean score of 2.17. It had a third of the
second-place selections and was included in the top-four choices by 78% of respondents.
Community engagement for building a strong local economy ranked as the third most important
goal with a mean score of 1.70 and was included in their top-four by 64% of respondents.
Economic diversification was the fourth most important goal with a mean score of 1.07 and was
among the top-four choices by 54% of respondents.
Overall priorities were the same regardless of the type of area served.

17
Engagement with Cooperatives
Chart 10 shows there is great room for improvement among economic development
professionals’ knowledge about the cooperative business model. While few (6%) respondents
said they had no knowledge about cooperatives, nearly half (45%) said their knowledge level is
low.
Respondents from rural regional centers and who serve multi-county regions rated their
knowledge of the cooperative business model higher.

18
At least half of respondents said the following types of cooperatives are present in their service
areas: credit unions, agricultural producer cooperatives, food cooperatives, and rural electric
cooperatives. Among this group, credit unions and agricultural producer cooperatives stood out
at the top with 76% and 72% respectively. Six in ten respondents said there are food
cooperatives in their service area, and 55% said their service area has a rural electric cooperative.
Less than half of respondents said there are mutual insurance companies or purchasing
cooperatives (44% each) present in their service areas.
Between 25% and 32% of respondents said housing cooperatives and health care cooperatives
are present in their areas.
Less frequent were childcare cooperatives, worker cooperatives, and other consumer
cooperatives.
Respondents who serve rural communities were more likely to say that agricultural producer
cooperatives are present in their service areas and less likely to say that housing cooperatives are
in their service areas. A higher percentage of respondents with urban service areas said food
cooperatives are present in their service areas. Respondents who serve rural regional centers,
multi-county regions, and statewide areas were more likely to say that purchasing cooperatives
are in their service areas. Mutual insurance companies are more likely to be in multi-county and
statewide service areas.

19
When asked to assess the trend of interest in cooperative businesses in their service areas, Chart
12 shows the largest proportion of respondents said they are not sure (43%). About a third said
interest in cooperatives is holding steady, while one in five said interest is expanding. Only 2%
said interest in cooperatives is declining.
A higher percentage of respondents who serve multi-county regions said that interest in
cooperatives is expanding.

20
Respondents were next asked a series of related questions about their experience with
cooperatives. Answer choices were yes, no, and not sure. The results are shown in Chart 13.
• Less than half of respondents are aware of employee ownership as a succession strategy
(42%).
• Half said their organization’s services have not been sought for assisting existing
cooperatives.
• Half of respondents said their organization doesn’t actively serve cooperatives.
• Over 60% of respondents have not been contacted for help to form a new cooperative.
• A majority of respondents are not aware of developers who specialize in cooperative
businesses (60%).
• Although respondents reported somewhat weak links to cooperatives in their current
activities, over half of respondents anticipate future opportunities to serve cooperatives
(56%). As shown earlier, half said their knowledge of cooperatives was no better than
“low,” which presents an opportunity for educational outreach to the 72% of respondents
who have not pursued educational opportunities about cooperatives in the past two years.
Respondents who serve multiple states were more likely to say that they actively serve
cooperative businesses.
A higher percentage of respondents with multi-county service areas said they actively serve
cooperative businesses and they have pursued coopertive education opportunities in the past two
years. Respondents with statewide service areas were more likely to say their services have been
sought for forming new cooperatives.

21
Chart 14 indicates that respondents are evenly split when asked if cooperatives have been
suggested as a solution to a community or economic development challenge in their service
areas.

22
Respondents who said that cooperatives had been suggested as a solution to a community or
economic development challenge were asked to write a description of the situation. Fifty-seven
respondents entered a reply in the text box provided. The SRC analyzed the responses and
created 18 topical categories plus a “miscellaneous” category. The SRC split responses that
included more than one topic, resulting in 70 total responses. As shown in Table 1, retail grocery
cooperatives (27%) and cooperatives related to food production (14%) were the most frequently
mentioned specific types of cooperatives included in the responses.
Table 1. Types of cooperatives suggested for local
community or economic development challenges.
Category Count %
Grocery retail 19 27%
Food production 10 14%
Housing 6 9%
Community revitalization/improvement 5 7%
Employee ownership (not specified) 3 4%
Artisans 2 3%
Broadband Internet 2 3%
Elderly care 2 3%
Hardware retail 2 3%
Insurance 2 3%
Bicycle program 1 1%
Energy production 1 1%
Entertainment 1 1%
Lodging 1 1%
Manufacturing 1 1%
Pharmacy 1 1%
Purchasing 1 1%
Other retail/service 3 4%
Miscellaneous 7 10%
Total 70 100%

23
Respondents were next asked to indicate the percentage of their clients in the past ten years that
were cooperatives. The results in Chart 15 indicate that a small fraction of the clients of the
respondents utilized the cooperative business model. A large majority (85%) of respondents said
cooperatives comprise no more than 5% of their clients. Among the remaining respondents, most
of the respondents said cooperatives were between 6% and 10% of their clientele.
24
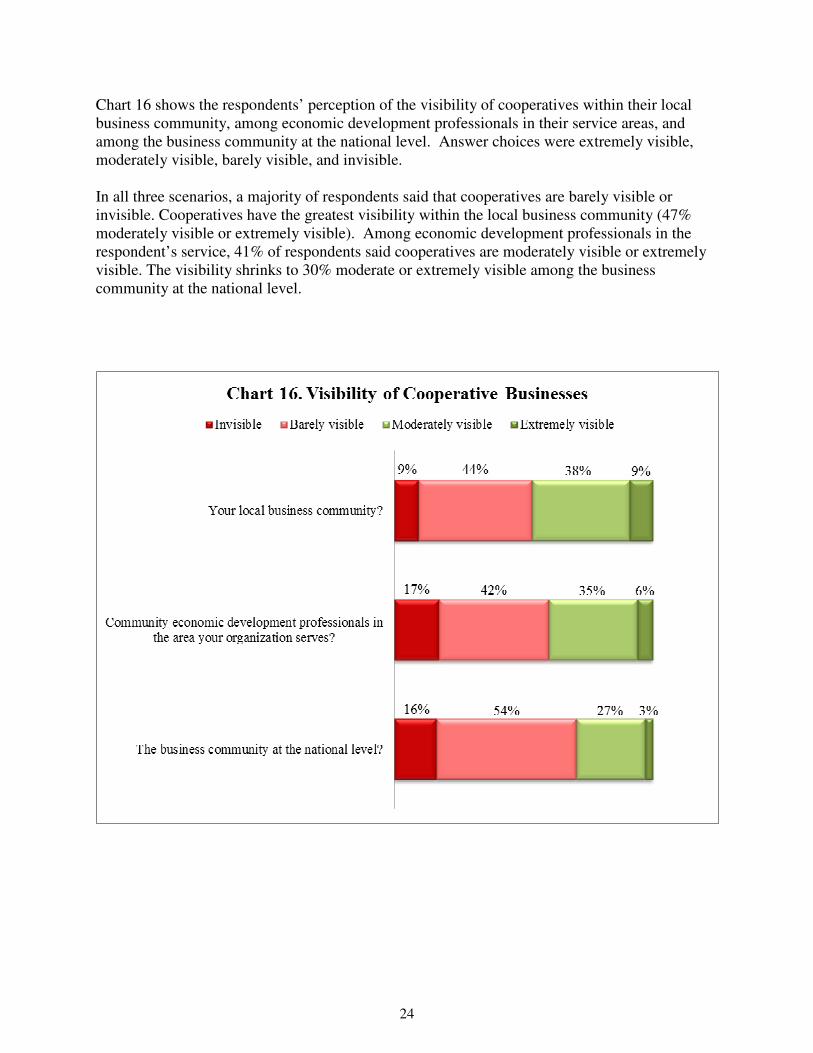
Chart 16 shows the respondents’ perception of the visibility of cooperatives within their local
business community, among economic development professionals in their service areas, and
among the business community at the national level. Answer choices were extremely visible,
moderately visible, barely visible, and invisible.
In all three scenarios, a majority of respondents said that cooperatives are barely visible or
invisible. Cooperatives have the greatest visibility within the local business community (47%
moderately visible or extremely visible). Among economic development professionals in the
respondent’s service, 41% of respondents said cooperatives are moderately visible or extremely
visible. The visibility shrinks to 30% moderate or extremely visible among the business
community at the national level.

25
When asked if they would like to expand their ability to serve cooperative businesses,
respondents gave an uncertain response. Answer choices were strongly agree, agree, neither
agree nor disagree, disagree, and strongly disagree. The largest percentage (53%) said they
neither agree nor disagree. Among those who had an opinion, the largest portion agreed (33%
agree plus 6% strongly agree).

26
Impediments to Establishing New Cooperative Businesses
At the end of the survey respondents were asked an open-ended question to describe the
impediments they see to establishing new cooperative businesses in their service areas. A total
of 73 responses were entered into the text block provided on the survey. The SRC analyzed the
contents and created 8 topical categories plus an “other” category.
The results are summarized in Table 2. The most commonly cited impediment was lack of
knowledge and awareness about cooperatives, which was listed by more than a third of the
respondents. The following are examples of comments about lack of knowledge/awareness:
“Lack of knowledge about the process, advantages and disadvantages. Concern of general
population that there is a lot of 'red tape', paper work, and legal issues involved.”
“Understanding of how to organize.”
Tied for second place were comments related to lack of interest/demand (17%) and
capital/financing issues (15%).
Table 2. Most Common Impediment to Establishing
Cooperatives.
Impediment Count %
Knowledge/Awareness about cooperatives 26 36%
Lack of interest/demand 12 16%
Capital/Financing 11 15%
None/Don’t know/Not sure 7 10%
Collaboration/cooperation issues 5 7%
Human capital (time, staff, leadership) 5 7%
Cultural issues 2 3%
Politics 2 3%
Other 3 4%
Total 73 100%

27
Conclusions
The results identified an interrelated challenge and opportunity for the use of the cooperative
business model among community and economic development professionals.
The challenge revealed in multiple questions is the lack of knowledge and awareness about the
cooperative business model. About half of respondents rated their knowledge about cooperatives
as no better than “low” and said that their services are not frequently sought for cooperative
projects. Additionally, respondents said that cooperatives are not very visible among the
business community and among community and economic development professionals.
At the same time over half of respondents said they anticipate future opportunities to serve
cooperatives, and 40% would like to expand their abilities to serve cooperatives. This indicates
an opportunity for cooperative development professionals for additional consideration and use of
cooperatives in community and economic development projects.

28
Appendix A – Non-response Bias Test
Any survey has to be concerned with “non-response bias.” Non-response bias refers to a
situation in which people who do not return a questionnaire have opinions that are systematically
different from the opinions of those who return their surveys. For example, suppose most non-
respondents said their engagement with cooperatives was low, whereas most of those who
responded said their engagement with is high. In this case, non-response bias would exist, and
the raw results would overstate the level of engagement with cooperatives.
The standard way to test for non-response bias is to compare the responses of those who respond
to the first invitation to those who respond to the second invitation. Those who respond to the
second invitation are, in effect, a sample of non-respondents (to the first invitation), and we
assume that they are representative of that group. In this survey, there were 89 responses to the
first invitation and 60 to the second invitation. There are 82 variables in the questionnaire, and
the SRC found only 12 variables with statistically significant differences. Table A1 indicates
that the differences are few and are not systematic.
Respondents to the first invitation were more likely to:
• Serve a rural regional center or to serve a multi-county area
• Serve large agricultural producer cooperatives and nonprofit direct service providers
• Not recommend an ownership model to clients
• Be aware of worker cooperatives, rural electric cooperatives and mutual insurance
companies in their service areas
Respondents to the second invitation were more likely to:
• Serve other cooperatives not listed among the survey choices
• Rank creating economic opportunities for disadvantaged/underserved populations as a
slightly higher priority
The SRC concludes that there is little evidence that non-response bias is a concern for this
sample.
Table A1 – Statistically Significant Differences Between Responses of First and Second
Invitations
Variable
Statistical
Significance
First
Invitation
Second
Invitation Rural regional center .016 24% 8%
Multi-county .017 28% 12%
Non-profit direct service provider .043 38% 55%
Large agricultural producer cooperatives .022 20% 7%
Other cooperatives .014 6% 18%
Most recommended ownership model - None .024 53% 26%
Economic opps. for disadvantaged/underserved .011 Mean=.43pts. Mean=.77 pts.
Worker cooperatives .038 51% 33%
Rural electric cooperatives .018 63% 43%
Mutual insurance companies .002 54% 28%

29
Appendix B –“Other” Written Responses
Which states does your organization serve? “Other” responses. (12 responses)
• Iowa. (4x)
• Florida. (3x)
• National/nationwide/all. (3x)
• Illinois.
• Michigan.
What type of clients does your organization most commonly serve? Members of ethnically
or culturally diverse communities (please specify). (16 responses)
• All. (3x)
• Latino. (2x)
• Native American/Tribal. (2x)
• African American.
• African American, Latino, Eastern African immigrants.
• African immigrants, Asian, African American, White.
• American Indian, Somali, Hispanic.
• Entrepreneurs of color.
• Immigrant, AA, NA, Latino.
• Latino, African-American.
• Milwaukee.
• MWESB.
What type of clients does your organization most commonly serve? Other, please specify. (5
responses)
• All for profit businesses.
• Citizens of the community.
• Co-op development.
• Diverse cross section of individuals and network actors.
• Tribal Community.
With which type of businesses or projects does your / organization most commonly work?
Other service industry (please specify). (8 responses)
• Healthcare/healthy living. (2x)
• All.
• Architects, contractors.
• Financial.
• Health Care, tourism, agriculture large & small, education leaders, government.
• Hotels.
• Various.
With which type of businesses or projects does your organization most commonly work?
Infrastructure development (please specify). (21 responses)
• Broadband. (3x)
• All modes.
• Arts.

30
• Broadband, roads, airport, rail.
• Brownfields infra.
• Construction.
• Gas and electric utility.
• Grant administration.
• Industrial parks.
• Municipal infrastructure (all).
• Public.
• Public improvements.
• Public investments.
• Roads & bridges.
• Roads, bridges, utilities.
• Rural town and services.
• Sewer & water systems, stormwater management, roadways, pedestrian facilities.
• Sewer, water, storm.
• Street reconstruction.
With which type of businesses or projects does your organization most commonly work?
Other (please specify). (16 responses)
• Any and all businesses within our County.
• Aspiring and emerging inventors.
• Community readiness and organization.
• Financial and housing counseling.
• I do primarily educational programming and organizational development work with
municipal and non-profit organizations.
• Manufacturing.
• Micro entrepreneur.
• Misc. public policy issues.
• None of the above.
• Non-profit.
• Organizational development for communities and non-profits.
• Parks.
• Redevelopmen.t
• Start-ups.
• Urban planning.
• Wholesale, construction.
To your knowledge, which of the following types of cooperatives are present in your service
area? Other, specify. (5 responses)
• Farm credit. (2x)
• Communications.
• Marketing.
• Media/Newspaper.

31
Have cooperatives have been suggested as a solution to a community or economic
development challenge in your community or service area? If "Yes," please describe.
Grocery retail (19 responses)
• A food coop [has] been suggested.
• A retail food cooperative suggested in several areas served. A conversion from company
ownership to employee ownership.
• As an option for locally-supported grocery in downtown Kenosha.
• Basically forming a local food market.
• Smaller cooperative grocer downtown.
• Community food co –op.
• Cooperatives are suggested/explored in areas not presently served by existing firms, or
seen as not satisfactorily serving the public interest in private enterprise. These include
grocery cooperatives.
• Food (grocery store) where there is a "food desert."
• Food coop expansion, building acquisition, new-member-shares sold. Food Cooperatives
are being developed in the area with new cooperatives being developing in Madison and
Baraboo.
• Food industry - grocery stores.
• Food/grocery cooperatives.
• Grocery Store.
• Food.
• I helped convert a small grocery store in a rural community to a local coop. Also, I am
involved with a grocery coop start-up in another community.
• Retail businesses like grocery stores.
• Some of the small communities that we represent have lost their grocery stores and the
cooperative grocery store model has been explored as a way to replace them.
• There are two consumer food cooperatives in my area which are currently organizing and
this model has been suggested in 3-4 different communities as a means of retaining basic
retail such as groceries in small communities. Besides these 'official' cooperatives, there
is great 'talk' about the potential of coops of ag producers to market together, but typically
people talk about something pretty casual in nature.
• We are in need of a downtown grocery store. There is an effort to organize a co-op,
which was founded by eight organic farmers. It's been very challenging to keep them
focused and organized.
• Yahara Grocery Coop in Stoughton.
Food production/distribution (10 responses)
• Feed and supply store (i.e. Farm and Fleet type products)
• Food hub has been investigated to aggregate and distribute local foods.
• Local food related aggregation and distribution systems have been explored.
• Local fruit & vegetable production.
• Our area has been looking at food cooperatives for local food development.
• Producer coops in agriculture.
• Several [people] have been looking into various business models (including coops) that
have had success aggregating/processing/marketing food grown locally.
• Small production agriculture.

32
• There is an interest in food cooperatives to increase access to fresh foods.
• We are actively working with Latino immigrant community to accomplish the creation
and sustainability of farm producer cooperatives.
Housing (6 responses)
• Housing. (2x)
• A housing cooperative was developed to meet a housing need in our community.
• Housing coop considered using Southwest Housing Partnership as adviser.
• Multi-family development.
• Some people are examining successful coops in other areas and other counties, in efforts
to explore what may work here. In particular, a few people will soon go to and tour a
housing coop.
Community revitalization/improvement (5 responses)
• Building of a cooperative between businesses on Main Street. Making an Owners
Association where we all commit and pay a small fee so that the sidewalks are always
cleaned and banners can be hung along the corridor.
• For community-based strategy to counter gentrifying influence of new LRT station.
• New business opportunities on Selby Avenue.
• There is currently an ongoing Community Foundation led project to redevelop an existing
downtown building. The goal is to keep the project community owned and a cooperative
ownership model is being looked at.
• To acquire and renovate vacant buildings.
Employee ownership (not specified) (3 responses)
• Employee owned business transition.
• Looking at worker co-ops for expansion into community.
• Not from outside of my organization but from within - we see this opportunity as a
possible solution for equitable participation for asset and wealth building for those most
times kept out of the loop.
Artisans (2 responses)
• Artists
• Handmade, artisan products (i.e. weavers cooperative).
Broadband (2 responses)
• Broadband.
• Method in which to provide broadband internet service.
Elderly care (2 responses)
• Dissolving county nursing home and exploration of employees/others owning as a
cooperative.
• Elderly care facilities.
Insurance (2 responses)
• Health insurance coop.
• With 20 other nonprofit housing providers we cooperatively own a captive insurance
company that provides property casualty and liability insurance to about 60,000 units

33
across the country. We also just recently started a program to collectively provide
Workers Compensation insurance for a group of us. We are also working on a large real
estate development project with a large set of prospective owners and developers, which
MAY evolve into some kind of cooperative ownership.
Hardware retail (2 responses)
• Local hardware store owner was planning retirement and spoke to me about setting up
employees with ownership shares.
• Need for a local hardware store.
Bicycle
• Cooperative bicycle program
Energy production (1 response)
• A solar PV energy cooperative was proposed. Interest declined in the face of insufficient
revenue from unsupportive utilities (investor owned). Also, third party ownership of
electric generating facilities is not explicitly supported by statute in Wisconsin.
Entertainment (1 response)
• Theater
Lodging (1 response)
• Hotel
Manufacturing (1 response)
• Local manufacturing companies are forming cooperatives with the area high schools and
community colleges to recruit high-skills workforce.
Purchasing (1 response)
• I'm hard pressed to remember specific examples since it's been a few years. One was a
purchasing cooperative for local governments.
Other retail/service (3 responses)
• A locally-owned store as a cooperative venture.
• Established 2 CoCo's in each big city.
• Small business co-working locations, retail.
Miscellaneous (7 responses)
• As an electric cooperative we are actively involved in economic and community
development.
• Discussion with prospective entrepreneurs about whether to serve customers from a
traditional business model or to mobilize potential customers as member-owners of a
cooperative venture.
• It is difficult to answer many of these questions, since we are a non-profit electric utility
organized as a cooperative, so it is the essence of what we do; further, we have economic
development functions as an explicit aspect of our work, unlike other coops.
• NA

34
• Some inquiries to establishing certain types of coops within the community to meet
certain needs.
• We finance and facilitate community and economic development projects.
• We have many coops in our county. Mostly involved in financing activities, producer
training, marketing and input supply.
What would you say is the biggest impediment to establishing new cooperative businesses
in your service area?
Knowledge/Awareness about cooperatives (26 responses)
• Lack of knowledge (3x)
• Awareness
• Awareness of the coop model as a viable option.
• Better awareness of situations when/where it is a good option
• Don't know enough about them to answer
• Education
• Education of how they work and why they are important.
• Interest.
• Knowing how to effectively serve them.
• Lack of interest in the model.
• Lack of knowledge & cooperative business models to use for reference.
• Lack of knowledge & interest
• Lack of knowledge about the process, advantages and disadvantages. Concern of general
population that there is a lot of 'red tape', paper work, and legal issues involved.
• Lack of knowledge on how to start, maintain and grow.
• Lack of knowledge regarding cooperatives.
• Lack of knowledge. Both on a support side and a business side.
• Lack of public and investor knowledge
• Not understanding the business model and its broad applications
• Perceived slow speed to implement.
• The ownership model and political reputation of coops.
• Understanding of how to organize.
• Understanding the business model. Sustainable staffing of competent professional staff
that understand the business model and share the vision for successful cooperative
enterprises.
• Understanding the work necessary to sustain the cooperative model once established
• Unfamiliar concept to most prospective entrepreneurs, most prospective member-owners,
and most employees that might consider a worker-owner model.
Lack of interest/demand (12 responses)
• Desire to open one.
• Finding like-minded individuals who have a need for using the cooperative model.
• I haven't seen the demand in my area of responsibility as Director of LTC's Center for
Entrepreneurship - most clients are small business and sole proprietors.
• Lack of business startups.
• Lack of interest.
• Lack of interest in the model.

35
• Not a lot of interest.
• Off mission.
• Those wishing to establish a new cooperative.
• We don't do business development.
• We just have an issue with starting and growing businesses - period.
• Why would we focus on this over other alternatives? They've been tried but haven't
flourished. No case for them.
Capital/Financing (11 responses)
• Ability to obtain financing.
• Access to capital
• Capital
• Financial impetus; knowledge.
• Financing a cooperative. Securing any and all members’ collateral.
• For food co-operatives, the capital, and organizing interest. Probably only a currently
functioning co-operative could move in. Worker co-ops could be different. We are
looking at the worker owned bike co-ops -- as expansion. And we are looking at the real
estate owner co-operative -- as somewhat tested in Northeast Mpls. What we really need
is a list of all urban business co-operatives.
• Funding. Being organized enough to research and apply for grants.
• Knowledge, and the ability to understand how to provide financing. Who guarantees a
loan?
• Money to pay for the staff time to organize and set up; working capital
• Understanding financial equations
• Understanding the feasibility of a particular venture.
None/Don’t know/Not sure (7 responses)
• ?
• I don't think there are any.
• No idea.
• None. If there is a need, there are not a lot of barriers to establishing a cooperative.
• Not aware of any.
• Not sure there are any.
• Not sure.
Collaboration/cooperation issues (5 responses)
• Fear of competition and sharing ideas with potential competitors.
• Fear of failure and prospects not seeing the value in a partnership.
• Getting people to cooperate and trust each other.
• The inability of disparate interests to come together over a common opportunity, possibly
due to their inability to cooperate at the most basic level in the first place.
• The organization necessary to pull it together and 'sell' the concept; national culture also
glorifies the private entrepreneur.
Human capital (time, staff, leadership) (5 responses)
• An entrepreneur to start and lead it.
• Staffing and time

36
• Time.
• Time restraints. People connections.
• Time, energy, and the people to make it happen.
Cultural issues (2 responses)
• Cultural acceptance among new immigrant groups.
• We work within a community that has unique challenges. There are language and
cultural issues that must be addressed...just translating materials is not enough. New
coop candidates need culturally competent trainers and champions to guide them through
the process. Because a coop is a business they also need guides that understand business;
start-up, growth and viability analysis along the way.
Politics (2 responses)
• A strong conservative viewpoint that does not favor cooperative businesses.
• It is not a political priority.
Other (3 responses)
• Lack of contact.
• Size of the population to use them.
• We would recommend it if that is the best advice for the entrepreneurs we serve.

37
Appendix C – Quantitative Summary of Responses by Question
Cooperatives in Economic Development
Which states does your organization serve? (check all that apply)
39% Minnesota
68% Wisconsin
8% Other (specify) (See Appendix B)
What kind of region does your organization serve? (check all that apply)
35% Urban
26% Suburban
44% Rural community
17% Rural regional center
21% Multi-county
21% Statewide
What type of clients does your organization most commonly serve? (check all that apply)
41% Members of low-income communities
24% Members of ethnically or culturally diverse communities (please specify) (See Appendix B)
54% Start-up entrepreneurs or microenterprises
60% Start-up small businesses
76% Existing small businesses
63% Existing mid-size or large businesses
61% Public sector / public agencies
45% Nonprofit direct service providers
3% Other, please specify (See Appendix B)
What types of community or economic development services do you commonly provide? (check all
that apply)
18% Job training / workforce development
42% Business training or technical assistance
42% Market analysis and/or feasibility studies
50% Research and analysis services
59% New business development
30% Mixed-use development
15% Single-family housing
22% Multi-family housing
46% Public financing or investment
63% Community revitalization
44% Infrastructure development
37% Real estate site development

38
With which type of businesses or projects does your organization most commonly work? (check all
that apply)
18% Housing - market rate
23% Housing - affordable
15% Large agricultural producers
14% Smallholder farming operations
60% Retail
46% Restaurants or other Hospitality
9% Other service industry (please specify) (See Appendix B)
29% IT / Software / Other business services
67% Small manufacturing
47% Large manufacturing
21% Social enterprise (defined as business designed to achieve social mission or public good)
32% “Green” industry or sustainable business initiatives
26% Infrastructure development (please specify) (See Appendix B)
11% Other (please specify) (See Appendix B)
Does your organization help to create new businesses?
69% Yes
31% No
If “Yes”, which ownership model does your organization most often recommend?
4% Investor-owned
5% Proprietorship/partnership
38% LLC / S Corporation
0% C Corporation
7% Not for profit corporation
3% Cooperative
43% None
How concerned are you that inadequate succession planning by retiring business owners could result
in future lost jobs or businesses in your service area?
32% Very concerned
39% Moderately concerned
18% Neutral
7% Slightly concerned
4% Not at all concerned

39
From the following list of community and economic development goals, please rank your top four in
order of importance in your organization’s work. In the box, enter a 1 for the most important goal, 2
for the 2nd most important, 3 for the 3rd most important, and 4 for the 4th most important.
Overall Rank
(#2) Creating new jobs in your area
(#1) Retaining existing jobs in your area
(#4) Diversifying your area economy
(#5) Neighborhood revitalization
(#3) Engaging communities in building a strong local economy
(#6) Creating economic opportunities for disadvantaged or underserved communities
(#8) Expanding housing opportunities
(#7) Improving regional infrastructure
(#9) Increasing regional property value
(#10) Improving food security and local agriculture production
Which of the following best describes the amount of knowledge your organization has about the
cooperative business model?
14% High
35% Medium
45% Low
6% None
To your knowledge, which of the following types of cooperatives are present in your service area?
(check all that apply)
72% Agricultural producer cooperatives
44% Purchasing cooperatives
13% Worker cooperatives
62% Food cooperatives
55% Rural electric cooperatives
18% Other consumer cooperatives
32% Housing cooperatives
26% Health care cooperatives
11% Child care cooperatives
44% Mutual insurance companies
76% Credit unions
3% Other, specify (See Appendix B)
How would you assess the interest in cooperative businesses in your area?
2% Declining
35% Holding steady
19% Expanding
43% Not sure

40
Please answer the following statements about your organization.
Yes No
Not
sure
My organization actively serves cooperative businesses 36% 48% 16%
My organization's services have been sought for forming new cooperatives 28% 64% 7%
My organization's services have been sought for assisting existing
cooperatives 38% 53% 9%
My organization anticipates future opportunities to serve cooperative
businesses in our service area 56% 21% 23%
My organization is aware of developers who specialize in the cooperative
business model 23% 60% 17%
My organization is aware of employee ownership or cooperative
conversions as potential succession strategies for retiring business owners 42% 43% 14%
My organization has pursued cooperative education opportunities in the
last two years 14% 72% 14%
Have cooperatives have been suggested as a solution to a community or economic development
challenge in your community or service area?
49% Yes
51% No
If "Yes," please describe. (See Appendix B)
Roughly what percent of your clients in the past 10 years have been cooperatives?
85% 0% to 5%
12% 6% to 10%
1% 11% to 15%
1% 16% to 20%
1% Over 20%
How would you rate the visibility of cooperative businesses within:
Invisible
Barely
visible
Moderately
visible
Extremely
visible
Community economic development professionals in
the area your organization serves? 17% 42% 35% 6%
Your local business community? 9% 44% 38% 9%
The business community at the national level? 16% 54% 27% 3%

41
My organization would like to expand its ability to serve cooperative businesses.
3% Strongly Disagree
4% Disagree
53% Neither Agree nor Disagree
33% Agree
6% Strongly Agree
What would you say is the biggest impediment to establishing new cooperative businesses in your
service area? (See Appendix B)