Embed Size (px)
Citation preview
This is a translation of the original Japanese document.
If there are any discrepancies between this and the original, the original Japanese document prevails. Cookpad Inc.
Consolidated Earnings Results for the Fiscal Year ended December 31, 2016
[IFRS], unaudited February 9, 2017
Stock listed: Tokyo Stock Exchange Securities code: 2193 URL http://info.cookpad.com/en Representative: Rimpei Iwata, CEO For further information please contact: Morio Inukai, Executive Officer (TEL)03-6368-1000 Scheduled dates Annual shareholder’s meeting: March 23, 2017 Dividend payable date: March 24, 2017 Filing of the statutory financial report: March 24, 2017 Supplementary materials for earnings results: Yes Holding of earnings results briefing: Yes (for institutional investors and analysts)
1. Consolidated Results for the Fiscal Year ended December 31, 2016 (January 1, 2016– December 31, 2016)
(Amounts rounded down to the nearest million yen) (1) Operational Results (% as year-on-year changes)
Sales revenue Operating income Profit before tax Net profit Profit attributable to shareholders of
Cookpad Inc.
Total comprehensive
income Fiscal year ended million yen % million yen % million yen % million yen % million yen % million yen % December 31, 2016 16,845 26.3 5,012 (21.6) 4,151 (36.2) 1,036 (74.8) 933 (77.2) 875 (78.1) December 31, 2015 13,337 - 6,397 - 6,510 - 4,107 - 4,090 - 3,995 -
EPS (Basic)
EPS (Diluted)
ROE attributable to shareholders of Cookpad Inc.
Ratio of profit before tax to
total assets
Ratio of Operating Margin
Fiscal year ended yen yen % % % December 31, 2016 8.71 8.63 4.4 16.0 29.8 December 31, 2015 38.29 37.53 21.2 27.3 48.0
(Reference) Equity in earnings of non-consolidated subsidiaries and affiliates Fiscal year ended December 31, 2016: (1) million yen Fiscal year ended December 31, 2015: (5) million yen
Notes: 1. During the fiscal year ended December 31, 2016, the Company sold all of the shares in a consolidated subsidiary SELECTURE, Inc., which was consequently excluded from the scope of consolidation. In line with this, the Cookpad Group ceased to operate EC business and reclassified it into discontinued operation. The financial statements have been adjusted so that sales revenue, operating income and profit before tax do not include those from discontinued EC business. Operational results for the fiscal year ended December 31, 2015 have also been retrospectively restated.
2. As the Company changed its fiscal year-end, the fiscal year ended December 31, 2014 contained the results of eight months starting from May 1, 2014 through December 31, 2014. Therefore, year-on-year change is not presented.
3. The Company conducted a 1:3 common stock split on July 1, 2015. EPS (Basic) and EPS (Diluted) were calculated assuming that the stock split was effected at the beginning of the fiscal 2015 (January 1, 2015).
(2) Financial Position
Total assets Total equity Equity attributable to shareholders of
Cookpad Inc.
Ratio of equity attributable to
shareholders of Cookpad Inc. to total
assets
Equity attributable to shareholders of
Cookpad Inc. per share
million yen million yen million yen % yen
As of December 31, 2016 24,419 20,939 20,941 85.8 195.10 As of December 31, 2015 27,494 23,396 21,078 76.7 197.17
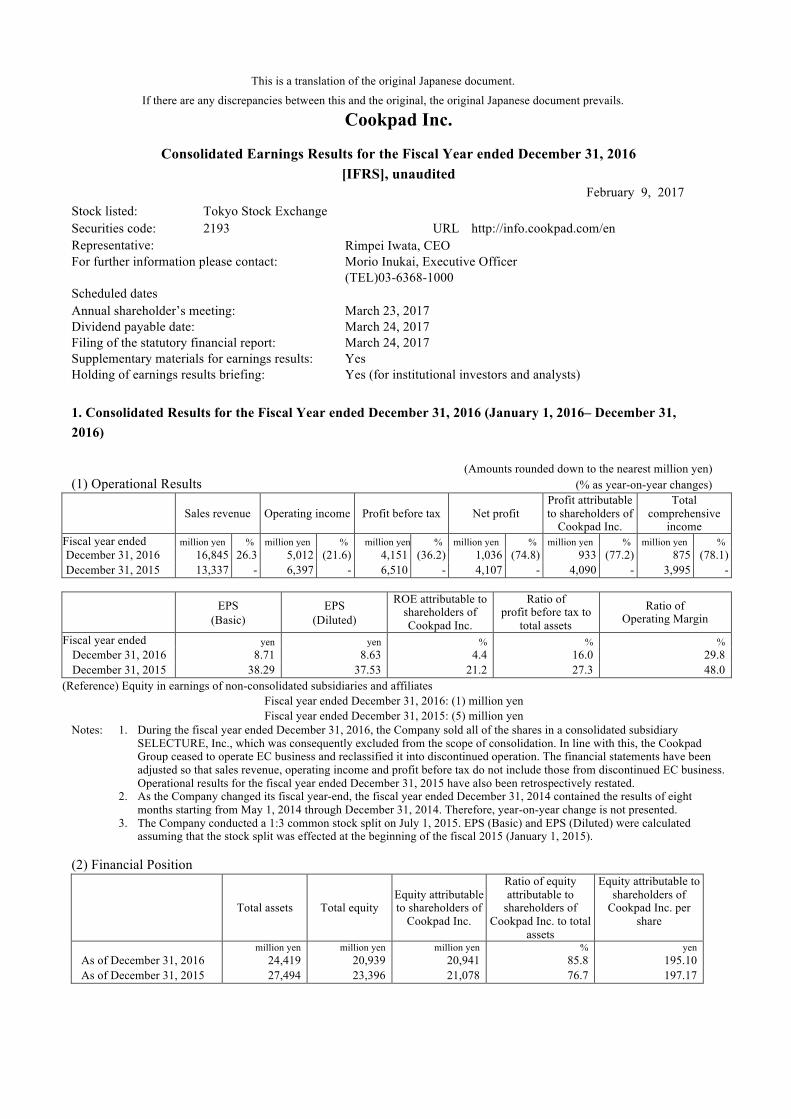
(3) Consolidated Cash Flow Position
Cash flows from operating activities
Cash flows from investing activities
Cash flows from financing activities
Cash and cash equivalents at the end of the period
Fiscal year ended million yen million yen million yen million yen December 31, 2016 5,248 (693) (1,167) 16,543 December 31, 2015 4,469 (4,026) (662) 13,048
2. Dividends
Dividends per Share
Total dividends paid
(full year) Payout ratio
(consolidated)
Dividend on equity
attributable to shareholders of Cookpad Inc. (consolidated)
End-Q1 End-Q2 End-Q3 Year-end Total
Year ended/ending Yen Yen Yen Yen Yen million yen % %
December 31, 2015 - 0.00 - 10.00 10.00 1,069 26.1 5.5 December 31, 2016 - 0.00 - 10.00 10.00 1,071 114.8 5.1 December 31, 2017
(Forecast) - - - - - -
3. Full Year Forecast of Consolidated Earnings (January 1, 2017 – December 31, 2017) To fulfill the corporate mission of “Make Everyday Cooking Fun,” the Cookpad Group is aggressively pursuing investment opportunities to provide recipe services to the people worldwide. As the timing and the scale of investment should be decided in an agile manner taking consideration of change in business environment, it is difficult to reasonably estimate the consolidated earnings for the fiscal year ending December 31, 2017. Thus, the Company omitted the earnings forecasts. *Notes (1) Changes in significant subsidiaries during the period: Yes Note: In the fiscal year ended December 31, 2016, Minnano Wedding Co., Ltd., which was a consolidated subsidiary based on the controlling approach, has ceased to be a subsidiary as the shareholders agreement concluded with a director was terminated. The company was reclassified as an equity-method affiliate and excluded from the scope of consolidation. (2) Changes in accounting policies and changes in accounting estimates
1) Changes required for the adoption of IFRS: No
2) Changes other than 1): No
3) Changes in accounting estimates: Yes Note: For changes in accounting estimates, please refer to “4. Consolidated Financial Statements, (6) Changes in Accounting Estimates" on page 15 in the Accompanying Materials.
(3) Number of shares issued (common stocks) 1) Number of shares issued (including treasury shares)
As of December 31, 2016: 107,157,600 shares As of December 31, 2015: 106,906,800 shares
2) Number of treasury shares As of December 31, 2016: 3,956 shares As of December 31, 2015: 3,956 shares
3) Number of average shares during the period Year ended December 31, 2016: 107,108,125 shares Year ended December 31, 2015: 106,818,989 shares
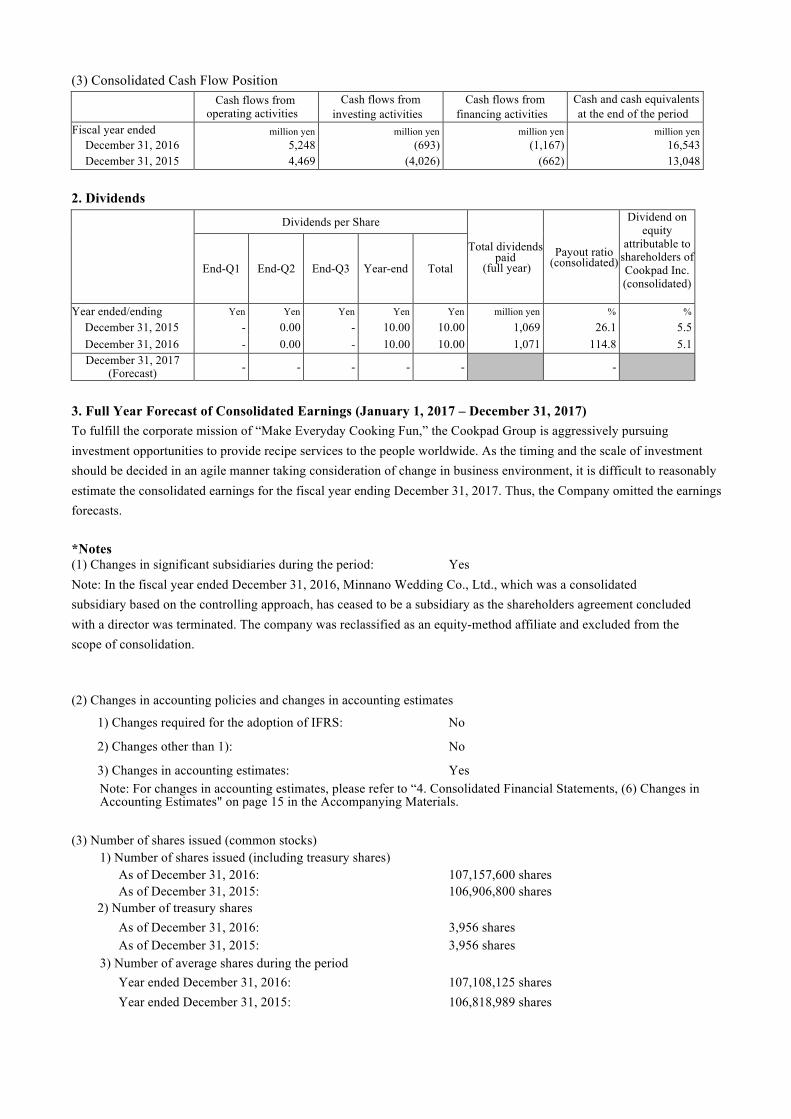
(Reference) 1. Non-consolidated Results for the Fiscal year ended December 31, 2016 (January 1, 2016 - December 31, 2016) (1) Non-consolidated Operations Results (% as year-on-year changes)
Net Sales Operating Income Ordinary Income Net Income
Fiscal year ended million yen % million yen % million yen % million yen % December 31, 2016 14,450 25.0 9,274 34.9 9,018 31.7 2,805 (22.7) December 31, 2015 11,564 - 6,873 - 6,847 - 3,629 -
EPS Diluted EPS
Fiscal year ended yen yen December 31, 2016 26.19 25.96 December 31, 2015 33.98 33.30
Notes: 1. As the Company changed its fiscal year-end, the fiscal year ended December 31, 2014 contained the results of eight months starting from May 1, 2014 through December 31, 2014. Therefore, year-on-year change is not presented.
2. The Company conducted a 1:3 common stock split on July 1, 2015. EPS and EPS (Diluted) were calculated assuming that the stock split took effect at the beginning of the fiscal year ended December 31, 2015 (May 1, 2015).
(2) Financial Position
Total Assets Net Assets Equity Ratio* Net assets per share
million yen million yen % yen As of December 31, 2016 26,598 23,405 88.0 218.33 As of December 31, 2015 24,928 21,806 87.3 203.46
(Reference) Total equity: As of December 31, 2016: 23,395 million yen As of December 31, 2015: 21,751 million yen
* Audit Procedures
This report is exempt from an audit of accounts requirements of Japan’s Financial Instruments and Exchange Act. As of this report’s publication, an audit of the consolidated financial statements in accordance with Financial Instruments and Exchange Act of Japan had not been completed.
* Appropriate Use of Earnings Results and Other Special Notes The above forecasts, which constitute forward-looking statements, are based on information available to the Company and the assumptions of management as of the release date of this document. Actual results may differ materially from the above forecasts due to a range of factors. For the assumptions underlying the forecasts herein and other information on the use of earnings forecasts, please refer to “1. Analysis of Operating Results and Financial Position, (1) Analysis of Operating Results (Outlook for fiscal 2017),” on page 4 in the Accompanying Materials.
1
Accompanying Materials
1. Analysis of Operating Results and Financial Position ............................................................................................... 2
(1) Analysis of Operating Results ............................................................................................................................... 2
(2) Analysis of Financial Position ............................................................................................................................... 4
(3) Basic Policy for Profit Distribution and Dividends in Fiscal 2016 and Fiscal 2017 ............................................. 5
2. Management Policy .................................................................................................................................................... 6
(1) The Company’s Basic Management Policy ........................................................................................................... 6
(2) Target Management Indicators .............................................................................................................................. 6
(3) Medium- to Long-term Management Strategy ...................................................................................................... 6
(4) Challenges to Be Addressed by the Company ....................................................................................................... 6
3. Basic Policy on Selection of Accounting Standard ................................................................................................... 6
4. Consolidated Financial Statements ............................................................................................................................ 7
(1) Consolidated Statements of Financial Position ..................................................................................................... 7
(2) Consolidated Income Statements and Statements of Comprehensive Income ...................................................... 9
(3) Consolidated Statements of Changes in Equity ..................................................................................................... 11
(4) Consolidated Statements of Cash Flows ................................................................................................................ 13
(5) Notes on the Going Concern Assumption ............................................................................................................. 15
(6) Changes in Accounting Estimates ......................................................................................................................... 15
(7) Notes on the Consolidated Financial Statements ................................................................................................... 16
2
1. Analysis of Operating Results and Financial Position
(1) Analysis of Operating Results
1) Overview of consolidated results
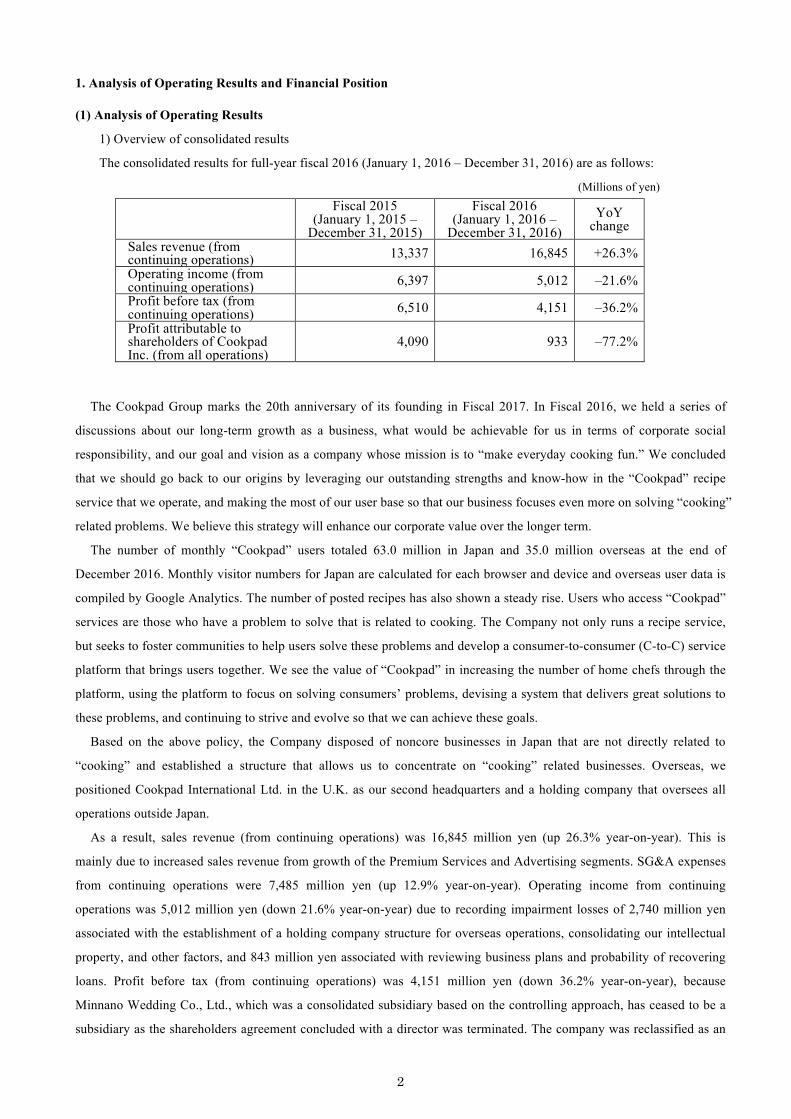
The consolidated results for full-year fiscal 2016 (January 1, 2016 – December 31, 2016) are as follows:
(Millions of yen)
Fiscal 2015
(January 1, 2015 – December 31, 2015)
Fiscal 2016 (January 1, 2016 –
December 31, 2016) YoY
change Sales revenue (from continuing operations) 13,337 16,845 +26.3% Operating income (from continuing operations) 6,397 5,012 –21.6% Profit before tax (from continuing operations) 6,510 4,151 –36.2% Profit attributable to shareholders of Cookpad Inc. (from all operations)
4,090 933 –77.2%
The Cookpad Group marks the 20th anniversary of its founding in Fiscal 2017. In Fiscal 2016, we held a series of
discussions about our long-term growth as a business, what would be achievable for us in terms of corporate social
responsibility, and our goal and vision as a company whose mission is to “make everyday cooking fun.” We concluded
that we should go back to our origins by leveraging our outstanding strengths and know-how in the “Cookpad” recipe
service that we operate, and making the most of our user base so that our business focuses even more on solving “cooking”
related problems. We believe this strategy will enhance our corporate value over the longer term.
The number of monthly “Cookpad” users totaled 63.0 million in Japan and 35.0 million overseas at the end of
December 2016. Monthly visitor numbers for Japan are calculated for each browser and device and overseas user data is
compiled by Google Analytics. The number of posted recipes has also shown a steady rise. Users who access “Cookpad”
services are those who have a problem to solve that is related to cooking. The Company not only runs a recipe service,
but seeks to foster communities to help users solve these problems and develop a consumer-to-consumer (C-to-C) service
platform that brings users together. We see the value of “Cookpad” in increasing the number of home chefs through the
platform, using the platform to focus on solving consumers’ problems, devising a system that delivers great solutions to
these problems, and continuing to strive and evolve so that we can achieve these goals.
Based on the above policy, the Company disposed of noncore businesses in Japan that are not directly related to
“cooking” and established a structure that allows us to concentrate on “cooking” related businesses. Overseas, we
positioned Cookpad International Ltd. in the U.K. as our second headquarters and a holding company that oversees all
operations outside Japan.
As a result, sales revenue (from continuing operations) was 16,845 million yen (up 26.3% year-on-year). This is
mainly due to increased sales revenue from growth of the Premium Services and Advertising segments. SG&A expenses
from continuing operations were 7,485 million yen (up 12.9% year-on-year). Operating income from continuing
operations was 5,012 million yen (down 21.6% year-on-year) due to recording impairment losses of 2,740 million yen
associated with the establishment of a holding company structure for overseas operations, consolidating our intellectual
property, and other factors, and 843 million yen associated with reviewing business plans and probability of recovering
loans. Profit before tax (from continuing operations) was 4,151 million yen (down 36.2% year-on-year), because
Minnano Wedding Co., Ltd., which was a consolidated subsidiary based on the controlling approach, has ceased to be a
subsidiary as the shareholders agreement concluded with a director was terminated. The company was reclassified as an
3
equity method affiliate and accordingly, a recalculated equity-method loss of 1,262 million yen was recorded as a
financial expense. Profit attributable to shareholders of Cookpad Inc. (from all operations) including discontinued
operations was 933 million yen (down 77.2% year-on-year) due to an increase in income tax payable.
In fiscal 2016, the Company sold all shares in consolidated subsidiary SELECTURE, Inc. and removed the company
from the scope of consolidated companies. Accordingly, the Company withdrew from the EC business, which has been
categorized as a non-continuing operation, and sales revenue, operating income, and profit before tax have been restated
to exclude the EC business and include continuing operations only. Consolidated operating results of the previous fiscal
year have also been restated for the purpose of year-on-year comparison.
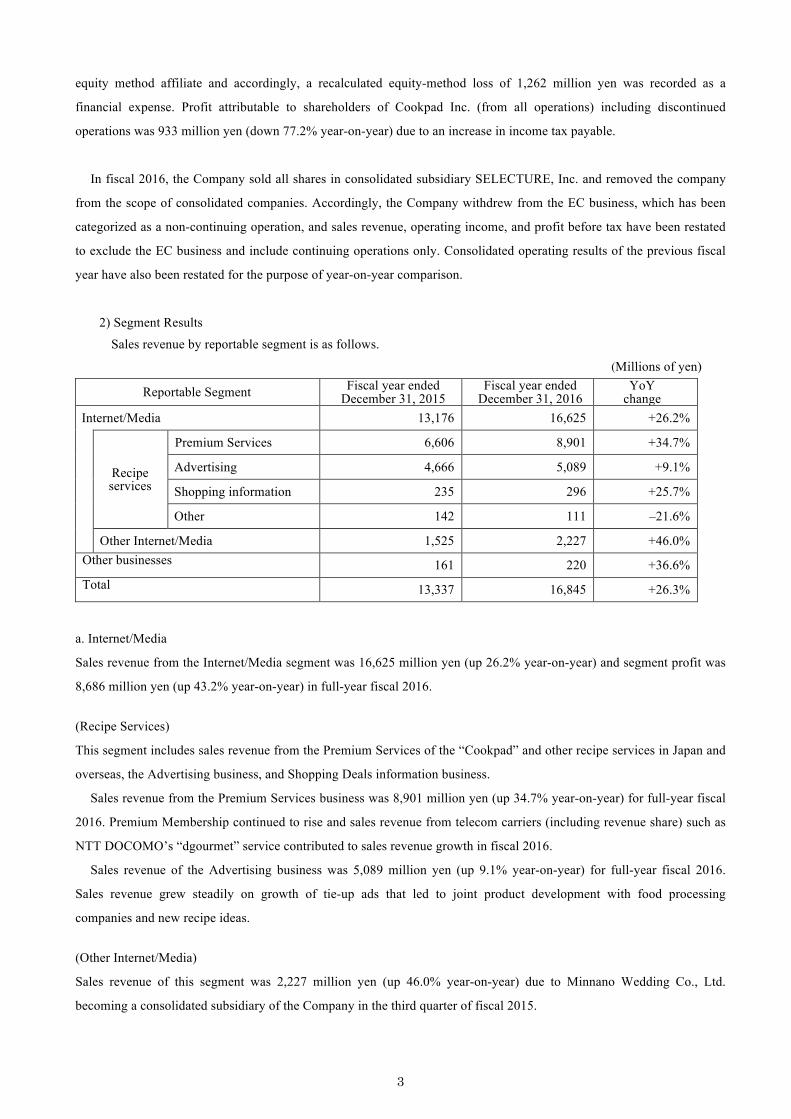
2) Segment Results
Sales revenue by reportable segment is as follows.
(Millions of yen)
Reportable Segment Fiscal year ended December 31, 2015
Fiscal year ended December 31, 2016
YoY change
Internet/Media 13,176 16,625 +26.2%
Recipe services
Premium Services 6,606 8,901 +34.7%
Advertising 4,666 5,089 +9.1%
Shopping information 235 296 +25.7%
Other 142 111 –21.6%
Other Internet/Media 1,525 2,227 +46.0% Other businesses 161 220 +36.6%
Total 13,337 16,845 +26.3%
a. Internet/Media
Sales revenue from the Internet/Media segment was 16,625 million yen (up 26.2% year-on-year) and segment profit was
8,686 million yen (up 43.2% year-on-year) in full-year fiscal 2016. (Recipe Services)
This segment includes sales revenue from the Premium Services of the “Cookpad” and other recipe services in Japan and
overseas, the Advertising business, and Shopping Deals information business.
Sales revenue from the Premium Services business was 8,901 million yen (up 34.7% year-on-year) for full-year fiscal
2016. Premium Membership continued to rise and sales revenue from telecom carriers (including revenue share) such as
NTT DOCOMO’s “dgourmet” service contributed to sales revenue growth in fiscal 2016.
Sales revenue of the Advertising business was 5,089 million yen (up 9.1% year-on-year) for full-year fiscal 2016.
Sales revenue grew steadily on growth of tie-up ads that led to joint product development with food processing
companies and new recipe ideas. (Other Internet/Media)
Sales revenue of this segment was 2,227 million yen (up 46.0% year-on-year) due to Minnano Wedding Co., Ltd.
becoming a consolidated subsidiary of the Company in the third quarter of fiscal 2015.
4
(Outlook for fiscal 2017)
The Company plans aggressive investment in providing services that “make everyday cooking fun” to consumers in
Japan and worldwide. We will make nimble decisions on the timing and value of investments to adapt to changes in the
business environment. For this reason, which makes it impossible to make rational earnings estimates, we have not
disclosed our consolidated earnings forecast for fiscal 2017. (2) Analysis of Financial Position
1) Assets, Liabilities, and Equity
(Assets)
As of December 31, 2016, total assets were 24,419 million yen, down 3,075 million yen as compared with the previous
fiscal year-end. Current assets were 21,064 million yen, up 4,354 million yen, and non-current assets were 3,354 million
yen, down 7,429 million yen.
The main reason for the increase in current assets is a 3,494 million yen increase in cash and cash equivalents and
1,645 million yen increase in assets held for sale, while the decrease in non-current assets is primarily due to a 6,236
million yen decrease in goodwill associated with the sale and impairment of shares in a subsidiary. (Liabilities)
As of December 31, 2016, total liabilities were 3,479 million yen, down 619 million yen as compared with the previous
fiscal year-end. Current liabilities were 3,232 million yen, down 490 million yen, and non-current liabilities were 247
million yen, down 128 million yen.
The main reason for the decrease in current liabilities was a decrease of 482 million yen in trade and other payables. (Equity)
As of December 31, 2016, total equity was 20,939 million yen, down 2,456 million yen as compared with the previous
fiscal year-end. This was primarily due to a decrease in non-controlling interest of 2,319 million yen. 2) Cash Flows
As of December 31, 2016, cash and cash equivalents (“Funds”) balance was 16,543 million yen, up 3,494 million yen as
compared with the previous fiscal year-end, primarily due to the following factors. (Cash flows from operating activities)
Funds provided by operating activities totaled 5,248 million yen. While profit before tax (for all businesses) including
discontinued operations was 4,167 million yen and impairment loss was 3,583 million yen, there were income taxes paid
of 3,164 million yen. (Cash flows from investing activities)
Funds used in investing activities totaled 693 million yen. This is primarily due to funds provided by the sale of
subsidiaries of 1,438 million yen and the sale of investments of 870 million yen, and payments of 2,656 million yen from
the loss of controlling interest in a subsidiary and 507 million yen of investments. (Cash flows from financing activities)
Funds used in financing activities totaled 1,167 million yen, mainly attributable to cash dividends paid totaling 1,069
million yen.
5
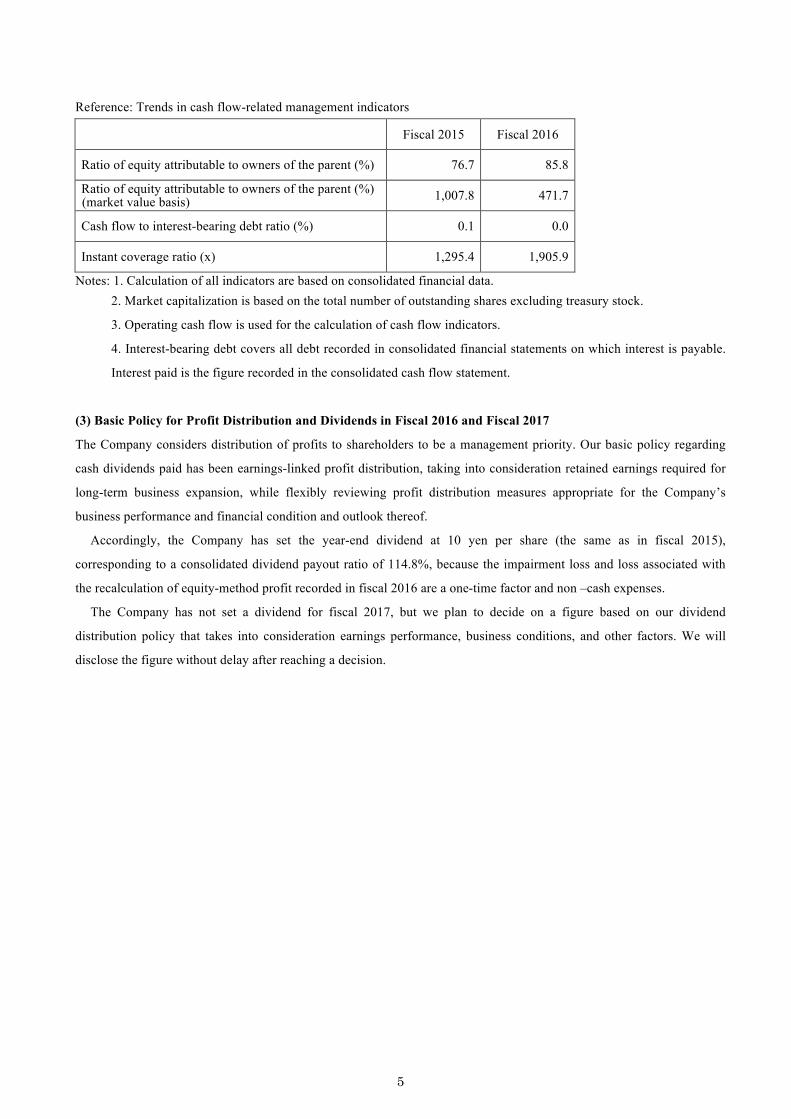
Reference: Trends in cash flow-related management indicators
Fiscal 2015 Fiscal 2016
Ratio of equity attributable to owners of the parent (%) 76.7 85.8
Ratio of equity attributable to owners of the parent (%) (market value basis) 1,007.8 471.7
Cash flow to interest-bearing debt ratio (%) 0.1 0.0
Instant coverage ratio (x) 1,295.4 1,905.9
Notes: 1. Calculation of all indicators are based on consolidated financial data. 2. Market capitalization is based on the total number of outstanding shares excluding treasury stock.
3. Operating cash flow is used for the calculation of cash flow indicators.
4. Interest-bearing debt covers all debt recorded in consolidated financial statements on which interest is payable.
Interest paid is the figure recorded in the consolidated cash flow statement.
(3) Basic Policy for Profit Distribution and Dividends in Fiscal 2016 and Fiscal 2017
The Company considers distribution of profits to shareholders to be a management priority. Our basic policy regarding
cash dividends paid has been earnings-linked profit distribution, taking into consideration retained earnings required for
long-term business expansion, while flexibly reviewing profit distribution measures appropriate for the Company’s
business performance and financial condition and outlook thereof.
Accordingly, the Company has set the year-end dividend at 10 yen per share (the same as in fiscal 2015),
corresponding to a consolidated dividend payout ratio of 114.8%, because the impairment loss and loss associated with
the recalculation of equity-method profit recorded in fiscal 2016 are a one-time factor and non –cash expenses.
The Company has not set a dividend for fiscal 2017, but we plan to decide on a figure based on our dividend
distribution policy that takes into consideration earnings performance, business conditions, and other factors. We will
disclose the figure without delay after reaching a decision.
6
2. Management Policy
(1) The Company’s Basic Management Policy With the mission of “make everyday cooking fun,” the Cookpad Group is striving to help the people worldwide to be
involved in cooking, as the Group believes that cooking can contribute to identify, think and solve various challenges
facing individual, society and the globe and create richness required and expected today and going forward. To achieve
this goal, the Group will keep making progress with a diligent effort.
(2)Target Management Indicators The Cookpad Group believes that improving satisfaction ratings of users of our services will lead to increased corporate
value and thus prioritizes the monthly and daily number of users of our services, the number of posted recipes and other
related data as management indicators.
(3)Medium- to Long-Term Management Strategy Running the service platform for richer and healthier life of people in Japan and overseas, the Cookpad Group contributes
to identify various challenges facing individual, society and the globe through cooking, provides solutions to various
“cooking” related challenges, and strives to increase corporate value.
(4) Challenges to Be Addressed by the Company
Challenges that must be addressed by the Cookpad Group are as follows.
1) Business operations in Japan The number of monthly “Cookpad” users in Japan has remained firm, totaling 63 million at the end of December 2016. Monthly visitor numbers are calculated for each browser and device. Given the population of Japan, however, it seems to be difficult to maintain this growing pace. Going forward, the Company will focus on increasing the number of our fans by developing services which users more eagerly access many times a day.
2) Overseas business operations Given our aim is to run a platform which provides the people worldwide with solutions to “cooking” related challenges, the Cookpad Group acknowledges the following challenges.
! We believe it is important to increase the number of people involved in cooking, form recipe communities that fit each country and region, and help them to flourish to attract quality recipes. To make this happen, we will be focusing on ways to make posting recipes fun and raise awareness of recipe communities.
! In the platform abroad, we intend to make the fee-based services as our earnings base. We will therefore provide services that match the environment and the needs of each country.
3. Basic Policy on Selection of Accounting Standard
Based on the mission of “make everyday cooking fun”, the Company is expanding its service worldwide by providing a
service that enhances the enjoyment of international cuisines for consumers in Japan and around the world. In this context,
the Company adopted International Financial Reporting Standards (IFRS) in place of Japanese Generally Accepted
Accounting Principles (JGAAP) from fiscal 2015 to facilitate international comparison of financial information and
extend the scope of disclosure for the convenience of our stakeholders, including shareholders and investors in Japan and
overseas.
7
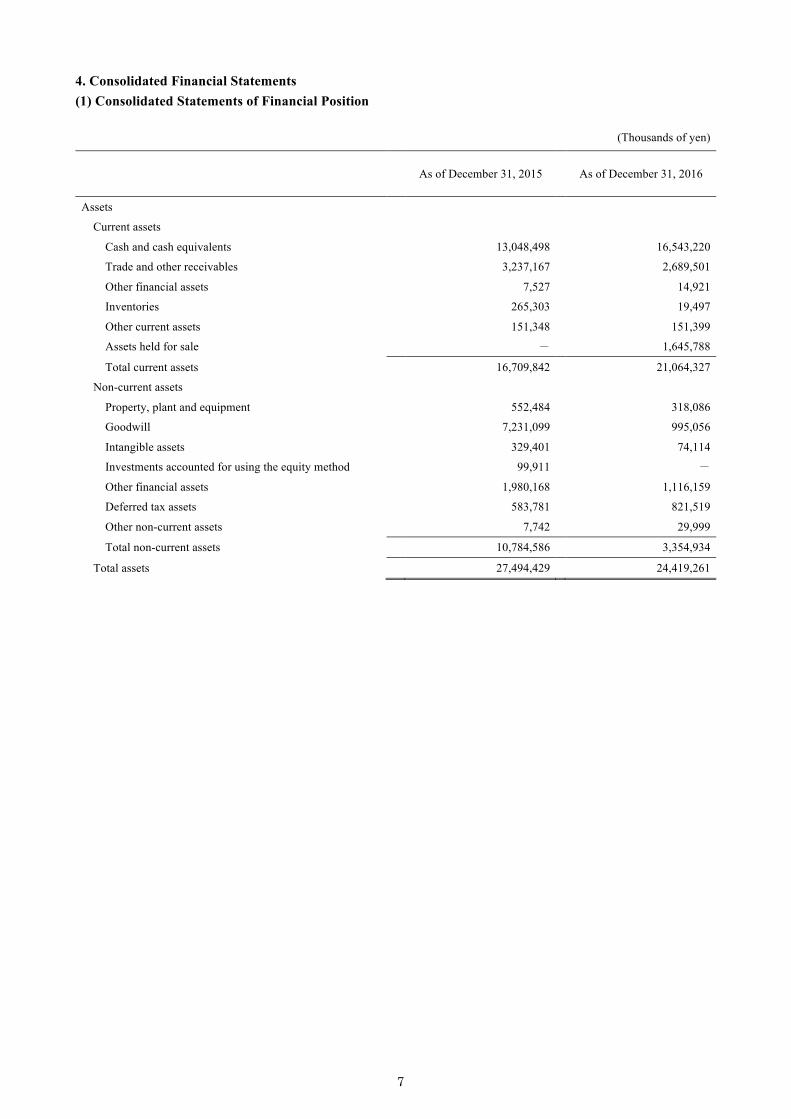
4. Consolidated Financial Statements (1) Consolidated Statements of Financial Position
(Thousands of yen)
As of December 31, 2015
As of December 31, 2016
Assets
Current assets
Cash and cash equivalents 13,048,498 16,543,220
Trade and other receivables 3,237,167 2,689,501
Other financial assets 7,527 14,921
Inventories 265,303 19,497
Other current assets 151,348 151,399
Assets held for sale - 1,645,788
Total current assets 16,709,842 21,064,327
Non-current assets
Property, plant and equipment 552,484 318,086
Goodwill 7,231,099 995,056
Intangible assets 329,401 74,114
Investments accounted for using the equity method 99,911 -
Other financial assets 1,980,168 1,116,159
Deferred tax assets 583,781 821,519
Other non-current assets 7,742 29,999
Total non-current assets 10,784,586 3,354,934
Total assets 27,494,429 24,419,261
8
(Thousands of yen)
As of December 31, 2015
As of December 31, 2016
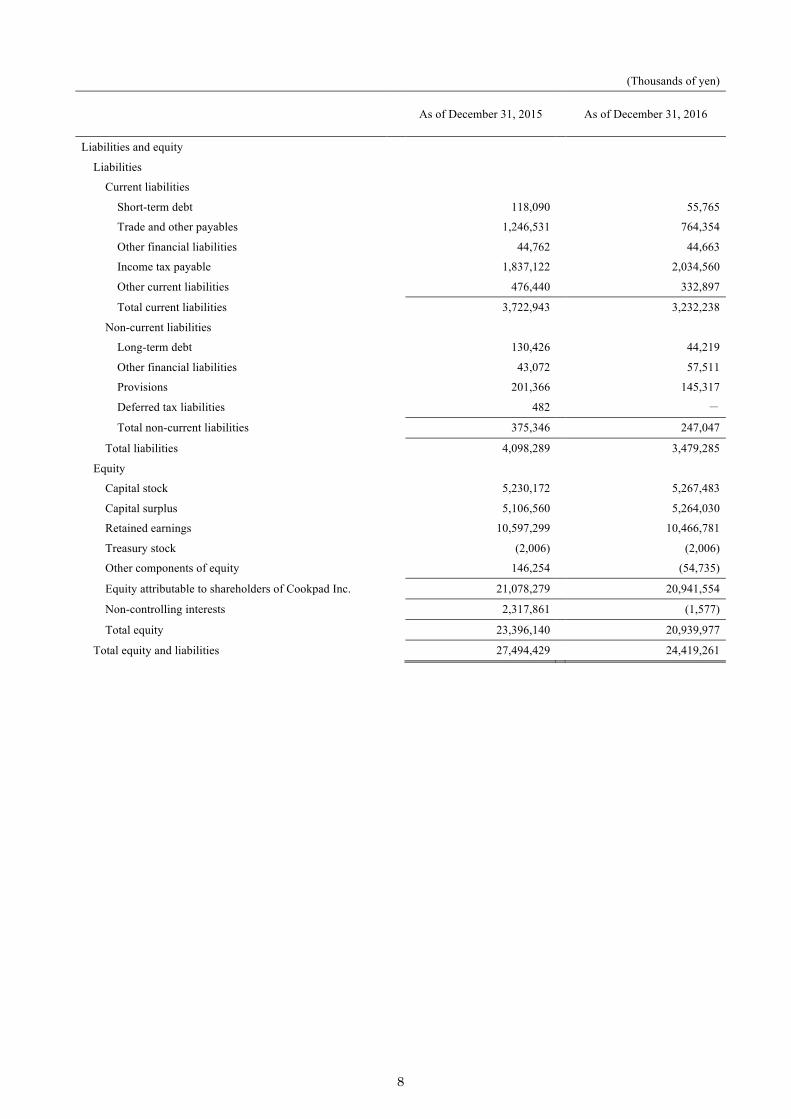
Liabilities and equity
Liabilities
Current liabilities
Short-term debt 118,090 55,765
Trade and other payables 1,246,531 764,354
Other financial liabilities 44,762 44,663
Income tax payable 1,837,122 2,034,560
Other current liabilities 476,440 332,897
Total current liabilities 3,722,943 3,232,238
Non-current liabilities
Long-term debt 130,426 44,219
Other financial liabilities 43,072 57,511
Provisions 201,366 145,317
Deferred tax liabilities 482 -
Total non-current liabilities 375,346 247,047
Total liabilities 4,098,289 3,479,285
Equity
Capital stock 5,230,172 5,267,483
Capital surplus 5,106,560 5,264,030
Retained earnings 10,597,299 10,466,781
Treasury stock (2,006) (2,006)
Other components of equity 146,254 (54,735)
Equity attributable to shareholders of Cookpad Inc. 21,078,279 20,941,554
Non-controlling interests 2,317,861 (1,577)
Total equity 23,396,140 20,939,977
Total equity and liabilities 27,494,429 24,419,261
9
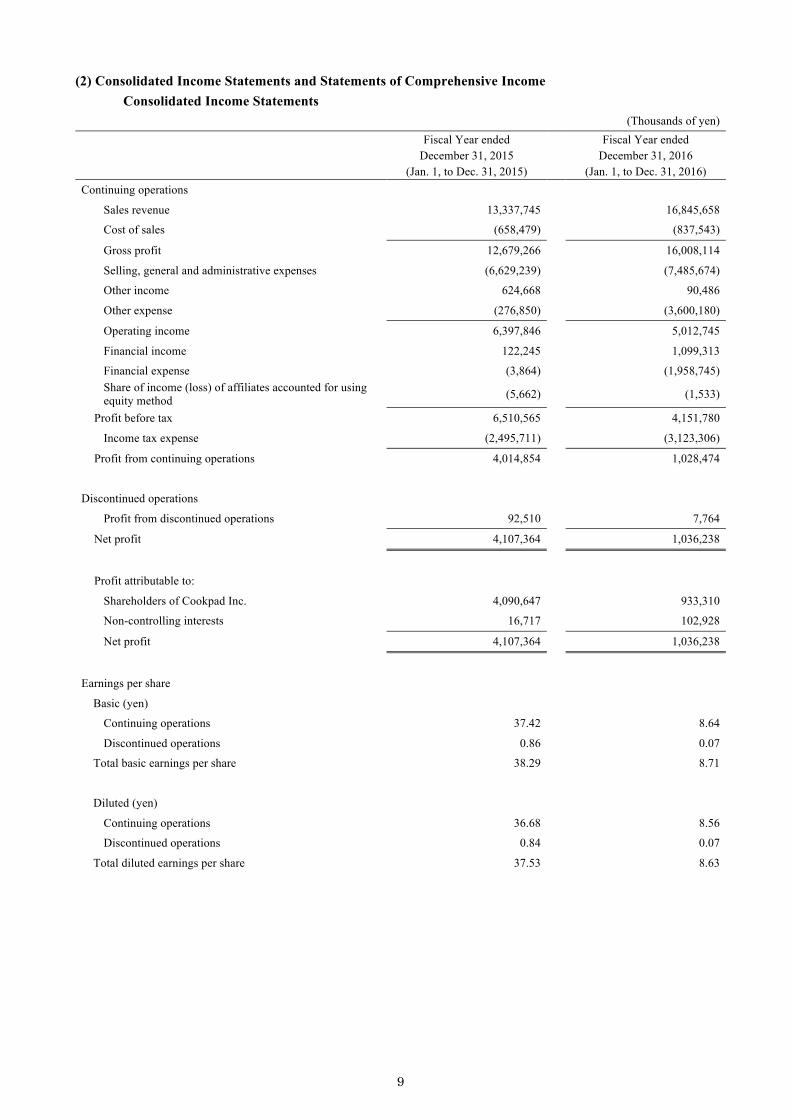
(2) Consolidated Income Statements and Statements of Comprehensive Income Consolidated Income Statements
(Thousands of yen)
Fiscal Year ended
December 31, 2015 (Jan. 1, to Dec. 31, 2015)
Fiscal Year ended December 31, 2016
(Jan. 1, to Dec. 31, 2016) Continuing operations
Sales revenue 13,337,745 16,845,658
Cost of sales (658,479) (837,543)
Gross profit 12,679,266 16,008,114
Selling, general and administrative expenses (6,629,239) (7,485,674)
Other income 624,668 90,486
Other expense (276,850) (3,600,180)
Operating income 6,397,846 5,012,745
Financial income 122,245 1,099,313
Financial expense (3,864) (1,958,745) Share of income (loss) of affiliates accounted for using equity method (5,662) (1,533)
Profit before tax 6,510,565 4,151,780
Income tax expense (2,495,711) (3,123,306)
Profit from continuing operations 4,014,854 1,028,474
Discontinued operations
Profit from discontinued operations 92,510 7,764
Net profit 4,107,364 1,036,238
Profit attributable to:
Shareholders of Cookpad Inc. 4,090,647 933,310
Non-controlling interests 16,717 102,928
Net profit 4,107,364 1,036,238
Earnings per share
Basic (yen)
Continuing operations 37.42 8.64
Discontinued operations 0.86 0.07
Total basic earnings per share 38.29 8.71
Diluted (yen)
Continuing operations 36.68 8.56
Discontinued operations 0.84 0.07
Total diluted earnings per share 37.53 8.63
10
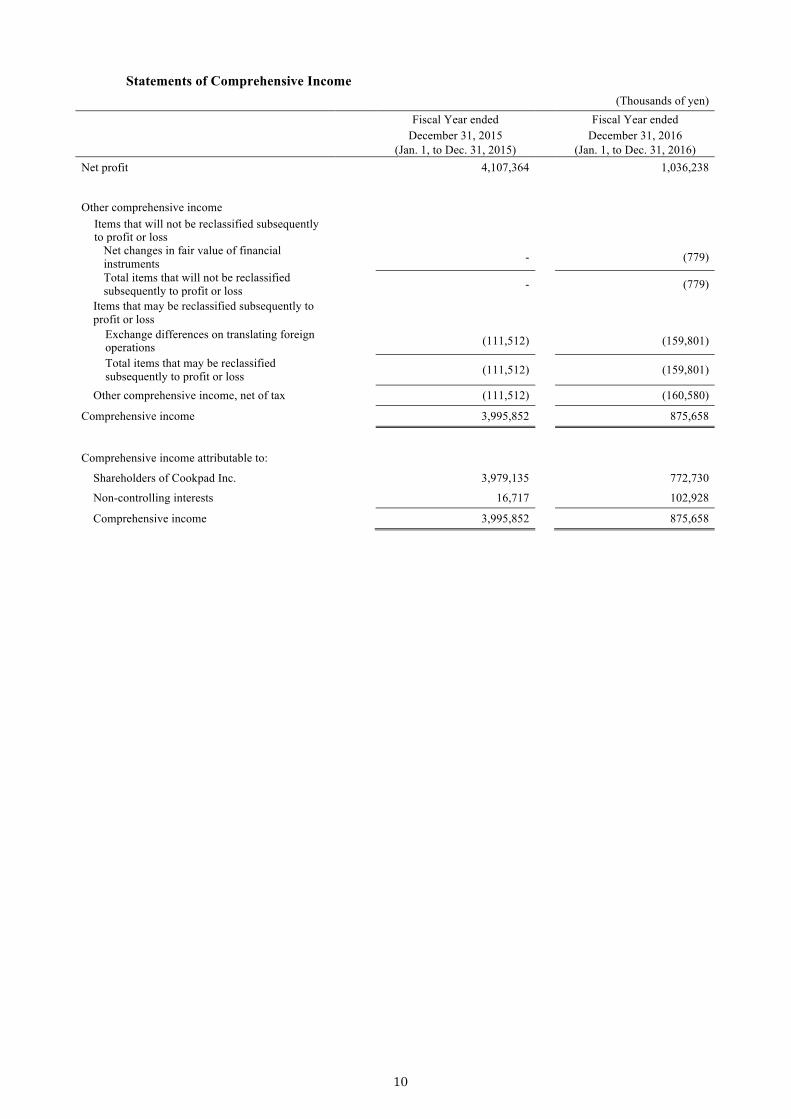
Statements of Comprehensive Income (Thousands of yen)
Fiscal Year ended
December 31, 2015 (Jan. 1, to Dec. 31, 2015)
Fiscal Year ended December 31, 2016
(Jan. 1, to Dec. 31, 2016) Net profit 4,107,364 1,036,238
Other comprehensive income Items that will not be reclassified subsequently to profit or loss
Net changes in fair value of financial instruments - (779)
Total items that will not be reclassified subsequently to profit or loss - (779)
Items that may be reclassified subsequently to profit or loss
Exchange differences on translating foreign operations (111,512) (159,801)
Total items that may be reclassified subsequently to profit or loss (111,512) (159,801)
Other comprehensive income, net of tax (111,512) (160,580)
Comprehensive income 3,995,852 875,658
Comprehensive income attributable to:
Shareholders of Cookpad Inc. 3,979,135 772,730
Non-controlling interests 16,717 102,928
Comprehensive income 3,995,852 875,658
11
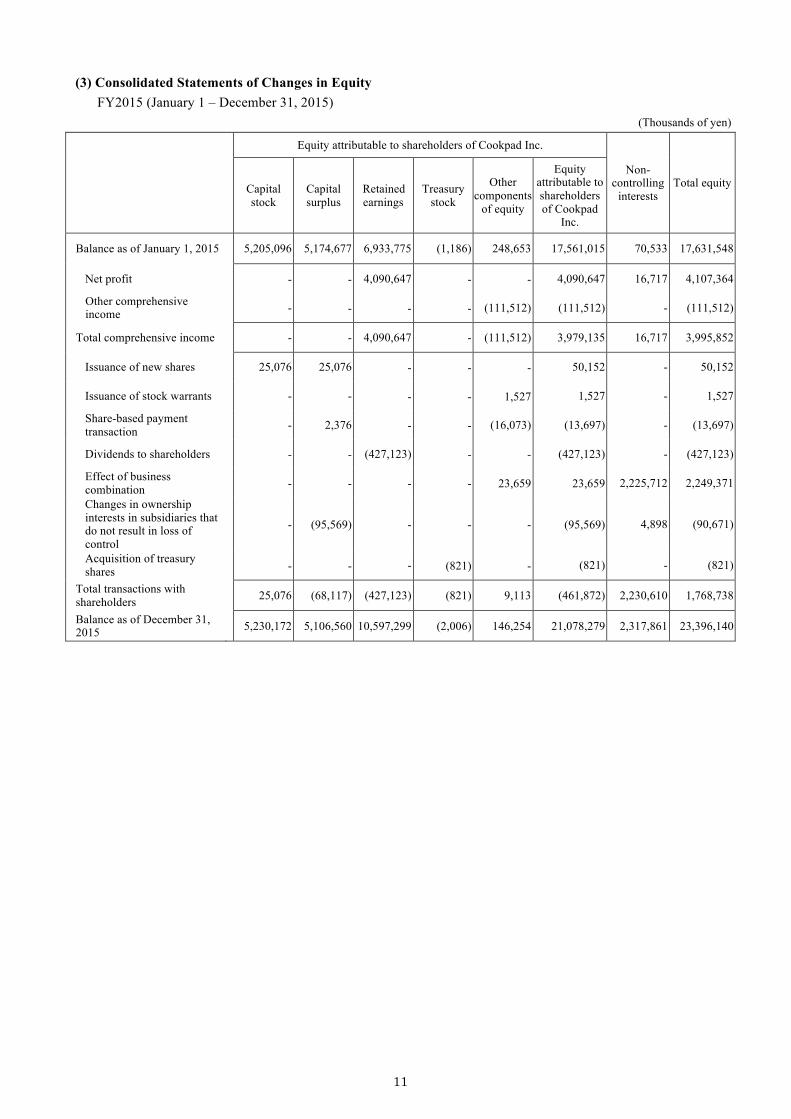
(3) Consolidated Statements of Changes in Equity
FY2015 (January 1 – December 31, 2015) (Thousands of yen)
Equity attributable to shareholders of Cookpad Inc.
Non-controlling
interests Total equity
Capital stock
Capital surplus
Retained earnings
Treasury stock
Other components
of equity
Equity attributable to shareholders of Cookpad
Inc.
Balance as of January 1, 2015 5,205,096 5,174,677 6,933,775 (1,186) 248,653 17,561,015 70,533 17,631,548
Net profit - - 4,090,647 - - 4,090,647 16,717 4,107,364
Other comprehensive income - - - - (111,512) (111,512) - (111,512)
Total comprehensive income - - 4,090,647 - (111,512) 3,979,135 16,717 3,995,852
Issuance of new shares 25,076 25,076 - - - 50,152 - 50,152
Issuance of stock warrants - - - - 1,527 1,527 - 1,527
Share-based payment transaction - 2,376 - - (16,073) (13,697) - (13,697)
Dividends to shareholders - - (427,123) - - (427,123) - (427,123)
Effect of business combination - - - - 23,659 23,659 2,225,712 2,249,371
Changes in ownership interests in subsidiaries that do not result in loss of control
- (95,569) - - - (95,569) 4,898 (90,671)
Acquisition of treasury shares - - - (821) - (821) - (821)
Total transactions with shareholders 25,076 (68,117) (427,123) (821) 9,113 (461,872) 2,230,610 1,768,738
Balance as of December 31, 2015 5,230,172 5,106,560 10,597,299 (2,006) 146,254 21,078,279 2,317,861 23,396,140
12
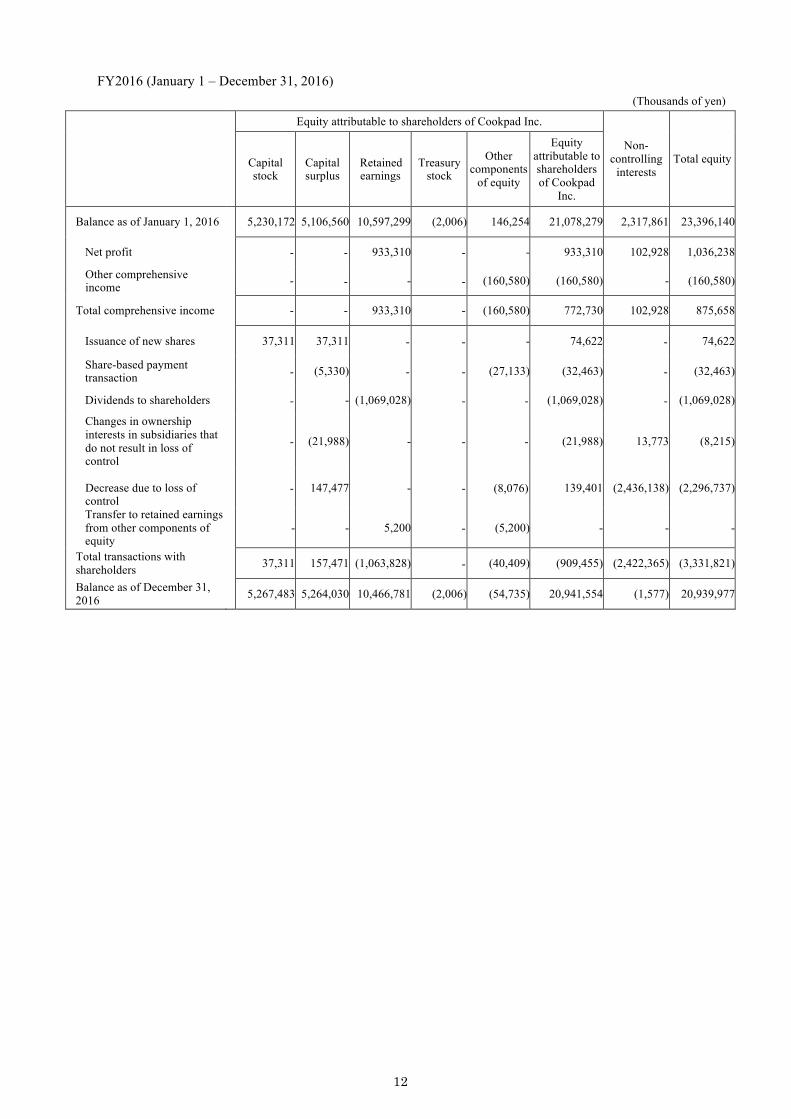
FY2016 (January 1 – December 31, 2016)
(Thousands of yen)
Equity attributable to shareholders of Cookpad Inc.
Non-controlling
interests Total equity
Capital stock
Capital surplus
Retained earnings
Treasury stock
Other components
of equity
Equity attributable to shareholders of Cookpad
Inc.
Balance as of January 1, 2016 5,230,172 5,106,560 10,597,299 (2,006) 146,254 21,078,279 2,317,861 23,396,140
Net profit - - 933,310 - - 933,310 102,928 1,036,238
Other comprehensive income - - - - (160,580) (160,580) - (160,580)
Total comprehensive income - - 933,310 - (160,580) 772,730 102,928 875,658
Issuance of new shares 37,311 37,311 - - - 74,622 - 74,622
Share-based payment transaction - (5,330) - - (27,133) (32,463) - (32,463)
Dividends to shareholders - - (1,069,028) - - (1,069,028) - (1,069,028)
Changes in ownership interests in subsidiaries that do not result in loss of control
- (21,988) - - - (21,988) 13,773 (8,215)
Decrease due to loss of control
- 147,477 - - (8,076) 139,401 (2,436,138) (2,296,737)
Transfer to retained earnings from other components of equity
- - 5,200 - (5,200) - - -
Total transactions with shareholders 37,311 157,471 (1,063,828) - (40,409) (909,455) (2,422,365) (3,331,821)
Balance as of December 31, 2016 5,267,483 5,264,030 10,466,781 (2,006) (54,735) 20,941,554 (1,577) 20,939,977
13
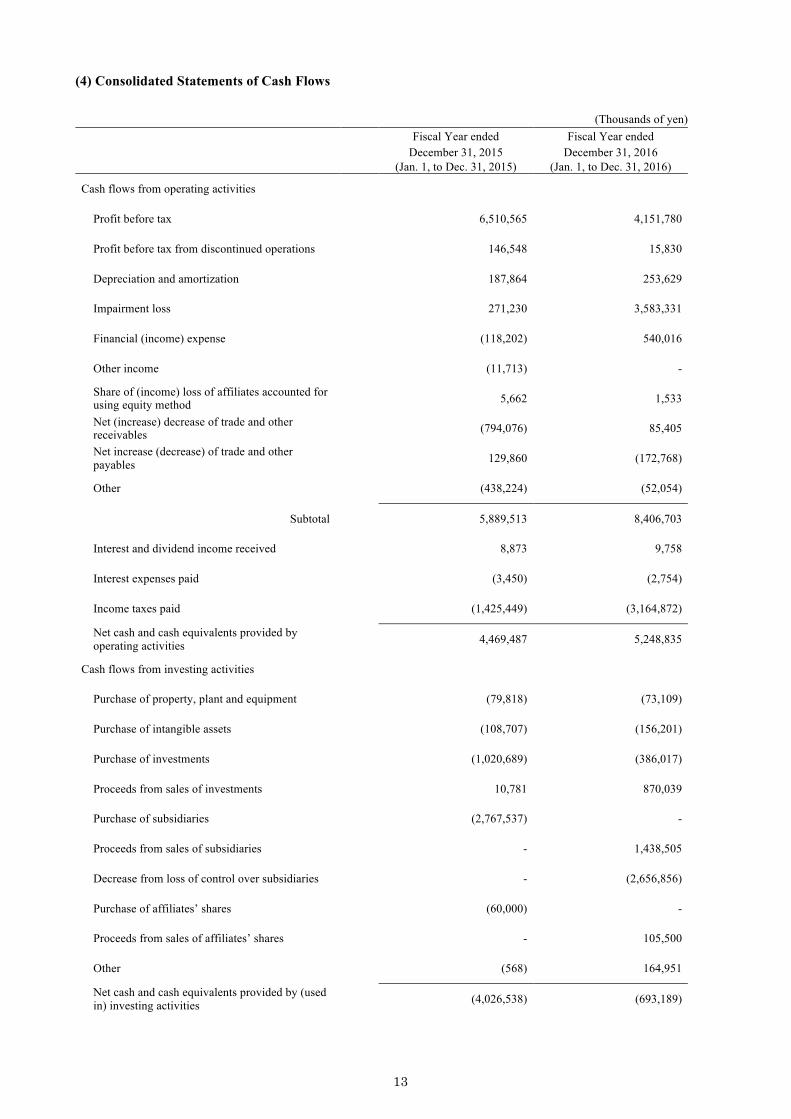
(4) Consolidated Statements of Cash Flows
(Thousands of yen)
Fiscal Year ended
December 31, 2015 (Jan. 1, to Dec. 31, 2015)
Fiscal Year ended December 31, 2016
(Jan. 1, to Dec. 31, 2016)
Cash flows from operating activities
Profit before tax 6,510,565 4,151,780
Profit before tax from discontinued operations 146,548 15,830
Depreciation and amortization 187,864 253,629
Impairment loss 271,230 3,583,331
Financial (income) expense (118,202) 540,016
Other income (11,713) -
Share of (income) loss of affiliates accounted for using equity method 5,662 1,533
Net (increase) decrease of trade and other receivables (794,076) 85,405
Net increase (decrease) of trade and other payables 129,860 (172,768)
Other (438,224) (52,054)
Subtotal 5,889,513 8,406,703
Interest and dividend income received 8,873 9,758
Interest expenses paid (3,450) (2,754)
Income taxes paid (1,425,449) (3,164,872)
Net cash and cash equivalents provided by operating activities 4,469,487 5,248,835
Cash flows from investing activities
Purchase of property, plant and equipment (79,818) (73,109)
Purchase of intangible assets (108,707) (156,201)
Purchase of investments (1,020,689) (386,017)
Proceeds from sales of investments 10,781 870,039
Purchase of subsidiaries (2,767,537) -
Proceeds from sales of subsidiaries - 1,438,505
Decrease from loss of control over subsidiaries - (2,656,856)
Purchase of affiliates’ shares (60,000) -
Proceeds from sales of affiliates’ shares - 105,500
Other (568) 164,951
Net cash and cash equivalents provided by (used in) investing activities (4,026,538) (693,189)
14
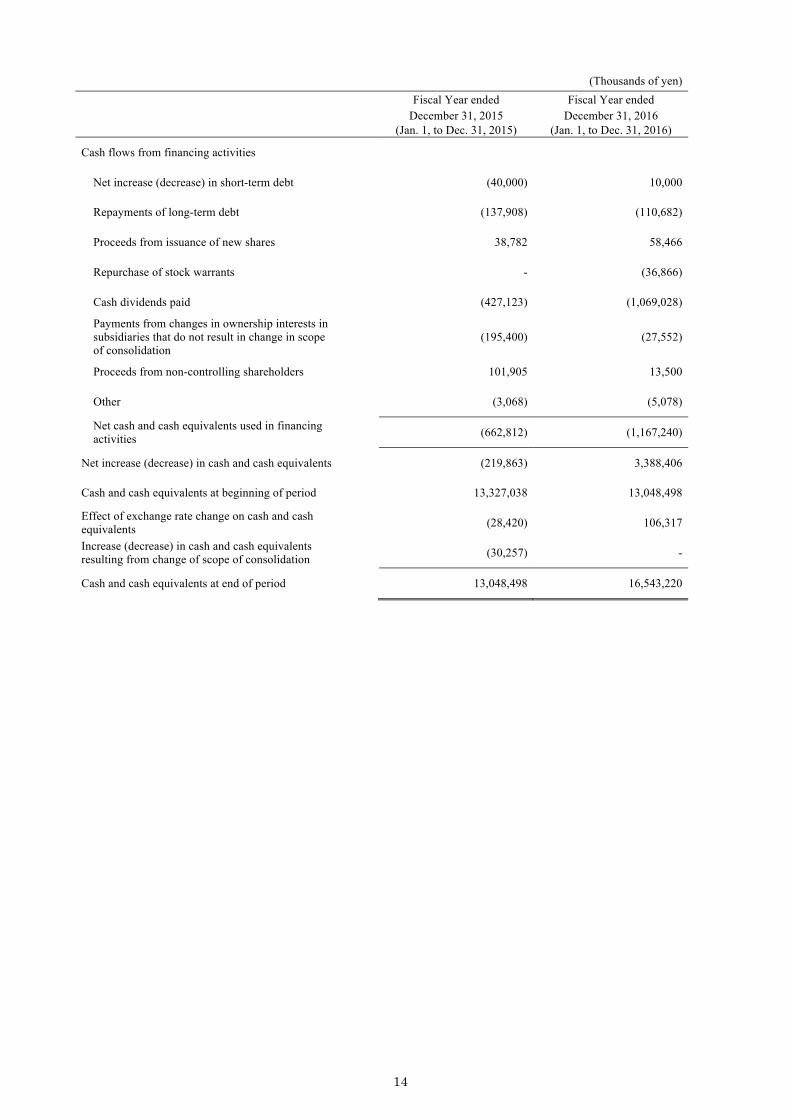
(Thousands of yen)
Fiscal Year ended
December 31, 2015 (Jan. 1, to Dec. 31, 2015)
Fiscal Year ended December 31, 2016
(Jan. 1, to Dec. 31, 2016)
Cash flows from financing activities
Net increase (decrease) in short-term debt (40,000) 10,000
Repayments of long-term debt (137,908) (110,682)
Proceeds from issuance of new shares 38,782 58,466
Repurchase of stock warrants - (36,866)
Cash dividends paid (427,123) (1,069,028)
Payments from changes in ownership interests in subsidiaries that do not result in change in scope of consolidation
(195,400) (27,552)
Proceeds from non-controlling shareholders 101,905 13,500
Other (3,068) (5,078)
Net cash and cash equivalents used in financing activities (662,812) (1,167,240)
Net increase (decrease) in cash and cash equivalents (219,863) 3,388,406
Cash and cash equivalents at beginning of period 13,327,038 13,048,498
Effect of exchange rate change on cash and cash equivalents (28,420) 106,317
Increase (decrease) in cash and cash equivalents resulting from change of scope of consolidation (30,257) -
Cash and cash equivalents at end of period 13,048,498 16,543,220
15
(5) Notes on the Going Concern Assumption Not applicable
(6) Changes in Accounting Estimates Material change in accounting estimates made in the financial statements for the fiscal year ended December 31, 2016 is stated below.
(Impairment losses) The Company has been globally expanding its recipe service since its fiscal year ended April 30, 2014, by offering regional versions of the service, mainly through acquisitions.
To improve service development efficiency, the Group has been developing a globally usable recipe service platform (the “Global Platform”) and successively migrating regional recipe services onto the Global Platform since the fiscal year ended December 31, 2015. In the fiscal year ended December 31, 2016, the Company designated its UK subsidiary Cookpad International Ltd. as a second corporate headquarters with oversight of all overseas businesses. The Company consolidated its intellectual property related to the recipe business into Cookpad International Ltd. and converted Cookpad International Ltd. into a holding company for overseas businesses.
By converting Cookpad International Ltd. into a holding company and consolidating the intellectual property portfolio into it, the Company has created a new earnings source. In the Company considered that this new earnings source gives rise to excess earning power separate from the excess earning power derived from individual overseas subsidiaries continuing to grow as previously projected. The Company therefore decided that previously recognized goodwill corresponding to this separate excess earning power should be derecognized, largely because prospects of future use have essentially ceased to exist. The Company consequently plans to recognize goodwill impairment losses of 2,740,262 thousand yen, equal to the entire amount of goodwill arising from the overseas recipe service recognized through the fiscal year ended December 31, 2015.
In addition, The Company plans to recognize impairment losses totaling 843,069 thousand yen on cookpad-baby Inc. and Cucumbertown, Inc. by reassessment of their future business plans and recoverable value.
In total, impairment losses of 3,583,331 thousand yen were recorded to other expense.
16
(7) Notes on the Consolidated Financial Statements 1. Cookpad Inc.
Cookpad Inc. (the “Company”) is a Japan-based company. Its consolidated financial statements for the fiscal year ended December 31, 2016 comprise results of the Company and its subsidiaries (the “Group”) as well as the Group’s equity in affiliates.
With a corporate mission of “Make Everyday Cooking Fun,” the Group primarily provides recipe services through “Cookpad,” an Internet site which allows users to post and search cooking recipes.
2. Basis for Preparation of Financial Statements (1) Compliance with International Financial Reporting Standards (IFRS)
The consolidated financial statements are prepared in accordance with IFRS pursuant to Article 93, as either of the requirements of “Specified Company” stipulated in Article 1-2 of the Ordinance on the Terminology, Forms and Preparation of Consolidated Financial Statements (Ordinance of the Ministry of Finance No. 28 of 1976) have been fulfilled.
(2) Bases of measurement
The consolidated financial statements are prepared on the acquisition cost basis with the exception of specific financial instruments measured at their fair values.
(3) Functional currency and presentation currency
The consolidated financial statements are presented in Japanese yen, which is the Company's functional currency, and all financial information is rounded to the nearest thousand yen.
3. Principal Accounting Policy Principal accounting policies applied in preparation of the consolidated financial statements are the same with those applied in the consolidated financial statements for the fiscal year ended December 31, 2015. 4. Significant Accounting Estimates and Judgments
In preparing the consolidated financial statements, management is required to make judgments, estimates and assumptions that may affect the application of accounting policies and the reported amounts of assets, liabilities, revenues and expenses. Actual results may differ from these estimates.
These estimates and underlying assumptions are reviewed on an ongoing basis. The effect of changes in accounting estimates is recognized in the period in which the estimate is revised and future periods that are affected.
The management’s estimates and judgements that have a significant influence on the amounts recognized in these consolidated financial statements are the same with those in the consolidated financial statements for the previous fiscal year ended December 31, 2015.
5. Segment Information (1) Overview of reportable segments
A reportable segment is a component of the Group for which separate financial information is available that is evaluated regularly by management meeting in deciding how to allocate resources and in assessing performance. A business segment is a component of business activities that includes transactions with other business segments, generates revenues and incurs expenses.
The Group has business divisions and subsidiaries based on product and service categories, and each of them formulates a comprehensive strategy for both domestic and global markets according to the products and services.
The Group’s operations are therefore segmented based on the products and services handled by each of the divisions and subsidiaries. At present, the Group operates in a single reportable segment, namely, “Internet/Media.”
17
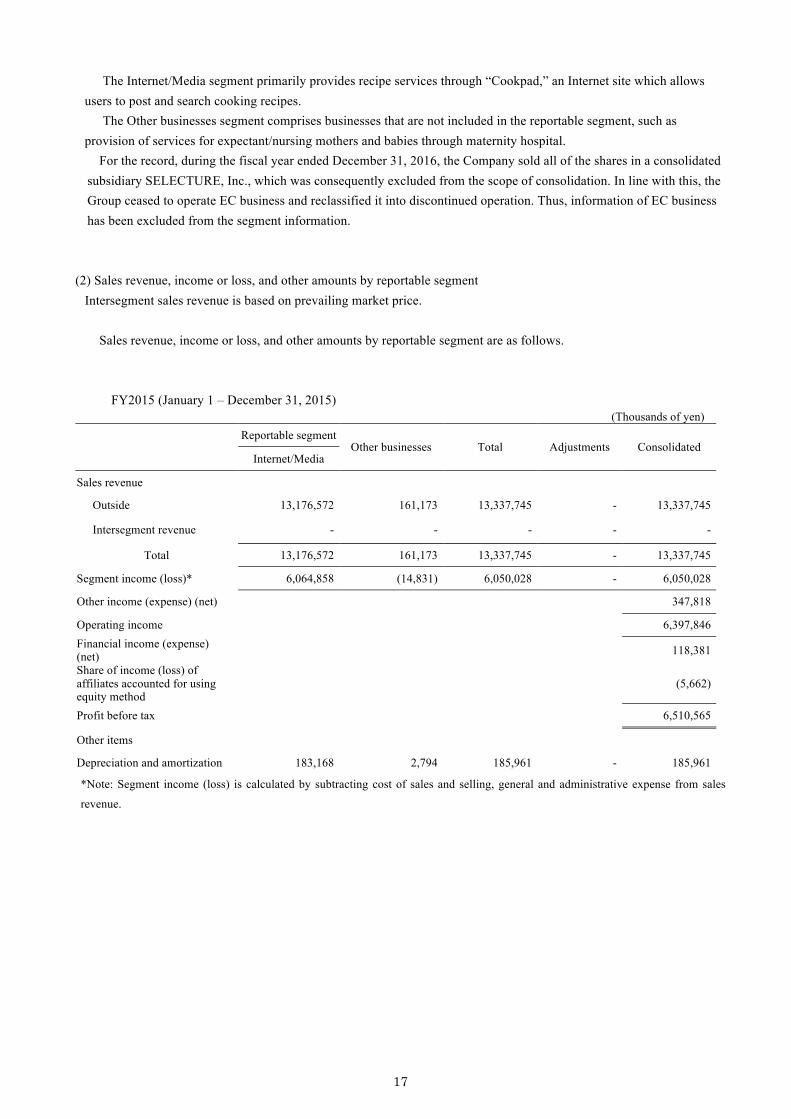
The Internet/Media segment primarily provides recipe services through “Cookpad,” an Internet site which allows users to post and search cooking recipes.
The Other businesses segment comprises businesses that are not included in the reportable segment, such as provision of services for expectant/nursing mothers and babies through maternity hospital.
For the record, during the fiscal year ended December 31, 2016, the Company sold all of the shares in a consolidated subsidiary SELECTURE, Inc., which was consequently excluded from the scope of consolidation. In line with this, the Group ceased to operate EC business and reclassified it into discontinued operation. Thus, information of EC business has been excluded from the segment information.
(2) Sales revenue, income or loss, and other amounts by reportable segment Intersegment sales revenue is based on prevailing market price.
Sales revenue, income or loss, and other amounts by reportable segment are as follows.
FY2015 (January 1 – December 31, 2015) (Thousands of yen)
Reportable segment
Other businesses Total Adjustments Consolidated Internet/Media
Sales revenue
Outside 13,176,572 161,173 13,337,745 - 13,337,745
Intersegment revenue - - - - -
Total 13,176,572 161,173 13,337,745 - 13,337,745
Segment income (loss)* 6,064,858 (14,831) 6,050,028 - 6,050,028
Other income (expense) (net) 347,818
Operating income 6,397,846 Financial income (expense) (net) 118,381
Share of income (loss) of affiliates accounted for using equity method
(5,662)
Profit before tax 6,510,565
Other items
Depreciation and amortization 183,168 2,794 185,961 - 185,961
*Note: Segment income (loss) is calculated by subtracting cost of sales and selling, general and administrative expense from sales
revenue.
18
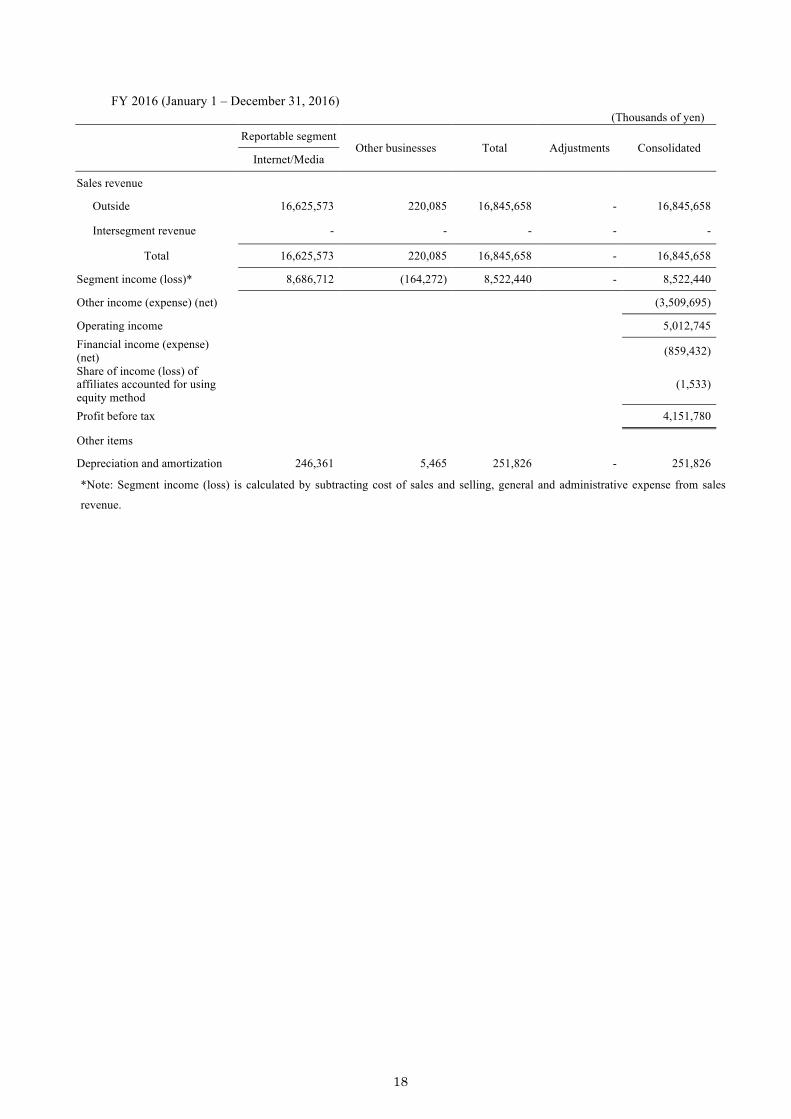
FY 2016 (January 1 – December 31, 2016) (Thousands of yen)
Reportable segment
Other businesses Total Adjustments Consolidated Internet/Media
Sales revenue
Outside 16,625,573 220,085 16,845,658 - 16,845,658
Intersegment revenue - - - - -
Total 16,625,573 220,085 16,845,658 - 16,845,658
Segment income (loss)* 8,686,712 (164,272) 8,522,440 - 8,522,440
Other income (expense) (net) (3,509,695)
Operating income 5,012,745 Financial income (expense) (net) (859,432)
Share of income (loss) of affiliates accounted for using equity method
(1,533)
Profit before tax 4,151,780
Other items
Depreciation and amortization 246,361 5,465 251,826 - 251,826
*Note: Segment income (loss) is calculated by subtracting cost of sales and selling, general and administrative expense from sales
revenue.
19
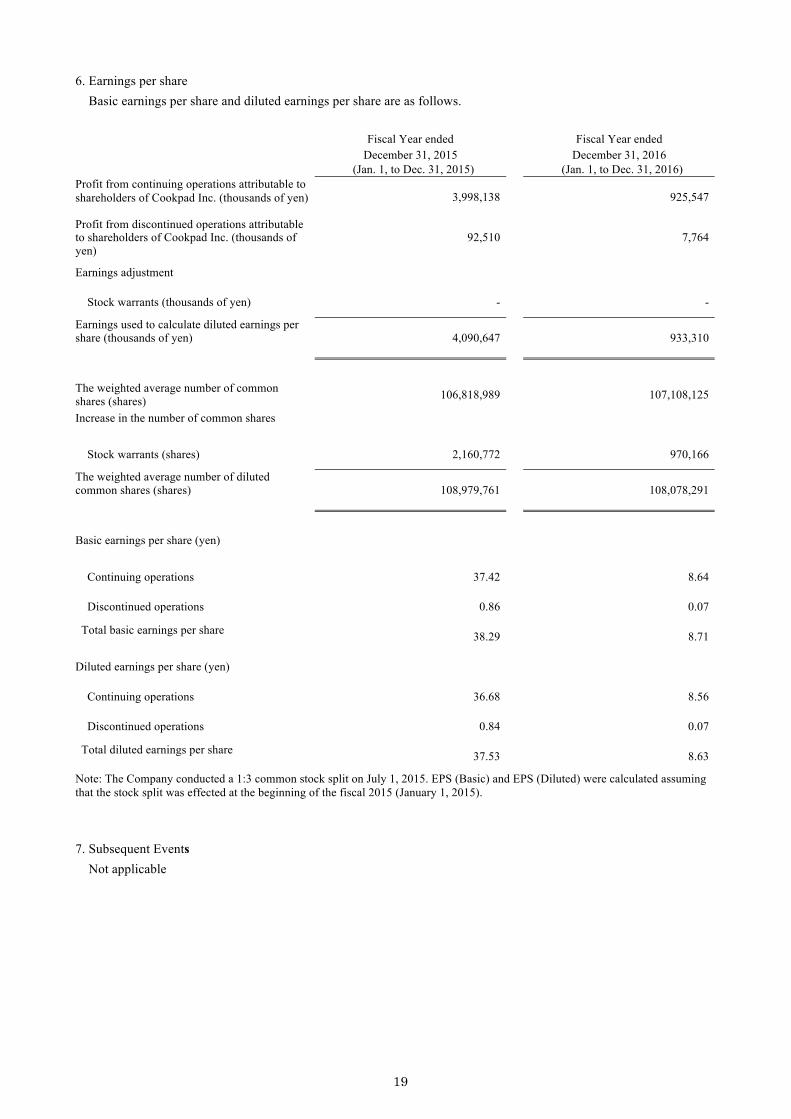
6. Earnings per share Basic earnings per share and diluted earnings per share are as follows.
Fiscal Year ended
December 31, 2015 (Jan. 1, to Dec. 31, 2015)
Fiscal Year ended December 31, 2016
(Jan. 1, to Dec. 31, 2016) Profit from continuing operations attributable to shareholders of Cookpad Inc. (thousands of yen)
3,998,138 925,547
Profit from discontinued operations attributable to shareholders of Cookpad Inc. (thousands of yen)
92,510 7,764
Earnings adjustment
Stock warrants (thousands of yen) - -
Earnings used to calculate diluted earnings per share (thousands of yen)
4,090,647 933,310
The weighted average number of common shares (shares) 106,818,989 107,108,125
Increase in the number of common shares
Stock warrants (shares) 2,160,772 970,166
The weighted average number of diluted common shares (shares)
108,979,761 108,078,291
Basic earnings per share (yen)
Continuing operations 37.42 8.64
Discontinued operations 0.86 0.07
Total basic earnings per share 38.29 8.71
Diluted earnings per share (yen)
Continuing operations 36.68 8.56
Discontinued operations 0.84 0.07
Total diluted earnings per share 37.53 8.63
Note: The Company conducted a 1:3 common stock split on July 1, 2015. EPS (Basic) and EPS (Diluted) were calculated assuming that the stock split was effected at the beginning of the fiscal 2015 (January 1, 2015).
7. Subsequent Events Not applicable