Embed Size (px)
Citation preview

Conversion to International Financial Reporting Standards
A viable society. A need. An idea.33,000 professionals. Energy.Cooperation. Aluminium. Determination.Pushing boundaries. Respect. Nature.Courage. 100 years. Thinking ahead.

ContentsTable of Contents
Introduction to Hydro IFRS reporting 3
Consolidated income statement 2006 IFRS 3Consolidated balance sheets 1 January and 31 December 2006 IFRS 4Consolidated statement of cash flows 2006 IFRS 5Consolidated statement of changes in equity 2006 IFRS 6Changes in shares outstanding 2006 7Consolidated condensed income statements – 2006 quarterly presentation IFRS 8Consolidated condensed balance sheets – 2006 quarterly presentation IFRS 9Consolidated segment information – 2006 IFRS 10
Basis for presentation of Hydro IFRS financial statements 13
IFRS accounting policies and critical accounting estimates 14
Consolidated income statement 2006 US GAAP to IFRS 21Consolidated condensed income statements – 2006 quarterly presentation US GAAP to IFRS 22First quarter 22Second quarter 23Third quarter 24Fourth quarter 25
Consolidated balance sheet 1 January 2006 US GAAP to IFRS 26Consolidated balance sheet 31 December 2006 US GAAP to IFRS 28Reconciliation of equity – 2006 quarterly presentation US GAAP to IFRS 30
US GAAP conversion to IFRS: Explanation of differences 31Introduction 31A – Presentation and classification 31B – Pensions 32C – Financial instruments 33D – Property, plant & equipment 33E – Other 34
3Conversio
ntoIFR
S
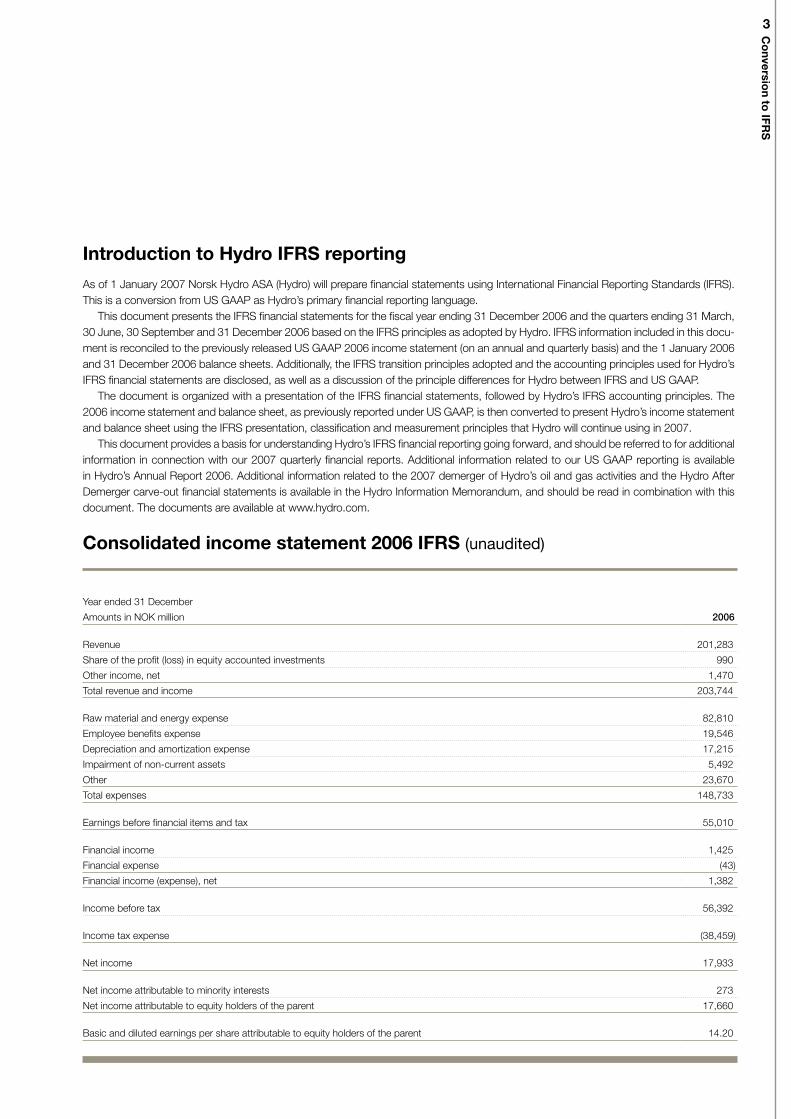
Consolidated income statement 2006 IFRS (unaudited)
Year ended 31 December
Amounts in NOK million 2006
Revenue 201,283
Share of the profit (loss) in equity accounted investments 990
Other income, net 1,470
Total revenue and income 203,744
Raw material and energy expense 82,810
Employee benefits expense 19,546
Depreciation and amortization expense 17,215
Impairment of non-current assets 5,492
Other 23,670
Total expenses 148,733
Earnings before financial items and tax 55,010
Financial income 1,425
Financial expense (43)
Financial income (expense), net 1,382
Income before tax 56,392
Income tax expense (38,459)
Net income 17,933
Net income attributable to minority interests 273
Net income attributable to equity holders of the parent 17,660
Basic and diluted earnings per share attributable to equity holders of the parent 14.20
As of 1 January 2007 Norsk Hydro ASA (Hydro) will prepare financial statements using International Financial Reporting Standards (IFRS).This is a conversion from US GAAP as Hydro’s primary financial reporting language.This document presents the IFRS financial statements for the fiscal year ending 31 December 2006 and the quarters ending 31 March,
30 June, 30 September and 31 December 2006 based on the IFRS principles as adopted by Hydro. IFRS information included in this docu-ment is reconciled to the previously released US GAAP 2006 income statement (on an annual and quarterly basis) and the 1 January 2006and 31 December 2006 balance sheets. Additionally, the IFRS transition principles adopted and the accounting principles used for Hydro’sIFRS financial statements are disclosed, as well as a discussion of the principle differences for Hydro between IFRS and US GAAP.The document is organized with a presentation of the IFRS financial statements, followed by Hydro’s IFRS accounting principles. The
2006 income statement and balance sheet, as previously reported under US GAAP, is then converted to present Hydro’s income statementand balance sheet using the IFRS presentation, classification and measurement principles that Hydro will continue using in 2007.This document provides a basis for understanding Hydro’s IFRS financial reporting going forward, and should be referred to for additional
information in connection with our 2007 quarterly financial reports. Additional information related to our US GAAP reporting is availablein Hydro’s Annual Report 2006. Additional information related to the 2007 demerger of Hydro’s oil and gas activities and the Hydro AfterDemerger carve-out financial statements is available in the Hydro Information Memorandum, and should be read in combination with thisdocument. The documents are available at www.hydro.com.
Introduction to Hydro IFRS reporting

4
eAmounts in NOK million 31 December 1 January
Assets
Cash and cash equivalents 6,760 10,463
Short-term investments 15,020 3,865
Accounts receivable 34,508 35,438
Inventories 16,497 14,553
Other current assets 7,980 6,955
Assets held for sale 3,691 -
Total current assets 84,457 71,275
Investments accounted for using the equity method 10,690 10,844
Property, plant and equipment 119,075 124,032
Intangible assets 11,475 10,371
Financial assets 4,914 5,452
Other non-current assets 303 96
Deferred tax assets 2,177 1,815
Total non-current assets 148,635 152,611
Total assets 233,092 223,885
Liabilities and equity
Trade and other payables 29,785 27,832
Bank loans and other interest-bearing short-term debt 3,655 5,037
Provisions 2,197 1,200
Taxes payable 18,995 13,843
Other current liabilities 7,949 9,066
Liabilities included in disposal groups 1,011 -
Total current liabilities 63,591 56,978
Long-term debt 19,619 21,387
Provisions 14,357 10,883
Pension obligation 12,605 12,921
Other financial liabilities 353 402
Other liabilities 2,702 2,750
Deferred tax liabilities 23,265 27,820
Total non-current liabilities 72,900 76,164
Total liabilities 136,491 133,142
Share capital 4,708 4,739
Additional paid-in capital 9,736 10,501
Other reserves (1,533) 723
Retained earnings 89,544 77,390
Treasury shares (6,624) (3,589)
Equity attributable to equity holders of the parent 95,831 89,763
Minority interest 771 980
Total equity 96,601 90,743
Total liabilities and equity 233,092 223,885
Consolidated balance sheets1 January and 31 December 2006 IFRS (unaudited)

5Conversio
ntoIFR
S
Consolidated statement of cash flows 2006 IFRS (unaudited)
Year ended 31 December,
Amounts in NOK million 2006
Operating activities:
Net income 17,933
Adjustments to reconcile net income to net cash provided by operating activities:
Depreciation, amortization and impairment losses 22,707
Share of profits in equity accounted investments (990)
Dividends received from equity accounted investments 417
Deferred taxes (3,733)
Loss on sale of non-current assets 519
Gain on foreign currency transactions (1,011)
Net sales of trading securities 29
Capitalized interest (1,231)
Other (962)
Working capital changes that provided (used) cash:
Receivables 203
Inventories (2,095)
Other current assets 543
Other current liabilities 6,055
Net cash provided by operating activities 38,384
Investing activities:
Purchases of property, plant and equipment (15,927)
Purchases of other long-term investments (6,197)
Purchases of short-term investments (22,650)
Proceeds from sales of property, plant and equipment 358
Proceeds from sales of other long-term investments 1,658
Proceeds from sales of short-term investments 11,550
Net cash used in investing activities (31,208)
Financing activities:
Loan proceeds 89
Principal repayments (1,431)
Ordinary shares purchased (3,949)
Ordinary shares issued 59
Dividends paid (5,506)
Net cash used in financing activities (10,738)
Foreign currency effects on cash and bank overdraft 319
Net decrease in cash, cash equivalents and bank overdraft (3,243)
Cash, cash equivalents and bank overdraft reclassified to assets held for sale (47)
Cash, cash equivalents and bank overdraft at beginning of year 9,964
Cash, cash equivalents and bank overdraft at end of year 6,674
Specification of cash disbursements included above in operating activities regarding:
Interest 1) 853
Income taxes 37,057
1) Includes cash disbursements relating to early repayment of long-term debt (“breaking costs”) of NOK 15 million.
6
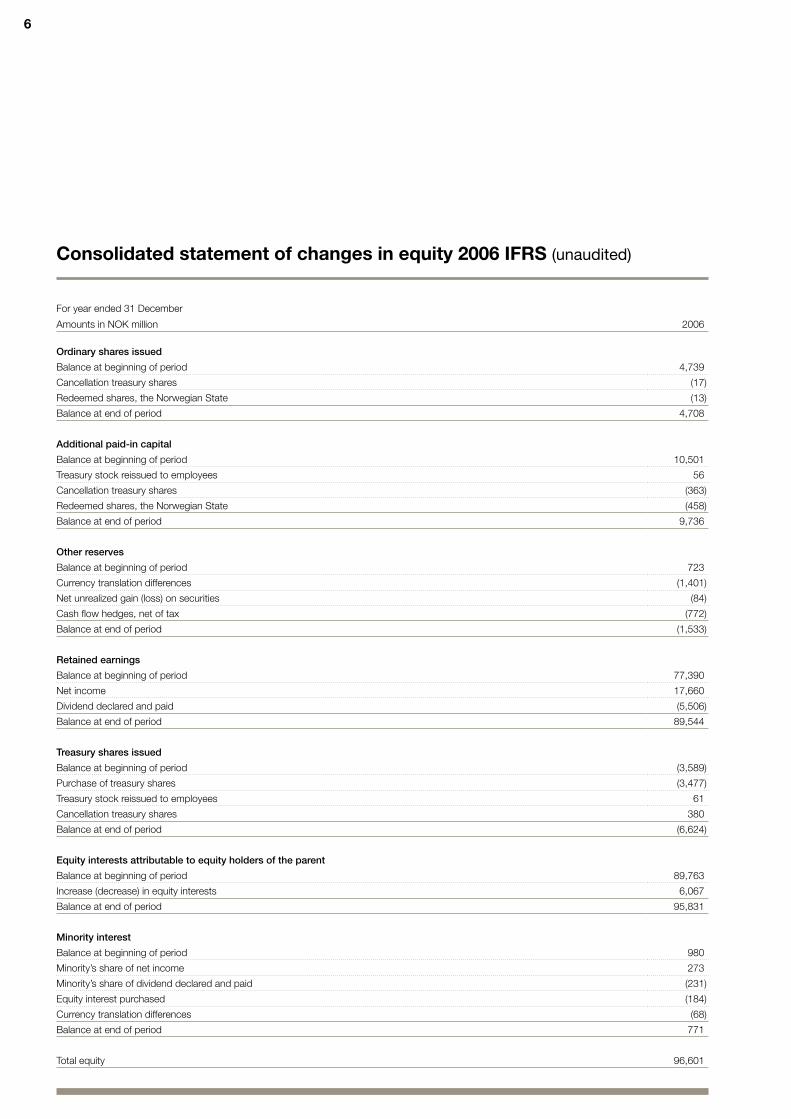
Consolidated statement of changes in equity 2006 IFRS (unaudited)
For year ended 31 December
Amounts in NOK million 2006
Ordinary shares issued
Balance at beginning of period 4,739
Cancellation treasury shares (17)
Redeemed shares, the Norwegian State (13)
Balance at end of period 4,708
Additional paid-in capital
Balance at beginning of period 10,501
Treasury stock reissued to employees 56
Cancellation treasury shares (363)
Redeemed shares, the Norwegian State (458)
Balance at end of period 9,736
Other reserves
Balance at beginning of period 723
Currency translation differences (1,401)
Net unrealized gain (loss) on securities (84)
Cash flow hedges, net of tax (772)
Balance at end of period (1,533)
Retained earnings
Balance at beginning of period 77,390
Net income 17,660
Dividend declared and paid (5,506)
Balance at end of period 89,544
Treasury shares issued
Balance at beginning of period (3,589)
Purchase of treasury shares (3,477)
Treasury stock reissued to employees 61
Cancellation treasury shares 380
Balance at end of period (6,624)
Equity interests attributable to equity holders of the parent
Balance at beginning of period 89,763
Increase (decrease) in equity interests 6,067
Balance at end of period 95,831
Minority interest
Balance at beginning of period 980
Minority’s share of net income 273
Minority’s share of dividend declared and paid (231)
Equity interest purchased (184)
Currency translation differences (68)
Balance at end of period 771
Total equity 96,601
7Conversio
ntoIFR
S
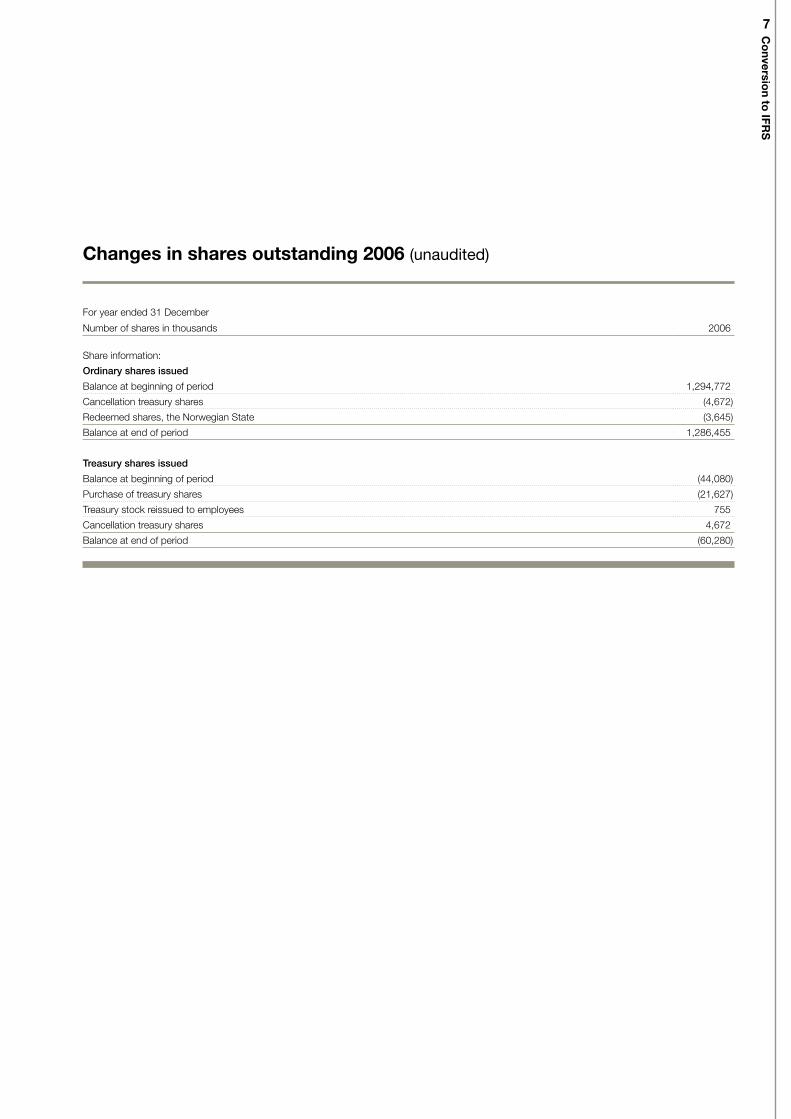
For year ended 31 December
Number of shares in thousands 2006
Share information:
Ordinary shares issued
Balance at beginning of period 1,294,772
Cancellation treasury shares (4,672)
Redeemed shares, the Norwegian State (3,645)
Balance at end of period 1,286,455
Treasury shares issued
Balance at beginning of period (44,080)
Purchase of treasury shares (21,627)
Treasury stock reissued to employees 755
Cancellation treasury shares 4,672
Balance at end of period (60,280)
Changes in shares outstanding 2006 (unaudited)

8
Amounts in NOK millionFirst
quarterSecondquarter
Thirdquarter
Fourthquarter 2006
Revenue 53,050 49,711 50,309 48,213 201,283
Share of the profit (loss) in equity accounted investments 321 376 234 59 990
Other income, net 244 432 298 496 1,470
Revenue and income 53,615 50,519 50,841 48,768 203,744
Depreciation, amortization and impairment 4,131 4,094 6,057 8,425 22,707
Other expenses 32,613 30,593 30,622 32,198 126,026
Total expenses 36,745 34,686 36,679 40,624 148,733
Earnings before financial items and tax 16,870 15,833 14,162 8,144 55,010
Financial income (expense), net 664 792 (819) 745 1,382
Income before tax 17,534 16,626 13,343 8,889 56,392
Income tax expense (12,751) (10,693) (9,486) (5,529) (38,459)
Net income 4,783 5,932 3,858 3,361 17,933
Net income attributable to minority interests (77) 103 238 8 273
Net income attributable to equity holders of the parent 4,859 5,829 3,619 3,353 17,660
Basic and diluted earnings per share attributable to equity holders of the parent 3.90 4.70 2.90 2.70 14.20
Consolidated condensed income statements– 2006 quarterly presentation IFRS (unaudited)

9Conversio
ntoIFR
S
Amounts in NOK million 1 January 31 March 30 June 30 September 31 December
Cash and cash equivalents 10,463 20,762 7,725 16,490 6,760
Short-term investments 3,865 3,850 12,669 12,699 15,020
Receivables and other current assets 42,393 48,294 47,021 47,587 42,488
Inventories 14,553 15,230 15,985 16,310 16,497
Assets held for sale - - - - 3,691
Total current assets 71,275 88,135 83,400 93,086 84,457
Property, plant and equipment 124,032 123,349 122,106 123,298 119,075
Other non-current assets 28,579 28,159 28,348 31,044 29,561
Total non-current assets 152,611 151,508 150,454 154,341 148,635
Total assets 223,885 239,643 233,854 247,427 233,092
Bank loans and other interest-bearing short-term debt 5,037 3,855 3,545 3,346 3,655
Other current liabilities 51,941 66,068 65,381 72,418 58,925
Liabilities included in disposal groups - - - - 1,011
Total current liabilities 56,978 69,923 68,926 75,763 63,591
Long-term debt 21,387 20,814 19,942 20,653 19,619
Other long-term liabilities 26,957 27,521 27,480 27,729 30,017
Deferred tax liabilities 27,820 27,379 26,370 27,153 23,265
Total non-current liabilities 76,164 75,714 73,792 75,536 72,900
Total liabilities 133,142 145,637 142,718 151,299 136,491
Equity attributable to equity holders of the parent 89,763 93,135 90,436 95,336 95,831
Minority interest 980 871 700 792 771
Total equity 90,743 94,006 91,136 96,129 96,601
Total liabilities and equity 223,885 239,643 233,854 247,427 233,092
Consolidated condensed balance sheets– 2006 quarterly presentation IFRS (unaudited)

10
Consolidated segment information– 2006 IFRS (unaudited)
Amounts in NOK million First quarter Second quarter Third quarter Fourth quarter 2006
Total revenueExploration and Production 20,561 17,818 19,863 19,235 77,476
Energy and Oil Marketing 22,218 20,182 20,823 20,008 83,232
Eliminations (15,077) (14,267) (14,028) (13,914) (57,286)
Oil & Energy 27,702 23,733 26,658 25,329 103,422
Aluminium Metal 17,933 17,906 16,182 16,239 68,259
Aluminium Products 12,967 13,538 13,263 13,819 53,588
Other activities 2,935 2,719 2,582 2,818 11,054
Corporate and eliminations (8,486) (8,185) (8,376) (9,992) (35,040)
Total 53,050 49,711 50,309 48,213 201,283
External revenueExploration and Production 6,106 4,298 5,473 5,658 21,534
Energy and Oil Marketing 20,359 18,211 19,722 16,544 74,837
Eliminations 2 (2) - 63 63
Oil & Energy 26,467 22,507 25,195 22,266 96,434
Aluminium Metal 11,602 11,606 9,912 10,482 43,603
Aluminium Products 12,910 13,476 13,205 13,740 53,331
Other activities 2,077 2,125 1,996 1,719 7,917
Corporate and eliminations (5) (4) 1 7 (1)
Total 53,050 49,711 50,309 48,213 201,283
Internal revenueExploration and Production 14,455 13,520 14,390 13,577 55,942
Energy and Oil Marketing 1,859 1,971 1,101 3,464 8,395
Eliminations (15,079) (14,265) (14,028) (13,977) (57,350)
Oil & Energy 1,235 1,226 1,463 3,064 6,988
Aluminium Metal 6,331 6,299 6,270 5,757 24,657
Aluminium Products 58 62 58 80 257
Other activities 858 593 586 1,099 3,137
Corporate and eliminations (8,482) (8,181) (8,377) (10,000) (35,039)
Total - - - - -
Share of the profit (loss) in equity accounted investmentsExploration and Production 2 2 2 1 7
Energy and Oil Marketing 56 73 47 42 218
Eliminations - - - - (2)
Oil & Energy 58 75 49 42 223
Aluminium Metal 233 249 385 (12) 854
Aluminium Products 18 30 (224) 9 (168)
Other activities 13 17 22 20 73
Corporate and eliminations - 6 2 - 8
Total 321 376 234 59 990

11Conversio
ntoIFR
S
Amounts in NOK million First quarter Second quarter Third quarter Fourth quarter 2006
Depreciation, amortization and impairmentExploration and Production 2,886 2,757 4,813 6,543 16,999
Energy and Oil Marketing 181 174 165 311 831
Eliminations - - - - -
Oil & Energy 3,067 2,931 4,979 6,853 17,830
Aluminium Metal 507 497 494 694 2,192
Aluminium Products 437 552 462 709 2,159
Other activities 117 115 119 167 518
Corporate and eliminations 3 (1) 3 1 7
Total 4,131 4,094 6,057 8,425 22,707
Earnings before financial items and taxExploration and Production 12,927 11,675 10,860 7,246 42,707
Energy and Oil Marketing 1,157 1,178 944 1,324 4,603
Eliminations 57 344 381 539 1,321
Oil & Energy 14,140 13,196 12,186 9,109 48,632
Aluminium Metal 1,706 2,333 2,365 899 7,302
Aluminium Products 486 326 (435) (481) (104)
Other activities 134 245 264 736 1,379
Corporate and eliminations 404 (267) (217) (2,119) (2,199)
Total 16,870 15,833 14,162 8,144 55,010
Adjusted EBITDAExploration and Production 15,813 14,432 15,673 13,788 59,706
Energy and Oil Marketing 1,343 1,357 1,121 1,640 5,461
Eliminations 57 344 382 540 1,323
Oil & Energy 17,213 16,133 17,176 15,968 66,490
Aluminium Metal 2,223 2,841 2,868 1,603 9,536
Aluminium Products 938 892 281 242 2,353
Other activities 251 360 383 939 1,933
Corporate and eliminations 407 (274) (215) (2,118) (2,201)
Total 21,033 19,952 20,493 16,635 78,112
InvestmentsExploration and Production 3,463 3,540 6,598 6,789 20,390
Energy and Oil Marketing 246 533 496 757 2,032
Eliminations - - - - -
Oil & Energy 3,709 4,073 7,093 7,546 22,421
Aluminium Metal 514 505 504 993 2,515
Aluminium Products 232 227 241 552 1,252
Other activities 107 102 232 206 647
Corporate and eliminations 12 6 12 5 35
Total 4,572 4,912 8,083 9,302 26,869

12
Current assets Non-current assets Total assets
Amounts in NOK million 31.12.2006 01.01.2006 31.12.2006 01.01.2006 31.12.2006 01.01.2006
Exploration and Production 30,502 38,572 90,538 90,598 121,040 129,170
Energy and Oil Marketing 26,312 31,362 20,003 20,174 46,315 51,536
Eliminations (5,044) (7,419) 17 (175) (5,027) (7,594)
Oil & Energy 51,771 62,516 110,557 110,596 162,328 173,112
Aluminium Metal 69,871 44,237 25,368 25,267 95,239 69,504
Aluminium Products 27,527 28,997 13,094 16,456 40,621 45,453
Other activities 8,476 7,698 5,733 5,379 14,209 13,077
Corporate and eliminations (76,879) (72,174) (6,117) (5,087) (82,996) (77,261)
Total continued operations 80,766 71,275 148,635 152,611 229,401 223,885
Classified as held for sale 3,691 - - - 3,691 -
Total 84,457 71,275 148,635 152,611 233,092 223,885
Investments accounted forusing the equity method Segment debt
Amounts in NOK million 31.12.2006 01.01.2006 31.12.2006 01.01.2006
Exploration and Production 54 52 12,537 10,061
Energy and Oil Marketing 2,042 2,597 7,431 10,527
Eliminations 16 18 (1) -
Oil & Energy 2,112 2,667 19,968 20,588
Aluminium Metal 4,926 3,851 9,800 7,588
Aluminium Products 1,913 2,460 5,863 5,638
Other activities 1,176 1,134 2,206 2,080
Corporate and eliminations 563 732 2,094 2,204
Total continued operations 10,690 10,844 39,930 38,098
Classified as held for sale 279 - 720 -
Total 10,969 10,844 40,650 38,098
Consolidated segment information– 2006 IFRS (unaudited)

13Conversio
ntoIFR
S
Basis for presentation of Hydro IFRS financial statements
IntroductionHydro will use IFRS as the primary GAAP for financial reporting,with a transition date of 1 January 2006. The first IFRS reportingperiod will be 2007 with comparable IFRS figures presented for2006. Hydro has implemented all IFRS standards issued as of 1May 2007, and the 31 December 2007 annual financial statementsand 2006 comparable figures will be presented using all requiredIFRS standards for accounting periods ending 31 December 2007.The European Unions’s (EU) Regulation (the “regulation”) requires
the use of IFRS as approved by the EU for all listed companies inthe EU and European Economic Area (EEA). The regulation wasincorporated into Norwegian law in December 2004, and appliesto Hydro. The United States Securities and Exchange Commission(SEC) allows companies using IFRS as their primary GAAP to filetheir annual financial statements with the SEC using IFRS with a rec-onciliation to US GAAP with certain reliefs compared to companiesusing foreign national GAAPs. Hydro will use IFRS as approved bythe IASB in the financial statements. However, the standard settingprocess is such that there may be a standard issued by the IASBapplicable for Hydro, that has not yet been approved by the EU asof the date of Hydro’s financial statements. Therefore, it may occurthat Hydro’s annual financial statements that are filed with the SECare prepared in accordance with IFRS as approved by the EU, witha reconciliation to IFRS as approved by the IASB, that is then recon-ciled to US GAAP.
Transition to IFRS – IFRS 1 elected exemptionsHydro’s transition to IFRS follows the regulation in IFRS 1 First-timeAdoption of International Financial Reporting Standards (IFRS 1).IFRS 1 offers the possibility to utilize certain exemptions from ret-rospective implementation of IFRS as if always applied. Hydro hasevaluated the options available in IFRS 1, and has elected to adopttransition implementation policies in the areas of business combina-tions, employee benefits, cumulative translation differences, desig-nation of previously recognized financial instruments, share-basedpayment transactions and asset retirement obligations. A summaryof these transition accounting policies is given below. Transitionpolicies available in IFRS 1 that are not material for Hydro are notincluded in the discussion.
Business combinationsIFRS 3 Business Combinations (IFRS 3) deviates in certain respectswhen compared to the US GAAP standards applicable for account-ing for business combinations. The implementation guidance for thecurrent US GAAP standards gives, for certain acquisitions, a differ-ent result compared to full retrospective implementation of IFRS 3.Hydro has elected to utilize the option in IFRS 1 to not apply IFRS3 retrospectively to past business combinations completed as of1 January 2006. The impact of this policy decision is that all prior
business combinations will continue to be accounted for as theyoriginally were under US GAAP, including the allocation of acquisi-tion cost. This includes the recognition of any goodwill identified inthese transactions.
Employee benefitsIFRS 1 allows for all cumulative actuarial gains and losses at thedate of transition to be recognized as of the date of transition asan alternative to full retrospective application of IAS 19 EmployeeBenefits. Hydro has chosen to adopt this transition policy, and hasrecognized all 1 January 2006 cumulative actuarial gains and lossesat the date of transition with the effect posted directly against equity.Hydro applies the same economic and actuarial assumptions underIFRS as applied under US GAAP, and will continue to use the cor-ridor approach when accounting for actuarial gains and losses onan ongoing basis.
Cumulative translation differencesIFRS 1 offers the first-time adopter of IFRS the option to reset thecumulative translation differences that existed at the date of adop-tion (i.e. the US GAAP translation differences) to zero as of the dateof transition to IFRS as an alternative to establishing a cumulativetranslation difference as if the accounting and translation principlesin IAS 21 The Effects of Changes in Foreign Exchange Rates hadalways been used and the measurement of assets and liabilities hadbeen as required by currently implemented IFRS. Hydro has electedto utilize this option, and has reset the cumulative translation differ-ences for all foreign operations to zero as of 1 January 2006. Futuregains or losses on a subsequent disposal of any foreign opera-tion will therefore exclude translation differences that arose before1 January 2006.
Designation of previously recognized financial instrumentsMarketable and non-marketable trading shares as defined underUS GAAP are classified as financial assets at fair value throughprofit and loss under IFRS. Shares held for trading are classifiedas part of Short-term investments. Hydro has elected that non-marketable shares previously classified under US GAAP as notheld for trading are classified as available-for-sale under IFRSwith changes in fair value booked against equity. The shares arepresented in the balance sheet as part of Financial Assets. Non-marketable shares in the US GAAP balance sheet were classifiedas Prepaid pension, investment and other non-current assets, andmeasured at cost.
Share-based payment transactionsHydro adopted IFRS2Share-basedPayment (IFRS2) as of 1 January2006. IFRS 1 encourages first-time adopters of IFRS to apply IFRS 2to equity instruments granted on or before 7 November 2002. Hydro

14
has applied IFRS 2 to all share-based payments, including the shareappreciation rights granted prior to 7 November 2002.
Asset retirement obligationsIFRS 1 allows for a simplified treatment of historic changes whenestimating the asset retirement obligations between the initial incep-tion of the liability and the adoption of IFRS. Hydro has elected toutilize this option. The asset retirement obligations have been cal-culated as of Hydro’s 1 January 2006 transition date in accordancewith IAS 37 Provisions using the best estimate of removal cost andtiming, and the risk free interest rates for the relevant currencies andexpected life of the asset as of the date of estimation. The IFRS
estimate resulted in an increase in recognized asset retirement ob-ligations of NOK 3,040 million as of 1 January 2006. The estimatedamount that would have been included in the historical cost of theasset, based on historical interest rates and accumulated deprecia-tion based on that amount, have been calculated. That estimatedamount is only insignificantly different from the asset value recog-nized under US GAAP. Hydro has therefore not recognized any dif-ference in historical cost or carrying value of the related fixed assetsin connection with the transition to IFRS.
IntroductionNorsk Hydro ASA is an offshore producer of oil and gas, as wellas an integrated aluminium supplier with operations in nearly 40countries. The 2006 consolidated income statements, balancesheets, statements of cash flows and statements of changes inequity of Norsk Hydro ASA and its subsidiaries (Hydro), presentedboth on an annual and quarterly basis, are prepared in accordancewith International Financial Reporting Standards (IFRSs) and areincluded on pages 3 to 12 of this document.Prior to adoption of IFRS as of 1 January 2007, Hydro’s primary
financial statements were prepared in accordance with accountingprinciples generally accepted in the United States of America (USGAAP). The 2006 consolidated income statements and balancesheets, reconciled from US GAAP to IFRS, are located on pages21 to 25. An equity reconciliation from US GAAP to IFRS is foundon page 30. The statement of cash flows is not reconciled fromUS GAAP to IFRS. See the section “US GAAP and IFRS financialstatement differences” for an explanation of the Hydro accountingpolicy differences between US GAAP and IFRS, which includes adiscussion of the statement of cash flows differences.The financial information has been prepared on a historical
cost basis except for the revaluation of certain non-current as-sets and liabilities and financial instruments. Preparation of the fi-nancial information requires management to make estimates andassumptions that affect the reported amounts of assets, liabilities,revenues and expenses as well as the contingency disclosures.Actual results may differ from estimates. See the discussion at theend of this section titled “Critical accounting estimates.”This section of the document describes the Hydro IFRS ac-
counting policies. See the Annual Report 2006 note 1 for a com-parable summary of Hydro’s US GAAP accounting policies.
Basis of consolidationThe consolidated financial statements include Norsk Hydro ASAand subsidiary companies. Hydro consolidates subsidiaries whereHydro owns, directly or indirectly, more than 50 percent of the vot-ing power or exercises control. Hydro consolidates special purposeentities (SPEs) determined to be controlled by Hydro. Control isachieved when Hydro has the power to govern the financial andoperating policies of the entity or power over more than half of thevoting rights by virtue of an agreement with other investors.All significant intercompany transactions and balances have
been eliminated.
Business combinationsBusiness combinations are accounted for using the purchasemethod in accordance with IFRS 3 Business Combinations (IFRS3). The purchase price is the sum of the fair values, as of the dateof exchange, of the assets given, liabilities incurred or assumed,and equity instruments issued by Hydro in exchange for control ofthe acquiree, plus any costs directly attributable to the combination.The acquiree’s identifiable assets, liabilities and contingent liabilitiesare recognized separately at the acquisition date at their fair valueirrespective of any minority interest.Goodwill is recognized from the date of exchange and is initially
measured as the excess of the purchase price over Hydro’s interestin the net fair value of the acquiree’s identifiable assets, liabilities andcontingent liabilities. Goodwill is not amortized, but is reviewed forimpairment annually and more frequently if indicators of possibleimpairment are observed, in accordance with IAS 36 Impairment ofAssets. Goodwill is allocated to the groups of cash generating unitsexpected to benefit from the synergies of the combination and thatare monitored for internal management purposes. For Hydro this isthe sector level in Aluminium Metal and Aluminium Products, andthe sub-segment level in Oil & Energy.
IFRS accounting policies and critical accounting estimates
15Conversio
ntoIFR
S
The interest of minority shareholders in the acquiree is initially mea-sured as the minority’s proportion of the net fair value of the assets,liabilities and contingent liabilities recognized.
See the Annual Report 2006 note 2 for a description of signifi-cant acquisitions and disposals during 2006.
Investments in associates and joint venturesHydro accounts for associates using the equity method. The defini-tion of an associate is based on Hydro’s ability to exercise significantinfluence, which is the power to participate in the financial and oper-ating policies of the entity. Significant influence is assumed to exist ifHydro owns between 20 to 50 percent of the voting rights. However,exercise of judgment may lead to the conclusion of significant influ-ence at ownership levels less than 20 percent or a lack of significantinfluence at ownership percentages greater than 20 percent. Hydrouses the equity method for a limited number of investees whereHydro owns less than 20 percent of the voting rights, based on anevaluation of the governance structure in each investee.A joint venture is an entity, asset or operation that is subject to con-
tractually established joint control. In corporate joint ventures, specialvoting rights in some companies give each of the partners decisionrights that exceed what normally would follow from the ownershipshare. This may be in the form of a specified number of board repre-sentatives, in the form of a right of refusal on important decisions, orby requiring a qualified majority for all or most of the important deci-sions. Participation in joint ventures is accounted for using the equitymethod, except for jointly controlled assets or operations where thepartners have a direct ownership in the assets or direct participation inoperations (undivided interest). These joint ventures are accounted forby includingHydro’s share of assets, liabilities, income and expense ona line-by-line basis (the proportional method).The equity method involves showing the investment in the asso-
ciate or joint venture at Hydro’s percentage ownership of the equityin the associate or joint ventures, including any excess values orgoodwill. Hydro’s share of net income, including depreciation andamortization of excess values, is included in Share of the profit orloss of associates and joint ventures. Material unrealized profits re-sulting from transactions with an associate or equity accounted jointventure are eliminated. The proportional method involves consoli-dating the income statement and balance sheet of the joint venturesbased on Hydro’s percentage ownership in the joint ventures, withfull elimination of inter-company transactions.The financial statements of associates and joint ventures are pre-
pared for the same reporting year as the group. Where necessary,adjustments are made to those financial statements to bring theaccounting policies used into line with those of Hydro.Hydro reviews investments in associates and joint ventures for
impairment when indicators of a possible loss in value are identified.As Hydro’s investees generally are not listed on a stock exchange or
regularly traded, our impairment review for such investees can onlyin rare cases be based on market prices. Impairment indicators in-clude such items as operating losses or adverse market conditions.The fair value of the investment is estimated based on valuationmodel techniques. If the estimated fair value of the investee is be-low Hydro’s carrying value and the impairment is considered to beprolonged, the investment is written down as impaired. Impairmentlosses are reversed if the impairment situation is deemed to nolonger exist.
Assets held for sale and discontinued operationsWhen an asset or a group of assets are decided to be sold, they arereported separately as Assets held for sale in accordance with IFRS5 Non-current Assets Held for Sale and Discontinued Operations,provided that the sale is highly probable, which includes the criteriathat management is committed to the sale, and that the sale will becompleted within one year. Assets held for sale are not depreciated,but are measured at the lower of book value and the fair value lesscosts to sell. Assets meeting the criteria for presentation as an Assetheld for sale are not reclassified as an Asset held for sale in priorperiod balance sheets. Immaterial disposal groups are not classifiedas assets held for sale.A discontinued operation is a component of Hydro that can be
clearly distinguished from the rest of Hydro, both operationally andfor financial reporting purposes. A discontinued operation is be aseparate major line of business or a geographical area of opera-tions. Cash flows, results of operations and any gain or loss fromdisposal are excluded from Earnings before financial items and taxand reported separately as discontinued.Components disposed of through a spin-off to shareholders are
presented as Discontinued operations as of the date of disposal.Prior period results of operations are reclassified to be comparable.
ProvisionsProvisions are recognized when Hydro has a present obligation (le-gal or constructive) as a result of a past event, and it is probable thatHydro will be required to settle the obligation. Hydro recognizes pro-visions only when a reliable estimate can be made of the amount,taking into account the risks and uncertainties. If a provision is mea-sured using the cash flows estimated to settle the present obliga-tion, its carrying amount is the present value of the cash flows. Seealso the accounting policy discussion for asset retirement obliga-tions and share-based payments.
Restructuring costs Hydro recognizes a provision for costs as-sociated with an exit or disposal activity upon formal commitmentto an exit plan. A provision for termination benefits related to theinvoluntary termination of employees is recognized as of the date ofemployee notification.

16
Foreign currency translationIn individual companies, transactions in foreign currencies are initiallyrecorded in the functional currency by applying the rate of exchangeas of the date of the transaction. Monetary assets and liabilities de-nominated in foreign currencies are translated into the functional cur-rency at the rate of exchange ruling at the balance sheet date. Therealized and unrealized currency gains or losses are included in finan-cial expenses. Non-monetary assets and liabilities that are measuredin terms of historical cost in a foreign currency are translated into thefunctional currency using the rates of exchange as of the date of theinitial transaction.In the consolidated financial statements, the assets and liabilities
of non-Norwegian krone functional currency subsidiaries, joint ven-tures and associates, including the related goodwill, are translatedinto Norwegian krone using the rate of exchange as of the balancesheet date. The results and cash flows of non-Norwegian kronefunctional currency subsidiaries, joint ventures and associates aretranslated into Norwegian krone using the average exchange rate forthe period reported. Exchange adjustments arising when the open-ing net assets and the net income for the year retained by the non-Norwegian krone operation are translated into Norwegian kroner aretaken into Other reserves and reported in the statement of changesin equity. On disposal of a non-Norwegian krone functional currencysubsidiary, joint venture or associate, the deferred cumulative amountrecognized in equity relating to that particular non-Norwegian kroneentity is recognized in the income statement.
Revenue recognitionRevenue from sales of products, including products sold in interna-tional commodity markets, is recognized when ownership passes tothe customer. Generally, this is when products are delivered. Certaincontracts specify price determination in a later period. In these cases,the revenue is recognized when the revenue can be measured reli-ably. Rebates and incentive allowances are deferred and recognizedin income upon the realization or at the closing of the rebate period.In arrangements where Hydro acts as an agent, such as commissionsales, only the net commission fee is recognized as revenue.Revenues from the production of oil and gas are recognized
on the basis of the company’s net working interest, regardless ofwhether the production is sold (entitlement method). The differencebetween Hydro’s share of produced volumes and sold volumes isnot material.Activities related to the trading of derivative commodity instru-
ments, or related to the purchase or delivery of physical commodi-ties on a widely recognized commodity exchange or delivery hub,as well as physical commodity swaps with a single counterparty, arepresented on a net basis in the income statement, with the marginfrom trading recognized in revenues.
Cash and cash equivalentsCash and cash equivalents includes cash, bank deposits andall other monetary instruments with a maturity of less than threemonths from the date of acquisition.Cash and cash equivalents, as defined for reporting purposes in
the statement of cash flows, consist of cash and cash equivalentsas defined above, net of outstanding bank overdrafts connected tocash management activities.
Short-term investmentsShort-term investments include bank deposits and all other mon-etary instruments with a maturity between three and twelve monthsat the date of purchase and Hydro’s current portfolio of marketableequity and debt securities. The securities in this portfolio are con-sidered trading securities and are valued at fair value. The resultingunrealized holding gains and losses are included in financial incomeand expense. Investment income is recognized when earned.
Accounts receivableAccounts receivable are presented at fair value at inception in thebalance sheet and reviewed for impairment on an ongoing basis.Hydro recognizes an impairment loss on individual accounts basedon an assessment of delayed payments, and other indicators offinancial difficulty of the customer. Excluding the account balancesthat have been impaired based on the individual account evalua-tion process, Hydro then assesses all remaining overdue accountsreceivable for impairment based on prior collection experience, thecustomer portfolio and business and political climate.
InventoriesInventories are valued at the lower of cost, using the first-in, first-outmethod (FIFO), or net realizable value. Cost includes direct materi-als, direct labor and the appropriate portion of production overheador the purchase price of the inventory. Abnormal amounts of idlefacility expense, freight, handling costs, and wasted materials arerecognized as expense in the current period.
Non-current assetsNon-current assets include Hydro’s portfolio of long-term market-able equity securities that are not consolidated or accounted forusing the equity method. The portfolio is considered as available-for-sale securities and is measured at fair value with changes in fairvalue recognized through equity. Other investment income is recog-nized when earned. Investments are reviewed for impairment if indi-cations of a loss in value are identified. Fair value of the investment isestimated based on valuation model techniques for non-marketablesecurities. When the estimated fair value of the investee is belowHydro’s carrying value the impairment is recognized in earnings.

17Conversio
ntoIFR
S
Property, plant and equipmentProperty, plant and equipment (PP&E) is recognized based uponmanagement’s assessment of probable future economic benefitand when the acquisition cost can be measured reliably. PP&E bookvalue is the historical cost less accumulated depreciation and anyaccumulated impairment losses. If a legal obligation for the retire-ment of a tangible long-lived asset is incurred, the carrying valueof the related asset is increased by the estimated fair value of theasset retirement obligation (decommissioning costs) upon initial rec-ognition of the liability. See section below titled “Asset RetirementObligations”.
Periodicmaintenance Expenditures for periodic maintenance andrepairs applicable to production facilities are capitalized when thesecosts meet the criteria in accordance with IAS 16 Property, Plantand Equipment (IAS 16). Normal maintenance and repairs for allother properties are expensed as incurred. Major replacements andrenewals that materially extend the life of properties are capitalizedand any assets replaced are retired.
Capitalized interest Hydro capitalizes borrowing costs on qualify-ing assets in accordance with IAS 23 Borrowing Costs (IAS 23).
Leased assets Leases which transfer to Hydro substantially all therisks and benefits incidental to ownership of the leased item areaccounted for as finance leases in accordance with IAS 17 Leases(IAS 17) and IFRIC 4 Determining whether an Arrangement containsa lease (IFRIC 4). Finance leases are capitalized at inception at thefair value of the leased property, or, if lower, at the present value ofthe minimum lease payments as assets under Property, plant andequipment. The liability is included in Long-term debt. The financeleases are depreciated over the shorter of the estimated useful lifeof the asset or the lease term. The related liability is reduced eachreporting period by the amount of the lease payment less the ef-fective interest expense. All other leases are classified as operatingleases and the lease payments are recognized as an expense overthe term of the lease.
Depreciation and amortization Amortization expense is deter-mined on a straight-line basis. Depreciation is determined using thestraight-line method over the estimated useful life of the asset withthe following rates:
Machinery and equipment 5-25 percentBuildings 2-5 percentOther 10-20 percen
Hydro depreciates separately any component of an item of prop-erty, plant and equipment when that component has a usefullife and cost that is significant in relation to the total PP&E costand PP&E useful life. At each financial year-end Hydro reviewsthe residual value and useful life of our assets, with any estimatechanges accounted for prospectively.Oil and gas producing properties are depreciated individually us-
ing the unit-of-production method as proved developed reservesare produced. Unit-of-production depreciation rates are reviewedand revised whenever there is an indication of the need for a changein the rates and at a minimum all producing fields are reviewed atleast once a year. Any revisions in the rates are accounted for pro-spectively.
Asset retirement obligationsHydro recognizes the estimated fair value of asset retirement obliga-tions (ARO) in the period in which it is incurred. This cost includesthe cost of dismantlement, removal or restoration. Obligations foroil and gas installations are recognized when the assets are con-structed and ready for production. Related asset retirement costsare capitalized as part of the carrying value of the long-lived assetand the liability is accreted for the change in its present value eachreporting period. Accretion expense is classified as part of Financialexpense. Liabilities that are conditional on a future event (e.g. thetiming or method of settlement), whether under the control of Hydroor not, are recognized if the fair value of the liability can be rea-sonably estimated. Asset retirement costs are depreciated over theuseful life of the related long-lived asset.
Exchanges of non-monetary assetsNon-monetary transactions that have commercial substance areaccounted for at fair value and any resulting gain or loss on theexchange is recognized in the income statement. A non-monetaryexchange has commercial substance if Hydro’s future cash flowsare expected to change significantly as a result of the exchange.Hydro accounts for certain non-monetary exchanges of oil andgas related assets at fair value and accounts for certain other non-monetary exchanges of oil and gas producing assets where Hydrohas substantial continuing involvement without recognizing a gain orloss on the exchange.
Intangible assetsIntangible assets acquired individually or as a group are recorded atfair value when acquired. Intangible assets acquired in a businesscombination are recognized at fair value separately from goodwillwhen they arise from contractual or legal rights or can be separatedfrom the acquired entity and sold or transferred. Intangible assetswith finite useful lives are amortized on a straight-line basis over theirbenefit period. Intangible assets determined to have an indefinite

18
useful life are not amortized but are subject to impairment testingon an annual basis.
Emission rights Hydro accounts for Norwegian and EU govern-ment granted and purchased CO2 emission allowances at nominalvalue (cost) as an intangible asset. The emission rights are not am-ortized as they are either settled on an annual basis before year-end(matched specifically against actual CO2 emissions) or rolled over tocover the next year’s emissions; impairment testing is done on anannual basis. Actual CO2 emissions over the 95 percent level grantedby the government are recognized as a liability at the point in timewhen emissions exceed the 95 percent level. Any sale of govern-ment granted CO2 emission rights is recognized at the time of sale atthe transaction price.
Research and developmentAll expenditures on research are expensed as incurred. Developmentcosts are capitalized as an intangible asset at cost when all of therecognition criteria in IAS 38 Intangible Assets (IAS 38) are met, itis probable that Hydro will receive a future economic benefit that isattributable to the asset, and the cost can be measured reliably.
Impairment of property, plant and equipmentand intangible assetsHydro reviews property, plant and equipment for impairment when-ever events or changes in circumstances indicate that the car-rying amount may not be recoverable, in accordance with IAS 36Impairment of Assets (IAS 36). The carrying amount is not recover-able if it exceeds the asset’s or cash generating group’s fair valueless costs to sell or the value in use. If the carrying amount is notrecoverable, an impairment loss is recognized in the amount that thecarrying value exceeds its recoverable amount. In the event of a sub-sequent increase in the recoverable amount, previously recognizedimpairment losses are reversed.
Contingencies and guaranteesHydro recognizes a liability for the fair value of obligations it hasundertaken in issuing guarantees, including Hydro’s ongoing obli-gation to stand ready to perform over the term of the guarantee inthe event that the specified triggering events or conditions occur.Contingencies are recognized in the financial statements when prob-able of occurrence and can be estimated reliably.
Financial assetsFinancial assets represent a contractual right by Hydro to receivecash or another financial asset in the future. Financial assets classi-fied as non-current include long-term financial instruments, other in-vestments, long-term loans to employees, long-term bank accountsand restricted cash and other long-term receivables.
Financial assets are derecognized when the rights to receive cashfrom the asset have expired or when Hydro has transferred its rightsto receive cash flows from the asset and has either transferred sub-stantially all of the risks and rewards of the asset or has transferredcontrol of the asset.
Financial liabilitiesFinancial liabilities represent a contractual obligation by Hydro to de-liver cash in the future, and are classified as either short or long-term.Financial liabilities include financial instruments used for cash-flowhedges, financial derivatives and commodity derivative contracts.Financial liabilities are derecognized when the obligation is dis-
charged through payment or when Hydro is legally released from theprimary responsibility for the liability.
Oil and gas royaltyOil and gas revenue is recorded net of royalties payable in kind.
Exploration and development costsof oil and gas reservesHydro uses the successful efforts method of accounting for oil andgas exploration and development costs. In accordance with IFRS6 Exploration for and Evaluation of Mineral Resources, Hydro ac-counts for oil and gas exploration in a similar manner as under ourprevious GAAP. Exploratory costs, excluding the cost of exploratorywells and acquired exploration rights, are charged to expense asincurred. Drilling costs for exploratory wells are capitalized pendingthe determination of the existence of proved reserves. If reserves arenot found, the drilling costs are charged to operating expense. Wellcosts may remain capitalized beyond one year from drilling, depen-dent on project reviews, which take place periodically and no lessfrequently than every quarter.Cost relating to acquired exploration rights are allocated to the
relevant areas and capitalized, pending the determination of theexistence of proved reserves. The acquired exploration rights arecharged to operating expense when a determination is made thatproved reserves will not be found in the area. Each block or area isassessed separately. Capitalized exploration costs are included inIntangible assets until determination that proved reserves have beenfound. Upon determination that proved reserves have been foundand will be developed, the exploration costs for that field is trans-ferred to Property, plant and equipment and aggregated with costsincurred to develop the field.All development costs for wells, platforms, equipment and related
interest are capitalized. Capitalized exploration and developmentcosts are reviewed for impairment whenever events or changes incircumstances indicate that the carrying amount may not be recov-erable. To the extent that Hydro uses future net cash flows to evalu-ate unproved properties for impairment, the unproved reserves are

19Conversio
ntoIFR
S
risk adjusted before estimating future cash flows associated withthose resources. Preproduction costs are expensed as incurred. SeeHydro Annual Report 2006 note 26 for additional information.
Shipping costsShipping and handling costs are included in Other expenses.Shipping and handling costs invoiced to customers are included inRevenues.
Other income, netTransactions resulting in income from sources other than normal pro-duction and sales operations are classified as Other income, net.Gains and losses resulting from the sale or disposal of PP&E, invest-ments in associates or joint ventures, and subsidiaries are includedin Other income, net as well as rental income and certain other incre-mental income and gains.
Income taxesDeferred income tax expense is calculated using the liability methodin accordancewith IAS 12 IncomeTaxes (IAS 12). Deferred tax assetsand liabilities are classified as non-current in the balance sheet andare measured based on the difference between the carrying value ofassets and liabilities for financial reporting and their tax basis whensuch differences are considered temporary in nature. Temporarydifferences related to inter-company profits are deferred using thebuyer’s tax rate. Deferred tax assets are reviewed for recoverability,and the amount probable of recovery is recognized. Deferred incometax expense represents the change in deferred tax asset and liabilitybalances during the year except for the deferred tax related to itemscharged directly to equity and deferred taxes related to purchase andsales of subsidiaries. Changes resulting from amendments and revi-sions in tax laws and tax rates are recognized when the new tax lawsare substantially enacted. Uncertain tax positions are recognized inthe financial statements based on management’s expectations.Hydro recognizes the effect of uplift, a special deduction for pe-
troleum surtax in Norway, at the investment date. Deferred taxes arenot provided on undistributed earnings of most subsidiaries, whensuch earnings are assessed by management to be capable of beingrepatriated to Norway without tax effect.
Derivative instruments and fair value optioninstrumentsHydro applies IASB International Financial Reporting Standards No.32 Financial Instruments: Presentation (IAS 32), and No. 39 FinancialInstruments: Recognition and Measurement (IAS 39) when account-ing for derivatives, as well as when determining whether contractsare derivatives. Derivative financial instruments are marked-to-mar-ket with the resulting gain or loss reflected in net financial expense,except when the instruments meet the criteria for cash flow hedge
accounting. All derivatives and embedded derivatives are classifiedas short-term, including derivatives and embedded derivatives witha final maturity date that is more than twelve months after the bal-ance sheet date, except for derivative hedging instruments that areclassified as long-term provided that their final maturity date is morethan twelve months after the balance sheet date. If Hydro hasmasternetting agreements and the intention and ability to settle two or morederivatives net, the agreements are presented net on the face of thebalance sheet. The ability to settle net is conditional on simultaneouscash-flows from the two contracts. Otherwise, derivative contractsare presented gross at their fair value.
Physical commodity contracts are considered on a portfolio ba-sis. If a portfolio of contracts contain contracts of a similar nature thatare settled net in cash, or the assets are not intended for own use,the entire portfolio of contracts is recognized at fair value, and classi-fied as derivatives.Forward currency contracts and currency options are recognized
in the financial statements and measured at fair value at each bal-ance sheet date with the resulting unrealized gain or loss recorded infinancial expense.Interest income and expense relating to swaps are netted and
recognized as income or expense over the life of the contract.Foreign currency swaps are translated into Norwegian krone at ap-plicable exchange rates as of the balance sheet date with the result-ing unrealized exchange gain or loss recorded in Financial income(expense), net.Derivative commodity instruments are marked-to-market with
their fair value recorded in the balance sheet as either assets or li-abilities. Adjustments for changes in the fair value of the instrumentsare reflected in the current period’s revenue and/or operating cost,unless the instrument is designated as a cash flow hedge instrumentand qualifies for hedge accounting. The fair value option is currentlynot utilized by Hydro.Hedge accounting is applied when specific hedge criteria are
met. The changes in fair value of the qualifying hedging instrumentsare offset in part or in whole by the corresponding changes in the fairvalue or cash flows of the underlying exposures being hedged. Forcash flow hedges, gains and losses on the hedging instruments aredeferred in Other reserves until the underlying transaction is recog-nized in earnings. When it is determined that a forecasted hedgedtransaction is no longer expected to occur, all the correspondinggains and losses deferred in Other reserves are immediately recog-nized in earnings. Any amounts resulting from hedge ineffectivenessfor both fair value and cash flow hedges are recognized in the currentperiod’s income statement. For fair value hedges, both the chang-es in the fair value of the designated derivative instrument and thechanges in the fair value of the hedged item are recognized currentlyin earnings.

20
Share-based compensationHydro accounts for share-based compensation in accordance withIFRS 2Share-based Payment (IFRS 2). Hydro has an executive stockoption plan, with a granting of share appreciation rights (SARs) to topmanagement on an annual basis. The SARs are cash-settled uponexercise. At each reporting period, the fair value of the outstand-ing SARs is remeasured using a Black-Scholes option-pricing modeland compensation expense is accrued, pro-rata based on the fairvalue, over the service period. SARs have been granted each yearfrom 2002 to 2006, inclusive, and all grants are accounted for underIFRS 2 as of 1 January 2006. Hydro also has an employee sharepurchase rebate plan, where the plan payout is based on share priceperformance. Compensation expense in connection with this plan ismeasured at fair value over the service period. All share-based com-pensation expense includes social security taxes that will be paid byHydro at the settlement date. All changes in fair value are recognizedin profit and loss for the period. See the Annual Report 2006 note 4for additional information.
Employee benefits and post-employment benefitsShort-term employee benefits, such as wages, salaries, social se-curity contributions, paid annual leave, as well as short-term bonusagreements are accrued in the period in which the associated ser-vices are rendered by the employee.
Post-employment benefits are recognized in accordance withIAS 19 Employee Benefits (IAS 19). The cost of providing pensionbenefits under a defined benefit plan is determined separately foreach plan using the projected unit method. Past service costs arerecognized in the income statement on a straight-line basis over theremaining vesting period. Net cumulative actuarial gains and lossesin excess of the greater of 10 percent of the benefit obligation (beforededucting plan assets) and 10% of the fair value of any plan assetsare amortized in the current period’s income statement over the re-maining service period of active plan participants. The funded statusof a defined benefit pension plan is measured as of 31 December.Hydro recognizes the pre-paid pension asset and the accrued pen-sion liability related to our defined benefit plans in the statement offinancial position.
Contributions to defined contribution schemes are recognized inthe income statement in the period in which they accrue.
Segment informationHydro identifies its reportable segments and disclose segment infor-mation under IFRS 8 Operating Segments. This standard requiresHydro to identify its segments according to the organization andreporting structure used by management. See the Annual Report2006 note 5 for a description of Hydro’s segments and managementmodel. The accounting policies used for segment reporting reflectthose used for the group with the following exceptions: Certain inter-
nal commodity contracts may meet the definition of a financial instru-ment in IAS 39 or contain embedded derivatives that are requiredto be bifurcated and valued at fair value under IAS 39. However,Hydro consider these contracts as sourcing of raw materials or saleof own production even though the contracts for various reasons in-clude clauses that meet the definition of a derivative or an embeddedderivative. Such internal contracts are accounted for as executorycontracts. Also certain internal contracts may contain lease arrange-ments that qualify as capital leases. However, the segment reportingreflects the responsibility allocated by Hydro management for thoseassets. Costs related to certain pension schemes covering morethan one segment are allocated to the operating segments basedon either premium charged or estimated service cost.IFRS 8 is currently not endorsed by the EU. The identified seg-
ments and reported performance measures and other informationreported in accordance with IFRS 8 may in certain respects be dif-ferent from what would have been reported had its predecessorstandard, IAS 14 Reporting Financial Information by Segment beenapplied.
Critical accounting estimatesInherent in many of Hydro’s accounting policies is the need for man-agement to make estimates and judgments in the determination ofcertain revenues, expenses, assets and liabilities. The conversion toIFRS has not changed our evaluation in respect to the accountingpolicy areas where Hydro makes critical accounting estimates. Theaccounting policy areas are exploration costs of oil and gas reserves,proved oil and gas reserves, derivative instruments, asset retirementobligations, impairment of long-lived assets, contingencies and en-vironmental liabilities, business combinations and goodwill, incometaxes and employee retirement plans. These critical areas involve ahigher degree of judgment and complexity which, in turn, could ma-terially impact Hydro’s financial statements if various assumptionswere changed significantly. See the Annual Report 2006 pages 100-105 for a discussion of Hydro’s critical accounting policies.

21Conversio
ntoIFR
S
Consolidated income statement 2006 US GAAP to IFRS (unaudited)
c
US GAAP
Presentationand classi-
ficationUS GAAPreclassified
Pensionsand otheremployeebenefits
Financialinstruments
Property,plant andequipment Other IFRS
Year ended 31 December 2006
Amounts in NOK million
Note reference A B C D E
Operating revenues 196,234 (196,234) -
Revenue 198,862 198,862 - 2,422 - - 201,283
Share of the profit (loss) in equity accounted investments 971 971 - - - 19 990
Other income, net 1,496 1,496 - - (43) 17 1,470
Total revenue and income 201,329 201,329 - 2,422 (43) 36 203,744
Raw material and energy expense 98,961 (17,994) 80,966 - 1,844 - - 82,810
Employee benefits expense / Payroll and related costs 19,404 706 20,110 (564) - - - 19,546
Depreciation and amortization expense 16,937 (110) 16,826 - - 389 - 17,215
Impairment of non-current assets / Impairment losses 5,228 - 5,228 - - 264 - 5,492
Other 3,481 20,804 24,285 - - (572) (43) 23,670
Total expenses / Operating costs and expenses 144,010 3,406 147,415 (564) 1,844 81 (43) 148,733
Operating income 52,224 (52,224)
Earnings before financial items and tax 53,914 53,914 564 578 (124) 79 55,010
Financial income (expense), net 1,785 (1,785) -
Financial income 1,425 1,425 - - - - 1,425
Financial expense (82) (82) - (46) 85 - (43)
Financial income (expense), net 1,785 (441) 1,343 - (46) 85 - 1,382
Equity in net income of non-consolidated investees 962 (962) -
Other income (expense), net 53 (53) -
Income before tax / Income from continuing operationsbefore taxes and minority interest 55,024 233 55,257 564 532 (39) 79 56,392
Income tax expense (37,598) (66) (37,665) (189) (645) (11) 50 (38,459)
Mintority interest (202) 202 -
Income from continuing operations 17,224 (17,224)
Income from discontinued operations 167 (167)
Net income 17,391 202 17,593 375 (113) (50) 129 17,933
Net income attributable to minority interests 202 202 - - 71 1 273
Net income attributable to equity holders of the parent 17,391 17,391 375 (113) (120) 127 17,660

22
Consolidated condensed income statements– 2006 quarterly presentation US GAAP to IFRS (unaudited)
c
US GAAP
Presentationand classi-
ficationUS GAAPreclassified
Pensionsand otheremployeebenefits
Financialinstruments
Property,plant andequipment Other IFRS
First quarter 2006
Amounts in NOK million
Note reference A B C D E
Operating revenues 54,504 (54,504) -
Revenue 54,048 54,048 - (997) - - 53,050
Share of the profit (loss) in equity accounted investments 316 316 - - - 5 321
Other income, net 253 253 - - (10) - 244
Revenue and income 54,617 54,617 - (997) (10) 5 53,615
Depreciation, amortization and impairment 4,056 (28) 4,028 - - 103 - 4,131
Other expenses / Other operating costs 32,645 (354) 32,291 (141) 314 (146) 295 32,613
Total expense / Operating costs and expenses 36,701 (381) 36,319 (141) 314 (43) 295 36,745
Operating income 17,804 (17,804)
Earnings before financial items and tax 18,298 18,298 141 (1,311) 33 (290) 16,870
Equity in net income of non-consolidated investees 309 (309) -
Financial income (expense), net 760 (115) 645 - - 19 - 664
Income before tax / Income from continuing operationsbefore taxes and minority interest 18,872 71 18,943 141 (1,311) 52 (290) 17,534

23Conversio
ntoIFR
S
c
US GAAP
Presentationand classi-
ficationUS GAAPreclassified
Pensionsand otheremployeebenefits
Financialinstruments
Property,plant andequipment Other IFRS
Second quarter 2006
Amounts in NOK million
Note reference A B C D E
Operating revenues 50,409 (50,409) -
Revenue 49,862 49,862 - (151) - - 49,711
Share of the profit (loss) in equity accounted investments 372 372 - - - 4 376
Other income, net 449 449 - - (17) - 432
Revenue and income 50,683 50,683 - (151) (17) 4 50,519
Depreciation, amortization and impairment 4,004 (35) 3,970 - - 124 - 4,094
Other expenses / Other operating costs 31,835 (246) 31,589 (149) (412) (125) (310) 30,593
Total expense / Operating costs and expenses 35,840 (281) 35,559 (149) (412) (1) (310) 34,686
Operating income 14,570 (14,570)
Earnings before financial items and tax 15,124 15,124 149 261 (16) 314 15,833
Equity in net income of non-consolidated investees 368 (368) -
Financial income (expense), net 919 (113) 807 - (36) 22 - 792
Income before tax / Income from continuing operationsbefore taxes and minority interest 15,857 74 15,931 149 225 6 314 16,626

24
c
US GAAP
Presentationand classi-
ficationUS GAAPreclassified
Pensionsand otheremployeebenefits
Financialinstruments
Property,plant andequipment Other IFRS
Third quarter 2006
Amounts in NOK million
Note reference A B C D E
Operating revenues 50,090 (50,090) -
Revenue 49,563 49,563 - 746 - - 50,309
Share of the profit (loss) in equity accounted investments 228 228 - - - 6 234
Other income, net 308 308 - - (10) - 298
Revenue and income 50,100 50,100 - 746 (10) 6 50,841
Depreciation, amortization and impairment 4,206 (31) 4,175 - - 1,882 - 6,057
Other expenses / Other operating costs 30,606 (308) 30,298 (143) 582 (136) 21 30,622
Total expense / Operating costs and expenses 34,812 (340) 34,472 (143) 582 1,747 21 36,679
Operating income 15,278 (15,278)
Earnings before financial items and tax 15,627 15,627 143 164 (1,757) (15) 14,162
Equity in net income of non-consolidated investees 231 (231) -
Financial income (expense), net (741) (111) (852) - 13 19 - (819)
Income before tax / Income from continuing operationsbefore taxes and minority interest 14,769 7 14,776 143 178 (1,738) (15) 13,343

25Conversio
ntoIFR
S
c
US GAAP
Presentationand classi-
ficationUS GAAPreclassified
Pensionsand otheremployeebenefits
Financialinstruments
Property,plant andequipment Other IFRS
Fourth quarter 2006
Amounts in NOK million
Note reference A B C D E
Operating revenues 41,230 (41,230) -
Revenue 45,389 45,389 - 2,824 - - 48,213
Share of the profit (loss) in equity accounted investments 55 55 - - - 4 59
Other income, net 485 485 - - (6) 17 496
Revenue and income 45,929 45,929 - 2,824 (6) 21 48,768
Depreciation, amortization and impairment 9,898 (17) 9,882 - - (1,456) - 8,425
Other expenses / Other operating costs 26,759 4,424 31,184 (131) 1,361 (166) (49) 32,198
Total expense / Operating costs and expenses 36,657 4,408 41,065 (131) 1,361 (1,622) (49) 40,624
Operating income 4,573 (4,573)
Earnings before financial items and tax 4,864 4,864 131 1,464 1,616 70 8,144
Equity in net income of non-consolidated investees 54 (54) -
Financial income (expense), net 847 (103) 744 - (23) 25 - 745
Other income (expense), net 53 (53) - - - - - -
Income before tax / Income from continuing operationsbefore taxes and minority interest 5,527 81 5,607 131 1,440 1,641 70 8,889
26
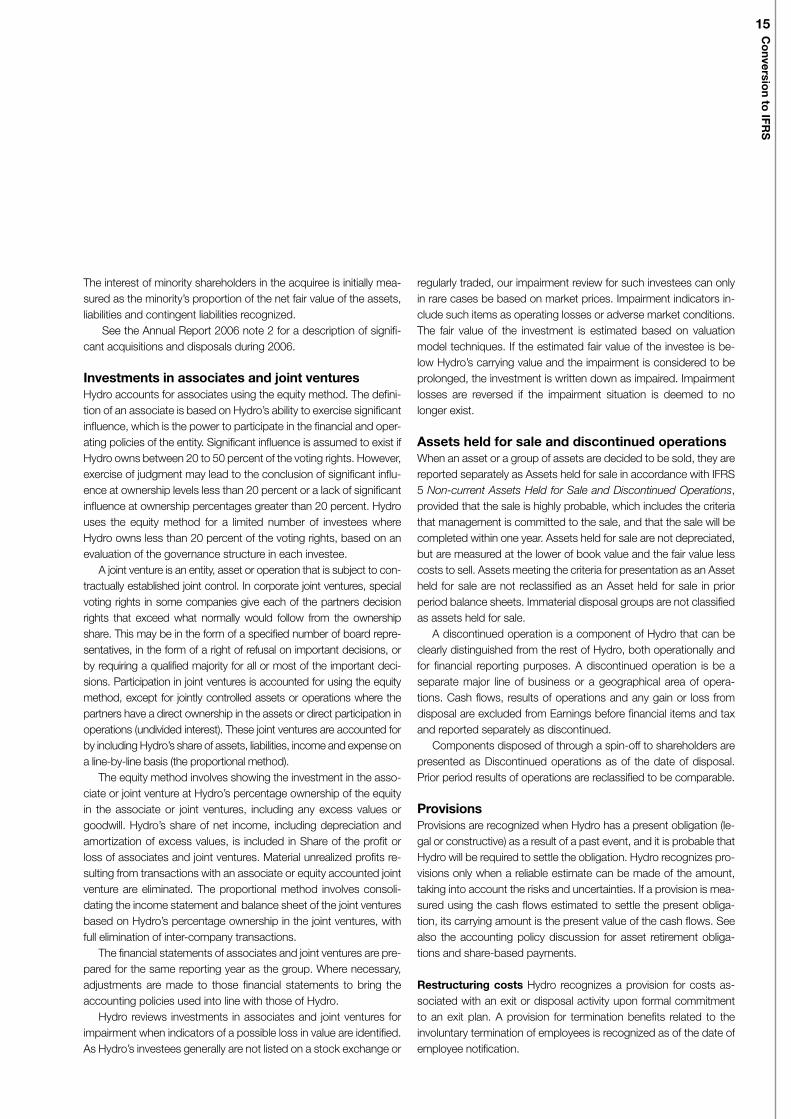
Consolidated balance sheet 1 January 2006 US GAAP to IFRS (unaudited)
c
US GAAP
Presentationand classi-
ficationUS GAAPreclassified
Pensionsand otheremployeebenefits
Financialinstruments
Property,plant andequipment Other IFRS
1 January 2006
Amounts in NOK million
Note reference A B C D E
Assets
Cash and cash equivalents 10,463 - 10,463 - - - - 10,463
Short-term investments 3,865 - 3,865 - - - - 3,865
Accounts receivable 23,333 12,106 35,438 - - - - 35,438
Inventories 14,553 - 14,553 - - - - 14,553Other current assets / Prepaid expenses and other currentassets 15,912 (12,106) 3,806 - 3,148 - - 6,955
Current deferred tax assets 2,166 (2,166) -
Total current assets 70,293 (2,166) 68,126 - 3,148 - - 71,275
Investments accounted for using the equity method /Non-consolidated investees 10,814 - 10,814 - - - 30 10,844
Property, plant and equipment 128,191 (5,443) 122,747 - - 1,285 - 124,032
Intangible assets 5,153 5,443 10,596 (225) - - - 10,371
Financial assets 7,175 7,175 - (2,642) - 919 5,452
Other non-current assets / Prepaid pension, investmentsand other non-current assets 11,910 (7,175) 4,735 (4,639) - - - 96
Deferred tax assets 833 982 1,815 - - - - 1,815
Total non-current assets 156,902 982 157,884 (4,864) (2,642) 1,285 949 152,611
Total assets 227,195 (1,184) 226,010 (4,864) 506 1,285 949 223,885

27Conversio
ntoIFR
S
c
US GAAP
Presentationand classi-
ficationUS GAAPreclassified
Pensionsand otheremployeebenefits
Financialinstruments
Property,plant andequipment Other IFRS
1 January 2006
Amounts in NOK million
Note reference A B C D E
Liabilities and equity
Trade and other payables 27,832 27,832 - - - - 27,832
Bank loans and other interest-bearing short-term debt 4,658 379 5,037 - - - - 5,037
Current portion of long-term debt 379 (379) - - - - - -
Provisions 1,209 1,209 - - (10) - 1,200
Taxes payable 13,843 13,843 - - - - 13,843
Other current liabilities 47,239 (42,885) 4,355 - 4,711 - - 9,066
Current deferred tax liabilities 980 (980) -
Total current liabilities 53,256 (980) 52,277 - 4,711 (10) - 56,978
Long-term debt 21,387 - 21,387 - - - - 21,387
Provisions 7,905 7,905 - - 2,908 70 10,883
Pension obligation 9,939 (45) 9,895 3,026 - - - 12,921
Other financial liabilities 2,336 2,336 - (1,934) - - 402
Other liabilities 12,424 (10,196) 2,228 544 - - (22) 2,750
Deferred tax liabilities 33,713 (205) 33,508 (2,423) (1,480) (1,924) 139 27,820
Total non-current liabilities 77,462 (205) 77,258 1,148 (3,413) 984 187 76,164
Total liabilities 129,535 129,535 1,148 1,298 975 187 133,142
Minority shareholders’ interest in consolidated subsidiaries 981 (981) -
Share capital 4,739 - 4,739 - - - - 4,739
Additional paid-in capital 10,501 - 10,501 - - - - 10,501
Other reserves / Accumulated other comprehensiveincome (loss) (2,083) - (2,083) 1,306 - - 1,500 723
Retained earnings 85,927 - 85,927 (7,317) (740) 258 (738) 77,390
Treasury shares (3,589) - (3,589) - - - - (3,589)
Equity attributable to equity holders of the parent /Shareholders’ equity 95,495 - 95,495 (6,012) (740) 258 762 89,763
Minority interest 981 981 - (53) 52 (1) 980
Total equity 96,476 96,476 (6,012) (792) 310 762 90,743
Total liabilities and equity / shareholders’ equity 227,195 (1,184) 226,010 (4,864) 506 1,285 949 223,885

28
c
US GAAP
Presentationand classi-
ficationUS GAAPreclassified
Pensionsand otheremployeebenefits
Financialinstruments
Property,plant andequipment Other
IFRS
31 December 2006
Amounts in NOK million
Note reference A B C D E
Assets
Cash and cash equivalents 6,760 - 6,760 - - - - 6,760
Short-term investments 15,020 - 15,020 - - - - 15,020
Accounts receivable 25,608 8,901 34,508 - - - - 34,508
Inventories 16,497 - 16,497 - - - - 16,497
Other current assets / Prepaid expenses and other currentassets 14,025 (8,901) 5,124 - 2,856 - - 7,980
Current deferred tax assets 3,099 (3,099) -
Assets held for sale / Current assets held for sale 1,122 2,569 3,691 - - - - 3,691
Total current assets 82,131 (530) 81,602 - 2,856 - - 84,457
Investments accounted for using the equity method /Non-consolidated investees 10,455 - 10,455 - - - 235 10,690
Property, plant and equipment 124,976 (6,604) 118,372 - - 702 - 119,075
Intangible assets 4,861 6,604 11,464 - - - 11 11,475
Financial assets 6,464 6,464 - (2,332) - 782 4,914
Other non-current assets / Prepaid pension, investmentsand other non-current assets 7,763 (6,464) 1,298 (995) - - - 303
Deferred tax assets 1,239 938 2,177 - - - - 2,177
Non-current assets held for sale 2,569 (2,569) -
Total non-current assets 151,862 (1,631) 150,231 (995) (2,332) 702 1,028 148,635
Total assets 233,993 (2,160) 231,833 (995) 524 702 1,028 233,092
Consolidated balance sheet 31 December 2006 US GAAP to IFRS (unaudited)

29Conversio
ntoIFR
S
c
US GAAP
Presentationand classi-
ficationUS GAAPreclassified
Pensionsand otheremployeebenefits
Financialinstruments
Property,plant andequipment Other IFRS
31 December 2006
Amounts in NOK million
Note reference A B C D E
Liabilities and equity
Trade and other payables 29,785 29,785 - - - - 29,785
Bank loans and other interest-bearing short-term debt 3,213 441 3,655 - - - - 3,655
Current portion of long-term debt 441 (441) -
Provisions 2,217 2,217 - - (45) 25 2,197
Taxes payable 18,995 18,995 - - - - 18,995
Other current liabilities 55,550 (51,561) 3,989 - 3,960 - - 7,949
Current deferred tax liabilities 1,134 (1,134) - - - - - -Liabilities included in disposal groups / Current liabilities indisposal groups 738 273 1,011 1 - - - 1,011
Total current liabilities 61,076 (1,425) 59,651 1 3,960 (45) 25 63,591
Long-term debt 19,619 - 19,619 - - - - 19,619
Provisions 11,913 11,913 - - 2,433 10 14,357
Pension obligation 12,391 522 12,913 (308) - - - 12,605
Other financial liabilities 2,047 2,047 - (1,694) - - 353
Other liabilities 16,126 (13,918) 2,208 510 - - (16) 2,702
Deferred tax liabilities 27,307 (1,027) 26,280 (294) (855) (1,914) 47 23,265
Long-term liabilities in disposal groups 273 (273) -
Total non-current liabilities 75,715 (735) 74,980 (91) (2,549) 519 41 72,900
Total liabilities 134,631 134,631 (90) 1,411 474 66 136,491
Minority shareholders’ interest in consolidated subsidiaries 707 (707) -
Share capital 4,708 - 4,708 - - - - 4,708
Additional paid-in capital 9,736 - 9,736 - - - - 9,736
Other reserves / Accumulated other comprehensiveincome (loss) (9,135) - (9,135) 6,078 - - 1,524 (1,533)
Retained earnings 97,811 - 97,811 (6,983) (835) 112 (561) 89,544
Treasury shares (6,624) - (6,624) - - - - (6,624)
Equity attributable to equity holders of the parent /Shareholders’ equity 96,496 - 96,496 (905) (835) 112 963 95,831
Minority interest 707 707 - (53) 117 - 771
Total equity 97,202 97,202 (905) (888) 229 963 96,601
Total liabilities and equity / shareholders’ equity 233,993 (2,160) 231,833 (995) 524 702 1,028 233,092

30
c
US GAAP
Presentationand classi-
ficationUS GAAPreclassified
Pensionsand otheremployeebenefits
Financialinstruments
Property,plant andequipment Other IFRS
Amounts in NOK million
Note reference A B C D E
1 January 2006Equity attributable to equity holders of the parent / Share-holders’ equity 95,495 - 95,495 (6,012) (740) 258 762 89,763
Minority interest / Minority shareholders’ interest in consoli-dated subsidiaries 981 - 981 - (53) 52 (1) 980
Total equity 96,476 (6,012) (792) 310 762 90,743
31 March 2006Equity attributable to equity holders of the parent / Share-holders’ equity 99,898 - 99,898 (5,896) (1,495) 267 362 93,135
Minority interest / Minority shareholders’ interest in consoli-dated subsidiaries 907 - 907 - (104) 68 (1) 871
Total equity 100,805 (5,896) (1,599) 334 361 94,006
30 June 2006Equity attributable to equity holders of the parent / Share-holders’ equity 97,033 - 97,033 (6,032) (1,300) 241 495 90,436
Minority interest / Minority shareholders’ interest in consoli-dated subsidiaries 719 - 719 - (103) 85 (1) 700
Total equity 97,752 (6,032) (1,404) 326 494 91,136
30 September 2006Equity attributable to equity holders of the parent / Share-holders’ equity 103,165 - 103,165 (5,987) (1,436) (922) 516 95,336
Minority interest / Minority shareholders’ interest in consoli-dated subsidiaries 754 - 754 - (70) 109 (1) 792
Total equity 103,919 (5,987) (1,506) (813) 515 96,129
31 December 2006Equity attributable to equity holders of the parent / Share-holders’ equity 96,496 - 96,496 (905) (835) 112 963 95,831
Minority interest / Minority shareholders’ interest in consoli-dated subsidiaries 707 - 707 - (53) 117 - 771
Total equity 97,202 (905) (888) 229 963 96,601
Reconciliation of equity – 2006 quarterly presentation US GAAP to IFRS(unaudited)

31Conversio
ntoIFR
S
IntroductionDuring the conversion process from US GAAP to IFRS, Hydro analy-zed in detail all standards relevant for our financial statements. Whencomparing an IFRS to an US GAAP principle, many standards havethe same reporting objective; however when comparing the detailswe have identified practical implementation differences for specifictransactions or classes of transactions, that, while not of a mate-rial nature for Hydro in 2006, could be material for future reportingperiods. These areas of possible future differences include capitalizedinterest, share-based payments, business combinations and financialinstruments. These differences are not discussed in detail below, asthe 2006 IFRS financial statements are not affected.The following discussion corresponds to the difference columns
A-E in the US GAAP to IFRS reconciliation income statements,balance sheets and reconciliation of equity presented above. Thediscussion covers the transition effects on the 1 January 2006 ope-ning balance, balance sheet differences as of 31 December 2006and income differences during 2006. The US GAAP to IFRS inco-me statements and balance sheets give the new IFRS line namefirst, followed by the US GAAP line name that is being replaced.Presentation and classification changes are shown first, using USGAAP figures. The IFRS classified US GAAP figures are then adjus-ted in columns B-E, in respect of the IFRS measurement changes.
A – Presentation and classificationIncome StatementThere are presentation and classification differences when compa-ring the IFRS to the US GAAP income statement. Operating reve-nues is now called Revenue. Under US GAAP, Operating revenuesinclude some miscellaneous revenue items classified as Other in-come, net under IFRS. The line item Share of the profit (loss) fromequity accounted investments moves up the income statement andis now included as part of Total revenue and income. The amountof Share of the profit (loss) from equity accounted investments is dif-ferent after the presentation change as discontinued operations areincluded in the amount; IFRS does not have a line item Discontinuedoperations in the 2006 financial statements. The line item Other in-come, net, comprises some miscellaneous revenue items and gainor loss on sale of property, plant and equipment and investmentspreviously reported as part of Other operating expenses.One significant difference is that the Automotive Castings bus-
iness is not considered a separate major line of business and thusnot separately reported as discontinued operations. As a result,the line Discontinued operations is not part of the IFRS incomestatement for 2006, and the NOK 167 million US GAAP loss ondiscontinued operations is therefore distributed among the IFRS in-come statement line items (in column A) between Revenues, Otherincome, net, Raw materials and energy costs, Employee bene-fits expense, Depreciation and amortization expense, Other, andFinancial income and Financial expense.
Accretion expense related to the asset retirement obligations isnow classified as part of Financial expense; under US GAAP thisis classified as part of Depreciation and amortization expense. TheDepreciation and amortization expense NOK (110) million adjustmentin column A represents NOK 332 million related to discontinued ope-rations and NOK (442) million related to the ARO accretion expense.The line item Operating income is replaced by Earnings beforefinancial items and tax as the primary measure of earnings in thesegments. Financial items are now shown separately as Financialincome, and Financial expense. Financial expense includes ex-change gains and losses (no change from US GAAP) and accre-tion expense related to ARO and provisions (a change as comparedto US GAAP). Provision accretion expense under US GAAP isclassified as Other expenses.Minority interest now is located on the IFRS income statement
after the subtotal Net income. The final figure in the IFRS incomestatement is a new line item Net income attributable to equity hol-ders of the parent, which is the equivalent line to the US GAAP lineNet income. IFRS Net income is before Net income attributable tominority interests.
Balance sheetOther short-term receivables that were included as part of Othercurrent assets for US GAAP reporting are now classified for IFRSfinancial reporting as part of Accounts Receivable. These short-term receivables primarily relate to VAT receivable and other externalprepaid items. Capitalized exploration costs, classified as part ofProperty, plant and equipment under US GAAP are now classifiedas part of Intangible assets. Non-current financial assets are nowshown on the face of the balance sheet, reclassified from Othernon-current assets.Shares held for trading are classified as part of Short-term inves-
tments with a fair value of NOK 586 million in the 1 January 2006balance sheet under both IFRS and US GAAP. Non-marketableshares previously classified under US GAAP as not held for tradingare classified as available-for-sale under IFRS with changes in fairvalue booked against equity. The shares are presented in the ba-lance sheet as part of Financial Assets. Non-marketable shares inthe US GAAP balance sheet were classified as Prepaid pension,investment and other non-current assets, and measured at cost.Trade and other payables, Taxes payable and Provisions (current)
are reclassified from Other current liabilities and shown separately inthe IFRS balance sheet. The current portion of long-term debt is notpresented as a separate line item in the IFRS balance sheet, butinstead is included as part of Bank loans and other interest-bearingdebt. Provisions (non-current) and Other financial liabilities are re-classified from Other liabilities, non-current and shown separately asnon-current liabilities. To achieve a more correct presentation underIFRS, NOK 45 million in the 1 January 2006 balance sheet relatingto an accrual for long-term employee benefits has been reclassified
US GAAP conversion to IFRS: Explanation of differences

32
from accrued pension liabilities to other liabilities, non-current. Theadjustment in the 31 December 2006 balance sheet was NOK 42million.All deferred tax assets and deferred tax liabilities are classified as
non-current; under US GAAP the requirement is to show the currentand non-current deferred tax assets and liabilities separately.The elements included in the US GAAP line item Accumulated
other comprehensive income are now included in the IFRS line itemOther reserves.
Statement of cash flowsThe 2006 IFRS statement of cash flows is very similar in presenta-tion and format to Hydro’s 2006 US GAAP statement of cash flows,with only four presentation, classification or measurement differen-ces related to the measurement of cash, classification of capita-lized interest, presentation of capitalized capital maintenance andpresentation related to Assets held for sale. These differences arediscussed below. A reconciliation of the US GAAP to IFRS state-ment of cash flows is not presented, as it is not an IFRS requirementand our differences are not significant. See the Annual Report 2006for the US GAAP statement of cash flows.The IFRS statement of cash flows includes bank overdrafts in
the definition of cash; bank overdrafts are excluded from the USGAAP cash definition. In the 2006 statement of cash flows, the IFRS1 January and 31 December 2006 cash balances in the statementof cash flows are NOK 9,964 million and NOK 6,674 million, respec-tively. This is NOK 499 million and NOK 86 million lower than theUS GAAP cash balances reported for 1 January and 31 December2006, respectively.Capitalized interest in the amount NOK 1,231 million is classified
as an operating activity in the IFRS statement of cash flows, and isclassified as an investing activity in the US GAAP statement of cashflows, included as part of Purchases of property, plant and equip-ment.In the IFRS statement of cash flows, the capitalized capital
maintenance for the period is presented as part of investing ac-tivities. Under US GAAP for 2006, the accrual method was usedand costs related to capital maintenance are expensed in the in-come statement and therefore included in the US GAAP statementof cash flows as part of net income. See also the section below“D – Property, plant & equipment, Periodic maintenance.”In the fourth quarter of 2006 the results and cash flows of the
Automotive Castings business were reported as discontinued ope-rations in US GAAP. As this is not a separate major line of business,it is not separately reported under IFRS but is included in cash flowsfrom continuing operations.IFRS allows the financial statement preparer the choice to clas-
sify interest and dividends paid and received as part of operatingactivities or interest as part of investing activities and dividends aspart of financing activities. Hydro has chosen the same classification
as is currently required by US GAAP, which is to classify interest anddividends paid and received as part of operating activities.Even excluding the above specific items, there will always be
overall general differences when comparing the IFRS and US GAAPcash from operating, investing and financing activities. This isunavoidable as long as there are IFRS as compared to US GAAPmeasurement and recognition differences in the balance sheet andincome statement. These differences are discussed throughout therest of this document, and not specifically detailed here in relation tothe statement of cash flows.
B – PensionsIFRS requires either full retrospective application of IAS 19 EmployeeBenefits, or recognition of all cumulative actuarial gains and lossesat the date of transition to IFRS. Hydro has elected to utilize theimplementation provision to recognize prior periods’ unrecogni-zed gains and losses directly in equity as of 1 January 2006. As of1 January 2006, the GAAP difference includes unrecognized priorservice costs and unrecognized net losses of NOK 9,804 million.Both of these elements are amortized over the future service periodin US GAAP. The US GAAP intangible assets and accrued liabilityrelated to the additional minimum liability of NOK 225 million andNOK 2,132, respectively, were reversed for IFRS reporting as IFRSdoes not allow for such an asset/liability to be recognized. Net oftax, the decrease in equity per 1 January 2006 related to pensionsand other employee benefits is NOK 6,012 million.As the funded status of the pension plans was recognized in
the US GAAP balance sheet as of 31 December 2006, the impacton Hydro’s IFRS balance sheet as of the end of 2006 was limited.The IFRS to US GAAP pre-tax difference of NOK 687 million re-presents net unrecognized gains and losses incurred during 2006.Under Hydro’s IFRS accounting principles net cumulative actuarialgains and losses in excess of the greater of 10 percent of the benefitobligation (before deducting plan assets) and 10 percent of the fairvalue of any plan assets are amortized in the income statement overthe remaining service period of active plan participants.Pension costs during 2006 were NOK 564 million lower under
IFRS as compared to US GAAP due to amortization differences re-lated to past service costs and accumulated losses. Net of tax, thedecrease in equity as of 31 December 2006 related to pensions andother employee benefits is NOK 905million. Hydro applies the sameeconomic and actuarial assumptions under IFRS as applied underUS GAAP.As of 31 December 2006, Hydro has a GAAP timing difference
of NOK 78 million related to curtailments of certain defined benefitpension plans. Under IFRS, curtailment gains are recognized whencurtailments occur. Under US GAAP, curtailment gains are deferreduntil realized.

33Conversio
ntoIFR
S
C – Financial instrumentsMeasurement and scopingSome contracts that contain embedded derivatives are accountedfor as derivatives under US GAAP in their entirety, while only theembedded derivatives are separated under IFRS.Under US GAAP, where the commodity in the contract is traded
in a liquid market, Hydro would have to perform extensive docu-mentation that the assets in the contract are for ”Normal Purchaseand Normal Sales” (NPNS) purposes. Otherwise, the contractwould, in most cases, be accounted for at fair value. For manycontracts, Hydro has elected not to document NPNS. Under IFRS,all commodity contracts that are not part of a “trading” portfolio areaccounted for at cost. IFRS do not have any formal “own use”documentation requirements. This creates a difference for Hydrobetween IFRS and US GAAP.Hydro enters into offsetting positions in the market for physical
LME-grade and physical non-LME grade aluminium contracts. IFRSrequire that all of these contracts be accounted for at fair value.However, only physical LME-grade aluminium contracts are acco-unted for at fair value under US GAAP.Hydro has, for US GAAP reporting, separated embedded
currency derivatives from some sales and purchase contracts andvalues the derivatives as forward contracts. These derivatives are,for the most part, not separated for IFRS reporting purposes, as thecurrencies in the contracts are considered to be commonly used inthe country to which the products are sold / sold from.Contracts entered into before 1 January 1999 that contained
embedded derivatives are not recognized as derivatives under USGAAP according to Hydro US GAAP implementation policy. Theseembedded derivatives are separated under IFRS and recognized atfair value. Hydro currently has no contracts or other financial instru-ments to which the fair value option has been applied.
ValuationSome embedded derivatives, previously valued as swap arrange-ments, are under IFRS valued as embedded forward contracts. Thisprimarily relates to aluminium, coal and inflation price links in long-term electricity contracts.Accounting practice has been to value contracts over the liquid
horizon (typically 3-5 years) under US GAAP. Under IFRS, all com-modity contracts scoped in to be accounted for at fair value are fairvalued over the full contract horizon.
ClassificationUnder IFRS derivative contracts and financial instruments are nettedonly when an ability and intention to net settle exists, while underUS GAAP contracts are netted based on the existence of a masternetting agreement.Under IFRS all derivatives are recognized as short-term, with
the exception of derivatives held for hedging purposes, while underUS GAAP contracts with a final maturity date of more than twelvemonths outside the balance sheet date are classified as long-term.
Effects on 1 January 2006 opening balance and quartersThe table below shows the effect in NOK million, between IFRS andUS GAAP, on the 1 January 2006 opening balance and the quar-ters, respectively:Negative amounts relating to balance sheet indicate a net de-
creased asset, increased liability under IFRS compared to USGAAP. Negative amounts in the profit and loss statement indicate anet decreased result under IFRS compared to US GAAP.Different valuation horizons, and different scoping of contracts
based on embedded derivatives under the two GAAPs, creates themajority of IFRS to US GAAP reporting differences as presentedabove for Hydro.
D – Property, plant & equipmentPeriodic maintenanceUnder US GAAP for the period prior to 1 January 2007, expendi-tures for periodic maintenance and repairs applicable to productionfacilities are accounted for on an accrual basis. Under IFRS periodicmaintenance is capitalized and depreciated. In the 1 January 2006US GAAP to IFRS balance sheet, Property, plant and equipment isincreased by NOK 1,362 million related to periodic maintenance.US GAAP provisions of NOK 10 million, current and NOK 131 mil-lion, non-current, are reversed in the 1 January IFRS balance sheet.In the 2006 income statement IFRS deprecation is higher than USGAAP depreciation by NOK 436 million. Other (expenses) are lowerfor IFRS by NOK 522 million.As of 1 January 2007, Hydro will use the same accounting
treatment for capitalized capital maintenance for US GAAP repor-ting as under IFRS. Therefore, this difference ceases to exist after31 December 2006.
(unaudited)
Derivatives differences, net IFRS to US GAAP:
Openingbalance2006
Firstquarter2006
Secondquarter2006
Thirdquarter2006
Fourthquarter2006
Balance sheet, pre-tax (2,272) (3,582) (3,355) (3,190) (1,742)
Income statement, pre-tax - (1,311) 225 178 1,440

34
Asset Retirement ObligationsThe total estimated present value of asset retirement obligations isNOK 10,733 million as of 1 January 2006 and NOK 14,633 million asof 31 December 2006, which is NOK 3,040 million and NOK 2,573million above the estimated present value according to US GAAPas of 1 January 2006 and 31 December 2006, respectively. The ma-jority of the obligation relates to future decommissioning of oil and gasinstallations on the Norwegian continental shelf and in other parts ofthe world where Hydro has interest in oil and gas production. Theremoval is expected to take place in the period 2007 to 2041, withthe majority of the estimated costs related to removals expected inthe period 2020 to 2030. The estimates for decommissioning costsand time are the same for IFRS and US GAAP. However, the esti-mates are discounted using the current risk free interest rates in theinterval 3 percent to 4.5 percent for IFRS purposes, while the disco-unt rates used for US GAAP purposes represent credit adjusted riskfree interest levels at inception of the obligation and range from 5.5percent to 7.5 percent. The interest rates used for discounting referto the duration of the liability and the currency in the economic en-vironment where the liability is incurred. The lower interest rate levelused for IFRS purposes will result in a comparatively lower accretionexpense recognized under IFRS as compared to the accretion ex-pense recognized under US GAAP.Classification of the accretion expense related to the ARO is dif-
ferent under the two GAAPs. Under IFRS, the accretion expense isclassified as part of Financial expense, while it was previously classifiedunder US GAAP as part of Depreciation, depletion and amortization.Depreciation of the related asset will be higher under IFRS as
compared to US GAAP, as the related assets are NOK 361 millionhigher under IFRS compared to US GAAP as of 31 December 2006.This is due to interest rate differences.
Impairment of Property, plant and equipmentThe accounting principles under IFRS differ from those applied un-der US GAAP. The most important differences for Hydro are as fol-lows. US GAAP requires a two-step test where the first step involvestesting the asset’s carrying value against the sum of undiscountedexpected cash flows from the asset. If this test implies that the assetis impaired, the asset is written down to its estimated fair value. InIFRS, there is a one-step impairment test whereby the asset’s car-rying value is compared to the higher of its estimated fair value andits value in use based on discounted expected cash flows from theasset. Generally, the difference related to the impairment testing pro-cedure implies that impairments can be expected to occur earlierunder IFRS than when applying US GAAP. Additionally, under IFRS,impairment losses are reversed if the reason for the impairment is nolonger present, whereas under US GAAP reversal of an impairmentloss is not allowed.As of the adoption of IFRS, Hydro recognized the reversal of
previously reported NOK 174 million impairment loss related to one
asset in the Oil & Energy segment. At the time of adoption of IFRS,market conditions had significantly improved and the basis for im-pairment of the field was no longer present. The impairment wasreversed with a total of NOK 84 million, reflecting what would havebeen the carrying value after depreciation had the asset not beenwritten down as impaired.In addition, Hydro recognized impairment losses related to two
plants, which both are considered cash generating units, in theRolled Products sub-segment of the Aluminium Products segment.For both the plants, expected future cash flows exceed the car-rying value of the assets when not discounted, i.e. no impairmentwas recognized in US GAAP. However, discounted future cashflows did not cover the carrying value of the asset. An impairmentloss of NOK 60 million was recognized on the Malaysian plant.For the Hamburg operation, the impairment loss identified was NOK102 million.During 2006, additional impairment losses were identified. In the
second quarter an impairment loss of NOK 23 million was recognizedrelated to the Automotive Products plant in Holland, USA, which is partof Automotive Products. In the fourth quarter, a renewed evaluation ofthe situation in Malaysia was carried out based on continuing opera-ting losses. An impairment loss of NOK 150 million was recognizedin the fourth quarter. Also in the fourth quarter, an impairment loss ofNOK 66 million was identified related to a remelt plant in Metal.An impairment loss of NOK 5,240 million relating to Hydro’s oil
and gas operations in the US Gulf of Mexico was recognized in USGAAP in the fourth quarter. When Hydro issued its third quarter in-terim report, the assets were evaluated for impairment as a result ofcontinued production shortfalls, but an impairment was not recog-nized at this time under US GAAP as the undiscounted cash flowsexceeded book value. Based on the estimates available as of theissuance of the third quarter, an IFRS impairment loss of NOK 1,804million was recognized in the third quarter, based on the IFRS impair-ment test requiring the use of discounted cash flows. An additionalimpairment was recognized in IFRS in the fourth quarter, based onnew information available at that time.
E – OtherOther effects comprises differences that have a less material impacton Hydro’s equity and net income than the differences discussedabove, and are expected to not significantly change the reportedequity or results in the future.
Equity accounted investeesThe 2006 financial statements of Hydro’s associate and joint ventureinvestees have been reviewed for differences between US GAAPand IFRS, and between IFRS as applied by Hydro and as appliedby our investee. For Hydro’s investees there is a very limited acco-unting effect related to the different GAAPs. The identified US GAAPto IFRS differences of our investees are the same as for Hydro, and

35Conversio
ntoIFR
S
include defined benefit pension and other post employment schemes,capitalization and depreciation of maintenance costs, and differencesrelated to recognition and measurement of contracts in scope of IAS39 Financial Instruments versus the corresponding US GAAP stan-dard, SFAS 133 Accounting for Derivative Instruments and HedgingActivities.The previously recognized US GAAP impairment write-down re-
lated to the Naturkraft investment of NOK 85 million was reversedas of 1 January 2006 under IFRS. The reversal of the write-down re-flects the fact that the partners as of 1 January 2006 had reassumedtheir work towards completing the planned investment after securingauthority approval at acceptable terms; the reasons for impairing theasset no longer exist.The IFRS gain on the sale of Hydro’s investment in Hydro Texaco
in the fourth quarter 2006 was NOK 70 million, which is NOK 17 mil-lion higher than the gain recognized under US GAAP. The difference isprimarily due to Hydro setting to zero all 1 January 2006 foreign curren-cy translation differences in the IFRS opening balance sheet and IFRSto US GAAP differences in the Hydro Texaco financial statements.
Equity investmentsUnder IFRS, non-marketable equity securities are recognized at fairvalue in the balance sheet. Hydro has elected to recognize changes infair value directly in equity, thus no IFRS-US GAAP difference relatedto non-marketable equity investments is, or will be, recognized in theincome statement. The 1 January 2006 IFRS carrying value of theseinvestments is NOK 919 million above cost. The carrying amount un-der US GAAP was NOK 1,138 million as of 1 January 2006 while theIFRS fair value as of 1 January 2006 is NOK 2,058 million. Net of tax,the increase in carrying value compared to US GAAP is NOK 663 mil-lion. These investments are not traded on stock exchanges or similarlyregulated markets. Valuation is, for the largest investments, based onan initial external valuation combined with periodic valuations basedon Hydro’s internal valuation models. For smaller investments, valua-tions are based on internal models. The valuations often are based ona model utilizing cash flow estimates and a market based discountrate for return on equity combined with earnings multiples.
ProvisionsThe recognition criteria are different in IFRS compared to US GAAP.IFRS require recognition of a provision when outflow of economicresources is “probable” defined as more likely than not, generally anyprobability above 50 percent. US GAAP requires recognition of a pro-vision when the outflow of economic resources is “probable”, mea-ning a significantly higher probability than “more likely than not”. This isgenerally interpreted to mean a probability of at least 70-80 percent.There is also a difference in measurement when the expected
outflow is a range of results where no single outcome has a higherprobability than any other outcome within the range. In those situa-tions US GAAP require recognition of the lowest possible outcome
within the range, while IFRS require the mid point of the range. For exitactivities, including costs related to work force reductions, IFRSrequire recognition of a liability when management commits to a planto incur such costs, and communicates its intent in a way that raisesvalid expectations among those who will receive compensation aspart of that plan. US GAAP does not allow recognition of such costsbased on a communicated plan alone, and generally require laterrecognition than IFRS.The IFRS to US GAAP differences resulted in an increase of
recognized provisions of NOK 70 million as of 1 January 2006, mainlyresulting from work force reductions in the Metal operations in Neuss,Germany, which was recognized as of 1 January 2006. Certainexit costs related to the closure of the aluminium smelter in Stade,Germany, were recognized in the amount of NOK 289 million in IFRSin the first quarter of 2006, while the provision was recognized in thesecond quarter 2006 under US GAAP.
Development costsUnder IFRS, development costs are capitalized providing certaincriteria are met. Under US GAAP, development costs are expensedunless they relate to the development of information system softwareor information technology systems or in certain situations related tothe construction of property, plant and equipment. Only one projectrelated to smelter technology has, in the fourth quarter 2006, reacheda stage where development costs are now capitalized under IFRS,but not for US GAAP. The project will continue in 2007.
Deferred tax and tax expenseThere are certain differences in how deferred tax is measured underIFRS as compared to US GAAP. The most important difference forHydro results from subsidiaries having tax payments in a currencydifferent from their functional currency. This relates to certain subsidia-ries both within Oil & Energy and Aluminium Metal. These subsidiariesgenerally have the US dollar as their functional currency, while taxesare paid in the local currency in the country of incorporation or the co-untry where the operations are conducted. Another difference relatesto unrealized gains on inventory that are calculated with the buyer’stax rate under IFRS, while US GAAP require the seller’s tax rate to beused. This difference is not material for Hydro.
Sale and leaseback contractsHydro has one sale and leaseback contract related to a productionvessel in the Oil & Energy segment where the original gain is amortizedover the lease term. As the lease contract is an operating lease, IFRSrequires immediate recognition of the gain. The remaining unamor-tized gain in US GAAP of NOK 22 million (NOK 5 million after tax)has been recognized as reduced liabilities and increased equity as of1 January 2006. The amortization of NOK 5 million during 2006 forUS GAAP reporting purposes represents a difference in IFRS as com-pared to US GAAP net income.

Norsk Hydro ASAN-0240 OsloNorway
t: +47 22 53 81 00f: +47 22 53 85 53e: [email protected]
www.hydro.com
Productio
n:Hydro
–3700250
Print:K
ampen
Grafisk
Hydro is a Fortune 500 energy andaluminium company with 33,000employees in nearly 40 countries.We are a leading offshore producerof oil and gas, a major aluminiumsupplier and a leader in the develop-ment of renewable energy sources.Our mission is to strengthen the viabilityof the customers and communitieswe serve.