Embed Size (px)
Citation preview

Conversion of Bi-Sn Complex to Bi Nanoparticles for the Catalysis of V(II)/V(III) Kinetics
Journal: Journal of Materials Chemistry A
Manuscript ID TA-ART-04-2020-003732.R2
Article Type: Paper
Date Submitted by the Author: 06-Jul-2020
Complete List of Authors: Sankar, Abhinandh; University of Cincinnati, Chemical and Environmental EngineeringGunasekera, Kapila; University of Cincinnati, Computer and Electrical EngineeringNan, Zhipeng; University of Cincinnati, Chemical and Environmental EngineeringWelton, Aaron; University of Cincinnati, Computer and Electrical EngineeringFang, Junchuan; University of Cincinnati, Chemical and Environmental EngineeringTonnis, Kevin; University of Cincinnati, Chemical and Environmental EngineeringTerrell, Rickey; University of Cincinnati, Chemical and Environmental EngineeringBoolchand, Punit; University of Cincinnati, Computer and Electrical EngineeringAngelopoulos, Anastasios; University of Cincinnati, Chemical and Environmental Engineering
Journal of Materials Chemistry A

Conversion of Bi-Sn Complex to Bi Nanoparticles
for the Catalysis of V(II)/V(III) Kinetics
Abhinandh Sankar†,a, Kapila Gunasekera‡,b, Zhipeng Nan†, Aaron Welton‡, Juchuan Fang†, Kevin Tonnis†, Rickey Terrell†, Punit Boolchand‡, and Anastasios P. Angelopoulos*,†
†Department of Chemical and Environmental Engineering, University of Cincinnati, Cincinnati, OH 45221, USA.
‡Department of Electrical and Computer Engineering, University of Cincinnati, Cincinnati, OH 45221, USA.
Present Addresses: aInterplastic, OH, bIM Flash, Lehi, UT,
Corresponding Author: * 513-556-2777, [email protected]
Abstract
In this work, evidence for ligand formation between Sn and Bi is provided utilizing time-resolved X-ray Absorption and 119Sn Mӧssbauer spectroscopy during the colloidal synthesis of Bi metal nanoparticles (NP) in aqueous suspension. SnCl3- is used as simultaneous reducing and stabilizing agent. Auto-reducible complex formation between Sn and Bi using this approach has not been previously been reported. A distorted pyramidal Bi-SnCl3- complex is found to form on the surface of the Bi metal NP which enables their incorporation into electrostatic layer-by-layer (LbL) assemblies of graphene nanoplatelets. These assemblies are shown to act as bifunctional electrocatalyst to simultaneously suppress capacitance losses associated with the hydrogen evolution reaction (HER) and enhance the activity of the V3+↔ V2+ redox couple. Sustainable aqueous-based colloidal synthesis of Bi metal NP utilizing SnCl3- surface ligands provides a convenient method to introduce Bi into macroscopic electrodes for various electrochemical applications.
1. Introduction
Bismuth (Bi) is an abundant earth metal with a low environmental and human toxicity and water stability across a wide pH range.1 Bi has been previously demonstrated to have a positive effect on the performance of various electrochemical systems. For example, in the case of lead acid batteries, the ability of Bi to increase the overpotential for the hydrogen evolution potential (HER) has been a subject of investigation for many years.2-4 Bi is found to have a bifunctional effect which mitigates the poisoning of Pt electrocatalyst surfaces by organic intermediates during formic acid electrooxidation. 5-9 Bi has also been previously demonstrated to have a positive effect on the performance of graphite electrodes when used as a bifunctional agent in the negative half-cell (V3+/V2+ redox couple) of the Vanadium Redox Flow Battery (VRFB).10 11
A key difficulty in the use of Bi in electrochemical applications the requirement that it be incorporated into electrodes as highly dispersed form on the nanometer length scale so as to maximize the surface to
Page 1 of 24 Journal of Materials Chemistry A
volume ratio of the electrocatalytically active component. In the case of V3+/V2+ redox couple, this active component is typically carbon. Material dispersion has historically been accomplished in the catalysis field through the use of nanoparticles (NP). Unfortunately, existing methods for incorporating Bi into NP are presently neither sustainable nor scalable for electrochemical applications. This is because they employ toxic organic solvents and difficult-to-synthesize organic precursors12, difficult-to-remove organic surfactants such as poly(vinylpyrrolidone)13, dangerous hydrazine and lithium reducing agents14,
15, or energy-intensive hydrothermal synthesis routes16. An attractive alternative to these approaches that has recently been demonstrated is NP electrodeposition on carbon electrodes.11, 17 However, the scalability of Bi electrodeposition is limited by the need to maintain sufficient carbon surface availability. In this work, we demonstrate a colloidal synthesis route utilizing stannous chloride ligand as a highly sustainable electroless method to produce Bi NP.
We have previously reported application of stannous chloride ligand to the synthesis of monodisperse pure Pt NP as highly active electrocatalysts for the oxygen reduction reaction (ORR) in proton exchange membrane (PEM) fuel cells.18, 19 The ligand serves as both a reducing agent and, at sufficiently high chloride content to induce an electrostatic charge, a stabilizing agent. At 0.317 V vs RHE, the standard reduction potential of Bi is of larger magnitude than the -0.14 V oxidation potential versus RHE of stannous to stannic and autocatalytic reduction of Bi using this approach should also be feasible. However, the small difference in Pauling electronegativity between Bi and Sn (a ΔχP of only 0.06) makes bond formation between them uncertain. Indeed, to our knowledge, there has been no prior direct evidence a Bi-Sn complex formation.
Autocatalytic reduction of Bi using SnCl2 under acidic conditions on Bi metal powder was reported many years ago.20 The method involved mixing of stannous chloride with bismuth chloride in hydrochloric acid. Bi reduction kinetics and equilibrium compositions were found to be very sensitive to chloride content, being imperceptibly slow (a number of months reaction time) at higher chloride concentrations where BiClx(3-x)- complex formation occurs. Even at lower chloride concentrations, yet still above the point where formation of bismuth oxychloride precipitate occurred, only small amounts Bi were reduced and the equilibrium constant for the anticipated reduction reaction, 2BiCl4 – + 3Sn2+ = 2Bi0 + 3Sn4+ + 8Cl–, could therefore not be reliably determined. Such an extremely slow reduction process is not practical form the standpoint of scalability. Furthermore, electron imaging and spectroscopic methods at the time of this early study did not permit determination of whether stannous chloride formed a complex with Bi nor the types of structures formed. In particular, the source of Bi metal consisted of metal powder with particle sizes ranging between about 44 and 68 micrometers prepared by grinding bulk bismuth metal. The question of whether Bi NP were present in this system was well beyond the interest or capability of the time.
In the present investigation, we use 119Sn Mӧssbauer Spectroscopy to demonstrate that bond formation between Sn and Bi can indeed occur, despite only the somewhat higher electronegativity of Bi (a ΔχP of only 0.06). We minimize chloride content and accelerate the reaction rate from months to days by mixing stannous chloride and bismuth trioxide (Bi2O3) in the presence of dilute hydrochloric acid. We then use Mӧssbauer Spectroscopy and X-ray Absorption Spectroscopy to follow the dynamics of the redox process ex-situ during NP synthesis. Consistent with the rhombohedral crystalline bulk structure
Page 2 of 24Journal of Materials Chemistry A

of Bi metal, we find that the NP produced consist of hexagonal nanoplatelets of mixed Bi and Bi2O3 composition with varying basal plane dimension.
We have previously shown that the stabilizing SnCl3- attached to Pt NP permits their electrostatic assembly into well-defined layer-by-layer (LbL) electrode structures.21 We will here demonstrate how comparable SnCl3- ligands on the Bi NP can be used to fabricate a unique bifunctional electrocatalyst with enhanced V3+/V2+ redox kinetics for potential VRFB application. This negative half-cell of the Vanadium Redox Flow Battery (VRFB) has limited overall system performance due to poor reaction kinetics as well as high capacity losses that occur at the electrode22-25 Capacity losses are attributed primarily to the close proximity of the HER and V3+/V2+ redox potentials on typical carbon electrodes. Our work will show how LbL incorporation of Bi NP into graphene NP assemblies produces electrodes capable of enhancing V3+/V2+ redox kinetics while simultaneously decoupling hydrogen evolution by increasing the overpotential of the HER.
2. Materials and Methods
2.1 BiNP Synthesis
In a typical synthesis, a 10 ml sample of bismuth nanoplatelets (BiNP) was prepared using 0.466 g of Bi2O3 (Sigma-Aldrich) mixed with a 1.35 g of SnCl2.H2O (Sigma-Aldrich) in a small vial containing 10 ml of 0.001M HCl. This represents a molar ratio of about 3.25:1 in terms of Sn:Bi and based on 0.65 M Sn and 0.2 M Bi in the synthesis media. DI water was used through this investigation and obtained from a Millipore Synthesis water purification unit that achieved 18.2 MΩ. The vial was placed on a stir plate at room temperature. The vial was sealed tightly after purging with N2 gas and the NP suspension stirred continuously at room temperature for at least 3 days prior to use. Mӧssbauer spectroscopy data to be discussed later shows that redox synthesis is complete after 3 days. The suspension was ultra-sonicated for 50 minutes before used in mixed suspensions containing graphene nanoplatelets (GNP), as described in the next section. At the total chloride ion concentration used here (1.30 M), about 80% of the available tin exists as the anionic stannous chloride complex at the start of the synthesis with the remainder as hydrated stannous chloride complex and negligible stannous hydroxide. 26 Bi (0.1 M total) begins primarily as the yellow oxide under these synthesis conditions. After about 5 minutes, the synthesis mixture changes color from light yellow to orange and eventually a light grey after about 1 hour. After three days, the color becomes black and, as will be discussed shortly, contains nanoplatelets composed of mixed Bi metal and Bi2O3 phases.
2.2 Colloidal Dispersions of GNP
The stability of the charged GNP is key to the formation suspensions for LbL assembly. Aquadag E paste (Acheson Company) was the source of GNP used here. The suspension used in this study consists of a 5 wt% Aquadag E in water. The pH of the suspension was maintained at a value of ~7 using 0.5M sulfuric acid solution (Fischer Scientific, ACS Plus Grade) to give the GNP sufficient negative surface charge (zeta potential ~ -38mV at a pH of 7).27 The suspension is continuously stirred during preparation. The suspension was stirred on a stir-plate for at least 2 hours and then ultra-sonicated for at least 50 minutes before being used to make the mixed NP suspension. Extensive characterization using Photon
Page 3 of 24 Journal of Materials Chemistry A

Correlation Spectroscopy (PCS, Zeta-Plus from Brookhaven Instruments) to measure electrophoretic mobility has been conducted in our lab for previous studies28, 29 High resolution SEM and X-ray Spectroscopy (XPS and EDS) have also been used in these previous studies to illustrate surface morphology and chemistry of these materials.
2.3 Mixed BiNP-GNP Suspension
A mixed suspension containing BiNP and GNP was formed by simply adding GNP suspension to the BiNP suspension (both as synthesized above) at a volumetric ratio of 4:1, respectively, under constant stirring. The final suspension contains a total molar chloride concentration (0.585 M) where a smaller percentage of SnCl3- ligands are present (~30% 26), with the remaining being neutral. At a mixture pH of 6-7, the GNP retain substantial anionic charge. We shall show that surface composition results in the formation of aggregate BiNP-GNP with sufficient residual negative charge to permit their electrostatic LbL assembly as electrodes with a linear dependence of electrochemical activity on the number of aggregate layers deposited. Such behavior is unlike our previous investigations with silica NP and GNP where substantial negative charges on the surface of both materials prevented aggregation in mixed suspension and resulted in competition for available substrate sites during LbL assembly on gold 27. This GNP:BiNP ratio of 4 was chosen so as to maximize the amount of Bi deposited per layer of electrostatically applied aggregate, which was found to increase with increasing ratio due to the enhanced negative charge on the aggregate. Furthermore, we used a mixed Bi-graphene suspension for LbL assembly due to the fact that sequential application of BiNP and GNP (interspersed with the cationic polyelectrolyte described below) did not yield as substantial Bi deposition. This can be explained by the fact that immersion of the BiNP in the non-chloride containing solution of cationic polyelectrolyte converts the surface stannous chloride to an oxide or hydroxide.
2.4 Electrode Assembly
Electrostatic LbL assembly was used to deposit “as-prepared” BiNP as well as mixed nanoplatelet aggregates on glassy carbon (GC) substrates utilizing a cationic polyacrylamide that has been previously used extensively by our group for comparable applications27-29. A 0.12g L-1 aqueous suspension of the cationic polyacrylamide (acrylamide/β-methacryloxyethyl-trimethylammonium-methyl sulfate copolymer) was used to deposit a layer of positive charge on the substrate, followed by a rinsing in DI water to wash away the excess. The material is found to have a a zeta potential of +29 mV at the final solution pH of 5 30. Electrostatic deposition of the BiNP alone was found to yield much smaller total Bi loadings than when GNP is present due to the weak negative charge present on their surface under the low chloride ion concentrations employed in the assembly process. The cationic polyacrylamide has previously been shown to have little impact on electrical contact resistance during LbL assembly of GNP.28The assembly scheme consisted of immersing the GC substrate first in 0.12 g L-1 cationic polymer, followed by immersion in the either the BiNP synthesis suspension or the mixed BiNP-GNP suspension. Each step is separated with a rinse in DI water for 1 min to remove excess material from the surface. The dipping time was maintained at 2 min for the cationic polyacrylamide. An immersion time of 5 min was used for the BiNP suspension and 2 min for the mixed BiNP-GNP suspension to maximized deposited amount. This initial sequence deposits a bi-layer consisting of the polymer-and nanoplatelets. A number
Page 4 of 24Journal of Materials Chemistry A
of bi-layers ranging from 2 to 20 were prepared for electrochemical investigations. Immersion of the final assemblies in 0.25 M NaOH for 1 minute, followed by rinsing, was used as a final wash to remove any residual free stannous, stannic, or bismuth complexes from the assemblies before electrochemical testing in vanadium electrolyte solutions. All samples were dried under ultra-high pure N2 gas in order to avoid oxidation of BiNP in the assembly. Vigorous agitation was employed during all the DI water rinse steps in order to eliminate any excess layers deposited during assembly.
2.5 119Sn Mӧssbauer Spectroscopy
In this investigation, we used Mӧssbauer spectroscopy to follow the BiNP redox synthesis process over time and confirm stannous chloride ligand formation on the nanoplatelet surface. The Mössbauer spectroscopy experiments made use of a constant acceleration drive in the standard transmission geometry. A 119mSn source in CaSnO3 matrix was used as an emitter. Both the source and the absorber were maintained at 78K during the measurements to increase the size of the Mӧssbauer effect. The gamma rays were detected with a thin NaI crystal mounted on a Photomultiplier. A non-linear least squares fit of the observed lineshape in terms of the requisite number of singlet or doublets were used for deconvolution.
For the Mössbauer effect measurements, samples were taken with a Pasteur pipette at successive increments after mixing, carefully transferred to 0.2 mL propylene PCR tubes (VWR), and promptly frozen in liquid N2. Between sample collections, the vial holding the suspension was purged with nitrogen gas to minimize Bi oxidation. Prior to Mössbauer effect data collection, the frozen samples were mounted to the drive and re-cooled in liquid N2 prior to insertion into the sample chamber of an exchange gas cryostat. Individual solutions of Sn(II), Sn(IV) under acidic conditions, as well as powder SnCl2-2H2O and SnCl4-5H2O were measured for reference. All isomer shifts (IS) are quoted relative to Sn4+ in c-BaSnO3.
2.6 X-ray Absorption Near Edge Structure (XANES)
XANES measurements were performed in the Beamline 20-BM-B in APS Sector 20 at Argonne National Laboratory (Chicago, IL USA) to determine the chemical state of Bi during NP synthesis. A single Si (111) monochromator was used to provide x-rays with and energy range from 2.7 to 35 KeV. This energy range allows the measurements of both the Bi L2 and L3 lines. However, we determined that the L2 spectrum was much more sensitive to changes in the chemical state of Bi during synthesis. A cryostat unit was used to measure frozen samples. Aliquots are extracted from the reactor at pre-determined intervals and then sealed and frozen in small plastic capsules. Both transmission and fluorescence spectra were simultaneously obtained.
2.7 X-ray Photoelectron Spectroscopy (XPS)
XPS of the GNP and mixed BiNP-GNP was obtained with a VG scientific-MultiLab 3000 Surface Science Instruments model SSX-101 M-probe spectrometer quipped with CLAM 4 hemispherical electron energy analyzer and Al/Mg x-ray twin source at the University of Louisville Conn Center for Renewable Energy Research. XPS spectra were measured using Al Ka x-ray radiation (hν » 1486.6 eV) and they were
Page 5 of 24 Journal of Materials Chemistry A

collected at an electron emission angle of 54.7o relative to the surface normal at the base pressure in the low 10-8 Torr range. Powder samples were prepared of both the GNP and mixed BiNP-GNP by slowly drying the corresponding colloidal suspensions. XPS is a surface-sensitive technique which penetrates only tens of Angstroms in depth and measures semi-quantitative elemental concentrations on a specimen surface.
2.8 Microscopic Characterization
A high-resolution high-angle annular dark field scanning transmission electron microscopy (HAADF-STEM) images were obtained at 200 kV for the pure Sn-supported Bi nanoplatelets. No surface charging or edge effects were noticed. A high-resolution FEI XL30 Scanning Electron Microscopy (ESEM) was used with SE and BSE modes to understand the structure and morphology of the electrodes. The FEI XL30 SEM system was equipped with an EDS that monitored the elemental composition changes of the multilayer assemblies. Energy Dispersive Spectroscopy (EDS, EDAX Corp.) was used to render data regarding weight% and thickness information which was derived from semi-quantitative analysis using the C and Bi K emission intensities. Monte-Carlo electron flight simulations were performed to derive the thickness information. X-ray Diffraction Technique (XRD, X’Pert Pro MPD) was used to qualitatively analyze the crystalline structure of the Bi-GNP powder samples. 2Theta angles scan range was from 20o to 90o varied at a step size of 0.2. A 1.50598 k-α Cu anode material was used as source at generation voltage of 45 kV.
2.9 Electrochemical Characterization
Linear Sweep Voltammetry (LSV) was conducted in N2-saturated (Purity Plus Ultra High Purity 99.999%) 0.5M H2SO4 (98%, ACS grade) electrolyte in order to determine electrochemically active area of Bi metal NP in different LbL assemblies using a standard three-electrode electrochemical cell with a Ag/AgCl reference electrode and a Pt-foil counter electrode at room temperature. The reference electrode was calibrated to the Pt(110) peak on a polycrystalline Pt disk electrode that is associated with hydrogen underpotential deposition (HUD) in 0.5 M H2SO4 (at reference potential of -0.08 V vs. Ag/AgCl31). Rotating disk electrode (RDE) and Cyclic Voltammetry (CV) measurements were conducted for all the multilayer assemblies on a glassy carbon (GC) disk electrode (0.196 cm2). The three-electrode cell for RDE was enabled by a rotator and potentiostat (Gamry Reference 600) purchased from Pine Instruments. Echem Analyst software was used for all electrochemical data analysis. The solution used was a 0.1M V(III) + 2M H2SO4 supporting electrolyte as only the negative electrolyte was the focus of this study. The 0.1M V(III) electrolyte was prepared by a common balance process in a single electrochemical cell used in all-vanadium redox flow system employing carbon felts. Initially, the 0.1M V(IV) was prepared by simply dissolving 253.6 g of VOSO4.5H2O in a 2M H2SO4 solution by continuous stirring. The V(III) electrolyte was sealed tightly after purging with N2 gas. The reference and counter electrodes used for all electrochemical measurements were Ag/AgCl (sat. KCl) and Pt coil, respectively. All potentials reported in this study are in reference to Ag/AgCl.
Page 6 of 24Journal of Materials Chemistry A

2.10 The Use of Pt-foil as Counter Electrode
Previous work has shown that dissolution of the Pt is a serious concern during electrochemical measurements, with Pt solution concentrations exceeding 2000 ng L-1, depending on electrode surface structure and applied potentials greater than 0.2 V vs. RHE.32 Earlier work indicated that negligible Pt dissolution occurs in acidic conditions under the moderately negative potentials relative to the V(II)/V(III) redox couple.33 To determine whether dissolution of the Pt counter electrode could influence our reported data, we conducted a series of experiments. Linear Sweep Voltammetry (LSV) was conducted in N2-saturated (Purity Plus Ultra High Purity 99.999%) 2M H2SO4 electrolyte using a 250 mL standard three-electrode electrochemical cell with a glassy carbon (GC) disk electrode (0.196 cm2), an Ag/AgCl reference electrode and a Pt-foil counter electrode at room temperature. Two types of ICP-MS sample were collected to determine the dissolved Pt of counter electrode during the HER process. The first one is the electrolyte after the LSV from 0.0 V to -0.9 V. The other one is that from 0.2 V to -0.9 V. The ICP-MS results are shown in Table 1 with the standard deviation for at least two replicate measurements utilizing fresh solution.
Table 1. Pt Dissolution Data from HER Experiments
Sample detail ICP-MS Pt concentration (ng L-1)
LSV from 0.0 V to -0.9 V vs. RHE
0.3540.089
LSV from 0.2 V to -0.9 V vs. RHE
0.4380.002
The Pt solution values obtained fall at or below the baseline of previous investigations.
3. Results and Discussion
3.1 119Sn Mössbauer Spectroscopy: from Inorganic Complex to NP
119Sn Mössbauer spectroscopy provides information of different Sn oxidation states in the samples of interest. This information is very important to our system because Sn is crucial in acting as both reducing and stabilizing agent. The relative amount of Sn2+ to Sn4+ indicates the extent of Bi reduction during the formation of ligands and provides understanding about the dynamics and mechanism of the NP synthesis process.
In our previous work18, we collected a series of reference spectrums of stannous and stannic chloride dissolved in 7.5 M HCl. This highly acidic pH and high concentration of Cl- have been previously demonstrated to yield a negatively charged complex of SnClx(2-x) with chloride as well as SnCl4. We
Page 7 of 24 Journal of Materials Chemistry A

observed a singlet SnCl4 with an IS at around 0 mm/s and a doublet for SnCl3- because of the departure from the local chemical and geometric tetrahedral symmetry of the Sn2+. It was noted that the SnCl4 IS moved to a somewhat larger velocity versus crystalline SnCl4·5H2O while the SnCl3 shifted to a somewhat lower velocity versus crystalline SnCl2·2H2O. For the stannic species, this is consistent with less electron withdrawal from tin due to the removal of the water from the coordination sphere (a net reduction of tin upon dissolution in acid). However, for the stannous, this is in line with more electron withdrawal by the replacement of water with chloride in the coordination sphere (net oxidation of tin upon dissolution in acid). Fitting data for the reference spectra is summarized in Table 1. In addition to the IS, δ, the quadrupole splitting, Δ, and the Energy width, Γ, of the associated Sn moiety are provided. The Δ parameter is related to the departure from tetrahedral or cubic symmetry of electronic charge distribution around the Sn probe nucleus in the moiety while the δ parameter is related to the electron density at the nucleus.
Table 2. Comparison of Deconvoluted 119Sn Mӧssbauer Spectra Fitting Parameters for Sn Moieties Observed in this Investigation to those of Prior Work
Sample IS, δ, mm/s
Quadrupole splitting, Δ,
mm/s
Energy width,
Γ, mm/s
SnCl2·2H2O 3.55 1.32 1.08
SnCl2 in 7.5 M HCl* 3.44 1.16 0.903
SnCl2 in 0.001 M synthesis medium†
3.55 1.32 0.892
SnCl4·5H2O 0.17 - 1.16
SnCl4 in 7.5 M HCl* 0.34 - 1.04
SnCl4 in 0.001 M synthesis medium†
0 - 1.10
Sn-Pt complex in 7.5 M HCl synthesis medium
(Sn:Pt = 9)*1.67 1.75 1.01
Sn-Bi complex in 0.001 M synthesis medium
(Sn:Bi = 3.25)†3.05 1.82 0.906
*Data from Reference 18.†At 3 days synthesis time.
Page 8 of 24Journal of Materials Chemistry A

In our present investigation, a 0.001 M HCl synthesis solution was used to eliminate inhibition of Bi reduction by bismuth chloride complexes and accelerate colloidal Bi synthesis. Select deconvoluted time-resolved spectra for Sn2+ and Sn4+ during Bi NP synthesis are shown in Figure 1 and the fitting parameters summarized in Table 2 for the equilibrated (3 day) system. The complete set of spectra collected for this investigation are shown in Figure S1 of Supporting Information document. Comparison to the reference data permits a relatively straightforward way to explain the isomer shift for time-resolved samples, namely shifts toward lower velocities are associated with oxidation while shifts towards high velocities are associated with reduction of Sn in the given environment.
Figure 1. 119Sn Mӧssbauer Spectroscopy of the synthesis suspension at various time intervals: (a) 0 minutes, (b) 24 hours, and (c) 3 days. The solid black line indicates the measured spectra while the deconvoluted spectra for the various Sn moieties are shown in color: green for moiety A, blue for moiety B, and red for moiety C, as identified in Figure 2.
Page 9 of 24 Journal of Materials Chemistry A

We have assigned labels A, B, and C in Figure 1 to identify the local Sn sites present in the synthesis mixture over time. These sites are shown schematically in Figure 2. We use this labeling scheme to elucidate the evolution of local structure during nanoplatelet synthesis in sequence of their appearance: A, B, then C
Figure 2. Structure of tin sites in synthesis mixture identified during the deconvolution of Mӧssbauer spectra in Figure 1: pyramidal stannous chloride site A, tetrahedral stannic chloride site B,) distorted pyramidal site C. The arrow in the site C structure indicates the direction of Sn valence transfer relative to SnCl3-.
Site A. When Bi2O3 and SnCl2·2H2O are mixed in 0.001 M HCl solution, the doublet associated with hydrated SnCl2 is observed at the very beginning of the synthesis. This feature is labeled as Sn site A in Figure 1 (the blue line) and the associated fitting parameters are given in Table 2. This site represents a Sn species having a local structure that occurs in the synthesis solution. The chemical valence of Sn is Sn2+ and its local structure consists of a pyramidal [SnCl3]- as shown in Figure 2 (A). The lack of tetrahedral symmetry leads to a quadrupole splitting ΔB and isomer-shift δB characteristic of hydrated Sn2+. In the first two samples collected after the start of the synthesis, only the stannous is observed to a significant degree. When the reaction has proceeded to 12 hours, a decrease in the intensities of stannous occurs while a very noticeable stannic singlet emerges at around 0 mm/s.
Site B. The next spectrum to appear as synthesis progresses is singlet feature we label as site B in Figure 1 (the purple line) and is characteristic of a Sn4+ species. We view this site as a tetrahedrally coordinated SnCl4 moiety shown in Figure 2 (B). As the reaction proceeds one finds that site B grows at the expense of site A, giving signature of an oxidation-reduction reaction taking place in the synthesis suspension which extends over a time span of several days.
Site C. Simultaneous to the appearance of site B at 12 hours in Figure 1, we observe the appearance of another doublet with a centroid at 3.1 mm s-1 (the red line). This third, and perhaps most significant feature observed in the spectra of the synthesis solution is labeled as site C and has fitted quadrupole splitting and isomer shift parameters as indicated in Table 2. The isomer shift suggests a Sn2+ species. This particular local structure we associate with the formation of a Sn-Bi bond as shown in Figure 2 (C), in which the local coordination geometry departs from tetrahedral symmetry because of the presence of a finite quadrupole splitting.
We view site C as indicating Sn has bonded to a Bi-rich NP. Although 119Sn Mӧssbauer spectroscopy cannot directly probe the Bi-cation, signature in the growth of the Bi NP is given through observation of site C. This particular site steadily increases in signal strength after 12 hours and then stabilizes to
Page 10 of 24Journal of Materials Chemistry A
nearly 20% of the signal strength in the Mӧssbauer spectra (see Figure 2) of the trimodal sites (A, B,and C) observed in our experiments. Confidence in the assignment of site C is given by the reduction in isomer-shift as one goes from site A to site B that is fully consistent with the somewhat higher Pauling electronegativity of Bi (2.02) in relation Sn (1.96) leading to some of the Sn valence charge being transferred to the Bi nearest neighbor as shown in Figure 3. From Table 2, we note that the isomer shift of the Sn bonded to Bi is smaller than when bonded to Pt. Such behavior is consistent with the larger Pauling electronegativity of Pt (2.28).
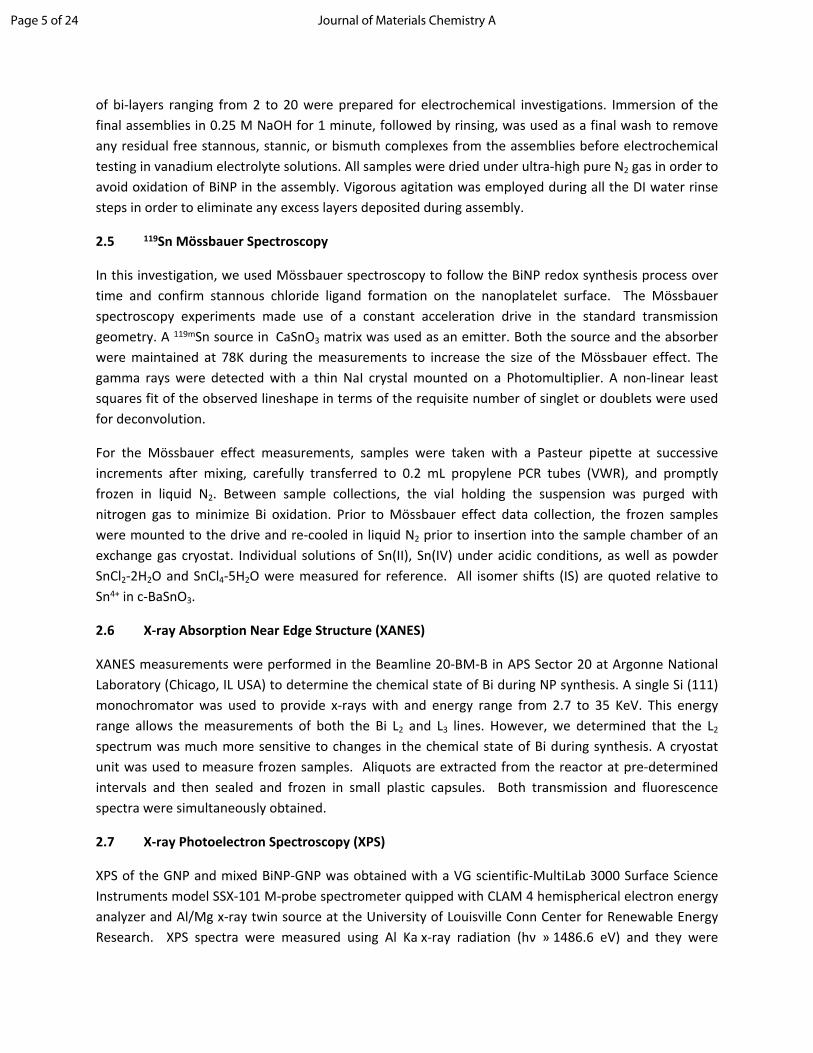
By integrating the area of the de-convoluted spectra in Figure 1, the time-evolution of the contributions to different sites (A, B, and C) can be quantified, as shown in Figure 3. In correlating the relative intensity ratios shown in Figure 1 to species stoichiometry, we inherently assume that recoil-free fraction of the species to be the same. This is a reasonable approximation given that the species are present as solutes frozen in the same solvent18. For the first two samples, no Sn-Bi complex site is observed and mostly the contribution is from the stannous doublets. Only after 12 hr do the contributions of stannic and Sn-Bi complex site appear. Ligand formation between Bi and Sn is therefore much slower than we have previously observed between Pt and Sn. From the comparison of different site contributions in Figure 3, it can be seen that the tin conversion stabilizes after 3 days (with fitted parameters given in Table 2 for each tin moiety). A large portion of initial stannous was transformed into stannic or complexed with Bi. This can be seen by the swap in the relative contributions of stannous and stannic at the end of the reaction. However, given that 3 Sn must be oxidized for every Bi that is reduced and that the starting Sn:Bi ratio in the synthesis suspension was 3.25:1, the persistence of Sn2+ in Figure 3 that is not complexed with Bi indicates that not all the Bi is reduced. This will be confirmed in EDS, XRD, and XANES analyses to be presented shortly. The contribution of the complex site is found to increase initially and then stabilize prior to equilibration of the overall reduction process. The growth and persistence of the Sn complex signal during metal reduction suggests that it plays an integral role in both nuclei formation and final NP stabilization. This complex will also participate in the mixed BiNP-GNP electrode assembly that is integral to this investigation.
Figure 3. Time-resolved contributions of individual Sn moieties obtained from integrated Mossbauer spectra shown in Figure 1. Stannous site A (squares, solid line), stannic site B (triangles, dashed line) and Sn-Bi complex site C (circles, dotted line) are indicated.
Page 11 of 24 Journal of Materials Chemistry A
In summary, we observe from the 119Sn Mӧssbauer data in Table 2 that Sn-X ligand formation between Sn and element X (where X = Bi or Pt) results from a transfer of Sn valence to X relative to SnCl3- that is reflected in a decrease of the isomer shift. The amount of valence transfer appears to be correlated to the Pauling electronegativity of X, yielding a higher isomer shift and thus less transfer in the case of Bi relative to Pt. Such withdrawal of electron density from Sn results in a more highly distorted local pyramidal structure relative to SnCl3- in the case of both Pt and Bi, as indicated by the increased quadrupole splitting.
3.2 Structure and Composition of BiNP
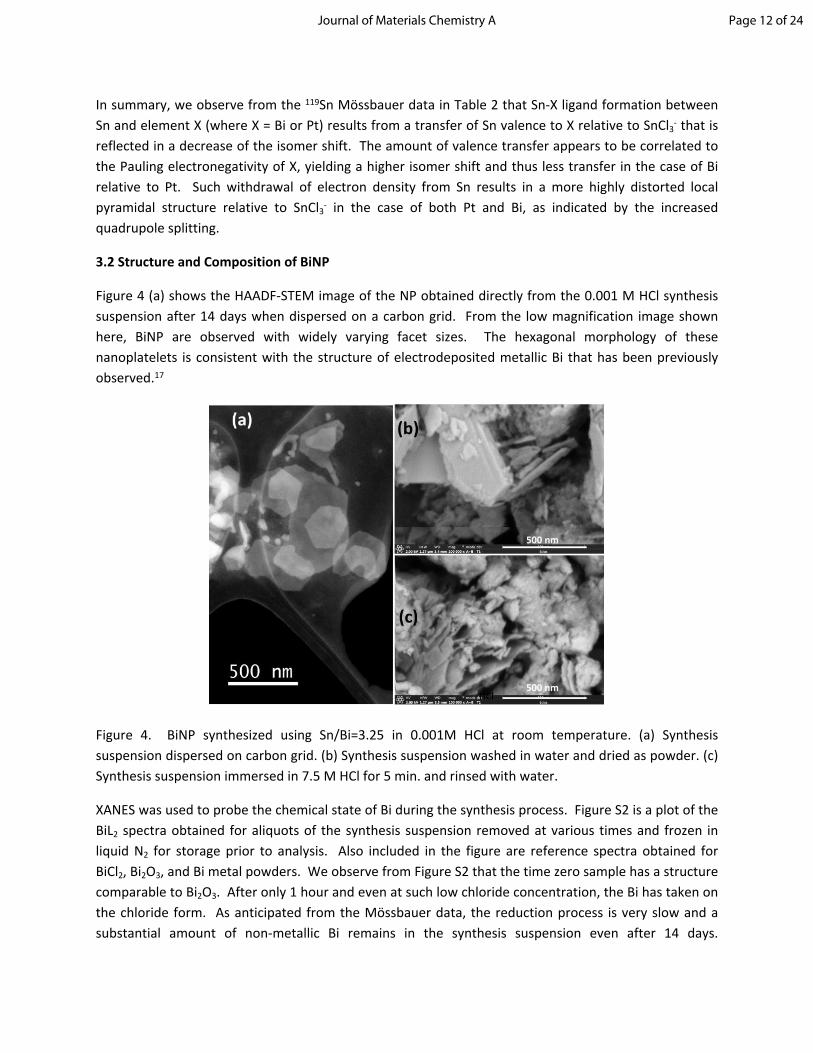
Figure 4 (a) shows the HAADF-STEM image of the NP obtained directly from the 0.001 M HCl synthesis suspension after 14 days when dispersed on a carbon grid. From the low magnification image shown here, BiNP are observed with widely varying facet sizes. The hexagonal morphology of these nanoplatelets is consistent with the structure of electrodeposited metallic Bi that has been previously observed.17
Figure 4. BiNP synthesized using Sn/Bi=3.25 in 0.001M HCl at room temperature. (a) Synthesis suspension dispersed on carbon grid. (b) Synthesis suspension washed in water and dried as powder. (c) Synthesis suspension immersed in 7.5 M HCl for 5 min. and rinsed with water.
XANES was used to probe the chemical state of Bi during the synthesis process. Figure S2 is a plot of the BiL2 spectra obtained for aliquots of the synthesis suspension removed at various times and frozen in liquid N2 for storage prior to analysis. Also included in the figure are reference spectra obtained for BiCl2, Bi2O3, and Bi metal powders. We observe from Figure S2 that the time zero sample has a structure comparable to Bi2O3. After only 1 hour and even at such low chloride concentration, the Bi has taken on the chloride form. As anticipated from the Mӧssbauer data, the reduction process is very slow and a substantial amount of non-metallic Bi remains in the synthesis suspension even after 14 days.
Page 12 of 24Journal of Materials Chemistry A

Consequently, we next investigated various chemical and electrochemical washing procedures to remove Sn, chloride, and oxide residues from the Bi metal nanoplatelet.
The SEM image in Figure 4 (b) is that of the BiNP powder collected after washing with water while that in Figure 4 (c) is that obtained after immersion in 7.5 M HCl for 5 minutes followed by a water rinse. We note from EDS data corresponding to these last two samples and given in Table S1 that HCl washing removes Sn, chloride, and oxide residues. The XRD spectrum in Figure S3 is of the HCl-washed sample in Figure 4 (c). The XRD pattern exhibits intense peaks which are assigned to the rhombohedral structure of bismuth metal. The asterix in Figure S3 indicate the positions of much smaller BiOx peaks while the squares indicate peaks associated with the aluminum holder. This assignment is in agreement with XRD patterns observed for BiNP obtained utilizing alternative approaches.34, 35
3.4 Structure and Composition of Mixed BiNP-GNP and “as prepared” Layered Assemblies.
Figure 5 depicts the morphological evolution of the GC substrate surface after the deposition of multiayer assemblies of the mixed BiNP-GNP with the number of layers increased from 2 to 20. The lighter regions in the image correspond to clusters with enriched Bi concentration. Figure 5 (a) depicts complete coverage of the GC substrated by a combination of GNP and BiNP reached with the application of only 2 layers. Given that both the BiNP and GNP have negative surface charge in the mixed suspension (albeit weak in the case of the BiNP), sufficient Van der Waals force must be present to permit such close association between the two types of nanoplatelets. The BiNP clusters are observed in Figure 5 to increase substantially between the application of 8 and 20 layers, suggesting a degree of directed assembly 27 in this system.
Figure S4 (a) is a high mag image of a typical Bi cluster observed with 4 applied layers. The clusters at this and the 2 and 8 layer loadings have a “flower-like” appearance and a relatively symmetric diameter. Figure S4 (b) is a high mag image of a typical cluster that is observed with 20 applied layers. These have a less uniform appearance than those obtained with fewer layers and have a diameter that is roughly three times larger. The bright clusters deposited with 20 layers have an average Bi:C elemental composition of 0.77 (with or without acid or alkaline washing) compared to an average Bi:C composition of about 0.12 in the intersticial regions between these clusters; as measured utilizing EDS.
Page 13 of 24 Journal of Materials Chemistry A
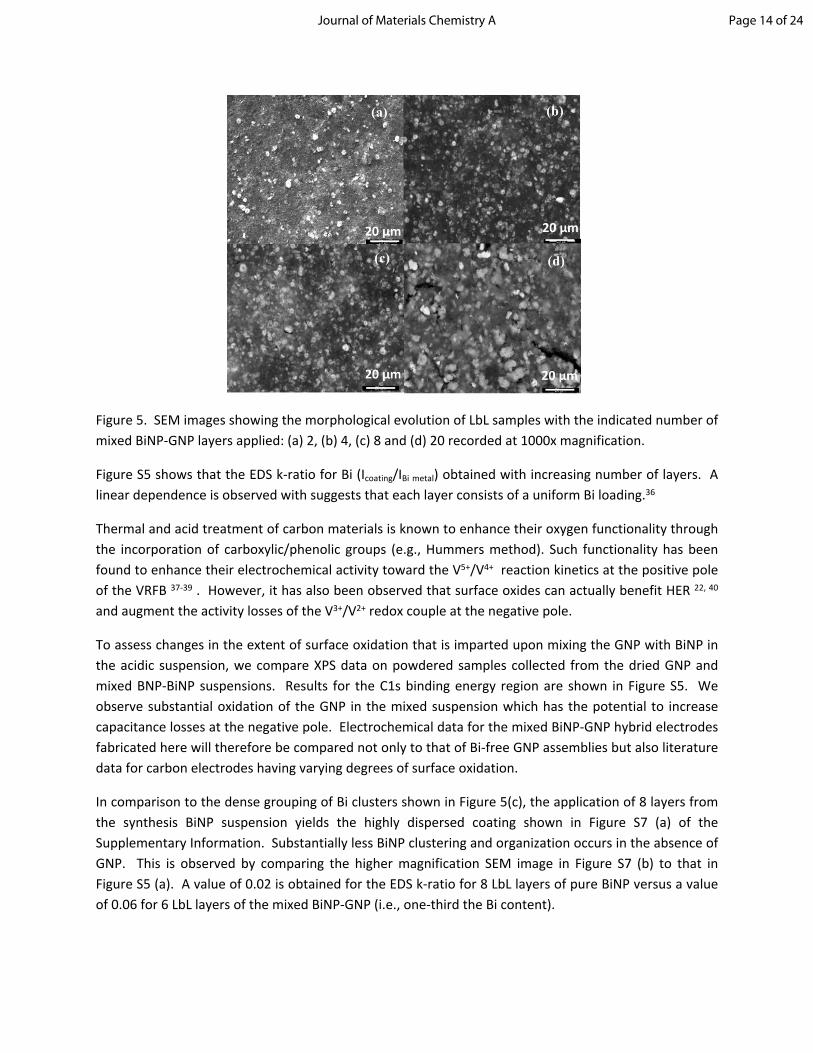
Figure 5. SEM images showing the morphological evolution of LbL samples with the indicated number of mixed BiNP-GNP layers applied: (a) 2, (b) 4, (c) 8 and (d) 20 recorded at 1000x magnification.
Figure S5 shows that the EDS k-ratio for Bi (Icoating/IBi metal) obtained with increasing number of layers. A linear dependence is observed with suggests that each layer consists of a uniform Bi loading.36
Thermal and acid treatment of carbon materials is known to enhance their oxygen functionality through the incorporation of carboxylic/phenolic groups (e.g., Hummers method). Such functionality has been found to enhance their electrochemical activity toward the V5+/V4+ reaction kinetics at the positive pole of the VRFB 37-39 . However, it has also been observed that surface oxides can actually benefit HER 22, 40 and augment the activity losses of the V3+/V2+ redox couple at the negative pole.
To assess changes in the extent of surface oxidation that is imparted upon mixing the GNP with BiNP in the acidic suspension, we compare XPS data on powdered samples collected from the dried GNP and mixed BNP-BiNP suspensions. Results for the C1s binding energy region are shown in Figure S5. We observe substantial oxidation of the GNP in the mixed suspension which has the potential to increase capacitance losses at the negative pole. Electrochemical data for the mixed BiNP-GNP hybrid electrodes fabricated here will therefore be compared not only to that of Bi-free GNP assemblies but also literature data for carbon electrodes having varying degrees of surface oxidation.
In comparison to the dense grouping of Bi clusters shown in Figure 5(c), the application of 8 layers from the synthesis BiNP suspension yields the highly dispersed coating shown in Figure S7 (a) of the Supplementary Information. Substantially less BiNP clustering and organization occurs in the absence of GNP. This is observed by comparing the higher magnification SEM image in Figure S7 (b) to that in Figure S5 (a). A value of 0.02 is obtained for the EDS k-ratio for 8 LbL layers of pure BiNP versus a value of 0.06 for 6 LbL layers of the mixed BiNP-GNP (i.e., one-third the Bi content).
Page 14 of 24Journal of Materials Chemistry A

We used XPS to examine the chemical state of the Bi on the various assemblies. A typical Bi4f binding energy region result is shown in Figure S8 of the Supplementary Information and indicates that the surface is completely oxidized by the time analysis is conducted due to exposure to ambient. 3.4 Influence of LbL Assembly Scheme on Bi Loading.
In order to further quantify the BiNP loading and also assess the electrochemical stability of the LbL assemblies, Linear Sweep Voltammetry (LSV) was used. The electrodes containing assemblies of mixed BiNP-GNP were swept in 0.5M H2SO4 solution at a scan rate of 50 mV s-1 in the Bi0metal stripping region of ~-0.1 V vs Ag/AgCl. The Bi0metal Bi3+ anodic stripping chemistry on carbon has been extensively investigated 41-44. Bi stripping on carbon occurs at a substantially lower potential than Pt45 and has a wide solvent window at negative potentials. Common applications include anodic stripping analysis of Bi electrodes with the goal of replacing mercury-based film electrodes (MFEs) in electrochemical sensing. We here use changes to the stripping peak intensity as the potential is swept multiple times as a measure of the relative stability of the Bi content. In addition, we use the first sweep during LSV to obtain information regarding the relative amount of Bi that is electrochemically accessible in each of the multilayer structures.
We have determined that potential cycling or washing the final assembly in either HCl or NaOH is necessary to in order to observe Bi stripping current on carbon. This is because the tin surface ligands employed during synthesis must be removed to expose Bi to electrolyte. The role of tin ligands in passivating electrochemically active surfaces has been investigated in our prior work with Pt NP synthesis 46, 47. We here use LSV to demonstrate the impact of Sn ligands on the electrochemical activity Bi. Figure S9 (a) shows the electrochemical behavior of a 4 layer sample rinsed only in water under multiple potential sweeps in 0.5 M H2SO4 at 50 mV s-1. The potential is swept in the positive direction up to 0.8 V vs. Ag/AgCl in order to strip the Sn. We observe that negligible Bi stripping current is observed during the initial sweep and that as many as 13 potential sweeps are needed to maximize the current. Between 13 and 40 cycles, the drop in stripping current suggests Bi dissolution in H2SO4. Figure S9 (b) shows the impact on stripping current of washing an 8 layer assembly in 0.25 M NaOH for 1 minute. We observe that maximum Bi stripping current occurs during the initial sweep and declines thereafter. We therefore choose to use this treatment in our subsequent electrochemical measures of relative Bi content.
Page 15 of 24 Journal of Materials Chemistry A

Figure 6. LSV of the first potential sweep in 0.25 M H2SO4 after 1 min. 0.25 M NaOH wash for the indicated number of mixed BiNP-GNP layers. Scan rate of 50 mV s-1. Inset shows the variation in Bi loading with number of layers computed using the coulombic charge under the stripping curve.
With respect to stability of the Bi loading, we note in Figure S9 (b) that very little change in Bi stripping current occurs between the 25th and 50th sweep. As will be discussed shortly, this feature of Bi stripping was only observed with the mixed BiNP-GNP suspension and not with the BiNP alone. In Figure 6, we examine the 1st potential sweep of the Bi stripping peak of the 2, 4, 8, and 20 layer samples to compare the relative Bi loading. We observe that, as the number of layers increases, the peak stripping intensity increases linearly. The weight loading of metallic Bi associated with the first sweep is shown in the inset of Figure 6 and was calculated from the area under the curve for the 3 electron stripping process. The linear behavior observed in the inset is consistent with the EDS data shown in Figure S5 and demonstrates LbL control over deposition of the mixed BiNP-GNP.
Bi stripping was also used to assess the durability of the mixed BiNP-GNP assemblies after exposure to potential cycling at range of potentials (-0.4 to -1.0 V vs. Ag/AgCl) and H2SO4 electrolyte strength (2 M) relevant to the V3+/V2+ couple. Figure S10 shows the initial, 50th, and 100th consecutive CVs for 8 layers of mixed BiNP-GNP on GC at a sweep rate of 20 mV s-1. We observe a slight increase in HER overpotential relative to the initial cycle and a high degree of stability between the 50th and 100th cycle. The small initial increase is likely due to the reduction of residual Bi oxide on the surface of the starting sample. Figure S11 shows the LSV Bi stripping result subsequent to each of these cycles. We observe a Bi loss of about 9% after 100 cycles which, as previously discussed, is likely due to the measurement technique itself.
In comparison to the significant LSV current observed during Bi stripping for the mixed BiNP-GNP assemblies, and consistent with the SEM images previously described, a substantially reduced current is observed in the case of the pure BiNP LbL assemblies. A peak LSV current of only about 1 mA cm-2 is observed for 8 LbL assemblies of BiNP versus a value greater than 15 mA cm-2 obtained for 4 LbL
Page 16 of 24Journal of Materials Chemistry A

assembly of mixed BiNP-GNP. This is shown in Figure S12 of the Supplementary Information. Attempts to achieve sequential LbL assembly of BiNP independent of the presence of GNP yielded low Bi loadings due to the weak charge on the BiNP while immersed in cationic polyacrylamide solution. In addition, the absence of GNP resulted in substantial removal of Bi during comparable electrochemical cycling. Figure S12 shows the effect of successive LSV on the 8 layer BiNP assembly. Substantial loss of Bi stripping current is observed after only 10 cycles. Two peaks are also observed to evolve decreasing Bi stripping current that may be associated with the presence of residual bismuth chloride complexes consistent with the persistence of Cl in EDS survey spectra .
Plateauing of Bi stripping current observed in Figure S9 (b) for the case of the mixed BiNP-GNP suggests that the GNP is providing mechanical support for the BiNP during the deposition of each layer of mixed suspension in a structure analogous to intercalation compounds. After the initial coating of Bi is removed from the clusters, the electrochemically accessible Bi area becomes restricted by the intermixed GNP.
3.7 Investigation of V3+/V2+ Redox System.
The RDE is a well-studied hydrodynamic electrode technique in which one-dimensional mass transport is considered.48 While the Levich equation governs the stead-state diffusion-limited current for a sigmoidal voltammogram, the Koutecky-Levich (K-L) analysis can be used to extract kinetic parameters of the electrode reaction (as given below).
(1)1
𝑖𝑅𝐷𝐸=
1𝑖𝐾
+ 1
𝑖𝑙𝑖𝑚=
1𝑖𝐾
+ 𝐵
𝜔1/2
where iRDE , ilim, and iK are the total measured current density, the diffusion-limited current density, and the reaction-kinetics limited current, respectively, at each electrode potential. Parameter B is a constant independent of ration speed, ω. The intercept of a plot of im-1 at a given potential versus ω-1/2 yields iK. Knowing the value of iK, it is then possible to calculate the rate constant k of the desired redox reaction using:
(2)𝑖𝐾 = 𝑛𝐹𝐴𝑘𝐶𝑏
where n, F, A, k and Cb are the number of charges transferred (mol-1), Faraday constant (C mol-1), electrode area (cm2), electrochemical rate constant (cm s-1), and bulk concentration (mol cm-3) of the electroactive species, respectively.
The multilayer assemblies were subjected to RDE analysis in 0.1M V(III) + 2M H2SO4 electrolyte solution. Due to rapid oxidation of V(III) in the presence of air, the electrolyte solution was bubbled with high-purity N2 gas before testing and was continuously purged providing an inert atmosphere over the electrolyte during testing. Figure 7 (a) compares the RDE data for an 8 layer electrode assembly of the mixed BiNP-GNP with an 8 layer consisting of only GNP (no Bi) at a rotation rate of 750 rpm in 0.1M V(III) electrolyte solution. All potentials were kept below -0.1 V to prevent Bi stripping. A 0.24 V increase in overpotential is observed for the BiNP-GNP electrode relative to the GNP electrode at the -0.6 V mixed
Page 17 of 24 Journal of Materials Chemistry A

potential chosen for Kutecky-Levich analysis of the BiNP-GNP electrode. This represents a significant reduction in the activation overpotential.
The mixed BiNP-GNP assembly exhibits a more well-defined limiting current in Figure 7(a) relative to the assembly without Bi. This is attributed to faster redox kinetics on the GNP and simultaneous suppression of the HER by the presence of Bi when scanning at the negative potentials. Beyond -0.6 V (vs Ag/AgCl), the HER begins to dominate.
Figure 7. (a) RDE voltammograms of 8 mixed BiNP-GNP layers (solid line) in comparison to 8 GNP without Bi (dotted line) and bare GC substrate (dashed line) at 750 rpm in N2-saturated 0.1M V(III) + 2M H2SO4 solution. (b) LSV of 8 layers of GNP (dotted line), 8 layers of BiNP-GNP (solid line) in 2 M H2SO4 at 2 mV s-1, and 8 layers of BiNP (dashed-dotted line)
Page 18 of 24Journal of Materials Chemistry A
The impact of Bi on the HER is more directly shown by the LSV measurements in Figure 7 (b). Here, 8 layers of GNP with (solid line) and without (dotted line) mixed BiNP have been assembled on GC substrate utilizing cationic polyacrylamide and with a sweep potential at 2 mV s-1 in 2 M H2SO4 electrolyte. Also shown are the results for BiNP without GNP (dashed-dotted line) and bare GC (dashed line).
We note from Figure 7(b) that the overpotential for HER when the BiNP are present in a mixed suspension with GNP increases by a magnitude greater than 0.1 V relative to that for the GNP alone. When the BiNP are deposited in the absence of GNP, even at a substantially lower concentration than the mixed suspension (measured in terms of the Bi stripping current, SEM imaging, and EDS), HER is found to shift to potentials more negative than BiNP-GNP. Such behavior indicates that mixing these Bi nanomaterials with graphene can create bifunctional electrocatalysts to tune HER overpotential. The V(III) solution data shown in Figure 7 (a) for mixed BiNP-GNP can thus be interpreted as resulting from a bifunctional effect wherein the Bi component suppresses HER to lower potentialswhile the GNP component simultaneously enhances the reversibility of the vanadium redox reaction.
Figure S13 (a) shows the electrochemical impact of increasing the number of mixed BiNP-GNP layers. Application of additional layers improves the kinetics even further with the onset potentials for the V3+ V2+ reaction occurring at more positive potentials. In order to evaluate the mass-transfer properties and extract the reaction kinetics parameters, the electrode assemblies were subjected to different rotation speeds in the same electrolyte while maintaining a potential sweep rate of 2 mV s-1. Figures S13 (b) and S13 (c) compare the effect of RDE rotation speed of 8 layers of the pure GNP assemblies to 8 layers of the mixed BiNP-GNP assemblies, respectively. We observe that the limiting current is well established only when Bi is present. The inset in Figure S13 (c) shows the linear dependence of the limiting current to the square root of rotation speed and indicates that mass-transfer by diffusion limits the V3+ V2+ redox current when Bi is present. The slopes of the ilim vs ω1/2 for all the BiNP-GNP assemblies were found to be similar indicating that there is no appreciable change in the diffusion coefficient of the active species. Even though the LbL assembly of only GNP (no Bi) improved the kinetics relative to the GC substrate, persistence of the problematic side HER reaction did not permit evaluation of ilim for these electrodes.
A K-L analysis was next performed to extract the kinetic parameters associated with the assembled electrodes. Figure S14 (a) shows the K-L plot for the BiNP-GNP electrodes at the mixed kinetic-diffusion region (-0.6 V vs Ag/AgCl) for different layer numbers. Figure S11 (b) compares the K-L plot of an 8-layer sample of GNP alone but at -0.63 V vs Ag/AgCl to stay within the mixed kinetic-diffusion region for the electrode. The intercepts of the plots in Figure S14 (iRDE
-1 vs ω-1/2) yield the values of iK in mA/cm2 for each assembly. Results are summarized in Table 3. Using these values of iK , Equation (2) is applied to obtain the associated reaction rate constants, k at that potential. These are also given in Table 3. The kinetic currents obtained from K-L plots for LbL electrodes with GNP alone (no Bi) are also included in Table 3 for comparison. However, given the higher overpotential when Bi is not present, these were generated at the mixed reaction-diffusion control potential of -0.65 V (vs. Ag/AgCl). We note that the mixed BiNP-GNP electrodes exhibit an increase in the reaction rate constant relative to the GNP at the
Page 19 of 24 Journal of Materials Chemistry A

same number of layers. Both types of electrodes show increased activity with number of layers deposited.
Table 3. Cathodic Parameters obtained from Koutecky-Levich Plots for 8 layer nanoplatelet assemblies.
Assembly Type With Bi a Without Bi b
Number of Layers 4 8 20 4 8 20
iK
(mA cm-2)
40.8 46.9 52.6 6.21 10.6 32.7
k x 10 3 (cm s-1) 4.23 4.87 5.46 0.644 1.01 3.39
a Calculated at -0.60 V (vs Ag/AgCl)
b Calculated at -0.65 V (vs Ag/AgCl)
The K-L analysis is repeated to obtain kinetic current, ik, at various potentials, as shown in Figure S11(c). This current at each potential may then be plotted versus the potential and extrapolated to the standard potential, E0, to obtain the exchange current, i0. E0 is the standard potential for the reaction at experimental conditions and taken to be the average of the potentials at peak anode and cathode current obtained from CV analyses at various sweep rates. We find that E0 = -0.55 V vs Ag/AgCl and determine that the exchange current, i0, has values of 22.9 mA cm-2 , 25.7 mA cm-2 , and 26.9 mA cm-2 for the 4, 8, and 20 layers of the mixed BiNP-GNP, respectively. The corresponding exchange rate constants, k0, are 2.37 x 10⁻³ cm s-1, 2.66 x 10⁻³ cm s-1, and 2.79 x 10⁻³ cm s-1, respectively. Such high rate constants in comparison those we previously obtained for the V4+/V5+ redox couple on electrostatically assembled GNP elecrodes39 are consistent with reversible electrode kinetics. The Tafel slope is found to be comparable in all cases, with an average value 211 mV/decade with less than 10% relative error. The correlation coefficient for the linear Tafel fits was in every case 0.98 or better.
As previously indicated, carbon treatment, both chemical and electrochemical, is known to have a significant impact performance due to surface oxide creation. A recent investigation49 has used EIS to show that cathodic and anodic electrochemical treatments on a variety of carbon electrodes yields k0 values for the V3+/V2+ couple ranging from 1.13 x 10⁻⁶ cm s-1 to 3.69 x 10⁻⁴ cm s-1. These values are at least an order of magnitude lower than those we have obtained for the mixed BiNP-GNP assemblies.
Previous investigations have suggested that an intermediate compound (BiHx) may be formed on the carbon felt surface and possibly act as an active site for V3+ to convert to V2+.50 Our own investigation with mixed BiNP-GNP assemblies suggests that the Bi can have a significant impact on the redox kinetics of V3+/V2+ reaction independent of this hypothesis by decoupling the HER reaction.
Page 20 of 24Journal of Materials Chemistry A
4. Conclusions
Our previous work on the use of stannous chloride for the colloidal synthesis of Pt NP in aqueous suspension has demonstrated that a Sn-Pt complex forms before the autoreduction of Pt2+ to Pt0.18 In general, formation of an M-Sn complex is essential before electron transfer can proceed and is integral to this NP synthesis method for M metal. While the Bi3+ reduction potential indicates a favorable thermodynamic driving force, Bi-Sn complex formation is uncertain given the small Pauling electronegativity difference between the two elements. In this work, we have successfully used X-ray Absorption Spectroscopy and 119Sn Mӧssbauer Spectroscopy to confirm Bi-Sn complex formation during BiNP synthesis. By avoiding the use of organic surfactants and solvents as well as hazardous reducing agents and energy intensive hydrothermal synthesis, this approach presents a significant advance in sustainability over previous Bi NP synthesis methods.
Our current work also shows how the distorted pyramidal Bi-SnCl3- complex which forms on the surface of the BiNP permits their incorporation into electrostatic assemblies with GNP. Electrochemical application of these assemblies is demonstrated through their use as electrodes that substantially reduce the charge transfer resistance associated with the V3+/V2+ redox reaction relative GNP alone. LbL assembly allows for precise control over the amount of Bi that can be deposited to decorate a substrate without obstructing access to the catalytically active graphene surface (a key drawback of recent electrodeposition methods). Our investigation indicates that electrocatalytic activity is enhanced through a bifunctional effect whereby BiNP suppress HER without obstructing the highly active graphene sites on the GNP.
Conflicts of interest
There are no conflicts to declare.
Supporting Information
This material is available online at…
Acknowledgements
Funding for this work was provided by NSF Grant DMR Award 1410118 and is gratefully acknowledged. XPS measurements were provided by Dr. Jacek Jasinski at the University of Louisville Conn Center for Renewable Energy Research. HAADF-STEM images were obtained by Dr. Indrajit Dutta at Corning Incorporated. SEM images were obtained by Melodie Fickenscher at the Advance Materials Characterization Center (AMCC) of the University of Cincinnati. We also wish to thank Dr. Chengjun Sun from Argonne National Lab for generous technical guidance during data collection and analysis. This research used resources of the Advanced Photon Source, an Office of Science User Facility operated for the U.S. Department of Energy (DOE) Office of Science by Argonne National Laboratory, and was supported by the U.S. DOE under Contract No. DE-AC02-06CH11357, and the Canadian Light Source and its funding partners.
Page 21 of 24 Journal of Materials Chemistry A

References
1. H. Okamoto, J. Phase Equilib., 1991, 12, 207-210.2. M. J. Koop, D. A. J. Rand and B. Culpin, J. Power Sources, 1993, 45, 365-377.3. N. Papageorgiou and M. Skyllas-Kazacos, Electrochim. Acta, 1992, 37, 269-276.4. Y. M. Wu, W. S. Li, X. M. Long, F. H. Wu, H. Y. Chen, J. H. Yan and C. R. Zhang, J. Power Sources,
2005, 144, 338-345.5. E. Herrero, J. M. Feliu and A. Aldaz, J. Electroanal. Chem., 1994, 368, 101-108.6. E. Herrero, A. Fernandezvega, J. M. Feliu and A. Aldaz, J. Electroanal. Chem., 1993, 350, 73-88.7. E. Herrero, M. J. Llorca, J. M. Feliu and A. Aldaz, J. Electroanal. Chem., 1995, 383, 145-154.8. E. Herrero, M. J. Llorca, J. M. Feliu and A. Aldaz, J. Electroanal. Chem., 1995, 394, 161-167.9. R. W. Atkinson, S. S. John, O. Dyck, K. A. Unocic, R. R. Unocic, C. S. Burke, J. W. Cisco, C. A. Rice,
T. A. Zawodzinski and A. B. Papandrew, Acs Catalysis, 2015, 5, 5154-5163.10. X. F. Yang, T. Liu, C. Xu, H. Z. Zhang, X. F. Li and H. M. Zhang, Journal of Energy Chemistry, 2017,
26, 1-7.11. B. Li, M. Gu, Z. M. Nie, Y. Y. Shao, Q. T. Luo, X. L. Wei, X. L. Li, J. Xiao, C. M. Wang, V. Sprenlde
and W. Wang, Nano Lett., 2013, 13, 1330-1335.12. K. Y. Niu, H. G. Liao and H. M. Zheng, Microsc. Microanal., 2014, 20, 416-424.13. F. Xia, X. Xu, X. Li, L. Zhang, L. Zhang, H. Qiu, W. Wang, Y. Liu and J. Gao, Ind. Eng. Chem. Res.,
2014, 53, 10576-10582.14. M. Yarema, M. V. Kovalenko, G. n. Hesser, D. V. Talapin and W. Heiss, J. Am. Chem. Soc., 2010,
132, 15158-15159.15. M. V. Kovalenko, B. Spokoyny, J. S. Lee, M. Scheele, A. Weber, S. Perera, D. Landry and D. V.
Talapin, J. Am. Chem. Soc., 2010, 132, 6686-6695.16. F. Wang, R. Tang, H. Yu, P. C. Gibbons and W. E. Buhro, Chem. Mater., 2008, 20, 3656-3662.17. T. Som, A. Simo, R. Fenger, G. V. Troppenz, R. Bansen, N. Pfander, F. Emmerling, J. Rappich, T.
Boeck and K. Rademann, ChemPhysChem, 2012, 13, 2162-2169.18. S. St. John, S. Ravindren, Z. Nan, K. Gunasekera, P. Boolchand and A. P. Angelopoulos, Appl. Surf.
Sci., 2018, 448, 362-368.19. S. St John, I. Dutta and A. P. Angelopoulos, J. Phys. Chem. C, 2010, 114, 13515-13525.20. H. W. Kirby, G. Nelson and J. Payne, Ind. Eng. Chem., 1956, 48, 1949-1950.21. S. St. John, I. Dutta and A. P. Angelopoulos, Langmuir, 2011, 27, 5781-5791.22. E. Agar, C. R. Dennison, K. W. Knehr and E. C. Kumbur, J. Power Sources, 2013, 225, 89-94.23. C. N. Sun, F. M. Delnick, L. Baggetto, G. M. Veith and T. A. Zawodzinski, J. Power Sources, 2014,
248, 560-564.24. M. Skyllas-Kazacos and L. Goh, J. Membr. Sci., 2012, 399, 43-48.25. A. Tang, J. Bao and M. Skyllas-Kazacos, J. Power Sources, 2011, 196, 10737-10747.26. R. L. Cohen and K. W. West, J. Electrochem. Soc., 1972, 119, 433-438.27. F. Wang, M. Alazemi, I. Dutta, R. H. Blunk and A. P. Angelopoulos, J. Power Sources, 2010, 195,
7054-7060.28. M. Alazemi, I. Dutta, F. Wang, R. H. Blunk and A. P. Angelopoulos, Adv. Funct. Mater., 2009, 19,
1118-1129.29. M. Alazemi, I. Dutta, F. Wang, R. H. Blunk and A. P. Angelopoulos, Carbon, 2010, 48, 4063-4073.30. A. P. Angelopoulos, J. B. Benziger and S. P. Wesson, J. Colloid Interface Sci., 1997, 185, 147-156.31. J. Solla-Gullón, P. Rodriguez, E. Herrero, A. Aldaz and J. Feliu, Phys. Chem. Chem. Phys., 2008, 10,
1359-1373.32. P. P. Lopes, D. Strmcnik, D. Tripkovic, J. G. Connell, V. Stamenkovic and N. M. Markovic, Acs
Catalysis, 2016, 6, 2536-2544.
Page 22 of 24Journal of Materials Chemistry A

33. J. M. Noel, Y. Yu and M. V. Mirkin, Langmuir, 2013, 29, 1346-1350.34. J. Y. Fang, K. L. Stokes, J. Wiemann and W. L. Zhou, Mater. Lett., 2000, 42, 113-120.35. Y. B. Zhao, Z. J. Zhang and H. X. Dang, Mater. Lett., 2004, 58, 790-793.36. F. Wang, S. Peters, J. Guzda, R. H. Blunk and A. P. Angelopoulos, Langmuir, 2009, 25, 4384-4392.37. Z. Gonzalez, C. Botas, P. Alvarez, S. Roldan, C. Blanco, R. Santamaria, M. Granda and R.
Menendez, Carbon, 2012, 50, 828-834.38. Z. Gonzalez, C. Botas, C. Blanco, R. Santamaria, M. Granda, P. Alvarez and R. Menendez, Nano
Energy, 2013, 2, 1322-1328.39. A. Sankar, I. Michos, I. Dutta, J. Dong and A. Angelopoulos, J. Power Sources, 2018, 387, 91-100.40. W. Y. Li, J. G. Liu and C. W. Yan, Carbon, 2013, 55, 313-320.41. A. Krolicka and A. Bobrowski, Electrochem. Commun., 2004, 6, 99-104.42. J. Wang, J. M. Lu, S. B. Hocevar, P. A. M. Farias and B. Ogorevc, Anal. Chem., 2000, 72, 3218-
3222.43. A. Economou, Trac-Trends in Analytical Chemistry, 2005, 24, 334-340.44. A. Economou, Sensors, 2018, 18, 1032.45. J. Clavilier, J. Feliu and A. Aldaz, J. Electroanal. Chem., 1988, 243, 419-433.46. S. St. John, D. Lee, I. Dutta and A. P. Angelopoulos, J. Electrochem. Soc., 2010, 157, B1245-B1250.47. S. St. John, Z. Nan, N. Hu, D. W. Schaefer and A. P. Angelopoulos, J. Mater. Chem. A, 2013, 1,
8903-8916.48. A. Bard and L. Faulkner, Electrochemical methods: fundamentals and applications, Wiley, New
York, NY, 2006.49. A. Bourke, M. A. Miller, R. P. Lynch, X. Gao, J. Landon, J. S. Wainright, R. F. Savinell and D. N.
Buckley, J. Electrochem. Soc., 2016, 163, A5097-A5105.50. D. J. Suarez, Z. Gonzalez, C. Blanco, M. Granda, R. Menendez and R. Santamaria, Chemsuschem,
2014, 7, 914-918.
Page 23 of 24 Journal of Materials Chemistry A

Tabe of Contents Graphic
Page 24 of 24Journal of Materials Chemistry A


![S N¬ h SN¤ 13S÷~¿bi ýcÐSG]åz s¯X qTÍb¥TJNf 环境影响报告书 · S N¬ h SN¤ 13S÷~¿bi ýcÐSG]åz s¯X _qTÍb¥TJNf S N¬ h SN¤ 13S÷~¿bi ýcÐSG]åz s¯X _qTÍb¥TJNf](https://img.dokumen.tips/doc/110x75/5f40f9b3dd36783d75148837/s-n-h-sn-13sbi-csgz-sx-qtbtjnf-cf-s-n.jpg)