Embed Size (px)
Citation preview
Forintek Canada Corp.
Conversi il actors for the For . Products Industry
Western Canada

CONVERSION FACTORS FOR THE FOREST PRODUCTS INDUSTRY IN WESTERN CANADA
by
R.W. NIELSON, J. DOBIE* AND D.M. WRIGHT
FORINTEK CANADA CORP.
Western Laboratory 6620 N.W. Marine Drive Vancouver, B.C. V6T 1 X2
SPECIAL PUBLICATION NO. SP-24R replaces VP-X-97 and Tech. Report No. 1
ISSN 0824-2119
($10.00 charge to non-members)
*Forest Economist, B.C. Forestry and Forest Statistics, Statistics Canada, Vancouver, B.C.
1985

LIST OF ABBREVIATIONS
INTRODUCTION
LOG Official Scaling Rules of Western Canada
British Columbia A 1 berta Saskatchewan Manitoba
Board-Foot Log Rules Based on Imperial Measurements
Stacked Wood Scaling Metric Measure Cord Measure
Scaling
WOOD DENSITY
BARK
Basic Density
Specific Gravity
Moisture Contents Oven-dry basis Original-weight basis
Sapwood Thickness
Green Density
Bark Thickness
Bark Volumes
Bark Coverage
Bark Density
SAWHILLING Lumber Sizes
Lumber Volumes
Linea 1 Neasure
Lumber Packaging
CONTENTS
Page
ix
1
1 1 1 3 3 3
5
5 5 5
10
13 13
13
13 13 13
18
18
21 21
21
25
25
29 29
29
29
29
iii

SAWMILLING/Contd. Lumber Shrinkage
Lumber Weights Estimating Green Lumber Weight Estimating Dry Lumber Weight
Lumber Yields Metric LRF Imperial LRF
Residue Yields Sawdust Pulp Chips Planer Shavings Hog Fuel
Chips and Residues--Units of Measure Volumetric Unit Bone-Dry Unit Conversion Between Chip Units
VENEER AND PLYWOOD Product Yields in Veneer Nanufacture
Product Yields in Plywood Manufacture
Plywood Dimensions, Conversion Ratios and Surface Coverage
COMPOSITION BOARD
PULP
Board Types Fibrous-Felted Board Particleboard
Green Wood Requirements Imperial Equation Metric Equation
Panel Volume Measures
Pulp Yields from Western Species
Green Wood Requirements per Ton (Tonne) of Pulp
SHINGLES AND SHAKES Shingle and Shake Sizes and Units of Measure
Shingle, Shake, and Residue Yields
iv
Page
36
36 36 36
38 38 41
41 41 41 46 46
46 46 48 48
49 49
49
49
55 55 55 55
56 56 56
56
61 61
61
67 67
67

ENERGY Higher Heating Values of Wood and Bark
Burning Efficiency and Moisture Content
Heating Values for Fossil Fuels
Available Heat in Hog Fuel
MISCELLANEOUS
REFERENCES
LIST OF TABLES
Table 1 Metric Scaling Rule Formulas
Page
75 75
75
75
75
81
89
2
Table 2 Five Metre Log Volumes For Official Rules of Western Canada 4
Table 3 Board Foot Log Scale Formulas 6
Table 4 Board Foot Volumes for 16-Foot Logs with Taper of 1 Inch in 8 Lineal Feet 7
Table 5 Board-Foot Volumes for 32-Foot Logs with Taper of 1 Inch in 8 Lineal Feet 8
Table 6 Solid Content of Stacked Wood (Bark Included) 9
Table 7 Volume to Mass Ratio Determinations 11
Table 8 Basic Density of Wood 14
Table 9 Specific Gravity 15
Table 10 Moisture Content Comparison 16
Table 11 Average Green Moisture Contents, (Oven-dry Basis) 17
Table 12 Sapwood Statistics 19
Table 13 Average Green Densities 20
Table 14 Regression of Double-Bark Thickness (DBT) on Diameter Outside Bark (DOB) 22
Table 15 Bark Statistics For Western Tree Species 23
Table 16 Inner and Outer Bark Proportions, Moisture Contents and Densities (Second-Growth Trees) 24
v
Page
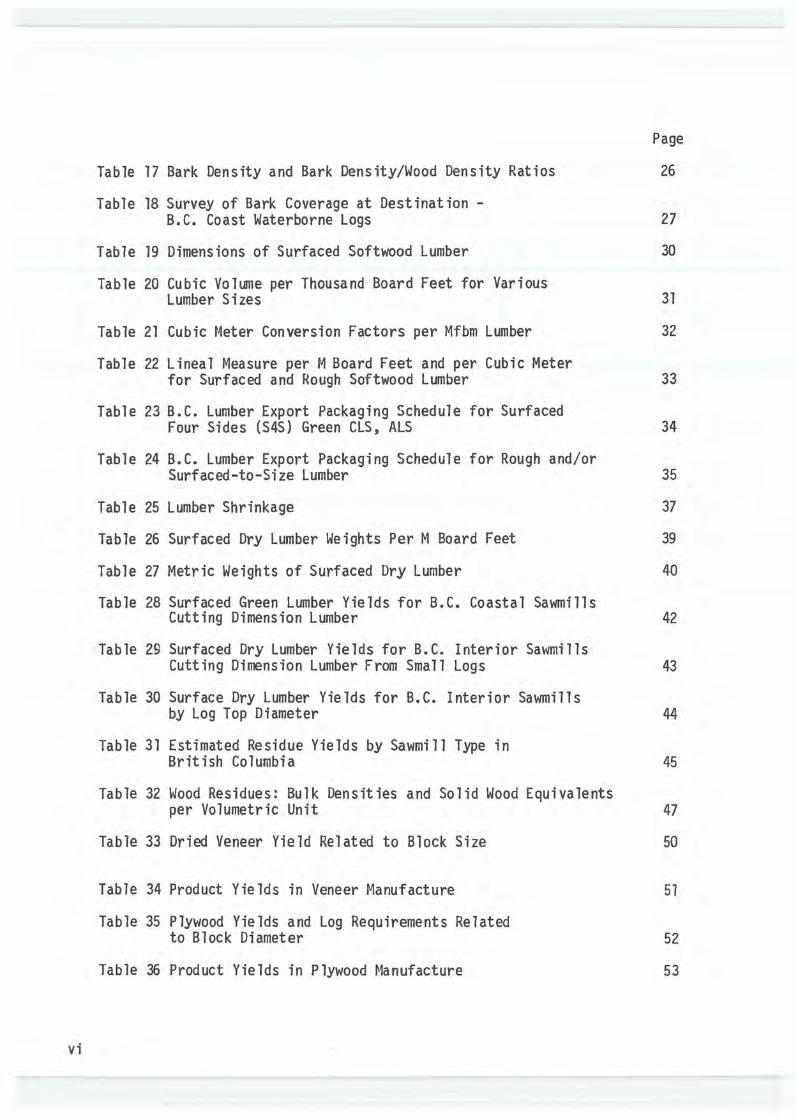
Table 17 Bark Density and Bark Density/Wood Density Ratios 26
Table 18 Survey of Bark Coverage at Destination -B.C. Coast Waterborne Logs 27
Table 19 Dimensions of Surfaced Softwood Lumber 30
Table 20 Cubic Volume per Thousand Board Feet for Various Lumber Sizes 31
Table 21 Cubic t4eter Conversion Factors per Mfbm Lumber 32
Table 22 Lineal Measure perM Board Feet and per Cubic Meter for Surfaced and Rough Softwood Lumber 33
Table 23 B.C. Lumber Export Packaging Schedule for Surfaced Four Sides (S4S} Green CLS, ALS 34
Table 24 B.C. Lumber Export Packaging Schedule for Rough and/or Surfaced-to-Size Lumber 35
Table 25 Lumber Shrinkage 37
Table 26 Surfaced Dry Lumber Weights Per M Board Feet 39
Table 27 Metric Weights of Surfaced Dry Lumber 40
Table 28 Surfaced Green Lumber Yields for B.C. Coastal Sawmills Cutting Dimension Lumber 42
Table 29 Surfaced Dry Lumber Yields for B.C. Interior Sawmills Cutting Dimension Lumber From Small Logs 43
Table 30 Surface Dry Lumber Yields for B.C. Interior Sawmills by Log Top Diameter 44
Table 31 Estimated Residue Yields by Sawmill TYPe in British Columbia 45
Table 32 Wood Residues: Bulk Densities and Solid Wood Equivalents per Volumetric Unit 47
Table 33 Dried Veneer Yield Related to Block Size 50
Table 34 Product Yields in Veneer Manufacture 51
Table 35 Plywood Yields and Log Requirements Related to Block Diameter 52
Table 36 Product Yields in Plywood Manufacture 53
vi

Page
Table 37 Standard Thicknesses, Conversion Ratios, and Surface Measure for Plywood 54
Table 38 Green Wood Requirement Per M Square Feet of Board Production 57
Table 39 Green Wood Requirement Per Cubic Metre of Board Production 58
Table 40 Board Thicknesses 59
Table 41 Conversion of Various Panel Volume 59
Table 42 Surface t·1easure of Panels Per Ton and Per Metric Tonne 60
Table 43 Unbleached Kraft Pulp Yields 62
Table 44 Green Wood Requirements for Pulp Production 63
Table 45 Volumetric Units of Chips Required for Pulp Production 64
Table 46 Bone-Dry Units of Chips Required for Pulp Production 65
Table 47 Red Cedar Shingle Sizes 68
Table 48 Red Cedar Handsplit Shake Sizes 69
Table 49 Approximate Shingle Coverage (m2/bundle) 70
Table 50 Shakes Coverage (m2/bundle) 71
Table 51 Volume Content and Log Volume Requirements for Red Cedar Shingles 72
Table 52 Volume content and Log Volume Requirements for Red Cedar Shakes 73
Table 53 Higher Heating Values for Wood and Bark 76
Table 54 Higher Heating Values Per Unit Volume 77
Table 55 Effect of sture Content on Recoverable Heat Per lb or kg of Wet Wood 78
Table 56 Energy Content of Conventional Fuels 79
Table 57 Heat Available in Hog Fuel (oven dry) 80
Table 58 Saw Gauges (By Thousands) 82
Table 59 Decimal Equivalents 83
vii
Page
Table 60 t·1etric Prefixes With Exponent Values 84
Table 61 Metric Conversion Factors 85
Table 62 Some Geometric Formulas 86
Table 63 Botanical Names for Some Western Canadian Tree Species 87
viii
LIST OF ABBREVIATIONS
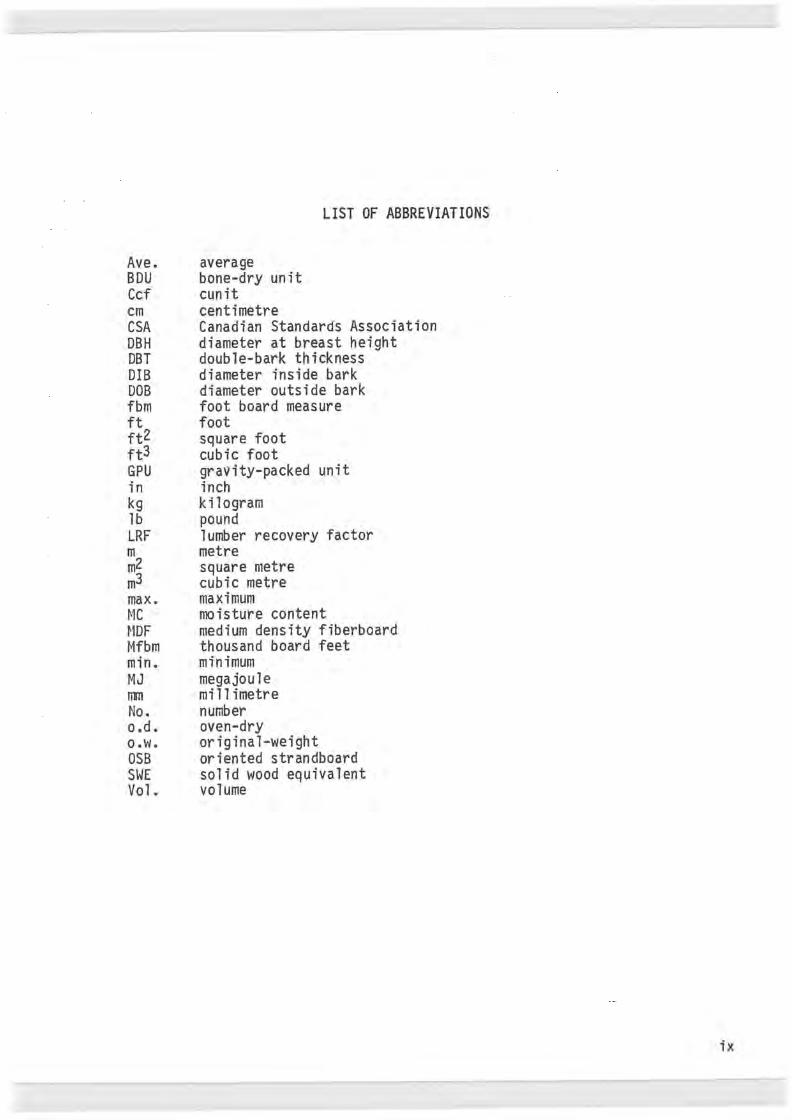
Ave. average BDU bone-dry unit Ccf cunit em centimetre CSA Canadian Standards Association DBH diameter at breast height DBT double-bark thickness DIB diameter inside bark DOB diameter outside bark fbm foot board measure ft foot ft2 square foot ft3 cubic foot GPU gravity-packed unit in inch kg kilogram lb pound LRF lumber recovery factor m metre m2 square metre m3 cubic metre max. maximum
moisture content medium density fiberboard
Mfbm thousand board feet min. minimum MJ megajoule mm millimetre No. number o.d. oven-dry o.w. original-weight OSB oriented strandboard SWE solid wood equivalent Vol. volume
ix

CONVERSION FACTORS
FOR THE FOREST PRODUCTS INDUSTRY
IN WESTERN CANADA
INTRODUCTION This edition of .. Conversion Factors.. rep 1 aces earlier versions first
pub 1 i shed by the Western Forest Products Laboratory of the Canadian Forestry Service in 1972 as· Information Report VP-X-97, and later revised in 1975, and Metric Conversion Factors for Forest Products in Western Canada, Technical Report No. 1 published by Forintek Canada Corp. in 1979. This new edition updates the in format ion previously presented, and includes both metric and imperial units. The official adoption of metric log scaling practices in Canada has made substantial changes necessary to the section on Log Volume Factors. It has also led to the use of mixed metric/imperial conversion factors in industry sectors which sell products in imperial measure.
In many cases, the factors presented in this report are either average values or rough estimates, but often this level of accuracy is sufficient for the purpose at hand.
Where precise estimates are critical in decision making, it is suggested that appropriate factors be derived from in-depth analysis of the relevant cond it 1 ons.
LOG VOLUME OFFICIAL SCALING RULES OF WESTERN CANADA
In 1970, the federal government released its white paper on metric conversion in Canada. The change-over to the use of the metric system for log volume measurement is now essentially complete. Nationally, the official guide to metric log scaling is the CSA National Standard of Canada on 11Scaling Roundwood 11
• While provincial scaling rules all employ the Smalian formula for log volume estimates as specified by the above standard, minor variations in application can result in differences in volumes estimated. The formulas for metric scaling rules in western Canada are shown in Table 1. Some differences between these rules and their application are noted below. For a thorough appreciation of these, the reader is referred directly to the respective scaling manuals.
British Columbia In British Columbia the radius, not the diameter, is used to measure logs,
and scale sticks are designed so that the radius is read when measuring across the end diameter.
1
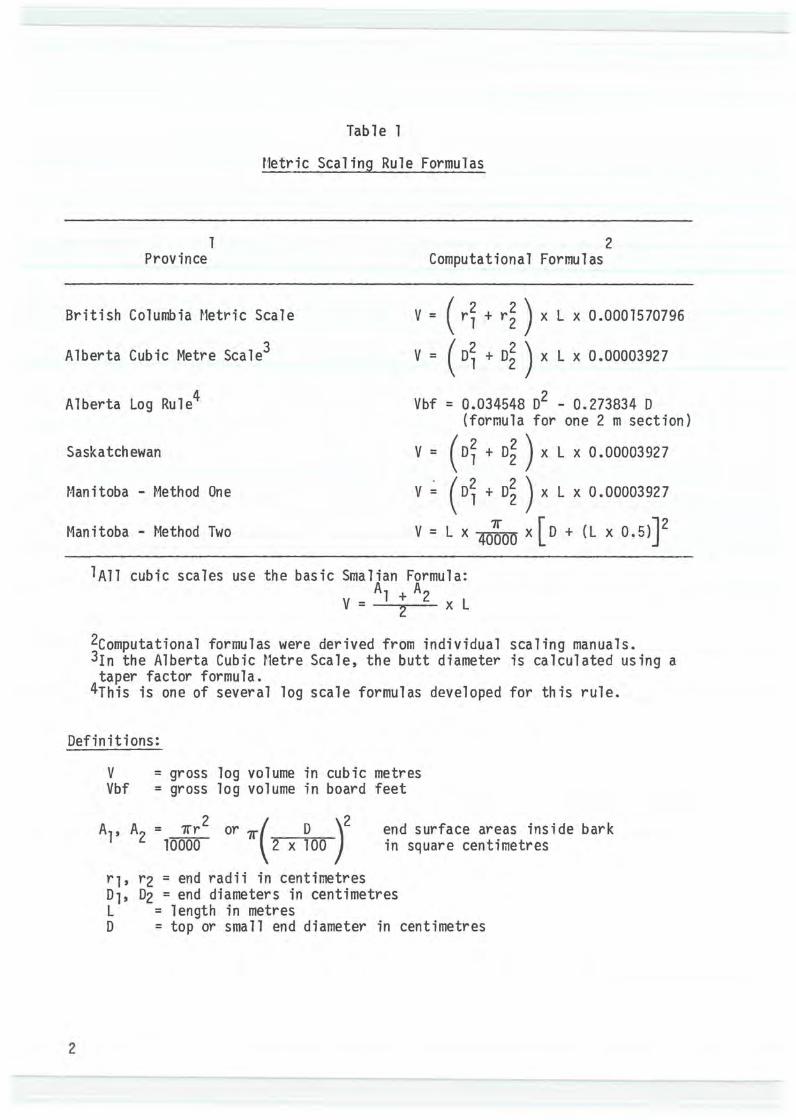
Table 1
f1etric Sealing Rule Formulas
1 Province
British Columbia Hetric Scale
Alberta Cubic Metre Scale3
Alberta Log Rule4
2 Computational Formulas
V = ( + ) X L X 0.0001570796
V = ( + ) x L x 0.00003927
Vbf = 0.034548 o2 - 0.273834 D (formula for one 2 m section)
Saskatchewan V = ( + ) X L X 0.00003927
t·1anitoba - One V = + XL X 0.00003927
t1an i toba - t1ethod Two V = L X X [ D + ( L x 0 • 5) J 2
1A11 cubic scales use the basic Smalian Formula: Al + A2
V = 2 x L
2computational formulas were derived from individual scaling manuals. 3In the Alberta Cubic ttetre Scale, the butt diameter is calculated using a taper factor formula.
4This is one of several log scale formulas developed for this rule.
Definitions:
2
V = gross log volume in cubic metres Vbf = gross log volume in board feet
A , A = '1T'r or 7r D 2 ( )2 1 2 10000 2 X lOO
r1, r2 = end radii in centimetres
end surface areas inside bark in square centimetres
01, D2 = end diameters in centimetres L = length in metres D = top or small end diameter in centimetres
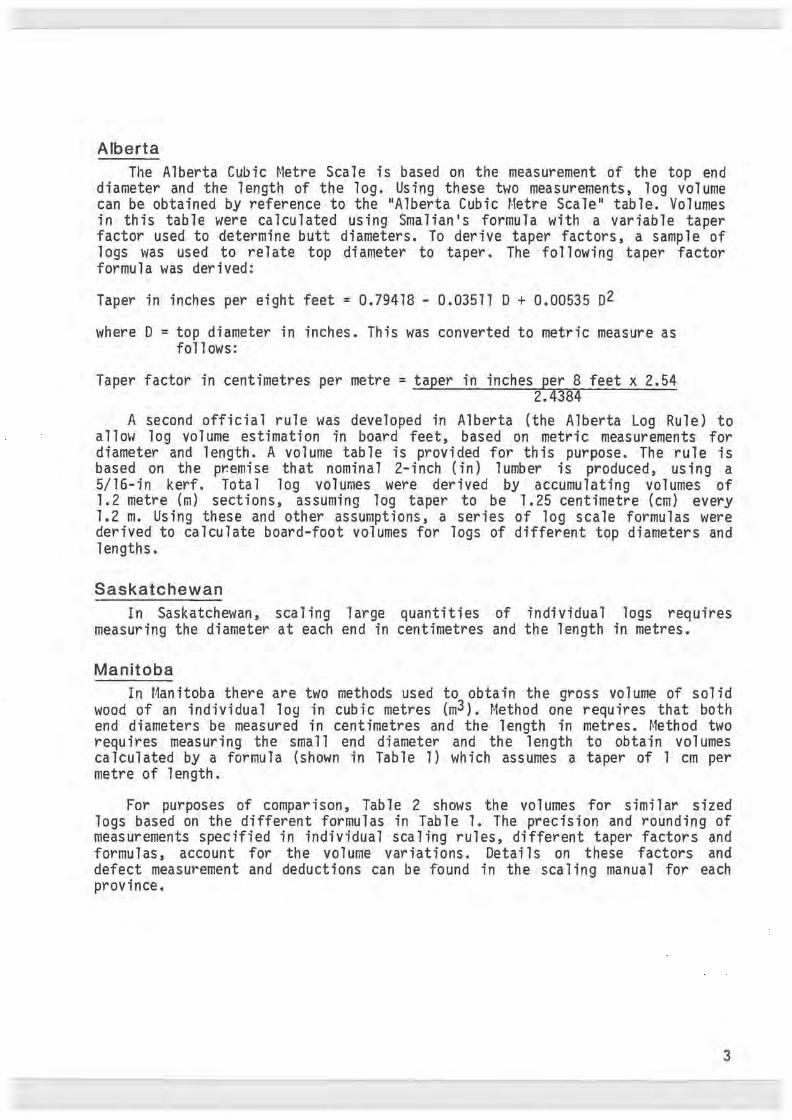
Alberta The Alberta Cubic Scale is based on the measurement of the top end
diameter and the length of the log. Using these two measurements, log volume can be obtained by reference to the "Alberta Cubic Metre Scale" table. Volumes in this table were calculated using Smalian's formula with a variable taper factor used to determine butt diameters. To derive taper factors, a sample of logs was used to relate top diameter to taper. The following taper factor formula was derived:
Taper in inches per eight feet = 0.79418- 0.03511 D + 0.00535 o2
where D =top diameter in inches. This was converted to metric measure as follows:
Taper factor in centimetres per metre = taper in inches per 8 feet x 2.54 2.4384
A second official rule was developed in Alberta (the Alberta Log Rule) to allm1 log volume estimation in board feet, based on metric measurements for diameter and length. A volume table is provided for this purpose. The rule is based on the premise that nominal 2-inch (in) lumber is produced, using a 5/16-in kerf. Total log volumes were derived by accumulating volumes of 1.2 metre (m) sections, assuming log taper to be 1.25 centimetre (em) every 1.2 m. Using these and other assumptions, a series of log scale formulas were derived to calculate board-foot volumes for logs of different top diameters and lengths.
Saskatchewan In Saskatchewan, scaling large quantities of individual logs requires
measuring the diameter at each end in centimetres and the length in metres.
Manitoba In Manitoba there are two methods used to obtain the gross volume of solid
wood of an individual log in cubic metres (m3). t1ethod one requires that both end diameters be measured in centimetres and the length in metres. Hethod two requires measuring the small end diameter and the length to obtain volumes calculated by a formula (shown in Table 1) which assumes a taper of 1 em per metre of length.
For purposes of comparison, Table 2 shows the volumes for similar sized logs based on the different formulas in Table 1. The precision and rounding of measurements specified in individual scaling rules, different taper factors and formulas, account for the volume variations. Details on these factors and defect measurement and deductions can be found in the sea 1 ing manu a 1 for each province.
3
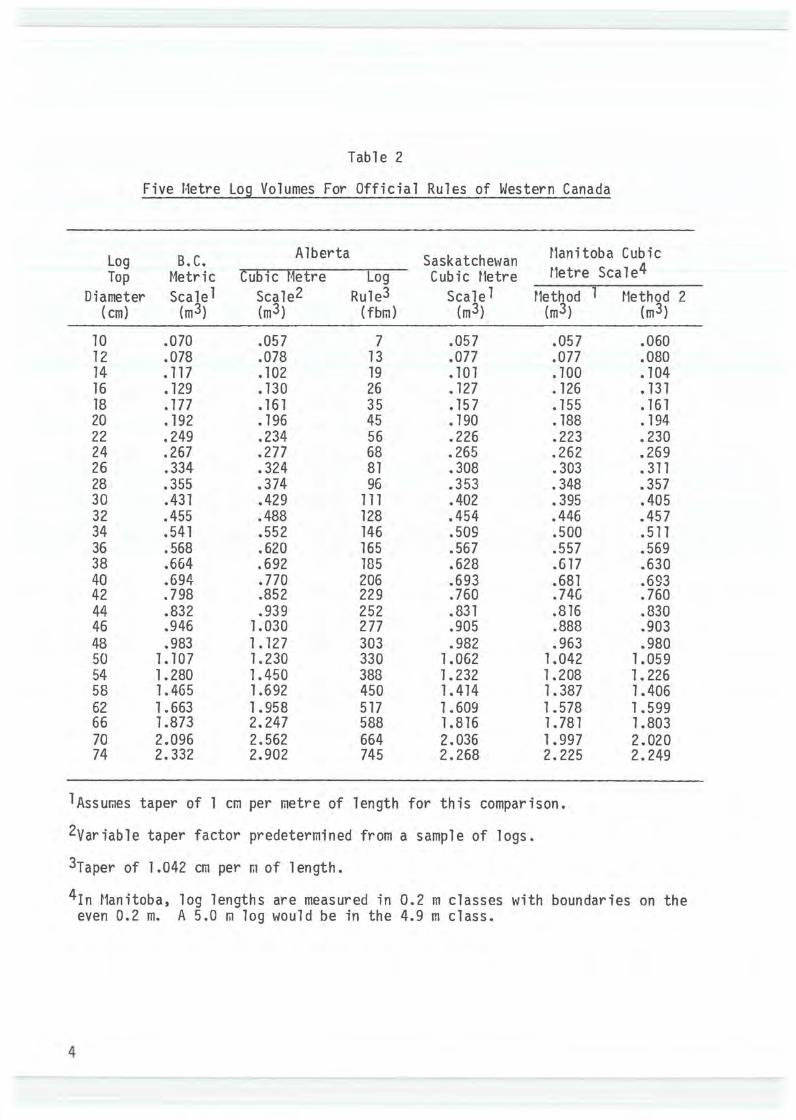
Table 2
Five 1·1etre Log Volumes For Official Rules of Western Canada
Log B. C. Alberta Saskatche\'/an t1anitoba Cubic Top i c Cubic Hetre Log Cubic tletre t1etre Sea 1 e4
Diameter Scalel Scale2 Rule3 Scalel t1ethod 1 t1ethod 2 (em) (m3) (m3) (fbm) (m3) (rn3) (m3)
10 .070 .057 7 .057 .057 .060 12 .078 .078 13 .077 .077 .080 14 • 117 .102 19 • 101 .100 .104 16 • 129 • 130 26 • 127 • 126 • 131 18 .177 . 161 35 • 15 7 .155 .161 20 • 192 • 196 45 • 190 . 188 • 194 22 .249 .234 56 .226 .223 .230 24 .267 .277 68 • 265 .262 .269 26 .334 .324 81 .308 .303 • 311 28 .355 .374 96 .353 . 348 .357 30 .431 .429 111 .402 • 395 .405 32 .455 .488 128 .454 .446 .457 34 .541 .552 146 .509 .500 .511 36 .568 • 620 165 .567 .557 .569 38 .664 .692 185 .628 .617 .630 40 .694 .770 206 .693 .681 .693 42 .798 .852 229 .760 .74C .760 44 .832 .939 252 .831 .816 .830 46 .946 1.030 277 .905 .888 .903 48 .983 1.127 303 .982 .963 .980 50 1.107 1.230 330 1.062 1.042 1.059 54 1. 280 1.450 388 1. 232 1.208 1. 226 58 1. 465 1.692 450 1. 414 1.387 1.406 62 1 .663 1. 958 517 1 .609 1.578 1.599 66 1.873 2.247 588 1.816 1. 781 1.803 70 2.096 2.562 664 2.036 1. 997 2.020 74 2.332 2.902 745 2.268 2.225 2.249
lAssumes taper of 1 em per metre of length for this comparison.
2variable taper factor predetermined from a sample of logs.
3Taper of 1 .042 em per r.1 of 1 ength.
4rn t1anitoba, log lengths are measured in 0.2 m classes with boundaries on the even 0.2 m. A 5.0 m log would be in the 4.9 m class.
4

BOARD-FOOT LOG RULES BASED ON IMPERIAL MEASUREMENTS
Although no longer of fie ia lly used, formulas for board-foot log-sea 1 ing rules of western Canada are given in Table 3 for reference purposes.
The B.C. Board-Foot Rule is no longer in official use, but is still used by industry for log trading on the B.C. Coast.
The Brereton Log Rule is sometimes used in the log export trade. This rule does not allow for waste in slabs and kerfs, whereas the other board-foot rules do. It converts cubic volume, calculated using the mean of the two end diameters, to board feet by multiplying by 12.
The International 5/16-in and 1/4-in Rules were commonly used in the Prairie provinces until recently, and are still in use in parts of the U.S.A.
The Scribner Log Rule is the offici a 1 rule in many parts of the United States, including the Pacific Northwest. It is a diagram rule with volumes rounded to the nearest 10 board feet.
For comparison, log volumes estimated using several board-foot rules for selected log measurements are given in Table 4 for 16-ft logs and Table 5 for 32-ft logs. These log rules are described in detail in the U.S.D.A. Forest Service report "A Collection of Log Rules" (Freese, 1974).
STACKED WOOD SCALING Metric Measure
Hetric measurement of stacked wood is now officially practiced in Canada. Stacks of logs of equal length may be measured either in cubic metres of solid wood or in stacked cubic metres, based on measurements of length, width and height of the stack to the nearest 0.02 metre. An average measure is taken if the stacking is irregular. The volume of the stack in cubic metres is the product of the three measurements.
An average conversion ratio between a cubic metre and a stacked cubic metre is:
1m3 (solid wood)= 1.506 m3 (stacked) 1 m3 (stacked) = 0.664 m3 (solid wood)
As indicated in Table 6, the range around this latter figure can be as much as 0.31 m3 fibre/m3 (stacked), depending on the type or condition of the logs or bolts in the pile.
Cord Measure Cord measure was commonly used in the past to estimate the volume of such
forest products as shingle bolts, fuelwood and pulpwood.
A cord is defined as a volume of wood four feet (ft) high, four ft wide and eight ft long, thus encompassing 128 cubic feet (ft3) of space. The volume of solid wood in a cord depends on the size, shape and length of the logs in the
5

Table 3
Board Foot Log Scale Formulas
Log Rule
British Columbia Board Foot Rule
Brereton
International 5/16 Inch Log Rulel
International 1/4 Inch Log Rule2
lFormerly used in Alberta.
2Formerly used in Saskatchewan and Manitoba.
Definitions:
6
V = volume in board feet d = small-end diameter inside bark in inches L = length in feet D = mean of end diameters in inches
Formulas
V = 0.0476 (d-1.5)2 XL
V = 0.06545 (D2L)
v = 0.864 (0.22 d2 - 0.71 d) (for 4-foot sections)
v = 0.905 (0.22 d2 - 0.71 d) (for 4-foot sections)
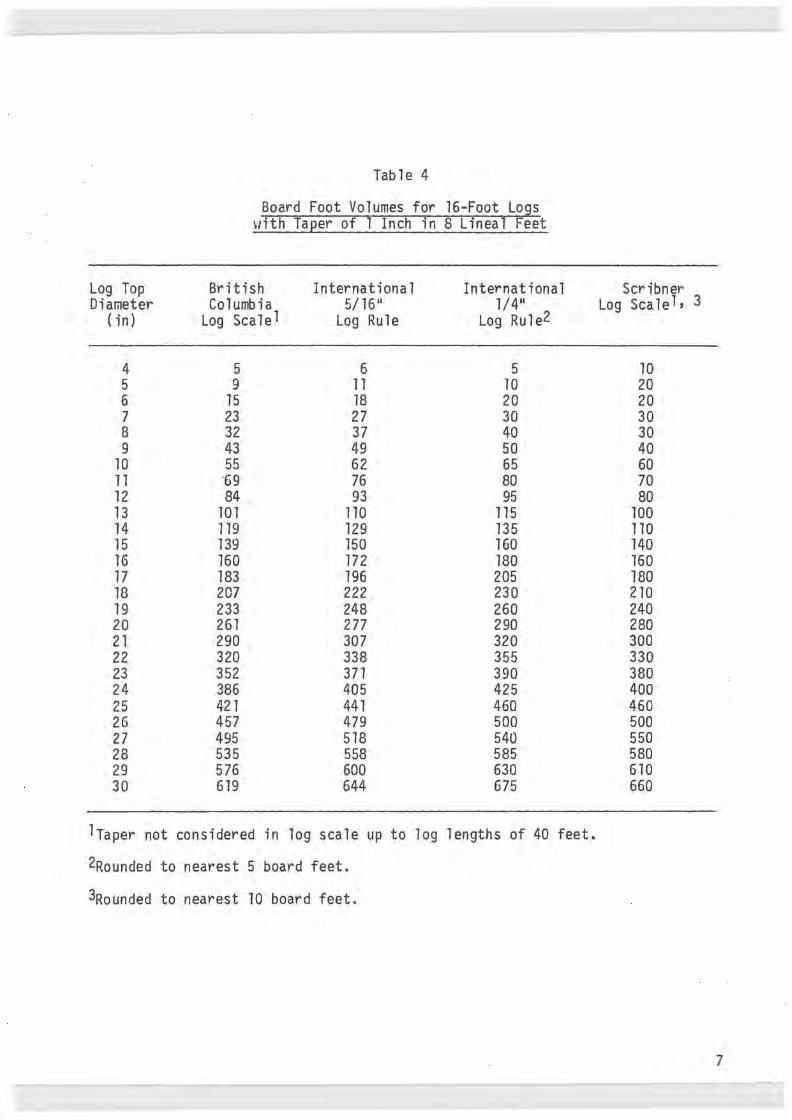
Table 4
Board Foot Volumes for 16-Foot Logs with Taper of 1 Inch in 8 Lineal Feet
Log Top British International International Diameter Columbia 5/16 11 1/411
(in) Log Scalel Log Rule Log Rule2
4 5 6 5 5 9 11 10 6 15 18 20 7 23 27 30 8 32 37 40 9 43 49 50
10 55 62 65 11 "69 76 80 12 84 93 95 13 101 110 115 14 119 129 135 15 139 150 160 16 160 172 180 17 183 196 205 18 207 222 230 19 233 248 260 20 261 277 290 21 290 307 320 22 320 338 355 23 352 371 390 24 386 405 425 25 421 441 460 26 457 479 500 27 495 518 540 28 535 558 585 29 576 600 630 30 619 644 675
lTaper not considered in log scale up to log lengths of 40 feet.
2Rounded to nearest 5 board feet.
3Rounded to nearest 10 board feet.
Scribner Log Scalel, 3
10 20 20 30 30 40 60 70 80
100 110 140 160 180 210 240 280 300 330 380 400 460 500 550 580 610 660
7

Log Top Diameter
(in)
4 5 6 7 8 9
10 11 12 13 14 15 16 17 18 19 20 21 22 23 24 25 26 27 28 29 30
Table 5
Board-Foot Volumes for 32-Foot Logs with Taper of 1 Inch in 8 Lineal Feet
British International International Columbia 5/16" 1/4''
Log Scale 1 Log Rule Log Rule2
10 24 25 19 38 40 31 55 60 46 76 80 64 99 105 86 125 130
110 155 160 137 186 195 168 222 230 201 260 275 238 301 315 278 346 365 320 394 410 366 444 465 415 499 520 466 555 580 521 615 645 579 678 710 640 743 780 704 812 850 771 884 925 841 959 1000 914 1037 1085 990 1118 1170
1070 1202 1260 1152 1289 1350 1237 1379 1445
Scribner Log Sea 1 e 1' 3
20 30 50 60 70 90
120 140 160 190 230 280 320 370 430 480 560 610 670 750 810 920
1000 1100 1160 1220 1310
lLogs scaled as two 16-foot logs, taking the mid-diameter of the log as the top diameter of the butt section.
2Rounded to nearest 5 board feet.
3Rounded to nearest 10 board feet.
8
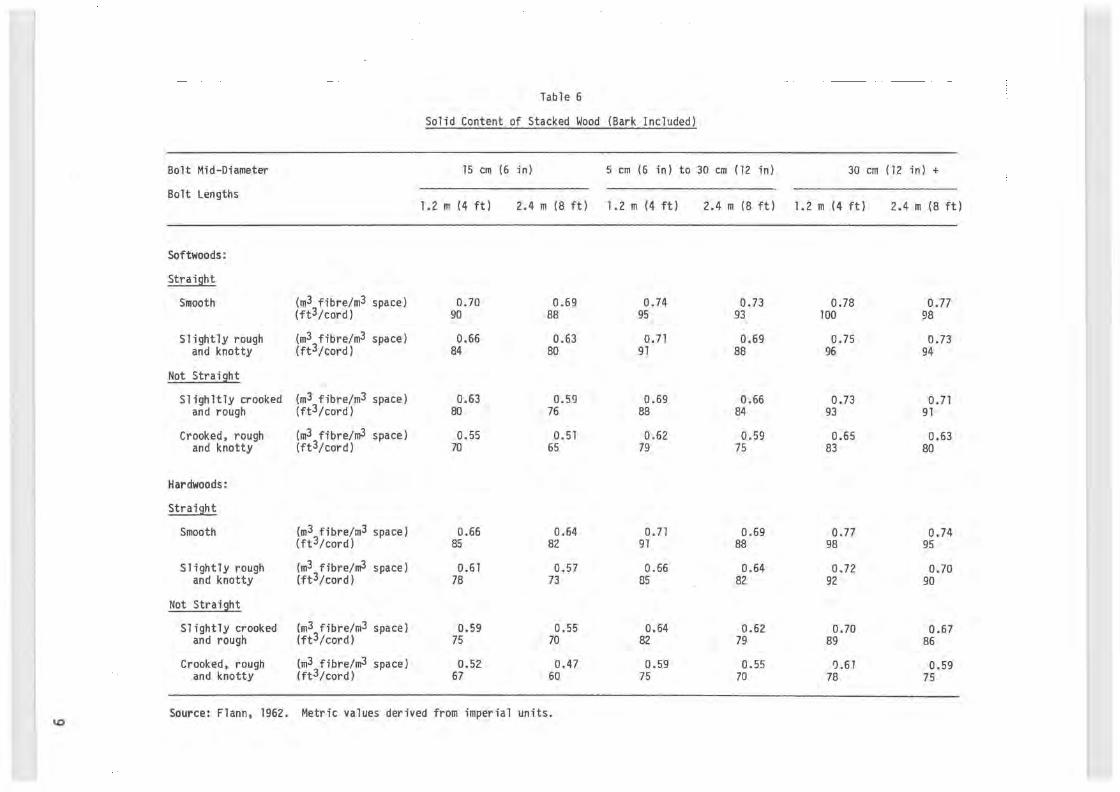
Table 6
Solid Content of Stacked Wood (Bark Included)
Bolt Mid-Diameter 15 em (6 in) 5 em (6 in) to 30 em (12 in) 30 em (12 in) +
Bolt Lengths 1.2 m (4 ft) 2.4 m (8 ft) 1.2 m (4 ft) 2.4 m (8 ft) 1.2 m (4 ft) 2.4 m (8 ft)
Softwoods:
Smooth (m3 fibre/m3 space) 0.70 0.69 0.74 0.73 0.78 0.77 (ft3/cord) 90 88 95 93 100 98
Slightly rough (m3 fibre/m3 space) 0.66 0.63 0.71 0.69 0.75 0.73 and knotty (ft3/cord) 84 80 91 88 96 94
Not
Slighltly crooked (m3 fibre/m3 space) 0.63 0.59 0.69 0.66 0.73 0.71 and rough (ft3/cord) 80 76 88 84 93 91
Crooked, rough (m3 fibre/m3 space) 0.55 0.51 0.62 0.59 0.65 0.63 and knotty (ft3/cord) 70 65 79 75 83 80
Hardwoods:
Smooth (m3 fibre/m3 space) 0.66 0.64 0.71 0.69 0.77 0.74 (ft3/cord) 85 82 91 88 98 95
Slightly rough (m3 fibre/m3 space) 0.61 0.57 0.66 0.64 0.72 0.70 and knotty (ft3/cord) 78 73 85 82 92 90
Not
Slightly crooked (m3 fibre/m3 space) 0.59 0.55 0.64 0.62 0.70 0.67 and rough (ft3/cord) 75 70 82 79 89 86
Crooked, rough (m3 fibre/m3 space) 0.52 0.47 0.59 0.55 IJ.61 0.59 and knotty (ft3/cord) 67 60 75 70 78 75
Source: Flann, 1962. Metric values derived from imperial units. 1.0

pile and the bark content. An average conversion ratio commonly used is 85 ft3 per cord but, as indicated in Table 6, the range around this figure can be as much as 40 ft3, depending on the condition of the logs or bolts in the pile.
Guernsey (1959) indicated the effect of length on the cubic volume of solid wood per cord to be as follows:
Length of logs
8 ft 16 ft 24 ft 32 ft
Cubic feet per cord
88 84 80 76
Conversion factors used by Statistics Canada to convert between cords and cubic metres are:
1 cord (peeled) 1 cord (unpeeled)
= 2.69 m3 or 85 ft3, = 2.4069 m3 or 95 ft3.
MASS SCALING
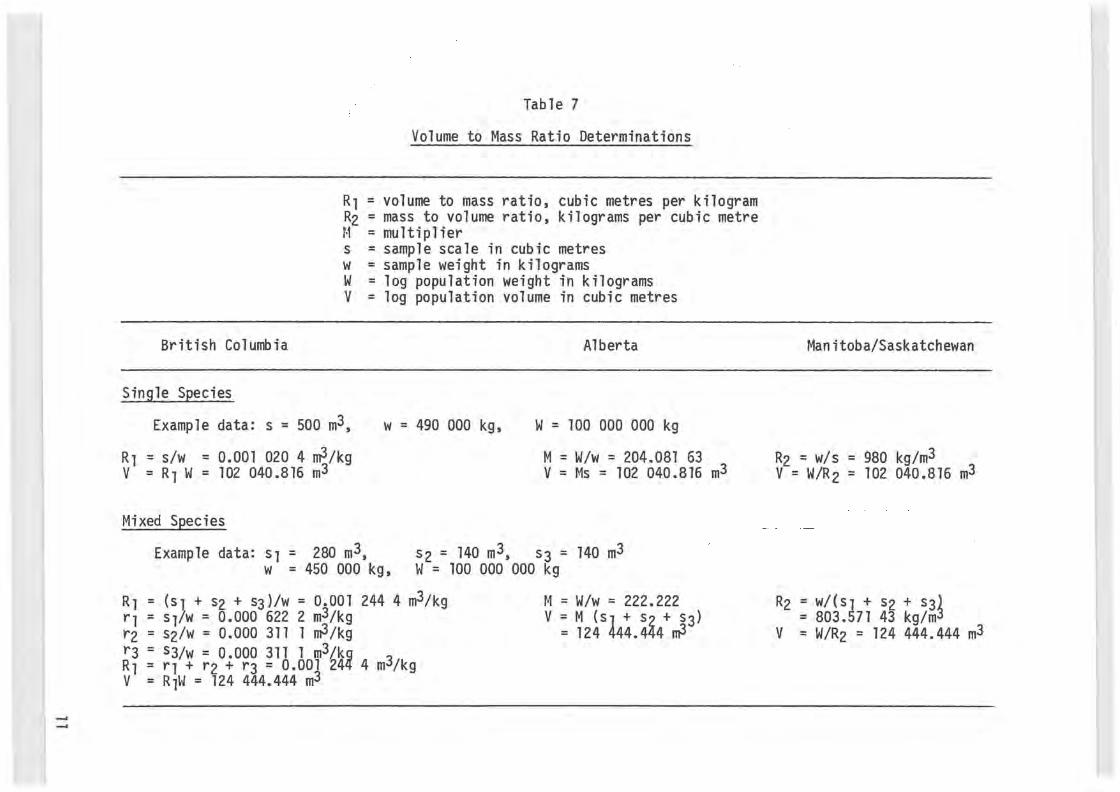
A third method of estimating volumes is weight scaling all truck loads of logs. By manually scaling random samples of loads, ratios may then be calculated from which to estimate the total log volume. In B.C., a volume-to-mass ratio is determined and multiplied by the total mass. In Hanitoba and Saskatche\1an, the total mass is divided by a mass-to-volume ratio. In Alberta, a ratio of total mass to sample mass is first obtained, and multiplied by the sample volume. Ratios vary with species, site, stand age, log size, season of year, bark coverage and other factors, so averages are periodically adjusted.
Loads of logs transported from forest to mill are commonly of mixed species, each with a different volume-to-mass or mass-to-volume ratio. The assumption is made that the different species volume percentages in the total sample volume will be represented in the total log population. Species composition is therefore determined on a volumetric basis, not on the basis of its mass. An example of how total volumes are estimated for single and mixed species is shown in Table 7.
10
_. _,
Table 7
Volume to Mass Ratio Determinations
R1 = volume to mass ratio, cubic metres per kilogram R2 = mass to volume ratio, kilograms per cubic metre M = multiplier s = sample scale in cubic metres w = sample weight in kilograms W = log population weight in kilograms V = log population volume in cubic metres
British Columbia
Single Species
Example data: s = 500 m3,
R1 = s/w = 0.001 020 4 m3/kg V = R1 W = 102 040.816 m3
Mixed Species
w = 490 000 kg,
Alberta
w = 100 000 000 kg
M = W/w = 204.081 63 V = Ms = 102 040.816 m3
Example data: s1 = 280 m3, w = 450 000 kg,
s2 = 140 m3, s3 = 140 m3 w = 100 000 000 kg
R1 = (sl + s2 + s3)/w = 0.001 244 4 m3/kg r1 = s1/w = 0.000 622 2 m3fkg r2 = S2/W = 0.000 311 1 mJ/kg r3 = S3fw = 0.000 311 1 m3fkg R1 = r1 + r2 + r3 = 0.001 244 4 m3/kg V = R1W = 124 444.444 m3
M = W/w = 222.222 V = M (sl + s2 + s3)
= 124 444.444 m3
Manitoba/Saskatchewan
R2 = w/s = 980 kg/m3 V = W/R2 = 102 040.816 m3
R2 = w/(sl + s2 + s3) = 803.571 43 kg/m3 V = W/R2 = 124 444.444 m3

12

WOOD DENSITY BASIC DENSITY
The basic density of a substance is defined as mass per unit volume. Table 8 provides average basic densities of oven dry (o.d.) wood in both pounds per cubic foot and kilograms per cubic metre for western Canadian tree species.
SPECIFIC GRAVITY
The specific gravity of a wood species is defined as the ratio of the species density to the density of water at 4°C. Specific gravities shown in Table 9 are as given by Jessome (1977), or as derived from Smith (1970) on the basis of the densities of Table 8 and a water density of 62.4 pounds per cubic foot.
MOISTURE CONTENTS
The moisture content (MC) of wood is normally expressed in either one of two ways:
Oven-dry Basis The \te i ght of water is expressed as a percentage of the weight of wood
present; i.e. a t·1C of 30 percent means the weight of water present is 30 percent of the weight of wood present.
MC = lOO(wt. water/wt. wood).
Original-weight Basis The weight of water is expressed as a percentage of the total weight
pre sent; i.e. a of 30 percent means that 30 percent of the tota 1 weight present is attributable to water.
MC = lOO(wt. water/total wt.).
The former measure is normally used in the lumber industry and the latter measure in the pulp industry. The former is always more than the latter, as shown in Table 10.
Average green moisture contents for some tree species are given in Table 11. Care should be exercised in using these data since the green moisture content of a species is highly variable.
13

Softwood Species
Cedar, eastern white Cedar, western red3 Cypress, yellow Douglas-fir Fir, alpine3 Fir, amabilis3 F i r , ba 1 sam 1 Hemlock, weste3n3 Larch, western Pine, jack Pine, lodgepole3 Pine, red Pine, western white Pine, ponderosa2, 3 Pine, eastern white Spruce, black Spruce, Engelmann3 Spruce, Sitka Spruce, white3 Tamarack
Table B
Basic Density of Wood
(Volume green, weight oven-dry)
lb/ft3 kg/m3 Hardwood Species
18.66 20.53 26.15 28.08 20.53 23.52 20.90 26.40 28.08 26.27 25.52 24.46 22.15 24.21 22.71 25.33 22.15 21.65 22.46 30.26
299 329 419 450 329 377 335 423 450 421 409 392 355 388 364 406 355 347 360 485
Alder, red Ash, black Ash, green Aspen, trembling Aspen, largetooth Basswood Birch, white Birch, western white Cottonwood, eastern Cottonwood, black4 Elm, white Ironwood Maple, broadleaf t1ap le, Manitoba Oak, bur Poplar, balsam4
23.28 29.20 30.33 23.34 24.34 22.46 31.57 31.70 21.96 21.10 32.70 40.68 29.08 25.96 37.38 21.04
lBalsam fir grows in all provinces except B.C. True firs growing in B.C. are commonly referred to as 11 balsam 11
•
2commonly known as yellow pine in B.C.
Sources:
3smith, 1970.
4Kellogg and Swan, 1983.
Remainder of species: Jessome, 1977.
14
373 468 486 374 390 360 506 508 352 338 524 652 466 416 599 337

Table 9
Specific Gravity
(Volume green, weight oven-dry)
Softwood species Specific gravity Hardwood species Specific gravity
Cedar, eastern white Cedar, western red3 Cypress, yellow Douglas-fir Fir, alpine3 F i r, amab i1 i s 3 Fir, balsaml Hemlock, western3 Larch, western3 Pine, jack Pine, lodgepole3 Pine, red Pine, western white Pine, ponderosa2, 3 Pine, eastern white Spruce, black Spruce, Engelmann3 Spruce, Sitka Spruce, white3 Tamarack
0.299 0.329 0.419 0.450 0.329 0.377 0.335 0.423 0.450 0.421 0.409 0.392 0.355 0.388 0.364 0.406 0.355 0.347 0.360 0.485
Alder, red Ash, black Ash, green Aspen, trembling Aspen, largetooth Basswood Birch, white Birch, western white Cottonwood, eastern Cottonwood, black4 Elm, white Ironwood t4aple, broadleaf Naple, Manitoba Oak, bur Poplar, balsam4
0.373 0.468 0.486 0.374 0.390 0.360 0.506 0.508 0.352 0.338 0.524 0.652 0.466 0.416 0.599 0.337
lBalsam fir grows in all provinces except B.C. True firs growing in B.C. are commonly referred to as "balsam".
2commonly known as yellow pine in B.C.
Sources:
3smi th, 1970.
4Kellogg and Swan, 1983.
Remainder of species: Jessome, 1977.
15
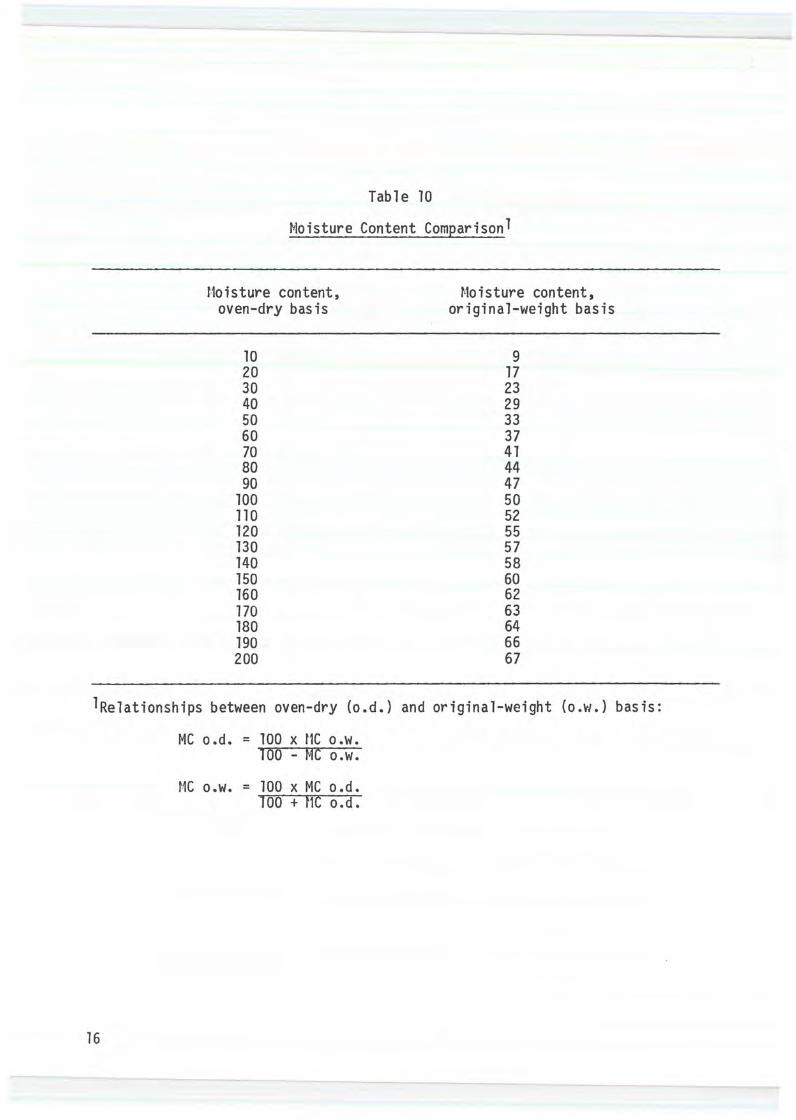
Table 10
Moisture Content Comparisonl
t·1oisture content, oven-dry basis
10 20 30 40 50 60 70 80 90
100 110 120 130 140 150 160 170 180 190 200
content, original-weight basis
9 17 23 29 33 37 41 44 47 50 52 55 57 58 60 62 63 64 66 67
lRelationships between oven-dry (o.d.) and original-weight (o.w.) basis:
16
MC o.d. = 100 x t1C o.w. 100 - MC o.w.
MC o.w. = 100 x MC o.d. 100 + ftc o. d •

Table 11
Average Green Moisture Contents, (Oven-dry Basis)
Species Moisture content Heartwood Sapwood
Cedar, eastern whitel 32 240 Cedar, western red 58 249 Cypress, yellow 32 166 Douglas-fir, coasta12 39 151
interior2 31 132 Fir, alpine 56 153 Fir, amabil i s2 55 164 Fir, balsaml 88 173 Fir, grand 91 136 Hemlock, western2 55 143 Larch, western2 35 119 Pine, jack3 Pine, 38 115 Pine, red 32 134 Pine, western white 62 148 Pine, ponderosa2 40 148 Spruce, b 1 ack2 52 113 Spruce, Engelmann5 Spruce, Sitka 41 142 Spruce, white2 51 163
Alder, red3 Aspen, trembling4 Aspen, largetoothl 95 113 Basswoodl 81 133 Birch, whitel 74 72 Birch, \'/estern white3 Cottonwood, easternl 162 146 Cottonwood1 black2 Elm, white 95 92 Ironwoodl Maple, broadleaf3 Poplar, balsam4
Sources:
lFlann, 1962. 2Information on file, Forintek Canada Corp., Western Laboratory. 3Forest Products Laboratories of Canada, 1956. 4Mackay, 1974. 5smith, 1970.
All other figures from U.S.D.A., For. Serv., Wood Handbook, 1974.
(%) Mixed
93 622 522 45 43 65 69
118
85 49 51 50 -752 76 77 64 432 59
101 90 -
73 72
175
52 71
135
17
SAPWOOD THICKNESS Data presented by Lassen and Okkonen (1969), shown in Table 12, indicate
that, in general, sapwood thickness increases with tree diameter, but the percentage of sapwood decreases with increasing diameter.
Sapwood normally has a greater moisture content than heartwood, so it is usually the case that the green weight (per unit volume) of small logs is greater than that of large logs of the same species.
GREEN DENSITY
Based on the basic densities in Table 8 and mixed moisture contents in Table 11, average green densities for western Canadian species would be as indicated in Table 13.
18

Table 12
Sapwood Statistics
Tree DIB Douglas- Douglas- Western Lodgepole Ponderosa 14estern Engelmann at breast fir, fir, larch pine pine red spruce
height (in) coastal interior cedar
Average SaEwood Thickness (in)
5.0- 9.9 1.27 0.99 0.79 1.62 2.76 0.81 1.14 10.0-14.9 1.72 1. 30 0.89 2.13 4.11 0.96 1. 70 15.0-19.9 1. 96 1.48 0.89 2.60 4.94 1.11 1.93 20.0-24.9 2.05 1.67 0.81 3.32 5.12 1.11 1.97 25.0-29.9 2.13 1. 78 0.79 3.99 5.21 1.18 2.21 30.0-34.9 2.10 1.98 - - 5.63 1.09 2.31 35.0-39.9 2.17 1.79 - - 5.86 1.00 1. 71 40.0-44.9 2.17 1.92 - - 5.66 0.99 45.0-49.9 2.13 - - - 5.29 1.11
Average Sapwood Area as Percentage of Cross-Sectional Area
5.0- 9.9 57 46 38 68 93 39 52 10.0-14.9 48 37 27 57 88 28 47 15.0-19.9 40 31 19 51 81 24 39 20.0-24.9 33 28 14 50 70 19 32 25.0-29.9 29 24 11 50 62 16 30 30.0-34.9 24 23 - - 57 13 26 35.0-39.9 22 18 - - 53 10 17 40.0-44.9 19 17 - - 46 9 45.0-49.9 17 - - - 40 9
Source: Thicknesses from Lassen and Okkonen, 1969. __,

Species
Cedar, eastern white Cedar, western red Cypress, yelloH Douglas-fir, coastal Douglas-fir, interior Fir, alpine Fir, amabilis Fir, balsam Hemlock, western Larch, western Pine, jack Pine, lodgepole Pine, Hh ite Pine, ponderosa Spruce, black Spruce, Engelmann Spruce, Sitka Spruce, white
A 1 der, red Aspen, trembling Birch, white Birch, western Hhite Cottonwood, black Ironwood Maple, broadleaf Poplar, balsam
Table 13
Average Green Densities
lb/ft3
36.0 33.3 39.7 40.7 40.1 33.9 39.7 45.6 48.8 41.8 39.7 38.3 38.8 42.6 44.8 36.3 31.0 35.7
46.8 44.3 54.6 54.5 58.0 61.8 49.7 49.4
Green Density
Source: derived from data in Tables 8 and 11.
20
kgfm3
577 533 637 652 643 543 637 730 782 670 635 613 621 683 718 582 496 572
750 710 875 873 930 990 797 792
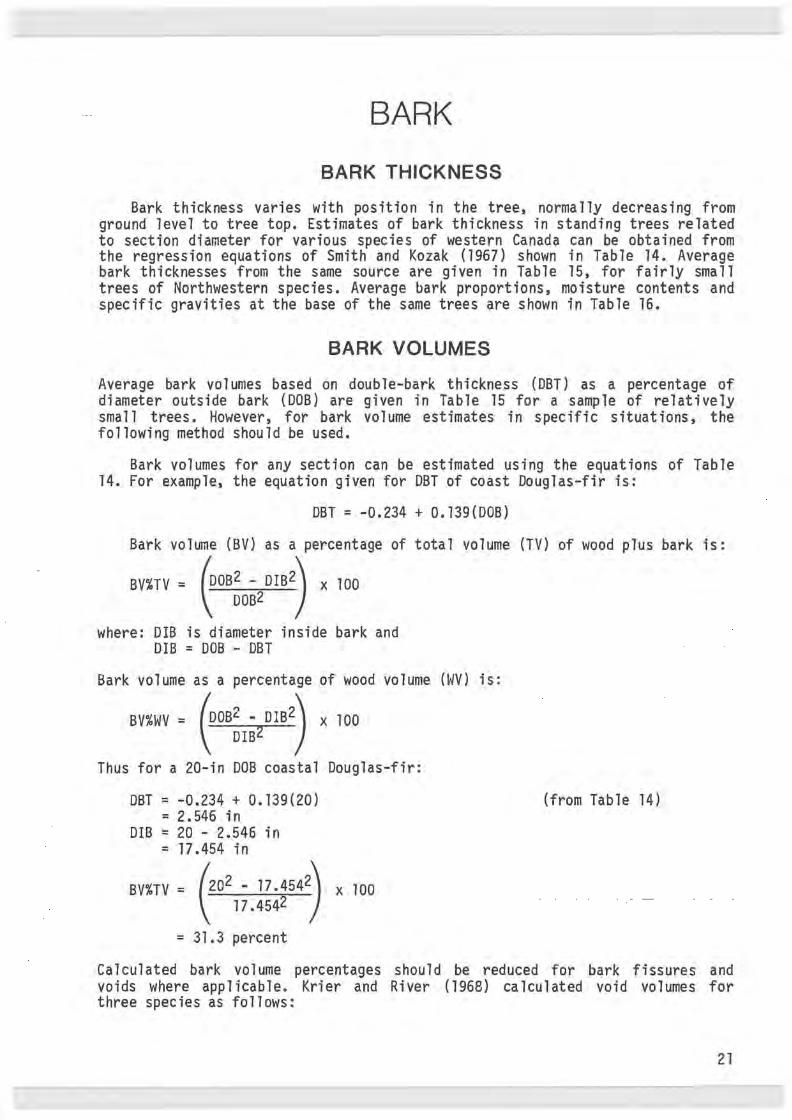
BARK BARK THICKNESS
Bark thickness varies with position in the tree, normally decreasing from ground level to tree top. Estimates of bark thickness in standing trees related to section diameter for various species of western Canada can be obtained from the regression equations of Smith and Kozak (1967) shown in Table 14. Average bark thicknesses from the same source are given in Table 15, for fairly small trees of Northwestern species. Average bark proportions, moisture contents and specific gravities at the base of the same trees are shown in Table 16.
BARK VOLUMES
Average bark volumes based on double-bark thickness (DBT) as a percentage of diameter outside bark (DOB) are given in Table 15 for a sample of relatively small trees. However, for bark volume estimates in specific situations, the following method should be used.
Bark volumes for any section can be estimated using the equations of Table 14. For example, the equation given for DBT of coast Douglas-fir is:
DBT = -0.234 + 0. l39(DOB)
Bark volume (BV) as a percentage of total volume (TV) of wood plus bark is:
BV%TV = (DoB2 - DrB2) x loo \ DOB2
where: DIB is diameter inside bark and DIB = DOB - DBT
Bark volume as a percentage of wood volume (WV) is:
BV%WV = fDoB2 - DIB2) x 100 \ DIB2
Thus for a 20-in DOB coastal Douglas-fir:
DBT = -0.234 + 0. 139(20) = 2.546 in
DIB = 20 - 2.546 in = 17.454 in
BV%TV = (202 - 17.4542) x 100 17.4542
= 31.3 percent
(from Table 14)
Calculated bark volume percentages should be reduced for bark fissures and voids where applicable. Krier and River (1968) calculated void volumes for three species as follows:
21

Table 14
Regression of Double-Bark Thickness (DBT) on Diameter Outside Bark (008)
Imperial Species Constant
(a}
Cedar, western red, coastal 0.434 Cedar, western red, interior 0.303 Cypress, yellow 0.243 Douglas-fir, coastal -0.234 Douglas-fir, interior -0.403 Fir, amabilis 0.290 Fir, alpine 0.051 Hemlock, western, coastal 0.305 Hemlock, western, interior 0.043 Pine, lodgepole 0.073 Pine, ponderosa 0.208 Pine, western white 0.107 Spruce, Sitka 0.394 Spruce, white, Englemann 0.149
Alder, red 0.156 Aspen, trembling 0.103 Cottonwood, black 0.064 Maple, broadleaf 0.107 White birch 0.132
Example: For 20-inch DOB coastal Douglas-fir, DBT = -0.234 + 0.139(20} = 2.546"
For 50-cm DOB coastal Douglas-fir, DBT = -0.594 + 0.139(50} = 6.36 em
lDerived for metric measurements.
Source: from Smith and Kozak, 1967.
22
Metric Constant 1
(a}
1.102 0.770 0.617
-0.594 -1.024 0.737 0.130 0.775 0.109 0.185 0.528 0.272 1.001 0.378
0.396 0.262 0.163 0.272 0.335
Regression Coefficient
(b)
0.025 0.041 0.030 a. 139 0.170 0.029 0.058 0.044 0.086 0.039 0.103 0.049 0.009 0.044
0.044 0.065 0.081 0.039 0.051

Table 15
Bark Statistics For Western Tree Species
Species No. of No. of DBH (in) Ave. DBT Ave. DBT Bark volume, % of Sections Trees % of DOB
Min. Ave. Max. mm in Wood Vol. Total Vol.
Cedar, western red, coastal 924 84 6 20 51 19.0 0.75 7.2 16.1 13.9 Cedar, western red, interior 946 86 5 16 48 18.5 0.73 7.9 17.9 15.2 Cypress, yellow 748 68 6 14 44 13.5 0.53 6.8 15.1 13.1 Douglas-fir, coastal 1067 97 5 22 71 47.2 1.86 11.7 28.2 22.0 Douglas-fir, interior 858 78 5 18 42 39.9 1.57 12.4 30.4 23.3 Fir, amabilis 1 946 86 6 18 50 16.5 0.65 6.1 13.4 11.8 Fir, alpinel 1056 96 5 10 24 11.9 0.47 7.0 15.6 13.5 Hemlock, western, coastal 891 81 5 16 42 20.6 0.81 8.5 19.5 16.3 Hemlock, western, interior 671 61 6 12 28 19.6 0. 77 9.4 21.8 17.9 Pine, lodgepole 4994 454 5 11 23 9.7 0.38 5.2 11.2 10.1 Pine, ponderosa 1100 100 6 18 40 38.9 1.53 12.6 30.9 23.6 Pine, western white 1045 95 6 16 27 16.8 0.66 6.3 12.9 12.2 Spruce, Sitkal 429 39 6 30 85 14.5 0.57 4.4 9.4 8.6 Spruce, white, Englemannl 1331 121 5 13 26 14.2 0.56 6.7 14.9 13.0
Alder, red 946 86 5 11 18 12.7 0.50 7.0 15.6 13.5 Aspen, trembling 1309 119 5 10 21 14.7 0.58 8.6 19.8 16.5 Cottonwood, black 1397 127 5 12 48 17.8 0.70 9.6 22.4 18.3 Maple, broadleaf 396 36 6 13 23 11.9 0.47 5.4 11.7 10.5 White birch 803 73 5 9 21 11.4 0.45 8.2 18.6 15.7
1Local names, as in Table 14.
Source: from Smith and Kozak, 1967.
N w
N ...
Species
Cedar, Hestern red Cedar, yellow Douglas-fir Fir, amab i 1 is Fir, grand Hemlock, western Larch, western Pine, lodgepole Pine, ponderosa Pine, western white Spruce, Engelmann Spruce, Sitka Spruce, white
Alder, red Aspen Birch Cottonwood, black t1ap1e, broadleaf -loven-dry basis.
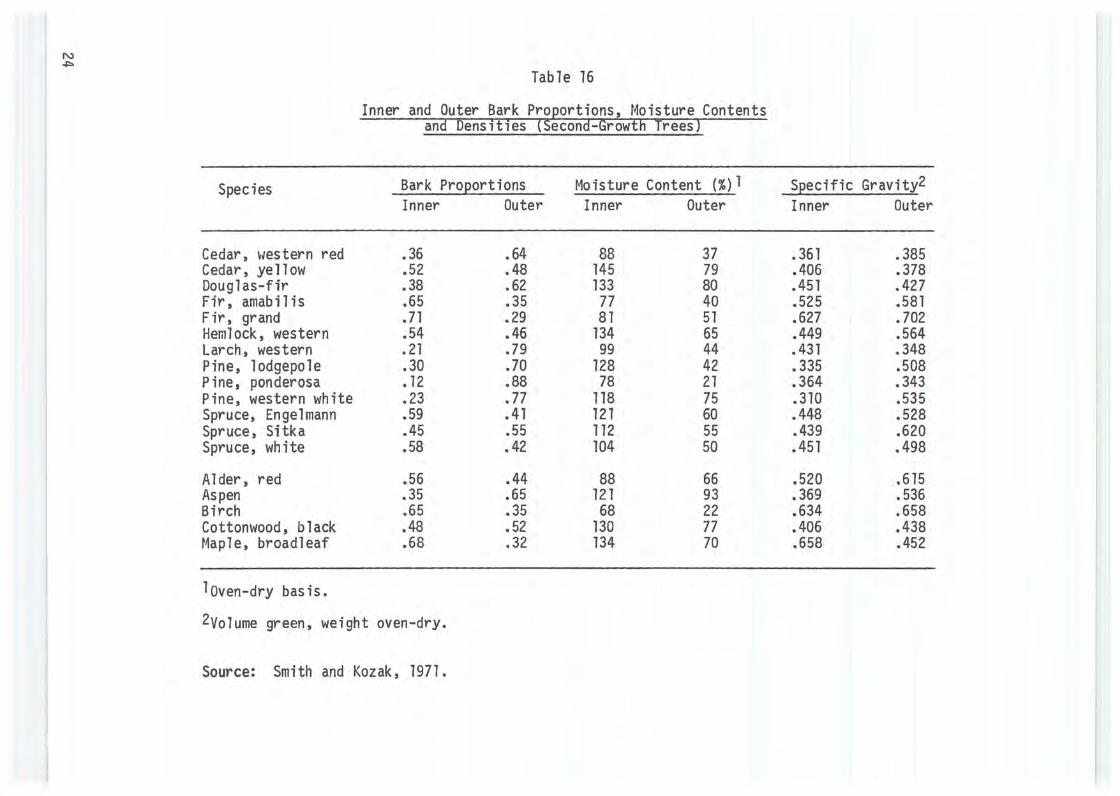
Table 16
Inner and Outer Bark Proportions, Moisture Contents and Densities (Second-Growth Trees)
Bark Moisture Content (%)1 Inner Outer Inner Outer
.36 .64 88 37
.52 • 48 145 79
.38 • 62 133 80
.65 .35 77 40
.71 .29 81 51
.54 .46 134 65 • 21 .79 99 44 .30 .70 128 42 • 12 .88 78 21 .23 • 77 118 75 .59 .41 121 60 .45 .55 112 55 .58 • 42 104 so
.56 .44 88 66
.35 .65 121 93
.65 .35 68 22
.48 • 52 130 77
.68 .32 134 70
2Volume green, weight oven-dry.
Source: Smith and Kozak, 1971.
Gravity2 Inner Outer
.361 .385
.406 .378
.451 .427
.525 .581
.627 .702
.449 .564 • 431 .348 .335 .508 .364 .343 .310 .535 .448 .528 .439 .620 • 451 .498
.520 .615
.369 .536
.634 .658
.406 .438
.658 .452

Ponderosa pine Douglas-fir We stern 1 arch
26 percent void vo 1 ume, 27 percent 11 11
28 percent 11 11
Using this information, the Douglas-fir bark volume as a percentage of wood volume for the above example would be:
BV%WV = (31.3)(.73) = 22.8 percent, or, in general,
= (poB2 - DIB2) x (100 - V) \ DIB2
where Vis percentage void volume.
In addition, when calculating volumes of bark available at mill yards, deductions must be made for losses in thickness and coverage in transit from stump to yard. Thus, the general calculaton for bark volume as a percentage of wood volume at mill yards or log ponds would be:
BV%WV = (DOB 2 - DIB 2) x ( 100 - V - Y) \ DIB2
where Y is the percentage of bark lost in transit.
BARK COVERAGE
Bark coverage at final destination is important from the point of view of potential hog fuel availab1lity for power generation.
Results of studies of bark coverage made by this laboratory on the B.C. coast are shown in Table 18. Average coverages appear to bear little relationship to transport distance or method.
BARK DENSITY
Specific gravity of inner and outer bark of small trees of Northwestern species presented by Smith and Kozak (1971) are given in Table 16. Alternative bark density data presented in Table 17 also provide an idea of the variability to be expected in bark densities.
25

Table 17
Bark ISlsity arx:l Bark IA:nsity/Wood Ratios
Species
Cedar, \\eStern recf3 Cypress, ye llON Douglas-fir3
Fir, alpine Fir, armbilis Hemlock, \\estern (coastal )3
Hem lock, \\estern (interior) Larch, \\estern Pine, jack Pine, lodgepole Pine, \\estern white Pine, porxierosa Spru:e, black Spruce, \\hite
lvoll.IIE green, \\eight oven-dry.
2wood densities from Table 8.
3old growth - B.C. coast.
Bark 1 Average
lb/ft3 kg/m3
21 336 21 n; 31 497 31 497 31 497 34 545 3) 481 31 497 33 529 33 529 32 513 31 497 24 l34 28 449
Source: from I:bbie, 1965; arx:l Smith and Kozak, 1967.
26
Range
lb/ft3
17 - 24
21 - 36
26- 35 24 - 49
25 - 42
19- 28 22-34
Bark/
kg/m3
272- 384 1.(]2 0.80
336 - fill 1.10 1.51
416 - 561 1.32 384- 785 1.29
1.14 1.10
400 - 673 1.26 1.29 1.42 1.28
304- 449 0.94 352- 545 1.25

N .......
Species
Western hemlock
Amabi lis fir
Douglas-fir
Western red cedar
Sitka spruce
Table 18
of Bark Coverage at Destination -B.C. Coast Waterborne Logs
Log top diameter % Bark coverage Total (em) Logs
Ave. Range Ave. Range
102 23 10 - 46 55.6 0-100 103 26 10 - 41 75.0 0-100 99 55 25 - 81 76.0 9-100 97 58 30 - 96 62.9 0-100
101 20 10 - 30 65.3 0-100 102 23 10 - 36 80.0 0-100 81 51 36 - 76 75.0 9-100 62 52 20 -102 65.7 27-100
104 48 36 - 96 65.8 0-100 107 54 30 -102 62.9 0-100 151 29 10 - 56 85.8 0-100 92 38 10 -122 50.8 0-100
lOB 49 25 -117 57.2 0-100
95 81 20 -147 41.3 0-100 216 35 10 - 76 29.6 0-100 100 39 20 - 66 36.8 0-100
125 60 25 -122 34.6 0-100
Transportation
Distance (km) Methods
48 Flat raft 161 Flat raft 161 Flat raft 64 Bundled
48 Flat raft 161 Flat raft 161 Flat raft 64 Bundled
772 Barged 64 Bundled 56 Bundled
451 Flat raft 209 Flat raft
48 Flat raft 121 Flat raft 772 Barged
724 Barged

28

SAWMILLING LUMBER SIZES
Imperial and metric dimensions of rough and dressed softwood lumber commonly produced in Canada are shown in Table 19. More complete lumber size information is contained in the National Lumber Grades Authority "Standard Grading Rules for Canadian Lumber" and the Canadian Wood Council• s "Metric Manual for Wood Products".
LUMBER VOLUMES
In North America, the standard unit of measure of lumber volume is the board foot (l ft long by l ft wide by l in thick), and the volume is calculated on nominal sizes. The cubic content of 1,000 board feet (fbm) is 83.33 cubic feet (ft3) based on nominal dimensions. The cubic content based on actual sizes varies with lumber size as shown in Table 20.
In the metric system, lumber volumes are expressed in cubic metres. Factors used to convert between imperial and metric lumber volumes, based on nominal sizes are as follows:
1 m3 = 424 fbm, 1,000 fbm = 2.36 m3.
Normally, when lumber is sold in metric units, the volume in m3 is based on actual sizes. Hence the conversion factor between fbm and m3 will vary by lumber size, as shown in Table 21.
LINEAL MEASURE
Lumber volumes may also be expressed in lineal measure. Board foot volumes are converted to lineal measure by the following formula:
lineal feet= board feet x 12 thickness (in) x width (in)
Lineal volumes per thousand board feet and per cubic metre of lumber, for surfaced and rough lumber are shown in Table 22.
LUMBER PACKAGING
Standard packages of lumber conforming to Canadian and American Lumber Standards (CLS and ALS) contain the number of pieces given in Table 23. The number of pieces in overseas export packages is shown in Table 24.
29

Table 19
Dimensions of Surfaced Softwood Lumber
Surfaced-Actual Sizes
Nominal Size Imperia 1 Metricl (in)
Green Dry Dry Green (in) (in) (mm} (mm}
Thickness
1 25/32 3/4 19 19.8 1 l/4 1 l/32 1 25 26.2 1 l/2 1 9/32 1 1/4 32 32.3 2 1 9/16 1 1/2 38 39.7 2 l/2 2 l/16 2 51 52.4 3 2 9/16 2 l/2 64 65.1 3 1/2 3 1/16 3 76 77.8 4 3 9/16 3 l/2 89 90.5 4 1/2 4 1/16 4 102 103.2
Width2
5 4 5/8 4 l/2 ll4 ll7 .5 6 5 5/8 5 l/2 140 142.9 7 6 5/8 6 l/2 165 168.3 8 7 l/2 7 l/4 184 190.5 9 8 l/2 8 l/4 210 215.9
TO 9 l/2 9 l/4 235 241.3 11 10 l/2 10 l/4 260 266.7 12 11 1/2 11 1/4 286 292.1 14 13 l/2 13 l/4 337 342.9 16 15 l/2 15 1/4 387 393.7
1Metric nomenclature is based on the dry size. 2sizes for narrower widths are the same as for thicknesses.
Source:
Forest Management Institute. 1977.
Canadian Wood Council. 1978.
30

Nominal Dimensions {inches}
1 X 2 1 X 3 1 X 4 1 X 6 1 X 8 1 X 10 1 X 12
2 X 2 2 X 3 2 X 4 2 X 6 2 X 8 2 X 10 2 X 12
3 X 4 3 X 6 3 X 8 3 X 10 3 X 12
4 X 4 4 X 6 4 X 8 4 X 10 4 X 12
Table 20
Cubic Volume eer Thousand Board Feet for Var1ous Lumber Sizes
Cubic Feet per Mfbm Lumberl Surfaced Green Surfaced Dry
50.86 46.87 55.61 52.08 57.98 54.69 61.04 57.29 61.04 56.64 61.85 57.81 62.39 58.59
50.86 46.87 55.61 52.08 57.98 54.69 61.04 57.29 61.04 56.64 61.85 57.81 62.39 58.59
63.40 60.76 66.77 63.69 66.73 62.93 67.62 64.24 68.15 65.04
66.10 63.80 69.58 66.84 69.58 66.08 70.51 67.45 71.13 68.36
lsased on actual dimensions shown in Table 19.
{19% MC}
31

Table 21
Cubic Meter Con version Factors 1 per Mfbm Lumber
Rough Green Surfaced Dry Nominal Conversion Actual Conversion
Dimensions Factorl Dimensions Factor (in) (m3 (in) (m3/Mfbm)
1 X 2 2.333 3/4 X 1 1/2 1.321 1 X 3 2.318 3/4 X 2 1/2 1.484 1 X 4 2.333 3/4 X 3 1/2 1.547 1 X 5 2.324 3/4 X 4 1/2 1.586 1 X 6 2.318 3/4 X 5 1/2 1.623 1 X 7 2.327 3/4 X 6 1/2 1.639 1 X 8 2.322 3/4 X 7 1/4 1.599 1 X 9 2.328 3/4 X 8 1/4 1.623 1 X 10 2.324 3/4 X 9 1/4 1.634 1 X 12 2.326 3/4 X 11 1/4 1.657 2 X 2 2.380 1 1/2 X 1 1/2 1.321 2 X 3 2.364 1 1/2 X 2 1/2 1.484 2 X 4 2.380 1 1/2 X 3 1/2 1.547 2 X 5 2.371 1 1/2 X 4 1/2 1.586 2 X 6 2.364 1 1/2 X 5 1/2 1.623 2 X 7 2.373 1 1/2 X 6 1/2 1.639 2 X 8 2.368 1 1/2 X 7 1/4 1.599 2 X 10 2.371 1 1/2 X 9 1/4 1.634 L X 12 2.372 1 1/2 X 11 1/4 1.657 3 X 3 2.349 2 1/2 X 2 1/2 1.666 3 X 4 2.364 2 1/2 X 3 1/2 1.737 3 X 5 2.355 2 1/2 X 4 1/2 1.780 3 X 6 2.349 2 1/2 X 5 1/2 1.822 3 X 7 2.358 2 1/2 X 6 1/2 1.840 3 X 8 2.353 2 1/2 X 7 1/4 1.796 3 X 10 2.355 2 1/2 X 9 1/4 1.835 3 X 12 2.357 2 1/2 X 11 1/4 1.861 4 X 4 2.380 3 1/2 X 3 1/2 1.812 4 X 5 2.371 3 1/2 X 4 1/2 1.857 4 X 6 2.364 3 1/2 X 5 1/2 1.900 4 X 7 2. 373 3 1/2 X 6 1/2 1.920 4 X 8 2.368 3 1/2 X 8 1/4 1.873 4 X 10 2.371 3 1/2 X 9 1/4 1.914 4 X 12 2.372 3 1/2 X 11 1/4 1.941
lvariation in conversion factors in rough lumber is caused by rounding metric sizes to the closest millimetre. If not rounded, the factor would be 2.36 for all sizes.
Source: Canadian Wood Council, 1978.
32
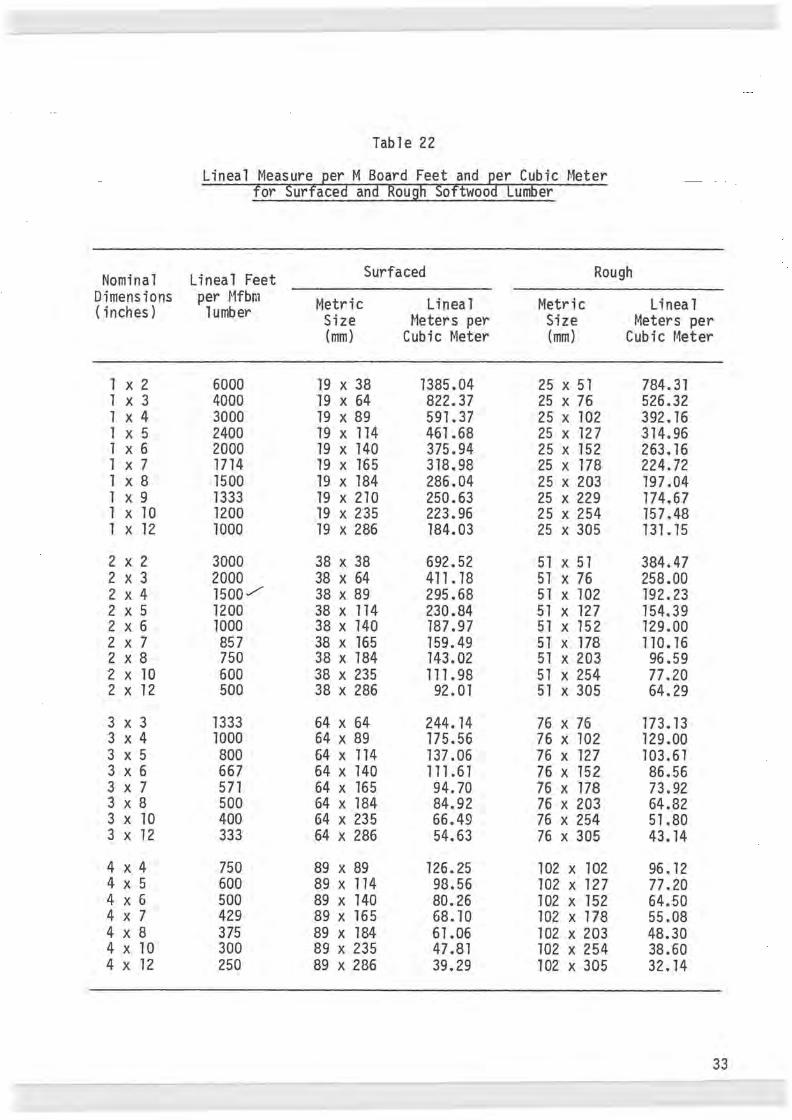
Nomina 1 Dimensions (inches)
1 X 2 1 X 3 1 X 4 1 X 5 1 X 6 1 X 7 1 X 8 1 X 9 1 X 10 1 X 12
2 X 2 2 X 3 2 X 4 2 X 5 2 X 6 2 X 7 2 X 8 2 X 10 2 X 12
3 X 3 3 X 4 3 X 5 3 X 6 3 X 7 3 X 8 3 X 10 3 X 12
4 X 4 4 X 5 4 X 6 4 X 7 4 X 8 4 X 10 4 X 12
Tab 1 e 22
Linea 1 Measure per M Board Feet and Cubic Heter for Surfaced and Rough Softwoo Lumber
Lineal Feet Surfaced Rough per Mfbm Metric Lineal Metric Lineal lumber Size s per Size per
(mm) Cubic Meter (mm) Cubic t·1eter
6000 19 X 38 1385.04 25 X 51 784.31 4000 19 X 64 822.37 25 X 76 526.32 3000 19 X 89 591.37 25 X 102 392. 16 2400 19 X 114 461.68 25 X 12 7 314.96 2000 19 X 140 375.94 25 X 152 263.16 1714 19 X 165 318.98 25 X 178 224.72 1500 19 X 184 286.04 25 X 203 197.04 1333 19 X 210 250.63 25 X 229 174.67 1200 19 X 235 223.96 25 X 254 157.48 1000 19 X 286 184.03 25 X 305 131.15
3000 38 X 38 692.52 51 X 51 384.47 2000 38 X 64 411.18 51 X 76 258.00 1500/ 38 X 89 295.68 51 X 102 192.23 1200 38 X 114 230.84 51 X 127 154.39 1000 38 X 140 187.97 51 X 152 129.00 857 38 X 165 159.49 51 X 178 110.16 750 38 X 184 143.02 51 X 203 96.59 600 38 X 235 111.98 51 X 254 77.20 500 38 X 286 92.01 51 X 305 64.29
1333 64 X 64 244. 14 76 X 76 173.13 1000 64 X 89 175.56 76 X 102 129.00 800 64 X 114 137.06 76 X 127 103.61 667 64 X 140 111.61 76 X 152 86.56 571 64 X 165 94.70 76 X 178 73.92 500 64 X 184 84.92 76 X 203 64.82 400 64 X 235 66.49 76 X 254 51.80 333 64 X 286 54.63 76 X 305 43.14
750 89 X 89 126.25 102 X 102 96.12 600 89 X 114 98.56 102 X 127 77.20 500 89 X 140 80.26 102 X 152 64.50 429 89 X 165 68.10 102 X 178 55.08 375 89 X 184 61.06 102 X 203 48.30 300 89 X 235 47.81 102 X 254 38.60 250 89 X 286 39.29 102 X 305 32.14
33

Nominal Thickness
(in) (1JJJ1}
l 19 2 38 3 64 4 89 6 140
Source: Council
34
Table 23
B.C. Lumber Export Packaging Schedule for Surfaced Four Sides (S4S) Green CLS, ALS
No. of Pieces per Package No. of Pieces Nominal Width in Inches (mm}
High 3(64} 4(89) 6( 140) 8(184} 10(235}
32 576 416 256 192 160 16 288 208 128 96 80 9 162 117 72 54 45 7 91 56 42 35 4 32 24
of Forest Industries of B.C., 1974
12(286}
128 64 36 28

Lumber No. of Thickness Pieces
(in) High
5/8 36 3/4 30 7/8 26
1 24 1 1/4 20 1 3/8 17 1 1/2 16 1 9/16 15 1 5/8 15 1 3/4 14 1 7/8 13 2 12 2 1/2 9 3 8 4 6 5 4 6 4 8 3
Table 24
B.C. Lumber Export Packaling Schedule for Rough and/or Surfaced- o-S1ze Lumber
Pieces per package
Lumber Width (Inches) 3 4 5 6 7 8 9
8- 24 foot lengthsl
432 288 216 360 240 180 312 208 156
360 288 216 192 144 144 120 300 240 180 160 120 120 100 255 204 153 136 102 102 85 240 192 144 128 96 96 80
180 135 90 75 180 135 90 75
210 168 126 112 84 84 70 195 156 117 104 78 78 65 180 144 108 96 72 72 60 135 108 81 72 54 54 45 120 96 72 64 48 48 40
72 54 48 36 36 30 36 32 24 24 20
32 24 24 20 18 15
10 11 12
144 120 104 96 96 96 80 80 80 68 68 68 64 64 64 60 60 56 56 56 52 52 52 48 48 48 36 36 36 32 32 32 24 24 24 16 16 16 16 16 16 12 12 12
--------------------------------------------------------------------------------25 to 40 foot 1engths2
1 1/2 16 128 96 64 64 48 48 32 32 32 32 1 3/4 14 112 84 56 56 42 42 28 28 28 28 1 7/8 13 104 78 52 52 39 39 26 26 26 26 2 12 96 72 48 36 36 36 24 24 24 24 2 1/2 9 72 54 36 36 27 27 18 18 18 18 3 8 64 48 32 32 24 24 16 16 16 16 4 6 36 24 24 18 18 12 12 12 12 5 4 16 16 12 12 8 8 8 8 6 4 16 12 12 8 8 8 8 8 3 9 6 6 6 6
1Appropriate package size for lengths up to 24 ft. = 24 in. x 48 in. 2Appropriate package size for 1 ength s over 24 ft. = 24 in. x 24 in.
Source: Council of Forest Industries of B.C., 1974.
35
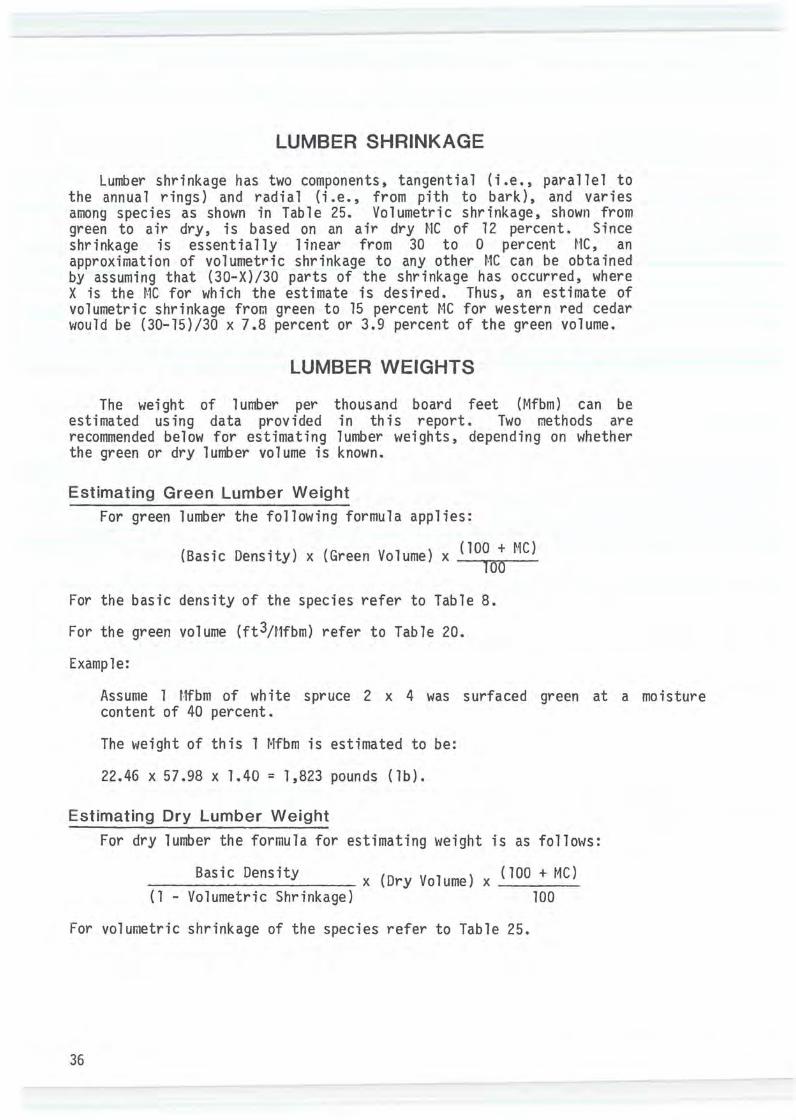
LUMBER SHRINKAGE
Lumber shrinkage has two components, tangential (i.e., parallel to the annual rings) and radial (i.e., from pith to bark), and varies among species as shown in Table 25. Volumetric shrinkage, shown from green to air dry, is based on an air dry NC of 12 percent. Since shrinkage is essentially linear from 30 to 0 percent HC, an approximation of volumetric shrinkage to any other MC can be obtained by assuming that (30-X)/30 parts of the shrinkage has occurred, where X is the t·1C for which the estimate is desired. Thus, an estimate of volumetric shrinkage from green to 15 percent MC for western red cedar would be (30-15)/30 x 7.8 percent or 3.9 percent of the green volume.
LUMBER WEIGHTS
The weight of lumber per thousand board feet (Mfbm) can be estimated using data provided in this report. Two methods are recommended below for estimating lumber \'/eights, depending on whether the green or dry lumber volume is known.
Estimating Green Lumber Weight For green lumber the following formula applies:
(Basic Density) x (Green Volume) x (lOO + HC) 1oo For the basic density of the species refer to Table 8.
For the green volume (ft3/t1fbm) refer to Table 20.
Example:
Assume l f.tfbm of white spruce 2 x 4 was surfaced green at a moisture content of 40 percent.
The weight of this l Mfbm is estimated to be:
22.46 x 57.98 x 1.40 = 1,823 pounds (lb).
Estimating Dry Lumber Weight For dry lumber the formula for estimating weight is as follows:
___ B_a_s_i_c_D_e_n_s_it_Y ___ x (Dry Volume) x ( 100 + ( l - Volumetric Shrinkage) 100
For volumetric shrinkage of the species refer to Table 25.
36

Table 25
Lumber Shrinkage
Percent Shrinkage From Green Species To Oven-Dry To Air-Dry1
Radia 1 Tangentia1 Volumetric Volumetric
Cedar, eastern white 1.7 3.6 6.4 3.8 Cedar, western red 2.1 4.5 7.8 4.8 Cypress, ye 11 0\'1 3.7 6.0 9.4 5.0 Douglas-fir 4.8 7.4 11.9 7.0 Fir, alpine 2.6 7.4 9.4 5.6 Fir, amabilis 4.2 8.9 12.5 7.5 Fir, balsam 2.7 7.5 10.7 5.7 Hemlock, western 5.4 8.5 13.0 8. 1 Larch, western 5. 1 8.9 14.0 8.0 Pine, jack 4.0 5.9 9.6 5.7 Pine, lodgepole 4.7 6.8 11.4 6.6 Pine, red 3.7 6.3 9.6 6.5 Pine, western white 3.7 6.8 10.7 6.0 Pine, ponderosa 4.6 5.9 10.5 6. 1 Pine, eastern white 2.5 6.3 8.2 4.5 Spruce, black 3.8 7.5 11.1 6.5 Spruce, Engelmann 4.2 8.2 11.6 6.8 Spruce, Sitka 4.6 7.8 11.7 6.0 Spruce, white 3.2 6.9 11.3 6.8 Tamarack 2.8 6.2 11.2 7. 1 -------------------------------------------------------------------------------Alder, red 4.2 7.0 11.7 8.0 Ash, black 4.3 8.2 13.8 7.9 Ash, green 3.8 5.4 11.4 8.3 Aspen, trembling 3.6 6.6 11.8 8.3 Aspen, 1 argetooth 3.2 6.8 11.7 8.8 Basswood 6.7 9.3 18.4 13.4 Birch, white 5.2 7.2 13.8 10.5 Birch, western white 6.8 9.3 16.0 10.0 Cottonwood, eastern 3.1 7.8 11.8 9.8 Cottonwood, black 3.6 8.8 11.7 8.4 Elm, white 4.4 7.8 15.2 9.4 Ironwood 4.8 8.0 18.2 12.4 Maple, broadleaf 4. 1 7.6 12.1 8.2 t1aple, 3.9 7.4 14.8 9.4 Oak, bur 4.2 5.4 13.7 10.2 Poplar, balsam 3.9 6.4 11.6 9.5
l12 percent moisture content
Sources: Kennedy, 1965 U.S.D.A. Wood Handbook, 1955 (Apline fir only).
37

Example:
Assume 1 Mfbm of white spruce 2 x 4 was surfaced dry at 17 percent MC.
Percent volumetric shrinkage from green to 17 percent MC
= 30 - 17 x 11.3 = 4.90 percent 30
The weight of 1 Mfbm is estimated to be
= X 54.69 X 1.17 = 1, 511 1 b. ( 1 - .049)
Based on an average MC of 15 percent, and appropriate volumetric shrinkages, estimated lumber weights per thousand board feet for various dimensions of dry lumber are shown in Table 26.
Based on an average MC of 15 percent, and appropriate volumetric shrinkages, lumber weights per cubic metre for various species are shown in Table 27.
LUMBER YIELDS
Lumber yields (lumber output/log input) are commonly expressed as either a lumber recovery factor (LRF) or percent yield.
Metric LRF Where metric log scaling is practiced, lumber yields are expressed in terms of nominal board feet of lumber recovered per scaled cubic metre of log input:
nominal board feet of lumber cubic metres of logs
The metric LRF can be used to estimate the proportion of the log actually recovered as lumber by converting the numerator of the above term to the actual cubic metre volume equivalent. The percent yield can be derived using the following equation:
percent yield = LFR x Y x 100 1000
where Y is the actua 1 cubic metre vo 1 ume per of 1 umber (Tab 1 e 21).
This reduces to:
percent yield= 0.1 (LRF) (Y).
38
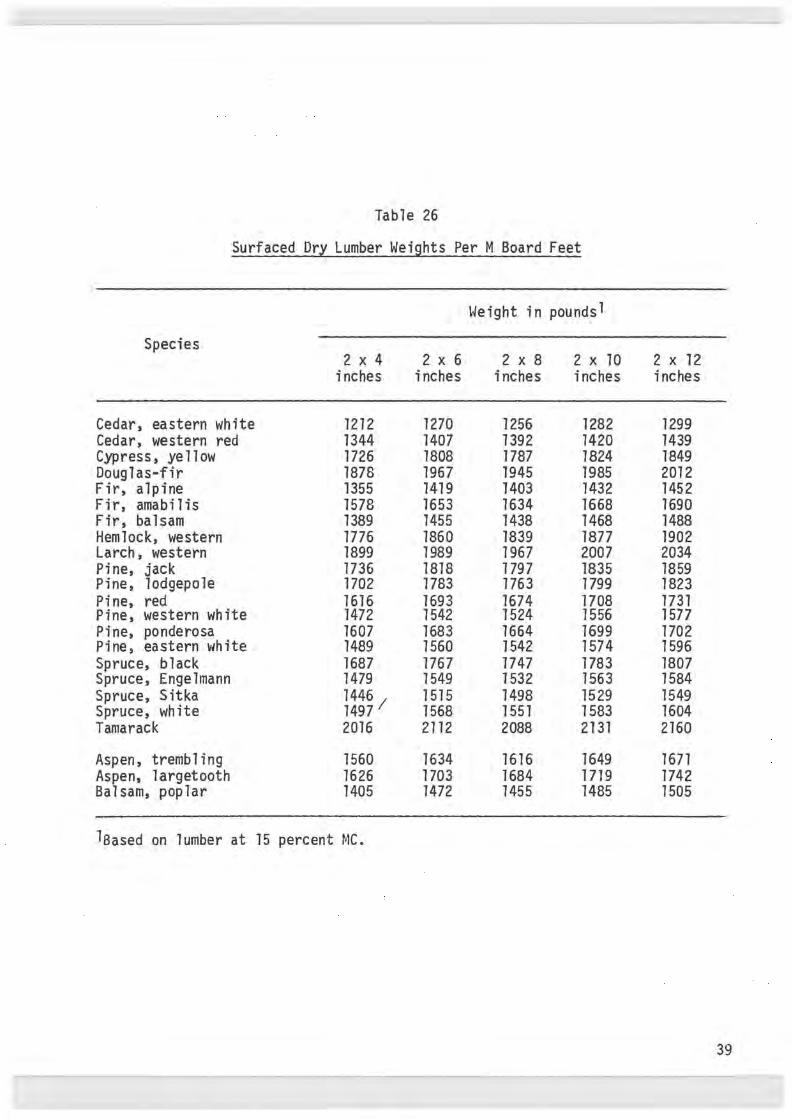
Table 26
Surfaced Dry Lumber Weights Per M Board Feet
Weight in poundsl
Species 2 X 4 2 X 6 2 X 8 2 X 10 2 X 12
inches inches inches inches inches
Cedar, eastern white 1212 1270 1256 1282 1299 Cedar, western red 1344 1407 1392 1420 1439 Cypress, yellow 1726 1808 1787 1824 1849 Douglas-fir 1878 1967 1945 1985 2012 Fir, alpine 1355 1419 1403 1432 1452 Fir, amabilis 1578 1653 1634 1668 1690 Fir, balsam 1389 1455 1438 1468 1488 Hemlock, western 1776 1860 1839 1877 1902 Larch, western 1899 1989 1967 2007 2034 Pine, jack 1736 1818 1797 1835 1859 Pine, lodgepole 1702 1783 1763 1799 1823 Pine, red 1616 1693 1674 1708 1731 Pine, western white 1472 1542 1524 1556 1577 Pine, ponderosa 1607 1683 1664 1699 1702 Pine, eastern white 1489 1560 1542 1574 1596 Spruce, black 1687 1767 1747 1783 1807 Spruce, Engelmann 1479 1549 1532 1563 1584 Spruce, Sitka 1446 I 1515 1498 1529 1549 Spruce, white 1497 1568 1551 1583 1604 Tamarack 2016 2112 2088 2131 2160
Aspen, trembling 1560 1634 1616 1649 1671 Aspen, largetooth 1626 1703 1684 1719 1742 Balsam, poplar 1405 1472 1455 1485 1505
laased on lumber at 15 percent MC.
39
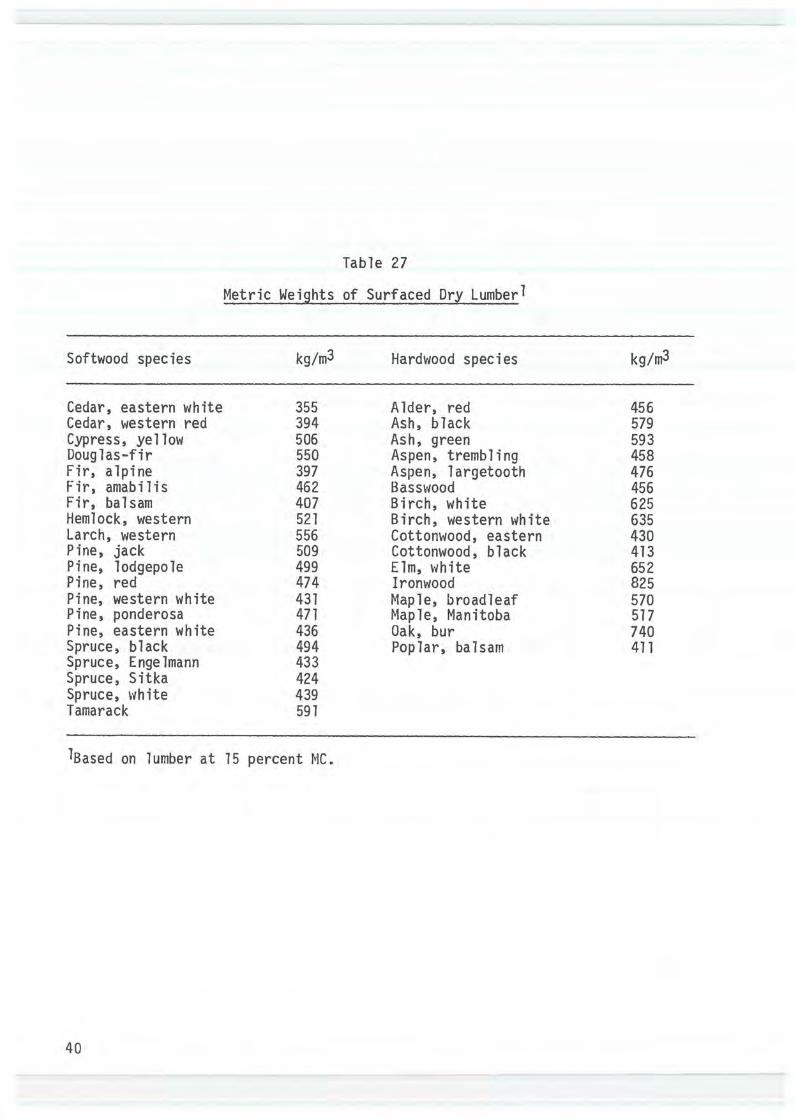
Table 27
Metric Weights of Surfaced Dry Lumberl
Softwood species kg/m3 Hardwood species kg/m3
Cedar, eastern white 355 Alder, red 456 Cedar, western red 394 Ash, black 579 Cypress, yell ow 506 Ash, green 593 Douglas-fir 550 Aspen, trembling 458 Fir, alpine 397 Aspen, largetooth 476 Fir, amabilis 462 Basswood 456 Fir, balsam 407 Birch, white 625 Hemlock, western 521 Birch, western 635 Larch, western 556 Cottonwood, eastern 430 Pine, jack 509 Cottonwood, black 413 Pine, lodgepole 499 Elm, \'lhite 652 Pine, red 474 Ironwood 825 Pine, western white 431 Maple, broadleaf 570 Pine, ponderosa 471 Maple, Manitoba 517 Pine, eastern white 436 Oak, bur 740 Spruce, black 494 Poplar, balsam 411 Spruce, Engelmann 433 Spruce, Sitka 424 Spruce, 439 Tamarack 591
lBased on lumber at 15 percent
40

Example:
For a mill producing dressed, dried 2 x 4s, which has an LRF of 230 fbm/m3, the percentage of log cubic input recovered as lumber is:
0.1 x 230 x 1.547 = 35.6 percent.
Imperial LRF The LRF expressed in nominal board feet per cubic foot of log volume
(fbm/ft3) is still in use. The LRF expressed in these units can be employed to estimate the proportion of log cubic input recovered as lumber using the following equation:
percent yield = (LRF x )x 100 12 z
where Y is the actual cubic feet per Mfbm of lumber (Table 20), and Z is nominal cubic feet per Hfbm of lumber (83.33).
This reduces to:
percent yield= 0.1 (LRF)(Y)
Example:
For a mill producing dressed, dried 2 x 4s which has a LRF of 6.5, the percentage of cubic input recovered as lumber is
0.1 (6.5) (54.69) = 35.6 percent.
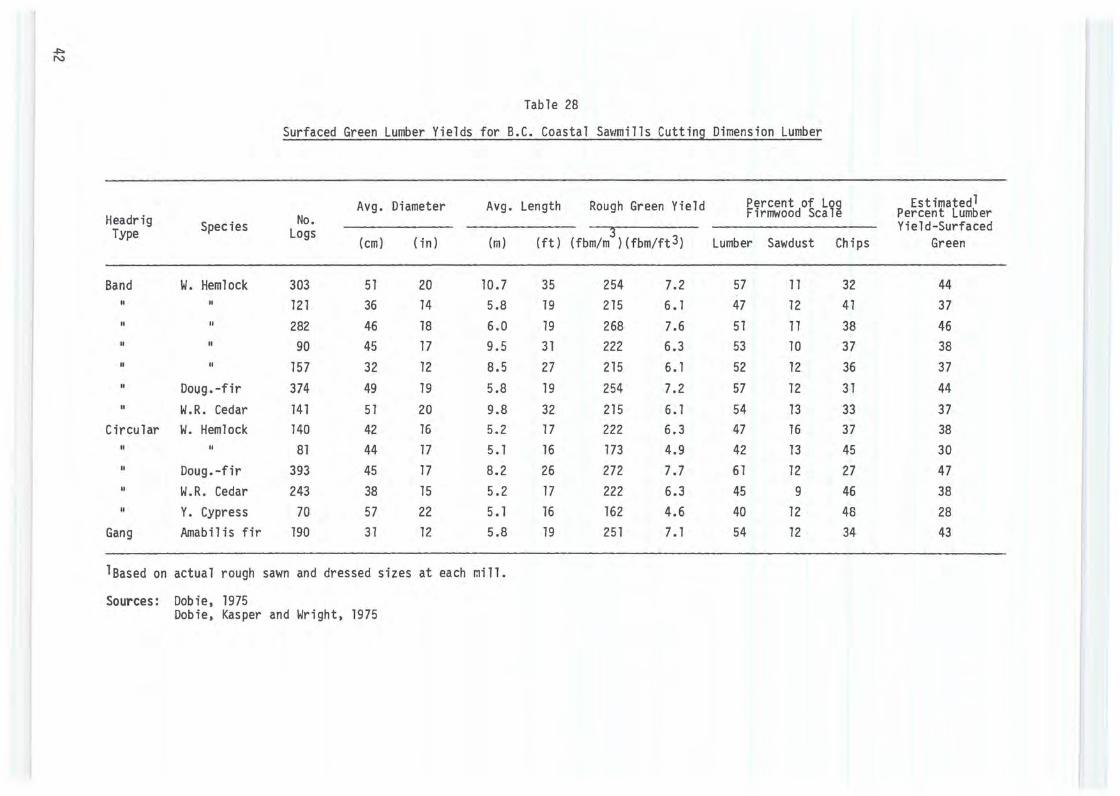
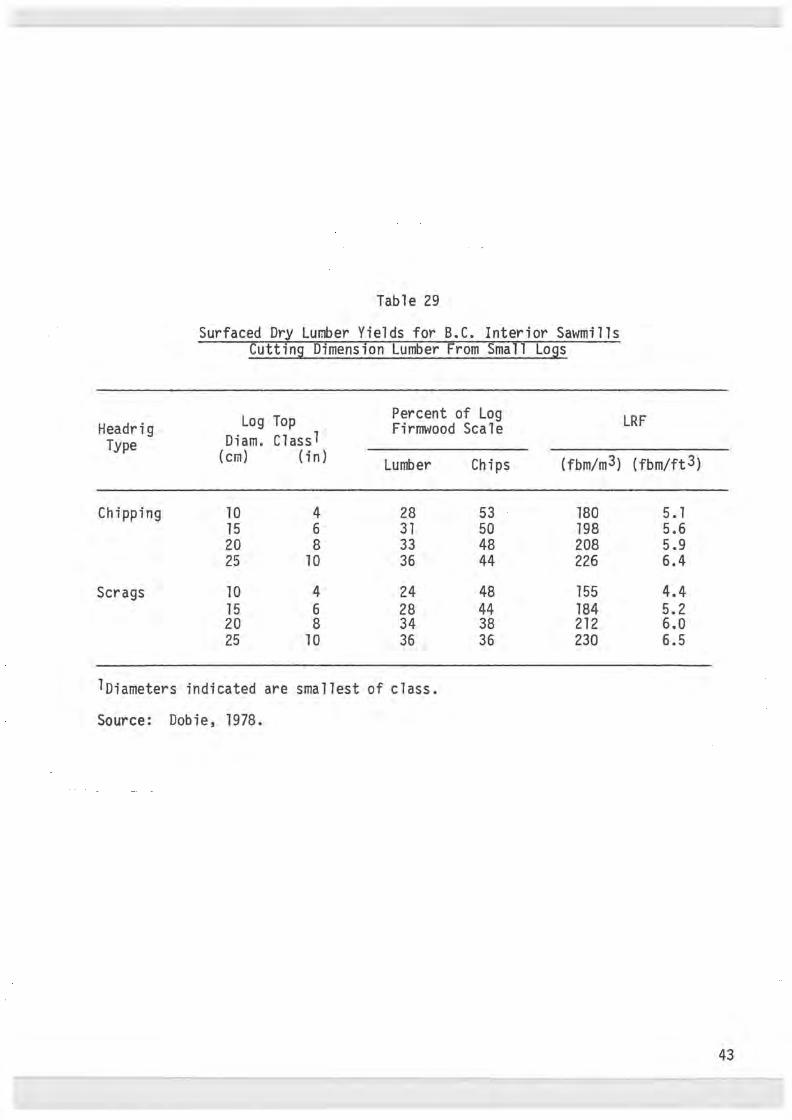
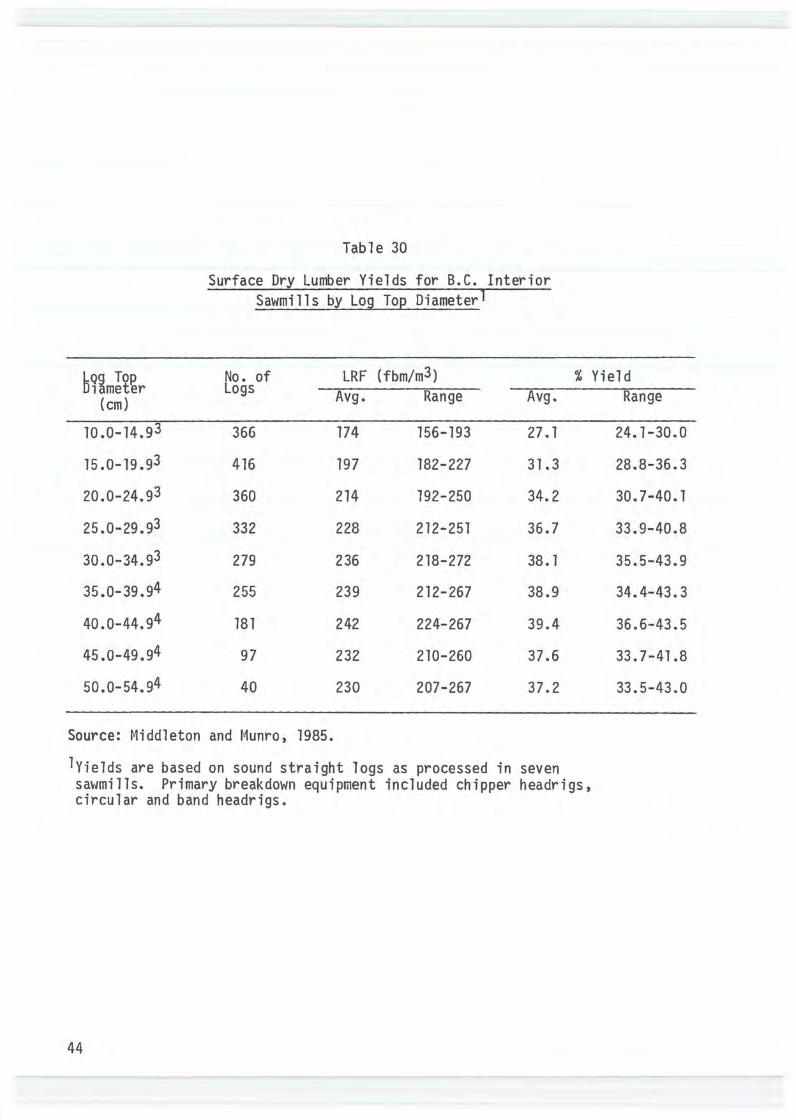
Lumber yields vary with sawmill type, log sizes, log quality, products cut, and other factors. Results of studies of lumber yields conducted at various coastal sawmills in B.C. are shown in Table 28. Results of yield studies in B.C. interior mills are shown in Tables 29 and 30.
RESIDUE YIELDS Sawdust
Sawdust volumes produced in lumber manufacture are a function of kerf thicknesses and the number of saw lines, and thus can be quite variable between mills. The estimates of sawdust yields provided in Table 31 are for mills cutting mainly 2-in thick lumber of random width.
Pulp Chips Pulp chips are obtained from the slabs, trims, and edgings produced in
sawmills, and thus will vary with the volume of lumber recovered and manufacturing practices. The estimates provided in Table 31 are based on the assumption of complete recovery of slabs, trims, and edgings as pulp chips.
41
N
Table 28
Surfaced Green Lumber Yields for B.C. Coastal Sawmills Cutting Dimension Lumber
Avg. Diameter Avg. Length Rough Green Yield Percent of Log Firmwood Scale Headrig Species No.
Type Logs (em) (in) (m) (ft) (fbm/m ) (fbm/ft3) Lumber Sawdust Chips
Band W. Hemlock 303 51 20 10.7 35 254 7.2 57 11 32 " " 121 36 14 5.8 19 215 6.1 47 12 41 " " 282 46 18 6.0 19 268 7.6 51 11 38 " " 90 45 17 9.5 31 222 6.3 53 10 37 " " 157 32 12 8.5 27 215 6 01 52 12 36 " Doug.-fir 374 49 19 5.8 19 254 7.2 57 12 31 " W.R. Cedar 141 51 20 9.8 32 215 6.1 54 13 33
Circular W. Hemlock 140 42 16 5.2 17 222 6.3 47 16 37 II II 81 44 17 5.1 16 173 4.9 42 13 45 II Doug.-fir 393 45 17 8.2 26 272 7.7 61 12 27 II W.R. Cedar 243 38 15 5.2 17 222 6.3 45 9 46 II Y. Cypress 70 57 22 5.1 16 162 4.6 40 12 48
Gang Amabilis fir 190 31 12 5.8 19 251 7 01 54 12 34 --lBased on actual rough sawn and dressed sizes at each mill.
Sources: Dobie, 1975 Dobie, Kasper and Wright, 1975
Estimatedl Percent Lumber Yield-Surfaced
Green
44 37 46 38 37 44 37 38 30 47 38 28 43
Headrig Type
Chipping
Scrags
lDiameters
Table 29
Surfaced Dry Lumber Yields for B.C. Interior Sawmills Cutting Dimension Lumber From Small Logs
Log Top Percent of Log Diam. Classl
Firmwood Scale (em) (in) Lumber Chips ( fbmfm3)
10 4 28 53 180 15 6 31 50 198 20 8 33 48 208 25 10 36 44 226
10 4 24 48 155 15 6 28 44 184 20 8 34 38 212 25 10 36 36 230
indicated are smallest of class.
Source: Dobie, 1978.
LRF
( fbm/ft3)
5. 1 5.6 5.9 6.4
4.4 5.2 6.0 6.5
43
Top D1 meter (em)
10.0-14.93
15.0-19.93
20.0-24.93
25.0-29.93
30.0-34.93
35.0-39.94
40.0-44.94
45.0-49.94
50.0-54.94
Source: Middleton
Table 30
Surface Dry Lumber Yields for B.C. Interior Sawmills by Log Top Diameterl
No. of LRF (fbm/m3) Logs Avg. Range Avg.
366 174 156-193 27.1
416 197 182-227 31.3
360 214 192-250 34.2
332 228 212-251 36.7
279 236 218-272 38.1
255 239 212-267 38.9
181 242 224-267 39.4
97 232 210-260 37.6
40 230 207-267 37.2
and 1985.
lvields are based on sound straight logs as processed in seven
%
sa\-Jmi lls. Primary breakdown equipment included chipper headrigs, circular and band headrigs.
44
Yield Range
24.1-30.0
28.8-36.3
30.7-40.1
33.9-40.8
35.5-43.9
34.4-43.3
36.6-43.5
33.7-41.8
33.5-43.0

Table 31
Estimated Residue Yields by Sawmill Type in British Columbia
Ni 11 Type Sawdust Pulp Planer Chips Shavings
(percent of log volume)
Band Headrig 12 36 11 Circular Headrig 15 38 11 Scrag 11 15 39 11 Chipping Headrig 6 47 10 Log Gang 11 36 10
Hog-Fuel Volumes by Mill Type and Speciesl
f·1i 11 Type Coastal Coastal White Douglas-fir Western Hemlock Spruce
(percent of log volume)
Band Headrig 38 35 33 Circular Headrig 41 38 36 Scrag Mill 41 38 36 Chipping Headrig 31 28 26 Log Gang 36 33 31
lBased on sawdust and planer shaving volumes above; average bark volumes of Table 15; 25 percent bark losses in transit; 27 percent bark voids for Douglas-fir; 20 percent bark voids for western hemlock; 10 percent bark voids for white spruce.
45

Planer Shavings The volume of planer shavings recovered depends on the volume of lumber
produced and the dimensions of the rough product compared with the dressed product. The estimates shown in Table 31 are based on lumber thicknesses measured at the mill types indicated.
Hog Fuel Hog fuel is normally composed of bark, sawdust, and shavings. Thus, the
volume of hog fuel produced per Ccf of logs depends on the sawmill, product, species, proportion of bark on logs when processed, and whether or not there is an alternate market for any of these components of hog fuel.
Estimates of hog fuel available from different species and mi 11 types are shown in Table 31. These estimates are based on the assumptions indicated in the table. Because there is little information available on bark loss when harvesting and transporting logs to mill sites, care should be taken in applying these hog-fuel estimates to specific operations. If a high degree of confidence in hog-fuel estimates is required, a series of measurements of the hog-fuel components should be made.
CHIPS AND RESIDUES - UNITS OF MEASURE
The most commonly used measures of chip volumes in western Canada are the 11 Volumetric 11 (or 11 gravity-packed 11
) unit (B.C. coast) and the bone-dry unit (B.C. Interior). Bone-dry tons and metric tonnes are used to a limited degree.
Volumetric Unit This unit is synonymous with the gravity-packed unit (GPU). By
the volumetric unit or GPU of chips used on the B.C. coast occupies 200 ft" (5.663 m3) of space.
For chips, the actual solid wood content or solid wood equivalent (SWE) in a GPU is commonly taken as 72 ft3.
The actual solid wood equivalent in the volumetric unit varies, depending on the type of residue and the degree of compaction. The compaction, in turn, depends mainly on the loading method (chip orientation, impact, layering), chip or particle size distribution, wood species, and moisture content.
Some approximate conversion ratios used to convert a GPU to solid wood equivalent are shown in Table 32. Also shown are the approximate bulk densities of wood residues and chips. The bulk density of planer shavings is highly variable, and relatively low, compared to other residue forms. By passing shavings through a fractionator, bulk densities can be increased significantly.
When chips are loaded onto rail cars they are usually more highly compacted than if they are loaded by gravity from a hopper into trucks. Well designed pneumatic systems can compact up to 25 percent more material into a given space than gravity loading (Oswald, 1979). Nylinder (1972) indicated that pulp chips
46

Table 32
Wood Residues: Bulk Densities and Solid Wood Equivalents per Volumetric Onitl
Bulk Density Solid Wood Equivalent Residue Type
Pulp chips Sawdust Bark Hog fuel
Planer shavings2
A. As produced: green dry-loose dry-compacted
B. Fractionated: green dry
16-20 18-22 19-28 18-24
4 5-6 8-9
6-8 10-12
256-320 288-352 304-449 288-384
64 80-96
128-144
96-128 160-192
72-80 80 81
71-84
16-18 32-41 52-66
27-32 65-83
Source: Bulk Densities provided by Rader Canada Ltd.
lone volumetric unit (GPU) occupies 200 ft3 of space. 2solid wood equivalents for planer shavinss estimated from bulk densities based on the following assumptions: a) basic wood density range of 22 to 28 lb/ft3, representing spruce
and Douglas-fir respectively; b) green wood moisture content range of 80-100 percent MC (o.d.
basis); c) dry wood moisture content of 10 percent (o.d. basis).
2.04-2.27 2.27 2.29
2.01-2.38
0.45-0.51 0.91-1.16 1.47-1.87
0. 76-0.91 1.84-2.35
47
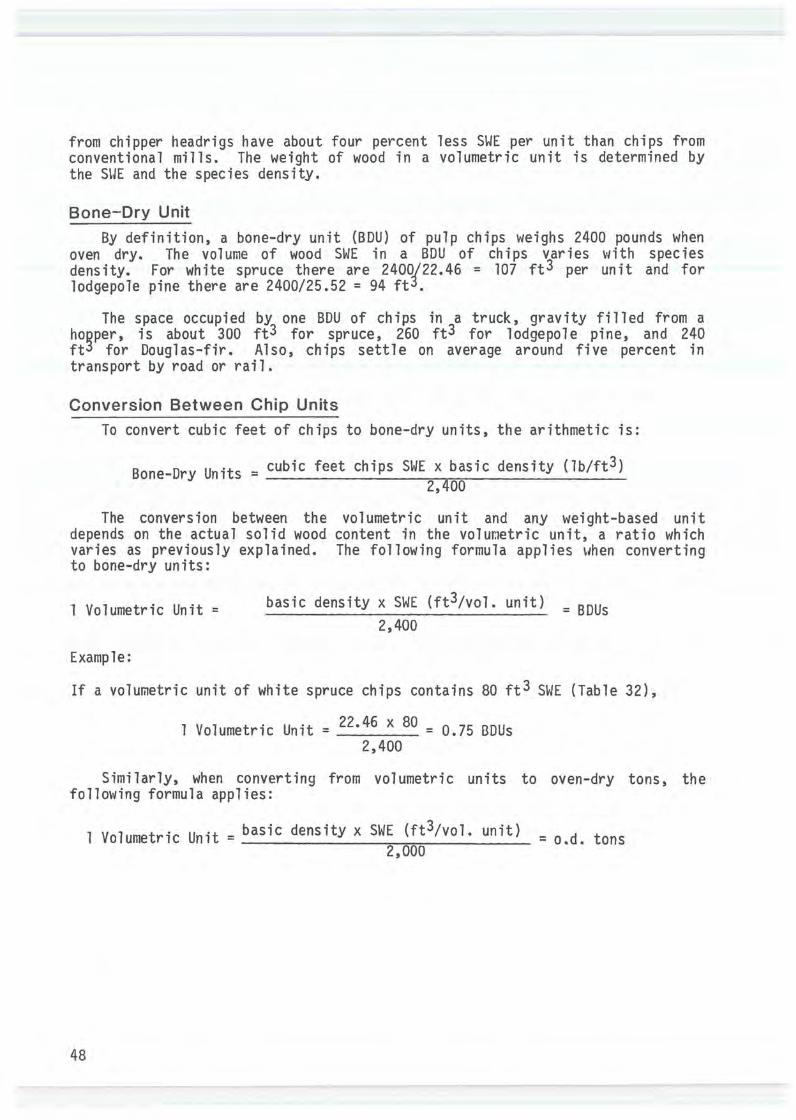
from chipper headrigs have about four percent less SWE per unit than chips from conventional mills. The weight of wood in a volumetric unit is determined by the SUE and the species density.
Bone-Dry Unit By definition, a bone-dry unit {BDU) of pulp chips weighs 2400 pounds when
oven dry. The volume of wood SWE in a BDU of chips varies \'lith species density. For white spruce there are 2400/22.46 = 107 ft3 per unit and for lodgepole pine there are 2400/25.52 = 94 ft3.
The space occupied by one BDU of chips in a truck, gravity fi 11 ed from a hogper, is about 300 ft3 for spruce, 260 ft3 for lodgepole pine, and 240 ft3 for Douglas-fir. Also, chips settle on average around five percent in transport by road or rail.
Conversion Between Chip Units To convert cubic feet of chips to bone-dry units, the arithmetic is:
Bone-Dry Units = cubic feet chips SWE x basic density {lb/ft3) 2,400
The conversion between the volumetric unit and any weight-based unit depends on the actual solid wood content in the unit, a ratio which varies as previously explained. The following formula applies uhen converting to bone-dry units:
1 Volumetric Unit = basic density x SWE {ft3/vol. unit) 2,400
= BDUs
Example:
If a volumetric unit of white spruce chips contains 80 ft3 SWE {Table 32),
1 Volumetric Unit = 22 •46 x 80 = 0.75 BDUs 2,400
Similarly, when converting from volumetric units to oven-dry tons, the following formula applies:
48
1 Volumetric Unit= basic density x SWE {ft3/vol. unit) = o.d. tons 2,000
VENEER AND PLYWOOD
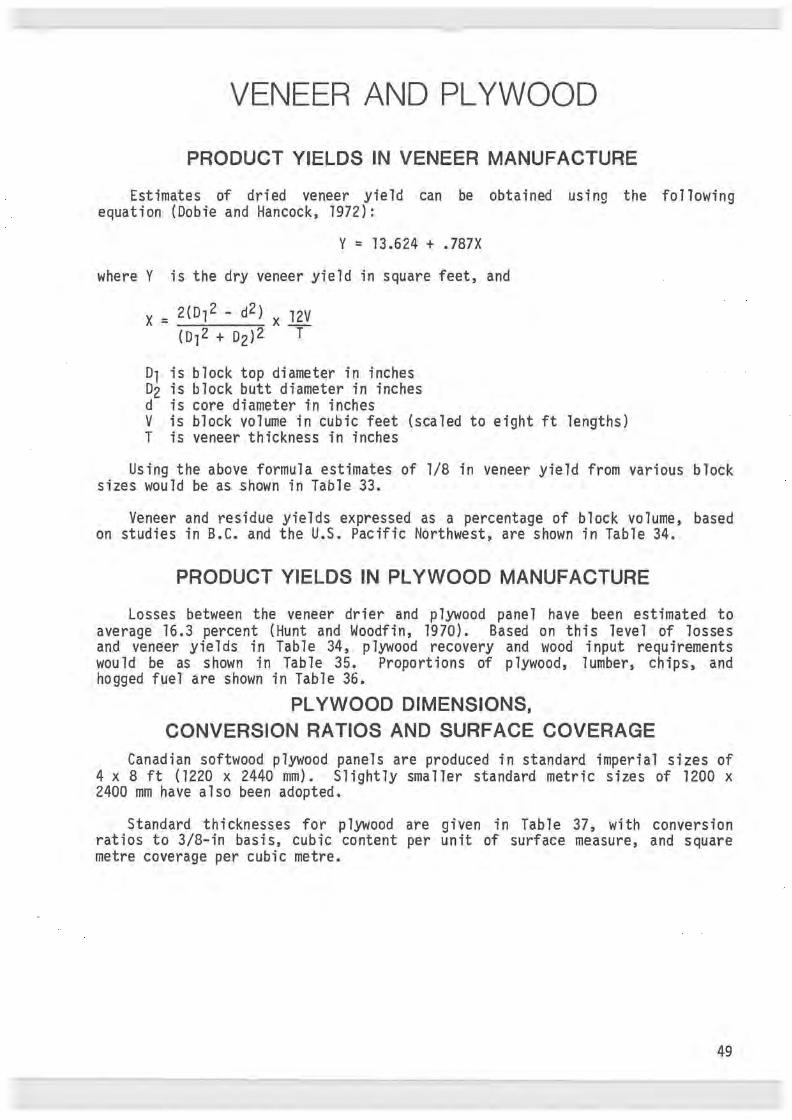
PRODUCT YIELDS IN VENEER MANUFACTURE
Estimates of dried veneer yield can be obtained using the following equation (Dobie and Hancock, 1972):
Y = 13.624 + .787X
where Y is the dry veneer yield in square feet, and
D1 is block top diameter in inches D2 is block butt diameter in inches d is core diameter in inches V is block volume in cubic feet (scaled to eight ft lengths) T is veneer thickness in inches
Using the above formula estimates of 1/8 in veneer yield from various block sizes would be as shown in Table 33.
Veneer and residue yields expressed as a percentage of block volume, based on studies in B.C. and the U.S. Pacific Northwest, are shown in Table 34.
PRODUCT YIELDS IN PLYWOOD MANUFACTURE
Losses between the veneer drier and plywood pane 1 have been estimated to average 16.3 percent (Hunt and Woodfin, 1970). Based on this level of losses and veneer yields in Table 34, plywood recovery and wood input requirements would be as shown in Table 35. Proportions of plywood, lumber, chips, and hogged fuel are shown in Table 36.
PLYWOOD DIMENSIONS, CONVERSION RATIOS AND SURFACE COVERAGE
Canadian softwood plywood panels are produced in standard imperial sizes of 4 x 8 ft (1220 x 2440 mm). Slightly smaller standard metric sizes of 1200 x 2400 mm have also been adopted.
Standard thicknesses for plywood are given in Table 37, with conversion ratios to 3/8-in basis, cubic content per unit of surface measure, and square metre coverage per cubic metre.
49
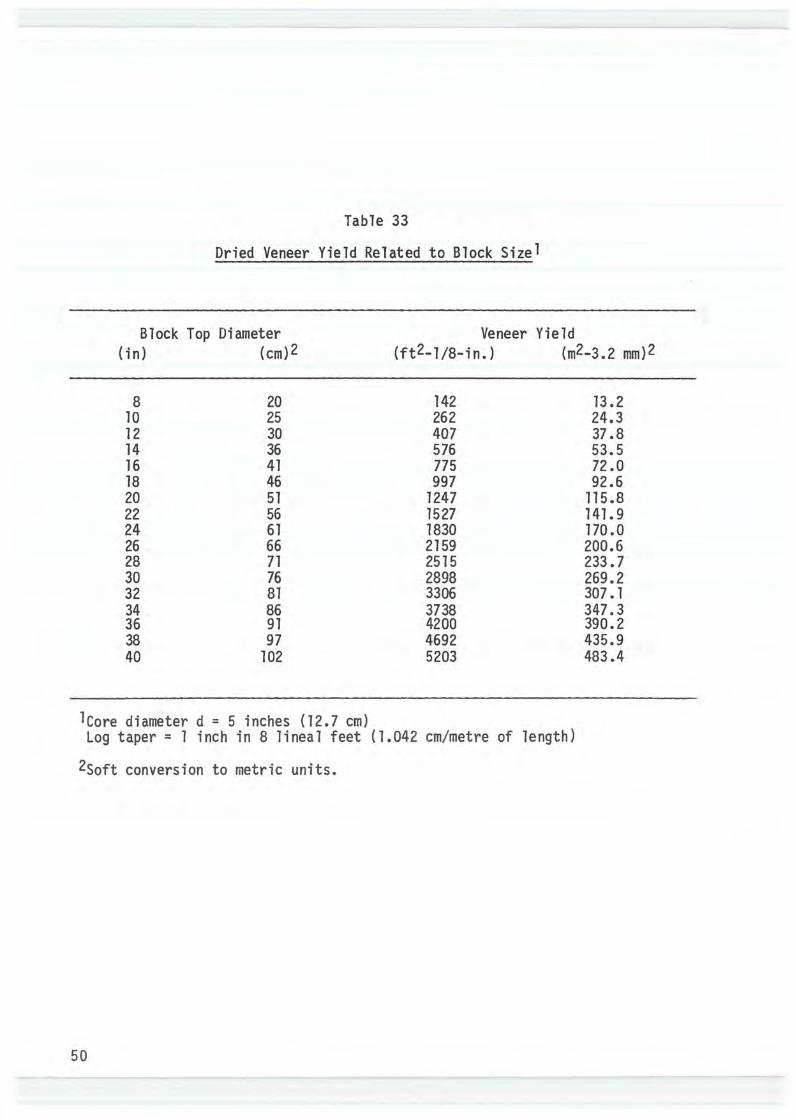
Table 33
Dried Veneer Yield Related to Block Sizel
Block Top Diameter Veneer Yield {in) (cm)2 {ft2-1/8-in.) (m2-3.2 mm)2
8 10 12 14 16 18 20 22 24 26 28 30 32 34 36 38 40
20 25 30 36 41 46 51 56 61 66 71 76 81 86 91 97
102
lcore diameter d = 5 inches {12.7 em)
142 262 407 576 775 997
1247 1527 1830 2159 2515 2898 3306 3738 4200 4692 5203
Log taper = 1 inch in 8 lineal feet {1.042 em/metre of length)
2soft conversion to metric units.
50
13.2 24.3 37.8 53.5 72.0 92.6
115.8 141.9 170.0 200.6 233.7 269.2 307.1 347.3 390.2 435.9 483.4

Table 34
Product Yields in Veneer Manufacture
Block Breakdown
Dried veneer
Below-grade veneer
Core
Round-up
Trim Shrinkage
Clipper green end
Interiorl White Spruce
59
5
4
Source: and Hancock, 1972 Fahey and \voodfin, 1982
3Lane et al., 1973 4F a hey-, 197 4
Interiorl Western2 Douglas-fir Hemlock
59
12 205
5
4
(percent)
44.4
3.8
17.5
7.7
6.6
20.0
5Includes round-up and green end clipper residue. 6Includes round-up, trim and shrinkage.
Old-Growth3 Coast
Douglas-fir
52.7
5.6
9.5
32.26
Second4 Growth
Douglas-fir
50.2
4.2
14.8
30.86
51

Table 35
Plywood Yields and Log Requirements Related to Block Diameterl
Block Top Diameter Plywood Yield Percent of Block (in) (em) (ft2-3/8 in) (m2-9.5 mm) Cubic Volume
8 20 39 3.6 38 10 25 73 6.8 47 12 30 114 10.6 52 14 36 160 14.9 55 16 41 216 20.1 57 18 46 278 25.8 58 20 51 345 32.1 59 22 56 421 39.1 60 24 61 511 47.5 61 26 66 603 56.0 61 28 71 697 64.8 61 30 76 808 75.1 62
ft2 3/8-in m2 9.5 mm m3 of m3 of Block Top Diameter plywoog per per blocks blocks
ft N ft 100 m (in) (mm) of block of block (3/8 inch) (9.5 mm)
8 20 12.38 40.6 81 2.469 10 25 15.05 49.4 66 2.012 12 30 16.64 54.6 60 1.829 14 36 17.49 57.4 57 1.737 16 41 18.15 59.5 55 1.676 18 46 18.66 61.2 53 1. 615 20 51 18.85 61.8 53 1.615 22 56 19.05 62.5 52 1. 585 24 61 19.49 63.9 51 1.554 26 66 19.66 64.5 50 1. 524 28 71 19.66 64.5 50 1.524 30 76 19.90 65.3 50 1.524
la ft (2.44 m) blocks, and 5 in or 12.7 em core.
52

Table 36
Product Yields in Plywood t4anufacture
Item
Plywood2
Lumber3
Chips
Hogged Fue14
Percent of Block Volumel
49
9
26
21
lrotal greater than 100 percent because log volume calculated under bark.
2Allows 16 percent veneer loss between drier and finished panel (Hunt and Woodfin Jr., 1970).
3Assumes a 12.7 em core for lumber manufacture.
4Assumes a 60 percent bark recovery factor and that dry-end residues go to hogged fuel.
53

Table 37
Standard Thicknesses, Conversion Ratios, and Surface Measure for Plywood
Thicknessl Ratio 'to Convert Cubic Feet Cubic Metres Imperial Metric to 3/8 inch- per per
(in) (mm) basis3 1•1 ft2 100 m2
Unsanded (sheathing and select) Grades
5/16 7.5 5/6 26.042 0.75 3/8 9.5 1 31.250 0.95 1/2 12.5 1-1/3 41.667 1.25 5/8 15.5 1-2/3 52.083 1.55 3/4 18.5 2 62.500 1.85
20.52 2.05
Sanded Grades
1/4 6 2/3 20.833 0.6 3/8 8 1 31.250 0.8 1/2 11 1-1/3 41.667 1.1 5/8 14 1-2/3 52.083 1.4
11/16 17 1-5/6 57.290 1. 7 3/4 19 2 62.500 1.9
lfrom Metric Manual for Wood Products, Canadian Wood Council.
Coverage m2/m3
133.33 105.26 80.00 64.52 54.05 48.78
166.67 125.00 90.91 71.43 58.82 52.63
220.5 mm is used to develop 19 mm sanded. in M ft2 of the specific 3This ratio is used to convert plywood volume
thickness to M ft2 on a 3/8-inch basis.
54

COMPOSITION BOARD
BOARD TYPES
A variety of wood composition boards have been developed and are now manufactured in North America. As a group, these panel products are manufactured from wood or other lignocellulosic fibers or particles to which adhesives and other materials may be added to impart the desired panel properties.
A very wide range of composition board products is theoretically possible depending on species, particle size, type and amount of adhesive, type and amount of other additives, fiber orientation, board thickness and density, and manufacturing methods and conditions. Two broad categories of boards are generally recognized, fibrous-felted and particleboards (Maloney, 1977).
Fibrous-Felted Board This panel type is made primarily from interfelted lignocellulosic fibers,
to which other materials may be added and consolidated under heat and pressure.
Traditional products belonging to this group are:
- hardboard [densities of 31 lb/ft3 (497 kg/m3) or more], and - insulation board [densities between 10 and 31 lb/ft3 (160 to 497
kg/m3)].
recently medium density fiberboard (MDF) has been developed, with a density of 31 to 50 lb/ft3 (497-800 kgfm3) and dry formed with the use of a synthetic adhesive.
Particleboard This generic term is used for panels made from lignocellulosic materials in
the form of discrete pieces or particles (as opposed to fibers) combined with synthetic resins under heat and pressure and contain other additives.
A variety of boards of this type in a wide range of densities, referred to as particleboard or chipboard is used as furniture core and floor underlayment.
recently, several new product types have emerged within the 11 particleboard 11 category. Thinboard is a thin particleboard distinguished by the continuous pressing process by which it is produced.
Waferboard is a type of particleboard composed of wafers of uniform length and thickness resembling small pieces of veneer, with exterior bond quality, and intended for structural applications. Oriented strandboard (OSB) is another structural board in which long, narrow particles or strands of wood are aligned in the surface layers parallel to the length of the board, and the core is either randomly oriented or aligned at 90° to the particle direction on the surfaces. Both waferboard and OSB are made mainly in board densities of 40 to 45 lb/ft3 (640 to 720 kg/m3).
55
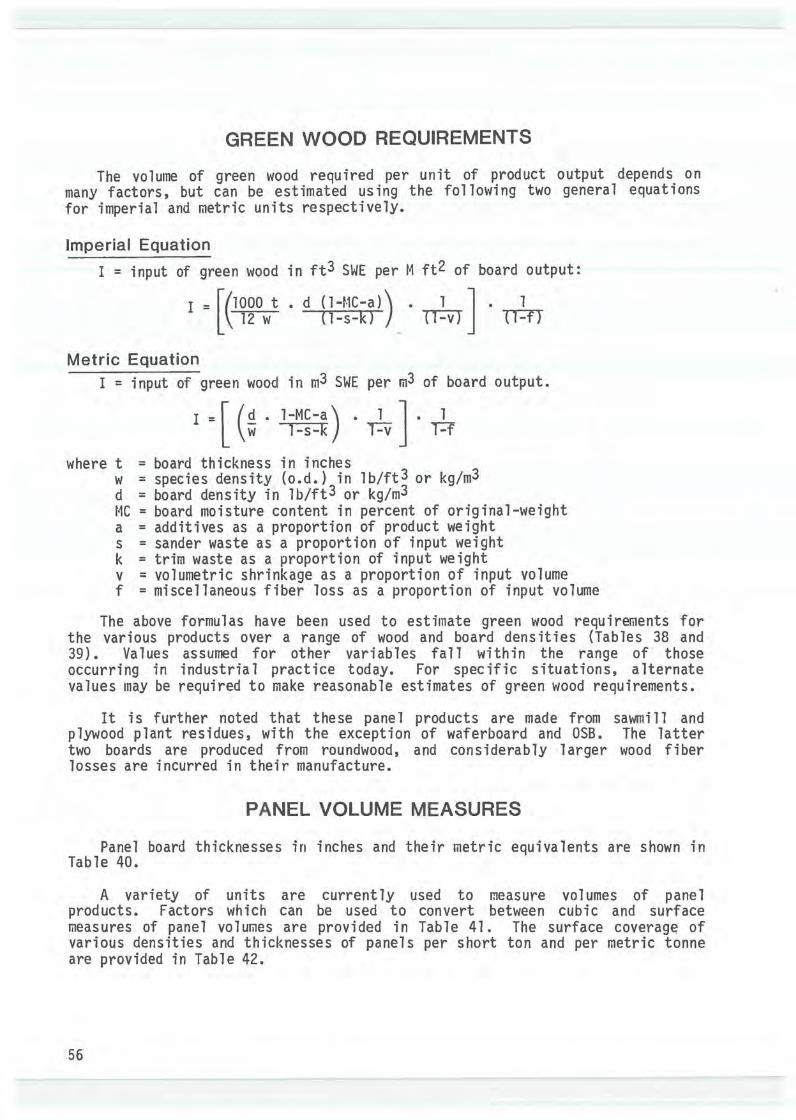
GREEN WOOD REQUIREMENTS
The volume of green wood required per unit of product output depends on many factors, but can be estimated using the following two general equations for imperial and metric units respectively.
Imperial Equation I = input of green wood in ft3 SWE per M ft2 of board output:
I = [(1000 t . d ( l-t·1C-a)) • 1 J 1 12 w (1-s-k) 11-VT 1T-fY
Metric Equation I = input of green wood in m3 SWE per m3 of board output.
I = [ • 1-MC-a) • 1 J . 1 w 1-s-k r=t where t = board thickness in inches
w =species density (o.d.) in lb/ft3 or kg/m3 d = board density in lb/ft3 or kg/m3 MC = board moisture content in percent of original-weight a = additives as a proportion of product weight s = sander waste as a proportion of input weight k = trim waste as a proportion of input weight v = volumetric shrinkage as a proportion of input volume f =miscellaneous fiber loss as a proportion of input volume
The above formulas have been used to estimate green wood requirements for the various products over a range of wood and board densities (Tables 38 and 39). Values assumed for other variables fall within the range of those occurring in industria 1 practice today. For specific situations, alternate values may be required to make reasonable estimates of green wood requirements.
It is further noted that these pane 1 products are made from sawmi 11 and plywood plant residues, with the exception of waferboard and OSB. The latter two boards are produced from roundwood, and considerably larger wood fiber losses are incurred in their manufacture.
PANEL VOLUME MEASURES
Panel board thicknesses in inches and their metric equivalents are shown in Table 40.
A variety of units are currently used to measure volumes of panel products. Factors which can be used to convert between cubic and surface measures of pane 1 vo 1 umes are provided in Tab 1 e 41 • The surface of various densities and thicknesses of panels per short ton and per metric tonne are provided in Table 42.
56

Table 38 Green Wood Requirement Per M Square Feet of Board Production
Wood Board Wood Input Board Type Density Density
and Process Variables (lb/ft3) (lb/ft3) (ft3/M ft2) (ft3/ton)
Hardboard (1/8-inch) 24 50 24.83 95.4 rn.c. = .08 s = 0 24 60 29.80 95.4
v = .08 k = • 10 28 50 21.28 81.7 a = .02 f = .05 28 60 25.54 81.7
Insulation Board (1/2-inch) 24 20 33.99 81.6 m.c. = .08 s = 0 24 30 50.98 81.6
v = .08 k = .10 28 20 29.13 69.9 a= .15 f = 0.5 28 30 43.70 69.9
Particleboard (5/8-inch) 24 40 97.58 93.7 m.c. = 0.6 s = .06 24 50 121.97 93.7
v = .08 k = • 10 28 40 83.64 80.3 a = .08 f = • 01 28 50 104.55 80.3
MDF (5/8-inch) 24 40 98.43 94.5 m. c. = • :98 24 v = .o 28 18 73 8 .37 91.5 8 . 0
a = .09 f = .03 28 45 94.91 81.0
(3/8-inch) 24 40 73.12 117.0 m.c. = .04 s = 0 24 45 82.26 117.0
v = .08 k = • 10 28 40 62.68 100.3 a = .03 f = .20 28 45 70.51 100.3
OSB (3/8-inch) 70.77 113.2 m. c. = .04 s = 0 24 45 79.61 113.2
v = .08 k = • 10 28 40 35.38 56.6 a = .06 f = .20 28 45 39.81 56.6
Note: Key to process variables shown under 11 Green Wood Requirements ...
57
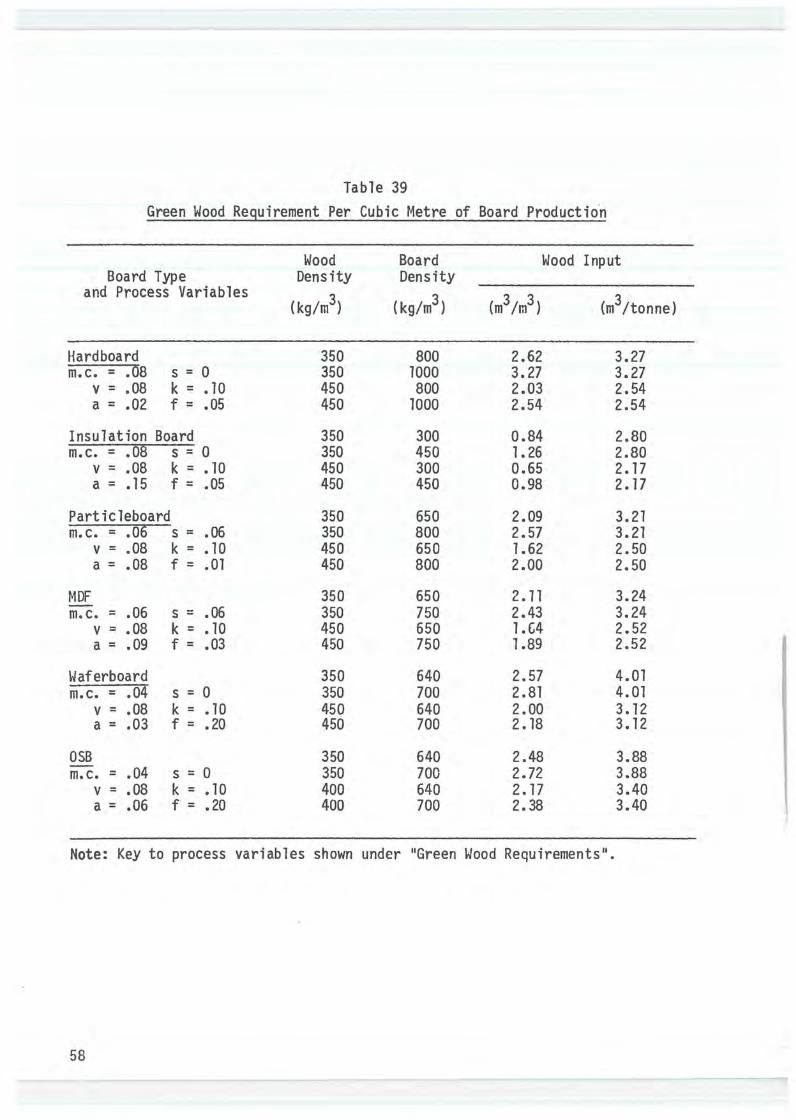
Table 39 Green Wood Requirement Per Cubic Metre of Board Productio·n
Wood Board Wood Input Board Type Density Density
and Process Variables ( kg/m3) (kg/m3) (m3/m3) (m3/tonne)
Hardboard 350 800 2.62 3.27 m.c. = .08 s = 0 350 1000 3. 27 3.27
v = .08 k = .10 450 800 2.03 2.54 a = .02 f = .05 450 1000 2.54 2.54
Insulation Board 350 300 0.84 2.80 m.c. = .08 s = 0 350 450 1.26 2.80
v = .08 k = .10 450 300 0.65 2.17 a= .15 f = .05 450 450 0.98 2.17
Particleboard 350 650 2.09 3.21 m.c. = .06 s = .06 350 800 2.57 3.21
v = .08 k = .10 450 650 1.62 2.50 a = .08 f = • 01 450 800 2.00 2.50
MDF 350 650 2.11 3.24 m.c. = .06 s = .06 350 750 2.43 3.24
v = .08 k = • 10 450 650 l.C4 2.52 a = .09 f = .03 450 750 1.89 2.52
Waferboard 350 640 2.57 4.01 m.c. = .04 s = 0 350 700 2.81 4.01
v = .08 k = .10 450 640 2.00 3.12 a = .03 f = .20 450 700 2.18 3.12
OSB 350 640 2.48 3.88 m.c. = .04 s = 0 350 700 2.72 3.88
v = .08 k = • 10 400 640 2.17 3.40 a = .06 f = .20 400 700 2. 38 3.40
Note: Key to process variables shown under "Green Wood Requirements".
58

Table 40
Board Thicknesses
inches mrn inches mm
1/8 3.2 9/16 14.3 3/16 4.8 5/8 15.9 1/4 6.4 11/16 17.5 3/8 9.5 3/4 19. 1 7/16 11.1 7/8 22.2 1/2 12.7 1 25.4
Table 41
Conversion of Various Panel Volume Measures
Product Cubic Cubic 1,000 and Unit Metres Feet Board Feet
Surface Measures
1,000 m2 (1 mm basis) 1 35.315 0.424
1,000 ft2 (1/8 in basis) 0.295 10.417 0.125
1000 ft2 (3/8 in basis) 0.885 31.25 0.375
1000 ft2 (1/2 in basis) 1.180 41.667 0.5
1000 ft2 (5/8 in basis) 1. 475 52.083 0.625
59
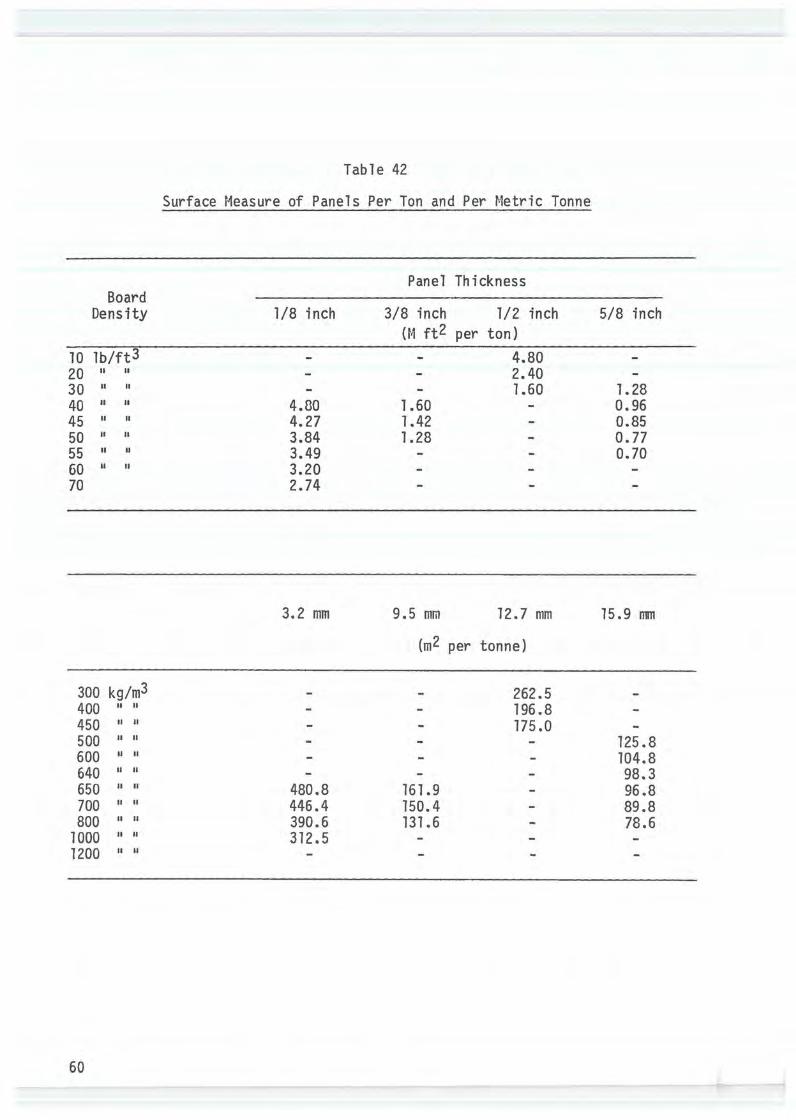
Table 42
Surface of Panels Per Ton and Per Tonne
Panel Thickness Board
Density 1/8 inch 3/8 inch 1/2 inch 5/8 inch (N ft2 per ton)
10 lb/ft3 4.80 20 2.40 30 1.60 1.28 40 4.30 1.60 0.96 45 4.27 1.42 0.85 50 3.84 1.28 0. 77 55 3.49 0.70 60 3.20 70 2.74
3.2 mm 9.5 mm 12.7 mm 15.9 111111
(m2 per tonne)
300 kg/m3 262.5 400 196.8 450 175.0 500 125.8 600 104.8 640 98.3 650 480.8 161.9 96.8 700 446.4 150.4 89.8 800 390.6 131.6 78.6
1000 312.5 1200
60

PULP PULP YIELDS FROM WESTERN SPECIES
The yield of unbleached kraft pulp from pulp chips is estimated at the percentages shmm in Table 43. Yields from sawdust and planer shavings are about two percent lower.
pulp yields vary somewhat, depending on the specific process. Typical pulp yields for the most commonly employed processes are listed below.
stone groundwood pulp refiner mechanical pulp thermomechanical pulp chemimechanical pulp
Yield (%)
95 94 - 95 92 - 94 88 - 93
GREEN WOOD REQUIREMENTS PER TON (TONNE) OF PULP
Based on the pulp yields in Table 43 and the wood density for the species (Table 8), green wood requirements per short ton and per metric tonne of pulp would be as indicated in Table 44.
Chip volume requirements in volumetric units per short ton and metric tonne of pulp output are species-dependent. Estimated requirements are shown in Table 45.
Chip volume requirements in BDU per short ton or metric tonne of pulp output are independent of species density. Estimated chip requirements in BDUs are directly dependent on pulp yield as shown in Table 46.
61
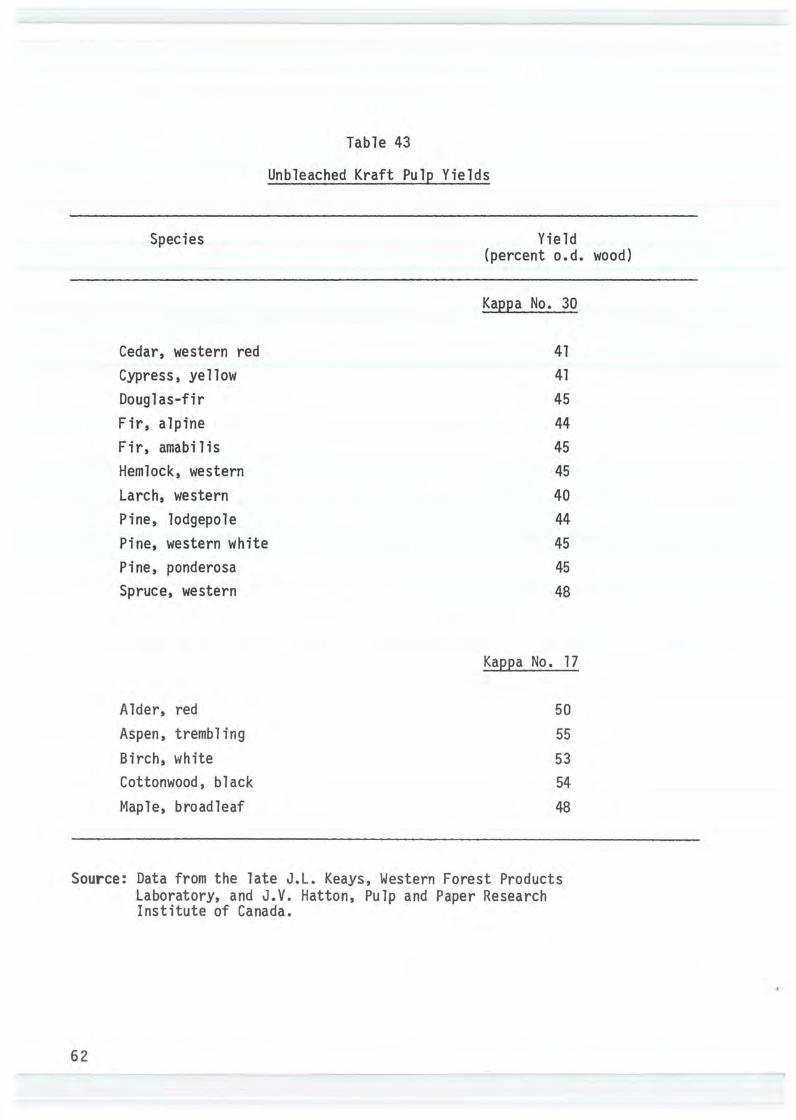
Species
Cedar, western red Cypress, yellow Douglas-fir Fir, alpine Fir, amabilis Hemlock, western Larch, western Pine, lodgepole Pine, western white Pine, ponderosa Spruce, western
Alder, red Aspen, trembling Birch, white Cottonwood, black Maple, broadleaf
Table 43
Unbleached Kraft Pulp Yields
Yield (percent o.d.
Kappa No. 30
41 41 45 44 45 45 40 44 45 45 48
Kappa No. 17
50 55 53 54 48
Source: Data from the late J.L. Keays, Western Forest Products Laboratory, and J.V. Hatton, Pulp and Paper Research Institute of Canada.
62
wood)

Table 44 Green Wood Requirements for Pulp Production
Kraft Pulpl Mechanical Pulpl, 3 Species Unbleached Bleached2
ft3; short ton
m3; tonne
ft3; short ton
m3; tonne
ft3f short ton
m3; tonne
Cedar, western red 214 6.68 277 7.09 92 2.88 Cypress, yellow 168 5.24 179 5.57 72 2.26 Douglas-fir 142 4.43 152 4.74 67 2.11 Fir, alpine 199 6.22 212 6.62 92 2.88 Fir, amabilis 170 5.31 181 5.65 81 2.51 Hemlock, western 152 4.74 161 5.03 72 2.24 Larch, western 160 5.00 170 5.32 67 2.11 Pine, lodgepole 160 5.00 171 5.32 74 2.32 Pine, western white 181 5.65 192 6.00 86 2.67 Pine, ponderosa 165 5.15 176 5.49 78 2.44 Spruce, western 167 5.21 178 5.56 84 2.63
A 1 der, red 155 4.83 164 5.13 81 2.54 Aspen, trembling 140 4.38 149 4.66 81 2.53 Birch, white 108 3.36 114 3.57 60 1.87 Cottonwood, black 158 4.93 168 5.25 90 2.80 Maple, broad1eaf 129 4.03 137 4.28 65 2.03
1Air dry pulp at 10 percent MC 0'1
2Assumes 6 percent loss in bleaching w 3Assumes 95 percent yield

Table 45 Volumetric Units1 of Chips Required for Pulp Production
Kraft Pulp Pulp Species Unbleached Bleached2
GPU/ton GPU7tonne GPU7ton GPU7tonne GPU/ton GPU/tonne
Cedar, western red 2.67 2.95 2.84 3.13 1.15 1.27 Cypress, yellow 2.10 2.32 2.24 2. 47 0.90 0.99 Douglas-fir 1. 77 1.96 1.90 2.09 0.84 0.92 Fir-alpine 2.49 2.74 2.65 2.92 1.15 1.27 Fir, amabi lis 2.12 2.34 2. 26 2. 49 1.01 1.12 Hemlock, western 1.90 2.09 2.01 2.22 0.90 0.99 Larch, western 2.00 2.21 2.13 2.34 0.84 0.92 Pine, lodgepole 2.00 2.21 2.14 2. 36 0.93 1.02 Pine, western white 2. 26 2.49 2.40 2.65 1.08 1.19 Pine, ponderosa 2.06 2.27 2.20 2.43 0.98 1.07 Spruce, western 2.09 2.30 2. 36 2.60 1.05 1.16
Alder, red 1.94 2.14 2.05 2.26 1.01 1.12 Aspen, trembling 1.75 1.93 1.86 2.05 1.01 1.12 Birch, white 1.35 1. 49 1.42 1.57 0.75 0.83 Cottonwood, black 1.97 2.18 2.10 2.31 1.12 1.24 Maple, broadleaf 1.61 1.78 1.71 1.89 0.81 0.90
lA volumetric unit or 11 gravity packed unit 11 (GPU) of chips occupying 200 ft3 of space is assumed to contain 80 ft3 of solid wood.
2Assumes: - air dry pulp at 10 percent MC - 6 percent loss in bleaching Kraft pulp - mechanized pulp yield at 95 percent.
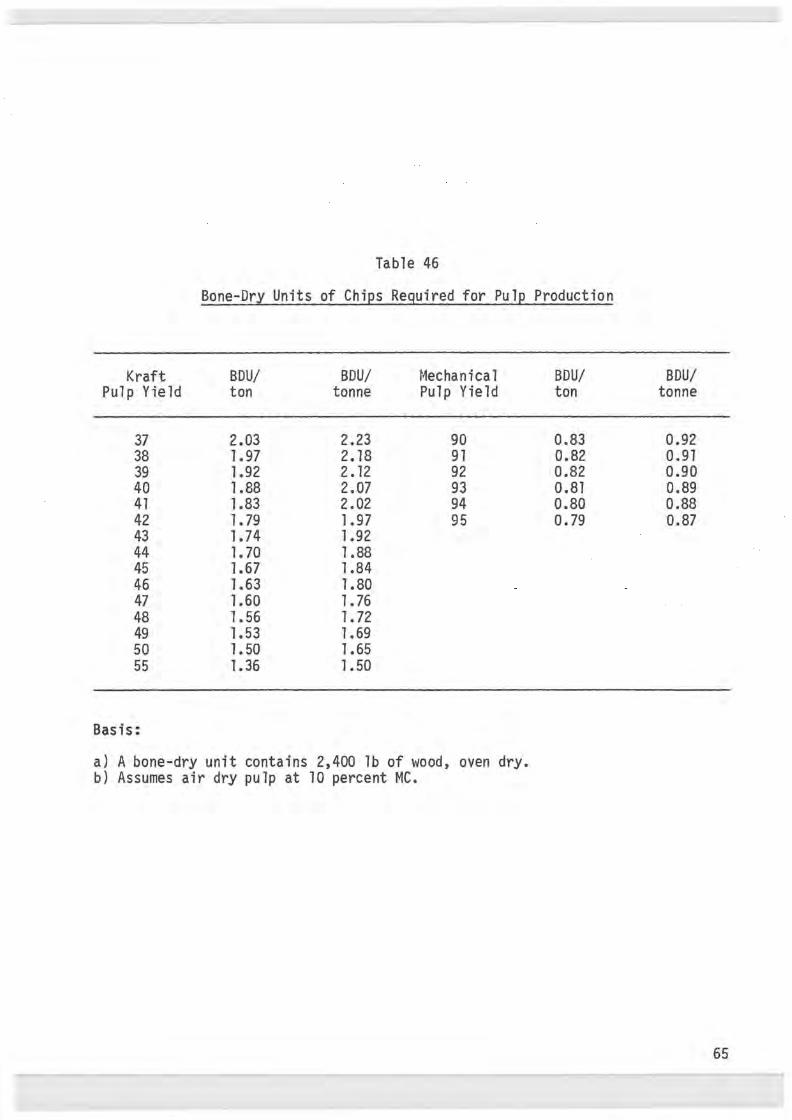
Table 46
Bone-Dry Units of Chips Required for Pulp Production
Kraft BDU/ BDU/ 1 BDU/ BDU/ Pulp Yield ton tonne Pulp Yield ton tonne
37 2.03 2.23 90 0.83 0.92 38 1.97 2.18 91 0.82 0.91 39 1.92 2.12 92 0.82 0.90 40 1.88 2.07 93 0.81 0.89 41 1.83 2.02 94 0.80 0.88 42 1. 79 1.97 95 0. 79 0.87 43 1.74 1.92 44 1.70 1.88 45 1.67 1.84 46 1.63 1.80 47 1.60 1. 76 48 1.56 1.72 49 1.53 1.69 50 1. 50 1.65 55 1.36 1.50
Basis:
a) A bone-dry unit contains 2,400 1b of wood, oven dry. b) Assumes air dry pulp at 10 percent MC.
65
66
SHINGLES AND SHAKES
SHINGLE AND SHAKE SIZES AND UNITS OF MEASURE
The shingle and shake industry is n0\'1 producing products in metric sizes which represent soft conversions from the imperia 1 measurement system. The standard lengths and thicknesses are shown in Tables 47 and 48. Most shingles and shakes are produced in random widths.
The basic measurement unit for shingles and shakes in both imperial and metric is the 11 bundle 11
• A bundle contains a specified number of courses of shingle or shake butts at each end of the bundle (Tables 47 and 48}. A bundle contains sufficient shingles or shakes to cover specified areas per bundle for given exposures. Shingle and shake coverage in square metres per bundle are shown in Tables 49 and 50.
Traditionally, shingles and shakes have been sold by the "square 11, a volume
which, by definition, covered 100 ft2 of surface at specified exposures. For shingles, there are four bundles per square and for shakes, five bundles per square. The square is still used for most export shipments and to record industry production.
SHINGLE, SHAKE, AND RESIDUE YIELDS
The cubic volume of a bundle and product yields per unit of log input are shown in Tables 51 and 52 for shingles and shakes, respectively. Approximate proportions of the log converted to residues are as follows:
Shingles Shakes (%} (%)
Chips 27 27 Sawdust 33 23 Bark 6 6 Hog fuel (sawdust and bark} 39 29
67
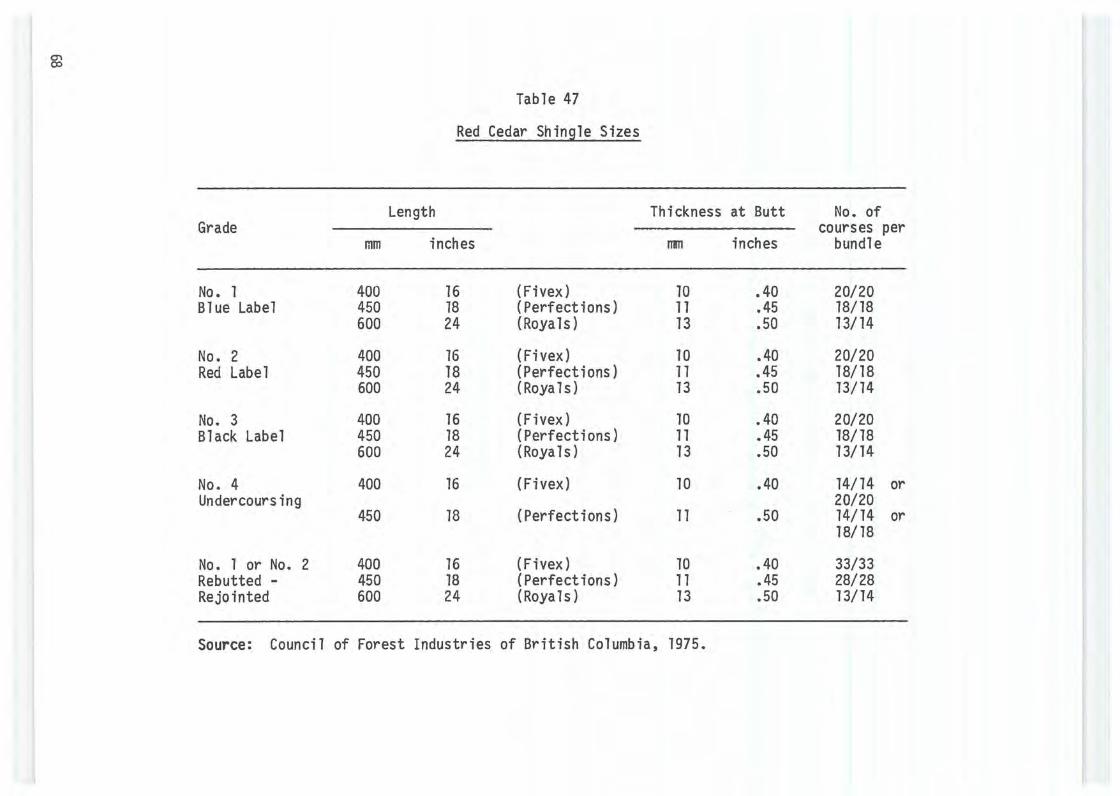
en (X)
Table 47
Red Cedar Shingle Sizes
Length Thickness at Butt Grade
mm inches mn inches
No. 1 400 16 (Fivex) 10 • 40 Blue Label 450 18 (Perfections) 11 .45
600 24 (Royals) 13 .50
No. 2 400 16 (Fivex) 10 .40 Red Label 450 18 (Perfections) 11 .45
600 24 (Royals) 13 .50
No. 3 400 16 (Fivex) 10 • 40 Black Label 450 18 (Perfections) 11 .45
600 24 (Royals) 13 .50
No. 4 400 16 (Fivex) 10 .40 Undercours ing
450 18 (Perfections) 11 .50
No. 1 or No. 2 400 16 (Fivex) 10 .40 Rebutted - 450 18 (Perfections) 11 .45 Rejoin ted 600 24 (Royals) 13 .50
Source: Council of Forest Industries of British Columbia, 1975.
No. of courses per
bundle
20/20 18/18 13/14
20/20 18/18 13/14
20/20 18/18 13/14
14/14 or 20/20 14/14 or 18/18
33/33 28/28 13/14

m
Table 48
Red Cedar Handsplit Shake Sizes
Length and Thickness Grade Type
(mm) (inches)
No. 1 Starter-Finish Course 380 15 Handsplit Medium Resawn 450 X 13 18 X 1/2 and Resawn Heavy Resawn 450 X 19 18 X 3/4
Handsplit 600 X 9 24 X 3/8 t4edium Resawn 600 X 13 24 X 1/2 Heavy Resawn 600 X 19 24 X 3/4
No. 1 Tapersplit 600 X 13 24 X 1/2 Tapersplit
No. 1 True-Edgel 450 X 9 18 X 3/8 Straight-Split Straight-Split 450 X 9 18 X 3/8
Straight-Split 600 X 9 24 X 3/8
lExclusively sidewall product with parallel edges 2packed in 505 mm (20 inch) wide frames
Source: Council of Forest Industries of British Columbia, 1975.
No. of courses per bundle
465 mm ( 18 inch) pack
9/9 9/9
9/9 9/9 9/9
9/9
14 Straight2 19 Stra i ght2 16 Straight2
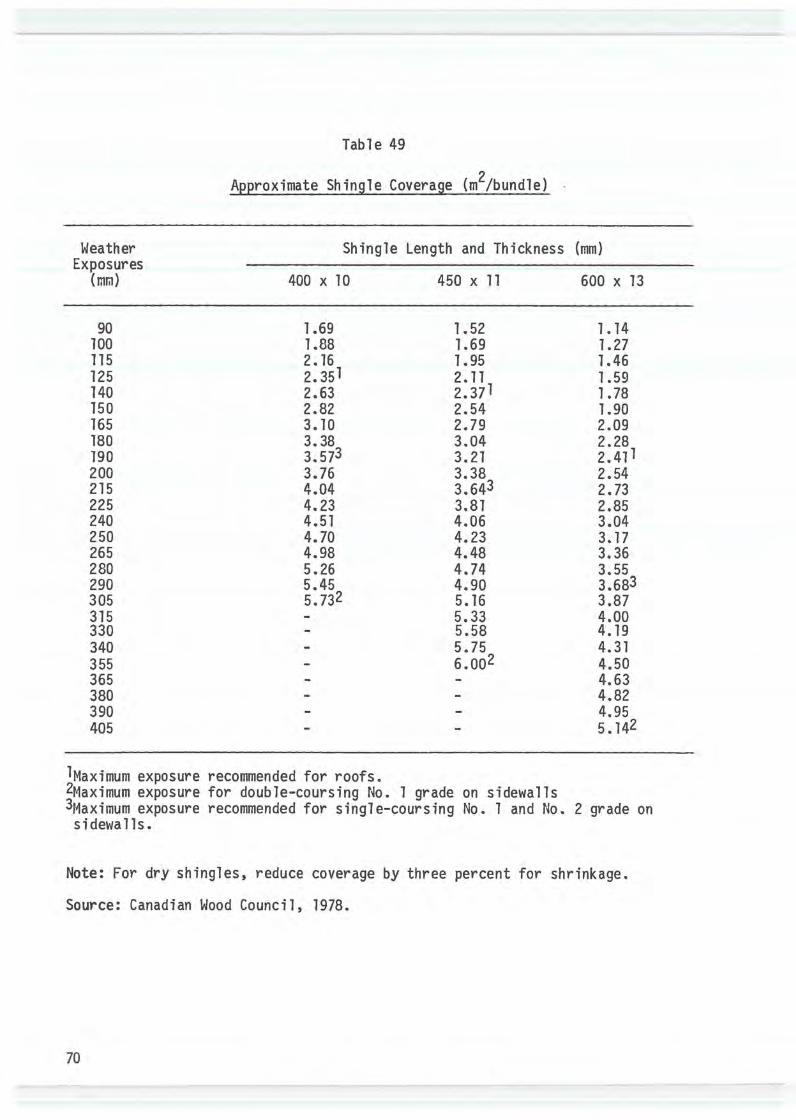
Table 49
Approximate Shingle Coverage (m2/bundle) -
Weather Shingle Length and Thickness (mm) Exposures
(mm) 400 X 10 450 X 11 600 X 13
90 1.69 1.52 1.14 100 1.88 1.69 1.27 115 2.16 l. 95 1.46 125 2.351 2.11 1.59 140 2.63 2.371 1.78 150 2.82 2.54 1.90 165 3.10 2.79 2.09 180 3.38 3.04 2.28 190 3.573 3.21 2.411 200 3.76 3.38 2.54 215 4.04 3.643 2.73 225 4.23 3.81 2.85 240 4.51 4.06 3.04 250 4.70 4.23 3.17 265 4.98 4.48 3.36 280 5.26 4.74 3.55 290 5.45 4.90 3.683 305 5.732 5.16 3.87 315 5.33 4.00 330 5.58 4.19 340 5.75 4.31 355 6.oo2 4.50 365 4.63 380 4.82 390 4.95 405 5.142
lMaximum exposure recommended for roofs. 2Maximum exposure for double-coursing No. l grade on sidewalls
exposure recommended for single-coursing No. l and No. 2 grade on sidewalls.
Note: For dry shingles, reduce coverage by three percent for shrinkage.
Source: Canadian Wood Council, 1978.
70

Table 50
Shakes (m 2.tbundle)
-Shake Size Approximate coverage in m2 of one bundle of handsplit shakes Length and based on the following weather exposures Thickness 140 mm 165 mm 180 nun 190 mm 200 nun 215 mm 250 mm 290 mm 330 mm 355 mm
450 x 13 mm medium resawn 1021 1.21 1. 32 1.392 1.46 1.576 1.83 2.12 2.41 2.604
450 x 19 mm heavy resawn 1.021 1.21 1.32 1. 392 1.46 1. 576 1.83 2.12 2.41 2.604
600 x 9 mm handsplit - 1.21 1. 32 1.393 1.46 1.57 1.835 2.126 - -600 x 13 mm medium resawn - 1.21 1.32 1.391 1.46 1.57 1.832 2.126 2.41 2.60 600 x 19 mm heavy resawn - 1. 21 1.32 1. 391 1.46 1.57 1.832 2.126 2.41 2.60 600 x 13 mm tapersplit - 1. 21 1.32 1.319 1.46 1.57 1.832 2.126 2. 41 2.60 450 x 9 mm true-edge- - - - - - - - - - 2.27
straight-split 450 x 9 mm straight-split 1.221 1.43 1.56 1.651 1. 74 1.876 2.17 2.52 2.87 3.08 600 x 9 mm straight-split - 1. 21 1.32 1.391 1.46 1.57 1.83 2.12 2.41 2.60 300 mm starter-finish course Use supplementary with shakes applied not over 250 mm weather exposure.
1t1aximum exposure recommended for 3-ply roof construction. 2rtaximum exposure recommended for 2-ply roof construction. 3naximum exposure recommended for roof pitches of 18° to 33.5°. 4rtaximum exposure recommended for double-coursing on sidewalls. 5rtaximum exposure recommended for roof pitches of 33.5 o or steeper. 6r1aximum exposure recommended for single-coursing on sidewalls.
Source: Metric Manual for Wood Products, Canadian Wood Council, 1978. "'"-.1 .........
380 mm 405 mm
2.78 2.96 2.78 2.96 2.78 2.96 2.43 2.594
3.30 3.524
2.78 2.96

Table 51
Volume Content and Log Volume Requirements for Red Cedar Shingles
m3 ft3 Bundles Bundles Shingle Type per per per
bundle 1 bundle m log2 cunit2
Fivex .0432 1.53 9.26 26.22 Perfection .0477 1.68 8.39 23.76 Royal • 0557 1.97 7.18 20.33 Undercourse:
400 mm ( 16 inches) .0299 1.06 13.38 37.89 450mm (18 .0378 1.33 10.58 29.96 600 mm (24 inches .0526 1.86 7.60 21.52
Source: lcanadian Forest Products Ltd., Vancouver, B.C.
2sased on recovery of 40 percent of log volume.
72

....... (;.)
Table 52
Volume content and Log Volume Requirements for Red Cedar Shakes
Size m3 per ft3 per Shake Bundles Type (mm) (inches) Bundle Bundle m3 log
Heavy resawn 600 X 19 24 X 3/4 .0524 1.85 9.54 450 X 19 18 X 3/4 .0444 1.57 11.26
Medium resawn 600 X 13 24 X 1/2 .0474 1.67 10.55 450 X 13 18 X 1/2 .0355 1.25 14.08
Straight split 600 X 9 24 X 3/8 .0382 1.35 13.09
1Based on recovery of 50 percent of log volume •
Bundles cunit
27.01 31.88
29.87 39.87
37.07

74

ENERGY HIGHER HEATING VALUES OF WOOD AND BARK
Higher heating values of wood and bark fuels are expressed in British therma 1 units per pound (BTU/lb} or megajoules per kilogram (MJ/kg}. Heating values for o.d. wood and bark for the most common western Canadian species are provided in Table 53. Heat values per unit of wood weight do not vary greatly between species. However, when expressed on a volume basis the heating value of wood varies more widely due to the effect of species density, as sho\'m in Table 54. In general, dense species provide higher heating values per unit of volume than less dense species.
BURNING EFFICIENCY AND MOISTURE CONTENT
Losses associated with the burning of wood reduce the recoverable heat below that shown in the above tables. These losses primarily reflect the efficiency of the burner system, the humidity of the combustion air, and the moisture content of the wood. Using the wood fuel value calculation methods outlined by Curtis (1976}, o.d. wood has a burning efficiency of about 80 percent. As moisture content increases, burning efficiency decreases, as does the net usable heat (Table 55}. These values should be used as approximations only, being dependent on assumptions concerning heat 1 oss ca 1 culations. Ince ( 1979} has outlined a more deta i 1 ed method of estimating recoverable heat accounting for: the effects of moisture, the effects of hydrogen in the fuel, heat lost via dry gas and excess air, and conventional heat loss.
HEATING VALUES FOR FOSSIL FUELS
The energy contents and approximate industrial burning efficiencies of some common fossil fuels are provided in Table 56 for comparison.
AVAILABLE HEAT IN HOG FUEL
The heat available from burning hog fuel depends largely on the combined effects of species, proportions of wood and bark, and the moisture content of individual components of the fuel mix (bark, sawdust, shavings}. Estimated gross heating values for various hog fuel mixtures are given in Table 57. Recoverable heat can be estimated by multiplying these values by the appropriate 11% of higher heating value 11 in Table 55 if the average moisture content of the fuel is known.
75
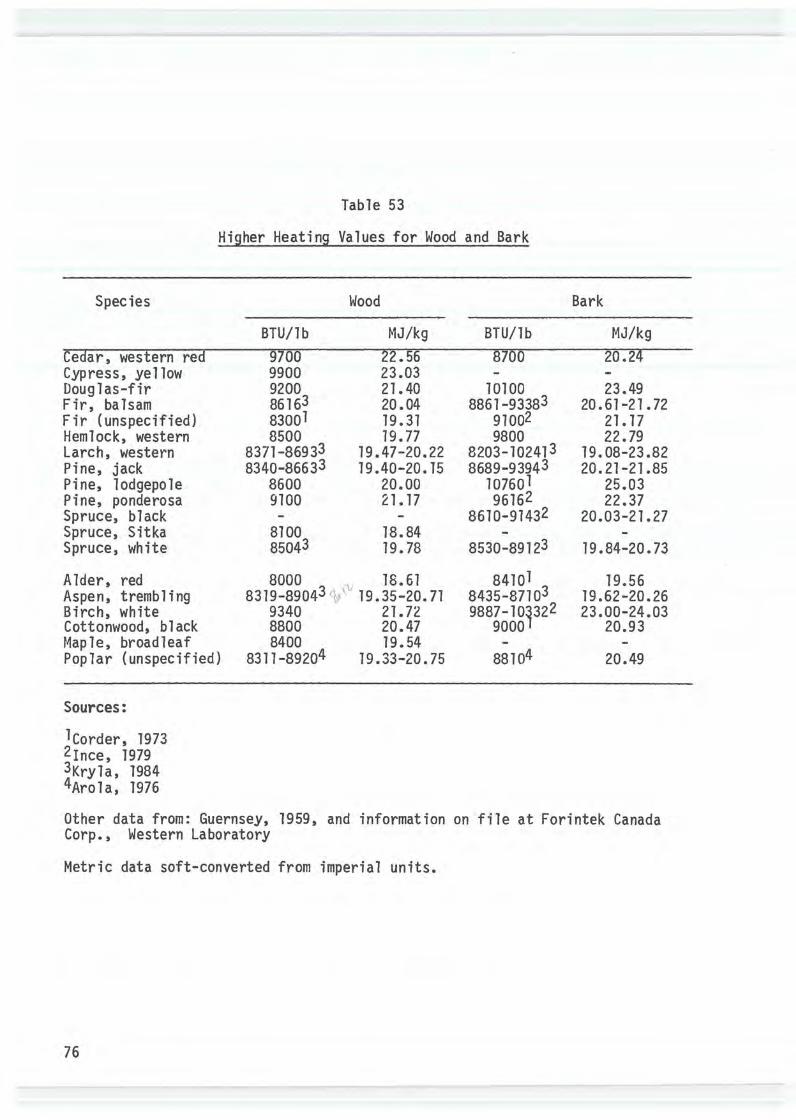
Table 53
Higher Heating Values for Wood and Bark
Species Wood Bark
BTU/lb BTU/lb MJ/kg Cedar, western red 9700 22.56 8700 20.24 Cypress, yellow 9900 23.03 Douglas-fir 9200 21.40 10100 23.49 Fir, balsam 86163 20.04 8861-93383 20.61-21.72 Fir (unspecified) 83001 19.31 91002 21.17 Hemlock, western 8500 19.77 9800 22.79 Larch, western 8371-86933 19.47-20.22 8203-102413 19.08-23.82 Pine, jack 8340-86633 19.40-20.15 8689-93943 20.21-21.85 Pine, lodgepole 8600 20.00 107601 25.03 Pine, ponderosa 9100 21.17 96162 22.37 Spruce, black 8610-91432 20.03-21.27 Spruce, Sitka 8100 18.84 -Spruce, white 85043 19.78 8530-89123 19.84-20.73
Alder, red 8000 18.61 84101 19.56 Aspen, trembling 8319-89043 19.35-20.71 8435-87103 19.62-20.26 Birch, white 9340 21.72 9887-lop22 23.00-24.03 Cottonwood, black 8800 20.47 9000 20.93 Maple, broadleaf 8400 19.54 -Poplar (unspecified) 8311-89204 19.33-20.75 88104 20.49
Sources:
lcorder, 1973 2rnce, 1979 3Kryla, 1984 4Aro 1 a, 1976
Other data from: Guernsey, 1959, and information on file at Forintek Canada Corp., Western Laboratory
Metric data soft-converted from imperial units.
76

Table 54
Higher Heating Values Per Unit Volumel
Million Mi 11 ion Species
BTU/cord2 BTU/GPU3 MJ/m3
Cedar, western red 16.927 14.537 7422 Cypress, yellow 22.005 18.899 9650 Douglas-fir 21.959 18.859 9630 Fir, alpine 14.484 12.439 6353 Fir, amabilis 16.593 14.251 7280 Fir, balsam 15.306 13. 145 6713 Hemlock, western 19.074 16.381 8363 Larch, western 20.364 17.489 8930 Pine, jack 18.983 16.303 8325 Pine, lodgepole 18.655 16.021 8180 Pine, ponderosa 18.726 16.083 8214 Spruce, Sitka 14.906 12.802 6537 Spruce, white 16.235 13.943 7121
Alder, red 15.830 13.596 6942 Aspen, trembling 17.084 14.672 7491 Birch, white 25.063 21.525 10990 Cottonwood, black 15.783 13.555 6919
1 e, broad leaf 20.763 17.832 9106 Poplar, balsam 15.407 13.232 6774
lsased on wood in oven-dry condition 2sased on 85 ft SWE/cord 3sased on 73 ft3 SWE/GPU
77
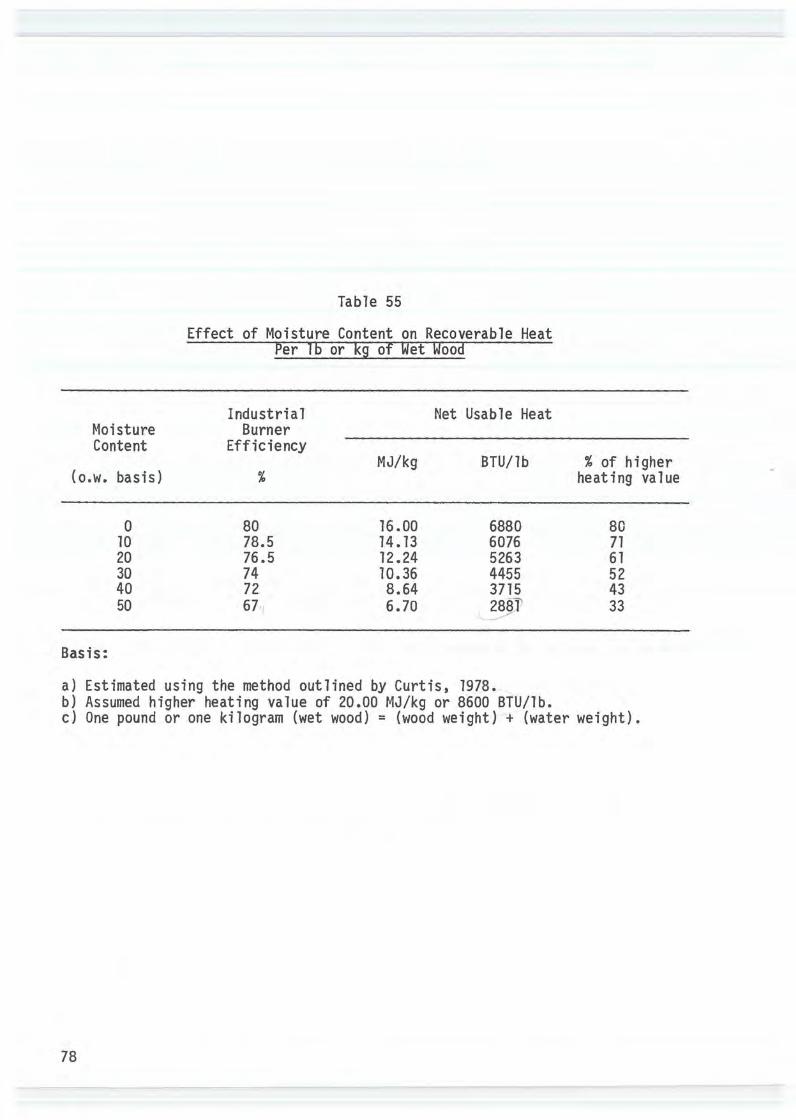
Content
( o.w. basis)
0 10 20 30 40 50
Basis:
Table 55
Effect of Moisture Content on Recoverable Heat Per lb or kg of Wet Wood
Industrial Burner
Efficiency
%
80 78.5 76.5 74 72 67·
MJ/kg
16.00 14.13 12.24 10.36 8.64 6.70
Net Usable Heat
BTU/lb
6880 6076 5263 4455 3715
a) Estimated using the method outlined by Curtis, 1978.
% of higher heating value
80 71 61 52 43 33
b) Assumed higher heating value of 20.00 MJ/kg or 8600 BTU/lb. c) One pound or one kilogram (wet wood) = (wood weight)+ (water weight).
78

Table 56
Energy Content of Conventional Fuels
Industrial Fuel Type Units Energy Conversion
{million BTU) Efficiency {%)
Coal: 87 Anthracite ton 25.4 Can. Bituminous II 25.2 Subbituminous II 17.0 Lignite II 13.2
LPG barrel 4.095 85 Crude Oil II 5.803 Light fuel oil II 5.827 82 Heavy fuel oil II 6.287 87 Natural gas 1,000 ft 3 1.0 - 1.07 85 Electricity 1,000 kwh 3.412 100
Source: Canada Dept. Energy, Mines and Resources, 1977.
79

Table 57
Heat Available in Hog Fuel (oven dry}
Percentage Bark Content Species
40 60 40 60
BTU/lb Mi 11 ion BTU/GPU
Douglas-fir 9560 9740 20.41 21.21
Western hemlock 9020 9280 19.38 20.97
Western red cedar 9300 9100 14.07 13.83
Lodgepole pine 9464 9896 19.70 21.68
spruce 8590 8635 15.47 16.25
t4J/kg MJ/m3
Douglas-fir 22.24 22.66 3806 3955
Western hemlock 20.98 21.59 3613 3910
Western red cedar 21.63 21. 17 2620 2575
Lodgepole pine 22.01 23.02 3671 4042
White spruce 19.98 20.08 2885 3030
Basis:
heating values for wood and bark from Table 53.
2wood and bark densities from Tables 8 and 17 respectively.
40 60
Million BTU/BDU
22.94 23.38
21.65 22.27
22.32 21.84
22.71 23.75
20.62 20.72
GJ/tonne
22.24 22.66
20.98 21.59
21.63 21.17
22.01 23.02
19.98 20.08
3A gravity packed unit (GPU} contains 73 ft3 solid v1ood equivalent.
4one cubic metre of gravity packed hog fuel contains 0.365 m3 solid wood equivalent.
5one gigajoule (GJ} = 109 joules.
80
MISCELLANEOUS
Saw Gauges Decimal Equivalents t4etri c Prefixes t·1etric Conversion Factors
Geometric Formulas Botanical Names of Western Tree Species
81
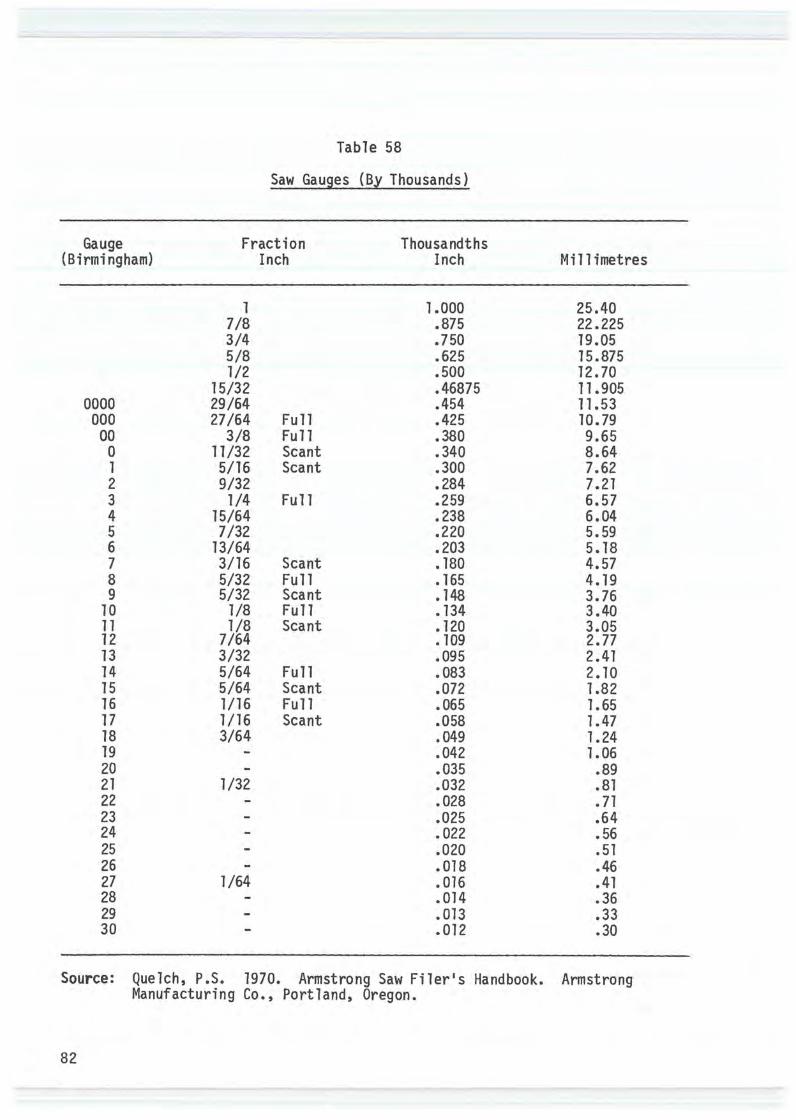
Table 58
Saw Gauges {By Thousands)
Gauge Fraction Thousandths {Birmingham) Inch Inch Millimetres
1 1.000 25.40 7/8 .875 22.225 3/4 .750 19.05 5/8 .625 15.875 1/2 .500 12.70
15/32 .46875 11.905 0000 29/64 .454 11.53 000 27/64 Full .425 10.79
00 3/8 Full .380 9.65 0 11/32 Scant .340 8.64 1 5/16 Scant .300 7.62 2 9/32 .284 7.21 3 1/4 Full .259 6.57 4 15/64 .238 6.04 5 7/32 .220 5.59 6 13/64 .203 5.18 7 3/16 Scant .180 4.57 8 5/32 Full • 165 4.19 9 5/32 Scant • 148 3.76
10 1/8 Full • 134 3.40 11 1/8 Scant • 120 3.05 12 7/64 • 109 2.77 13 3/32 .095 2.41 14 5/64 Full .083 2.10 15 5/64 Scant .072 1.82 16 1/16 Full .065 1.65 17 1/16 Scant .058 1.47 18 3/64 .049 1.24 19 .042 1.06 20 .035 .89 21 1/32 .032 • 81 22 .028 • 71 23 .025 .64 24 • 022 • 56 25 .020 .51 26 .018 .46 27 1/64 • 016 .41 28 .014 .36 29 .013 .33 30 .012 .30
Source: Quelch, P.S. 1970. Armstrong Saw Filer•s Handbook. Manufacturing Co., Portland, Oregon.
Armstrong
82
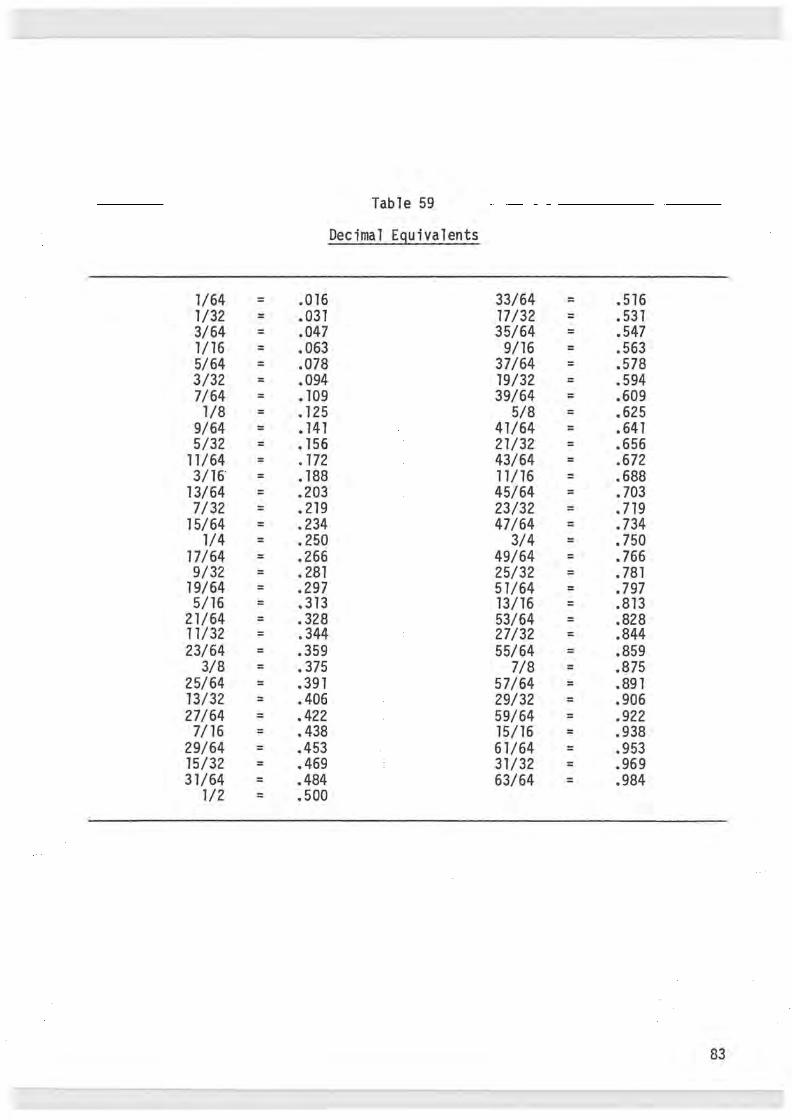
Table 59
Decimal Equivalents
1/64 = .016 33/64 = .516 1/32 = .031 17/32 = .531 3/64 = .047 35/64 = .547 1/16 = .063 9/16 = .563 5/64 = .078 37/64 = .578 3/32 = .094 19/32 = .594 7/64 = .109 39/64 = .609 1/8 = • 125 5/8 = .625
9/64 = .141 41/64 = .641 5/32 = • 156 21/32 = .656
11/64 = • 172 43/64 = .672 3/16" = • 188 11/16 = .688
13/64 = .203 45/64 = .703 7/32 = .219 23/32 = .719
15/64 = .234 47/64 = .734 1/4 = .250 3/4 = .750
17/64 = .266 49/64 = .766 9/32 = • 281 25/32 = .781
19/64 = .297 51/64 = .797 5/16 = .313 13/16 = .813
21/64 = • 328 53/64 = .828 11/32 = .344 27/32 = .844 23/64 = .359 55/64 = .859
3/8 = • 375 7/8 = .875 25/64 = .391 57/64 = .891 13/32 = .406 29/32 = .906 27/64 = .422 59/64 = .922 7/16 = .438 15/16 = .938
29/64 = .453 61/64 = .953 15/32 = .469 31/32 = .969 31/64 = .484 63/64 = .984
1/2 = .500
83
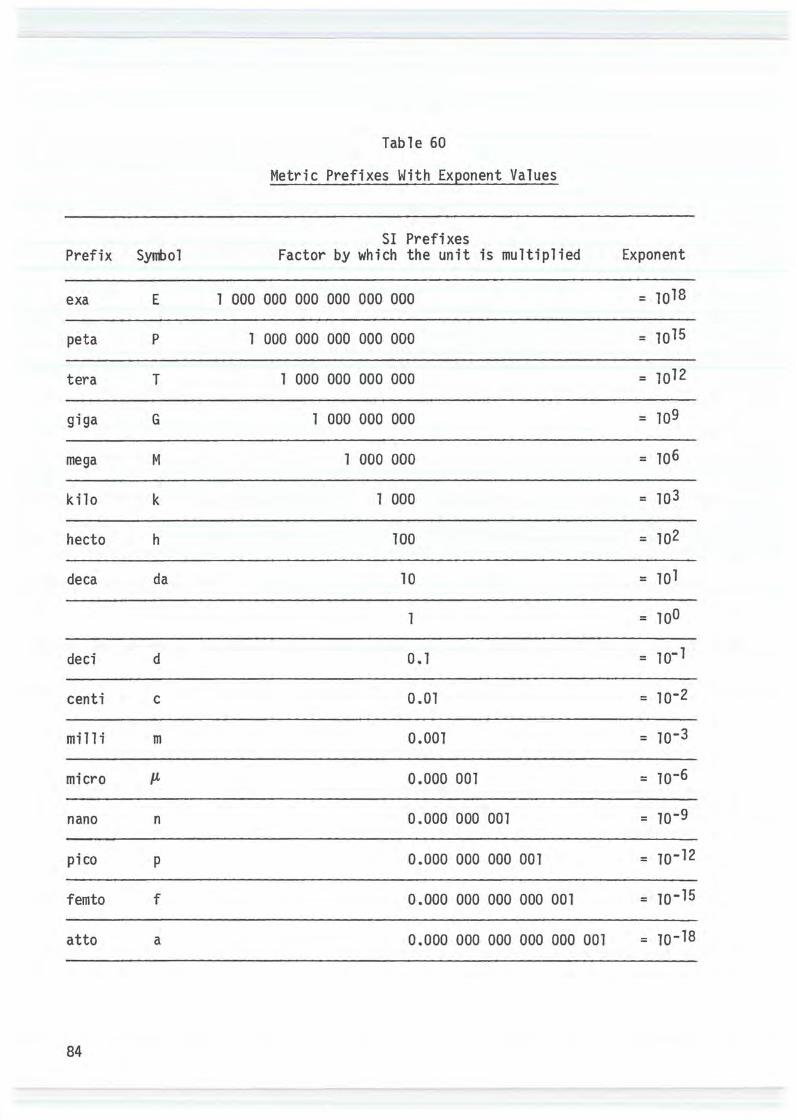
Table 60
Metric Prefixes With Exponent Values
SI Prefixes Prefix Syrrbol Factor by which the unit is multiplied Exponent
exa E 1 000 000 000 000 000 000 = 101s
pet a p 1 000 000 000 000 000 = 1015
tera T 1 000 000 000 000 = 1012
giga G 1 000 000 000 = 109
mega M 1 000 000 = 106
k i1o k 1 000 = 103
hecto h 100 = 102
deca da 10 = 101
1 = 100
deci d 0.1 = 10-1
centi c 0.01 = 10-2
mill i m 0.001 = 10-3
micro p. 0.000 001 = 10-6
nano n 0.000 000 001 = 10-9
pi co p 0.000 000 000 001 = 10-12
femto f 0.000 000 000 000 001 = 10-15
at to a 0.000 000 000 000 000 001 = 10-18
84

Table 61
Metric Conversion Factors
1 mm (millimetre) = 0.039 370 1 inch 1 m (metre) = 3.280 84 feet 1m (metre)= 1.093 61 yards 1 km (kilometre) = 0.621 371 mile
cm2 (square centimetre) = 0.155 000 square inch m2 (square metre) = 10.736 9 square feet m2 (square metre) = 1.195 99 square yards ha (hectare) = 2.471 05 acres
1 m3 (cubic metre) = 35.314 7 cubic feet 1 m3 (cubic metre) = 423.7 fbm (approx.J 1
1 m3 (cubic metre) = 1.307 95 cubic yards 1 m3 (cubic metre) = 0.353 147 cunit 1 L (liter) = 0.219 969 gallon
kg (kilogram) = 2.204 pounds t (tonne) = 1.102 31 tons (2,000 lb)
J (joule) = .0009478 BTU MJ (megajoule) = .009478 therms
1 kg/m3 = 0.062428 lb/ft3
1 m3/t = 32.037 ft3/ton 1 m3/ha = 14.2913 ft3/acre 1 J/kg = 0.0004299 BTU/lb
Area
Volume
lfass
Heat
Ratios
1 in (inch) = 25.4 mm (exactly) 1 ft (foot) = 0.304 8 m (exactly) 1 yd (yard) = 0.914 4 m (exactly) 1 mi (mile) = 1.609 34 km
1 in2 (square inch) = 6.451 6 cm2 (exactly) 1 ft2 (square foot) = 0.092 903 0 m2
1 yd2 (square yard) = 0.836 127 m2
1 acre = 0.404 686 ha
1 ft3 (cubic foot) = 0.028 316 8 m3
1,000 fbm (board feet) = 2.36 m3 (approx.) 1
1 yd3 (cubic yard) = 0.764 555 m3
1 cunit = 2.831 68 m3
1 gal. (gallon) = 4.546 09 L (exactly)
1 lb. = 0.453 592 kg 1 ton (2,000 lb) = 0.907 185 t
1 BTU (British Thermal Unit) 1055.06 J 1 therm = 105.506 MJ
1 lb/ft3 =16.0185 kg/m3
1 ft3/ton = 0.031214 m3/t 1 ft3/acre = 0.0699725 m3/ha 1 BTU/lb = 2,326 J
1These are the conversion factors commonly used to convert gross volumes of softwood lumber. They are based on the volumetric ratio between one cubic metre (1 m x 1 m x 1 m) and one board foot (1 inch x 12 inch x 1 foot), with no variation between actual and nominal sizes.
85
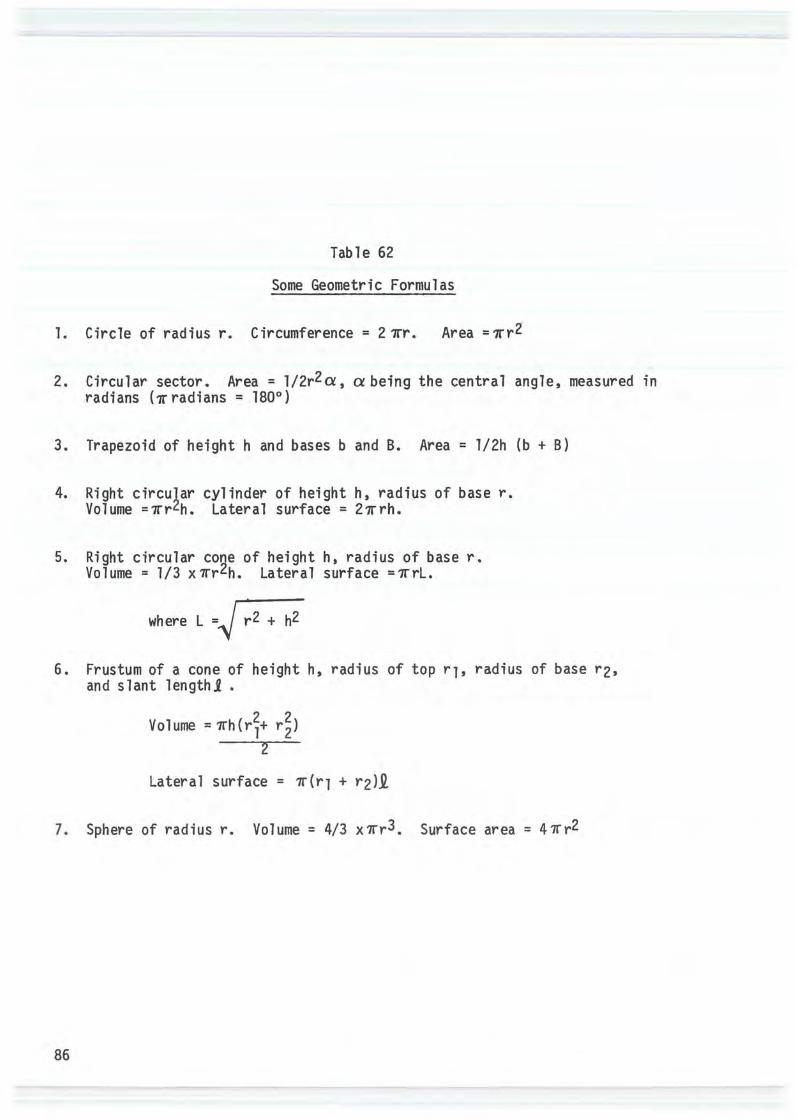
Table 62
Some Geometric Formulas
1. Circle of radius r. Circumference = 2 1rr. Area = 1rr2
2. Circular sector. Area= 1/2r2a, a being the central angle, measured in radians (1rradians = 180°)
3. Trapezoid of height h and bases b and B. Area = l/2h (b + B)
4.
5.
Right circular cylinder of height h, radius of base r. Volume =1rr2h. Lateral surface = 21rrh.
Right circular cone of height h, radius of base r. Volume = 1/3 x 1rr2h. Lateral surface =1rrl.
where L r2 + h2
6. Frustum of a cone of height h, radius of top r1, radius of base r2, and slant lengthj •
Volume = 2
Lateral surface = ?r(q + r2)i
7. Sphere of radius r. Volume= 4/3 x?rr3. Surface area= 41rr2
86
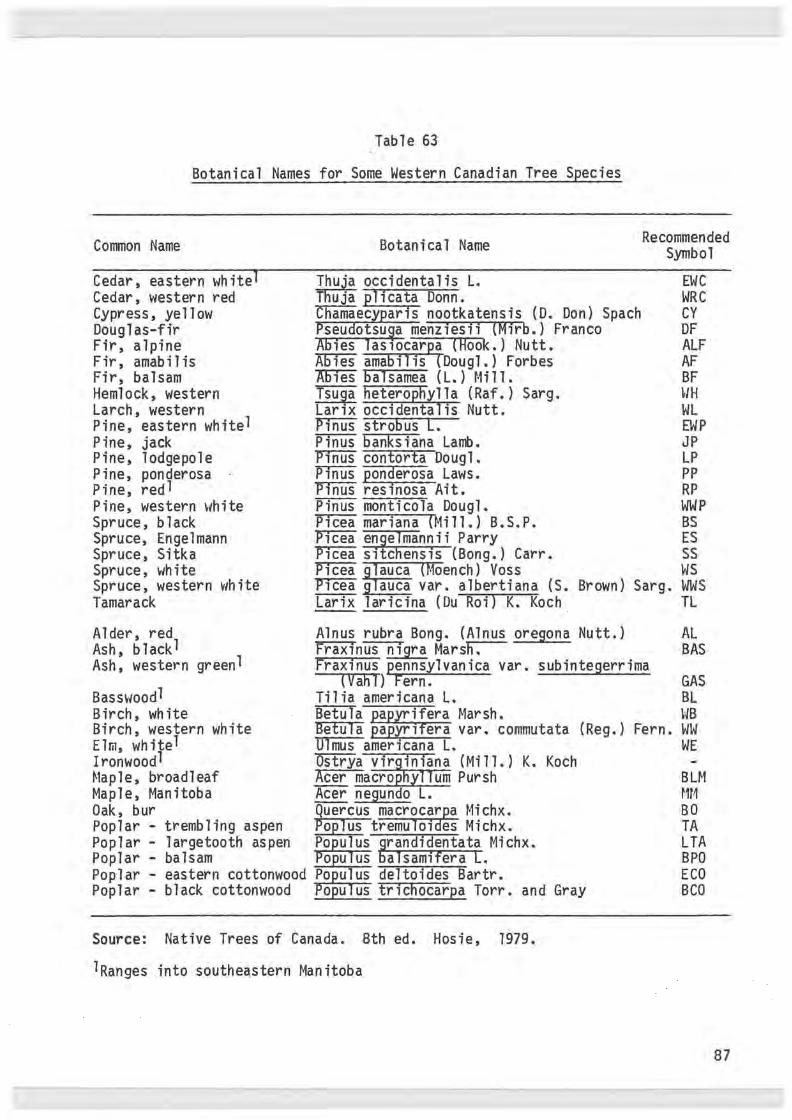
Table 63
Botanical Names for Some Western Canadian Tree Species
Common Name Botanical Name Recommended Symbol
Cedar, eastern whitel Cedar, western red Cypress, yellow Douglas-fir Fir, alpine Fir, amabi 1 is Fir, balsam Hemlock, western Larch, western Pine, eastern whitel Pine, jack Pine, lodgepole Pine, ponderosa Pine, redl Pine, western white Spruce, black Spruce, Engelmann Spruce, Sitka Spruce, white Spruce, western white Tamarack
Alder, red Ash, blackl Ash, western greenl
BasS\'ioodl Birch, white Birch, western white Elm, whitel Ironwoodl
1 e, broadl eaf Map 1 e, Manitoba Oak, bur Poplar - trembling aspen Poplar - largetooth aspen Poplar - balsam Poplar - eastern cottonwood Poplar - black cottonwood
ja occidentalis L. UJa plicata Donn.
Chamaecyparis nootkatensis (D. Don) Spach menziesii (Mirb.) Franco
Abies las1ocarpa (Hook.) Nutt. Abies amabilis {Dougl.) Forbes Abies balsamea (L.) t-1111.
heterophylla (Raf.) Sarg. Lar1x occidentalis Nutt. Pinus strobus L. Pinus banksiana Lamb. Pinus contorta Dougl. Pinus ponderosa Laws. Pinus resinosa Ait. Pinus monticola Dougl. P1cea mariana {Mill.) B.S.P. Picea engelmannii Parry Picea sitchensis (Bong.) Carr. Picea glauca (f.1oench) Voss
EWC WRC CY DF ALF AF BF
WL EWP JP LP pp RP WWP BS ES ss ws
P1cea glauca var. albertiana (S. Larix laricina (Du Roi) K. Koch
Brown) Sarg. WWS TL
Alnus rubra Bong. (Alnus oregona Nutt.) Fraxinus n1gra Marsh. Fraxinus pennsylvanica var. subintegerrima
(Vahl) Fern. Tilia americana L. Betula papyrifera Betula papyr1fera var. commutata (Reg.) Fern. Ulmus americana L. Ostrya v1rg1n1ana (Mill.) K. Koch Acer macrophyllum Pursh Acer negundo L. Quercus macrocarpa Michx. Poplus tremuloides Michx. Populus Srand1dentata Michx. Populus alsamifera L. Populus deltoides Bartr. Populus trichocarpa Torr. and Gray
AL BAS
GAS BL
ww WE
BLM
BO TA LTA BPO ECO BCO
Source: Native Trees of Canada. 8th ed. Hosie, 1979.
1Ranges into southeastern Manitoba
87

88

REFERENCES
Alberta Forest Service. 1973. Alberta Scaling Instruction Saw and Peeler Logs. Timber Management Manual. Alberta Forest Service, Edmonton, Alberta. Ch. 21. np.
Alberta Forest Service. 1979. Alberta Scaling Manual. Forest Management Manual. Alberta Forest Service, Edmonton, Alberta. Ch. 11. 57 p.
Arola, R.A. 1976. Wood Fuels--How Do They Stack Up? In: Proceedings of Energy and the Wood Products Industry. November 15-17, Atlanta, Georgia. FPRS, Madison, WI. Proc. No. P-76-14. p. 34-45.
British Columbia Ministry of Forests. 1980. Forest Service Scaling Manual. np.
Canada. Department of Energy, Mines and Resources. 1977. Energy Demand Projections--A Total Energy Approach. Ottawa, Ont. Report ER-77-4. 157 p.
Energy Policy Analysis Div.
Canadian Standards Association. 1973. Metric Practice Guide. CSA, Rexdale, Ont., 44 p.
Canadian Wood Council. 1978. Metric Manual For Wood Products. CWC, Ottawa, Ont. 49 p.
Carroll, M.N. 1981. Panel Products. In: Canadian Woods Their Properties and Uses. 3rd ed. E.J. t4ullins-and T.S. McKnight, Ed. Univ. Toronto Press, Toronto. Ch. 10. p. 245-264.
Corder, S.E. 1973. Wood and Bark as Fuel. For. Res. Lab., Corvallis, OR. Res. Bulletin 14, 28 p.
Council of Forest Industries of B.C. 1974. Basic Lumber Figuring and B.C. Lumber Export Packaging Schedule. COFI, Vancouver, B.C. 60 p.
Council of Forest Industries of B.C. 1975. Metric Tables for Red Cedar Shingles and Shakes. COFI, Vancouver, B.C. 2 p.
Curtis, A.B. 1976. How to calculate wood fuel values. Forest Industries 103(12):44-45.
Dobie, J. 1965. Factors influencing the weight of logs. B.C. Lumberman 49(9):36, 37, 42, 44, 46.
Dobie, J. 1975. Lumber Recovery Practices in British Columbia Coastal Sawmills. Can. For. Serv., West. Forest Prod. Lab. Vancouver, B.C. Inf. Rep. VP-X-151, 29 p.
Dobie, J. 1978. Small-log sawmill yields in the B.C. Interior. Can. For. Serv., West. Forest Prod. Lab., Vancouver, B.C. Inf. Rep. VP-X-167, 10 p.
89
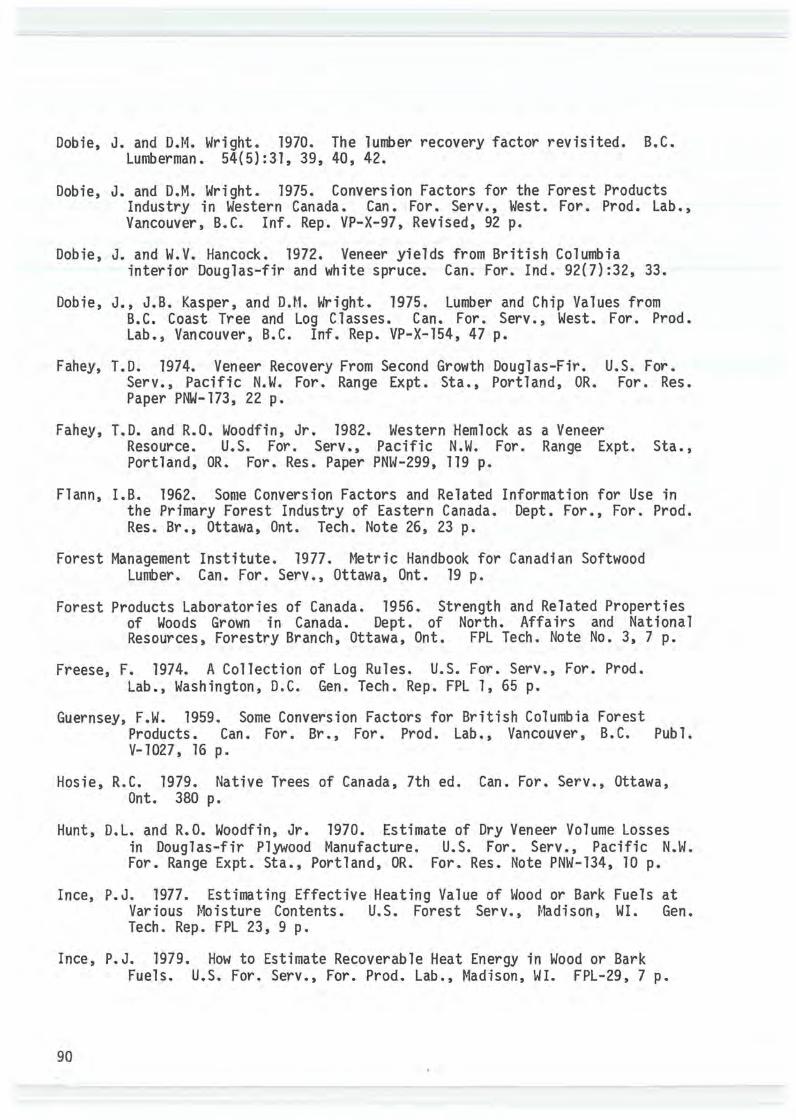
Dobie, J. and Wright. 1970. The lunber recovery factor revisited. B.C. Lumberman. 54(5):31, 39, 40, 42.
Dobie, J. and D.M. Wright. 1975. Conversion Factors for the Forest Products Industry in Western Canada. Can. For. Serv., West. For. Prod. Lab., Vancouver, B.C. Inf. Rep. VP-X-97, Revised, 92 p.
Dobie, J. and W.V. Hancock. 1972. Veneer yields from British Columbia interior Douglas-fir and white spruce. Can. For. Ind. 92(7):32, 33.
Dobie, J., J.B. Kasper, and D.t-1. Wright. 1975. Lumber and Chip Values from B.C. Coast Tree and Log Classes. Can. For. Serv., West. For. Prod. Lab., Vancouver, B.C. Inf. Rep. VP-X-154, 47 p.
Fahey, T.D. 1974. Veneer Recovery From Second Growth Douglas-Fir. U.S. For. Serv., Pacific N.W. For. Range Expt. Sta., Portland, OR. For. Res. Paper PNW-173, 22 p.
Fahey, T.D. and R.O. Woodfin, Jr. 1982. Western Hemlock as a Veneer Resource. U.S. For. Serv., Pacific N.W. For. Range Expt. Sta., Portland, OR. For. Res. Paper PNW-299, 119 p.
Flann, I.B. 1962. Some Conversion Factors and Related Information for Use in the Primary Forest Industry of Eastern Canada. Dept. For., For. Prod. Res. Br., Ottawa, Ont. Tech. Note 26, 23 p.
Forest Management Institute. 1977. Hetric Handbook for Canadian Softwood Lumber. Can. For. Serv., Ottawa, Ont. 19 p.
Forest Products Laboratories of Canada. 1956. Strength and Related Properties of Woods Grown in Canada. Dept. of North. Affairs and National Resources, Forestry Branch, Ottawa, Ont. FPL Tech. Note No. 3, 7 p.
Freese, F. 1974. A Collection of Log Rules. U.S. For. Serv., For. Prod. Lab., Washington, D.C. Gen. Tech. Rep. FPL 1, 65 p.
Guernsey, F.W. 1959. Some Conversion Factors for British Columbia Forest Products. Can. For. Br., For. Prod. Lab., Vancouver, B.C. Publ. V-1027, 16 p.
Hosie, R.C. 1979. Native Trees of Canada, 7th ed. Can. For. Serv., Ottawa, Ont. 380 p.
Hunt, D.L. and R.O. Woodfin, Jr. 1970. Estimate of Dry Veneer Volume Losses in Douglas-fir Plywood Manufacture. U.S. For. Serv., Pacific N.W. For. Range Expt. Sta., Portland, OR. For. Res. Note PNW-134, 10 p.
Ince, P.J. 1977. Estimating Effective Heating Value of Wood or Bark Fuels at Various Moisture Contents. U.S. Forest Serv., Madison, WI. Gen. Tech. Rep. FPL 23, 9 p.
Ince, P.J. 1979. How to Estimate Recoverable Heat Energy in Wood or Bark Fuels. U.S. For. Serv., For. Prod. Lab., Madison, WI. FPL-29, 7 p.
90

Jessome, A.P. 1977. Strength and Related Properties of Woods Grown in Canada. Fish. and Envir. Canada, E.F.P.L., Ottawa, Ont. Forestry Technical Report 21, 37 pp.
Kellogg, R.M. and E.P. Swan. 1983. Fundamental Properties of Black Cottonwood and Balsam Poplar in British Columbia and Alberta. Forintek Canada Corp., Vancouver, B.C. 12 p.
Krier, J.P. and B.H. River. 1968. Bark Residues: A Model Study for Quantitative Determination. Mont. For. and Conserv. Expt. Sta., Missoula, MT. Bull. 35, 18 p.
Kryla, J.M. 1984. Determination of Available Heat of Combustion Data for Canadian Woody Species. Can. For. Serv., Ottawa, Ont. Enfor Project P-256, 89 p.
Lane, P., R.O. Woodfin Jr., J.W. Henley and Plank. 1973. Veneer Recovery from Old-Growth Coast Douglas-Fir. Pacific N.W. For. Range Expt. Sta., U.S. For. Serv., Portland, OR. Res. Pap. PNW-162, 119 p.
Lassen, L.E. and E.A. Okkonen. 1969. Sapwood Thickness of Douglas-Fir and Five Other Western Softwoods. U.S. For. Serv., Madison, WI. Res. Pap. FPL 124, 16 p.
Mackay, J.F.G. 1974. High-temperature kiln drying of northern aspen 2- by 4-inch light-framing lumber. For. Prod. J. 24(10):32-35.
Maloney, T.M. 1977. Modern Particleboard and Dry-Process Fiberboard Manufacturing. Miller Freeman, San Francisco. 672 pp.
Manitoba Department of Mines, Resources and Environmental Management. 1972. Manual of Scaling Instructions. 121 p.
Manitoba Department of Natural Resources. 1980. Manual of Scaling Instructions in Metric Units. Forestry Branch. 135 p.
McBride, C.F. 1959. Utilizing residues from western red cedar mills. For. Prod. J. 9(9):313-316.
Middleton, G.R. and B.D. Munro. 1985. A Comparison of the Lumber Manufacturing Efficiency of Seven Sawmills Operating in the B.C. Interior. Forintek Canada Corp., Western Laboratory, Vancouver, B.C. 25 pp.
National Lumber Grades Authority. 1984. Standard Grading Rules for Canadian Lumber. NLGA, Vancouver, B.C. 207 p.
Nylinder, P. 1972. Measuring of Wood Chips. For. Prod. Dept., Royal College of For., Stockholm, Sweden. 13 p.
Oswald, D. 1979. Chip transportation outside the pulp mill. In: Chip Quality Monograph. J. V. Hatton, Ed. Joint Textbook Committee of the Paper Industry, TAPPI. Pulp and Paper Technology Series, No. 5, p. 171-190.
91
Pingrey, D.W. 1976. Forest products energy overview. In: Proceedings of Energy and the Forest Products Industry.- FPRS, Madison, WI. Proceedings No. P-76-14. p. 1-16.
Province of British Columbia. 1961. Log Scale. F.S. 545-0. 12 p.
Quelch, P.S. 1970. Armstrong Saw Filer•s Handbook. Armstrong Manufacturing Co., Portland, OR. 103 p.
Saskatchewan Department of Natural Resources. 1972. Saskatchewan Scaling Manual. 36 p.
Saskatchewan Dept. of Tourism and Renewable Resources. 1979. Saskatchewan Interim Scaling Manual. Forestry Branch. 129 p.
Silvis, R.E. and G.A. Koenigshof. 1981. Comparative feasibility of manufacturing plywood, Com-Ply, · and griented strandboard. In: Proc. 15th International Particleboard Symposium, Wash. State Un1v., Mar. 31-Apr. 2, 1981, Pullman, WA. p. 101-116.
Smith, J.H.G. 1971. Thickness, moisture content, and specific gravity of inner and outer bark of some Pacific Northwest trees. Forest Prod. J. 21(2):38-40.
Smith, J.H.G. and A. Kozak. 1967. Thickness and Percentage of Bark of the Conunercial Trees of British Columbia. Univ. Brit. Columbia., Fac. For., Vancouver, B.C. 33 p.
Smith, W.J. 1970. Density Survey in \4estern Canada. Can. Dept. Fish. and For., West. Forest Prod. Lab., Vancouver, B.C. Inf. Rep. VP-X-66, 29 p.
U.S. Forest Service. 1969. National Forest Log Scaling Handbook. U.S. Forest Service, D.C. 193 p.
United States Department of Agriculture. 1974. Wood Handbook. For. Serv., Wash., D.C. Agr. Handbook 72.
Vajda, P. 1978. A comparative analysis of the economics of particleboard and fiberboard manufacture. TAPPI: Non-Wood Plant Fiber Pulping, Progress Report No. 7, Committee Assignment Report (CAR) No. 67, p. 93-111.
92


![CONVERSI(UNE)A SUPERMATEMATICĂ · 2014. 11. 19. · CONVERSI(UNE)A SUPERMATEMATICĂ TRANSFORMAREA EXCENTRICĂ 0.5 ↗ s ↗ s s [0, 12] Fig.1,a Conversi(une)a sau transfiguraea în](https://img.dokumen.tips/doc/110x75/607f3808b66b6f299f125d68/conversiunea-supermatematic-2014-11-19-conversiunea-supermatematic.jpg)