Embed Size (px)
Citation preview
RAC, v. 5, n. 3, Set./Dez. 2001: 167-186 167
Convergent and Discriminant Validity of the PerceivedConvergent and Discriminant Validity of the PerceivedConvergent and Discriminant Validity of the PerceivedConvergent and Discriminant Validity of the PerceivedConvergent and Discriminant Validity of the PerceivedRisk Scale in Business-to-Business Context Risk Scale in Business-to-Business Context Risk Scale in Business-to-Business Context Risk Scale in Business-to-Business Context Risk Scale in Business-to-Business Context UUUUUsing thesing thesing thesing thesing theMultitrait-Multimethod ApproachMultitrait-Multimethod ApproachMultitrait-Multimethod ApproachMultitrait-Multimethod ApproachMultitrait-Multimethod Approach
Sérgio C. Benício de MelloMartin Collins
RRRRRESUMOESUMOESUMOESUMOESUMO
A literatura em marketing do consumidor é abrangente em pesquisa sobre risco percebido. Noentanto, pouco tem-se pesquisado sobre mensuração do risco percebido em business-to-business,principalmente considerando as suas várias metodologias de mensuração empregadas e a sua valida-de. Um objetivo básico do marketing como ciência é proporcionar explicações teóricas para ocomportamento de compra e venda. Os que buscam tais explicações geralmente tomam empresta-dos e desenvolvem constructos e proposições teóricas que não são prontamente generalizáveis.Assim, esta pesquisa está primeiramente concentrada em discutir e testar duas escalas de mensura-ção de risco percebido em duas situações de compra (business-to-business), usando diferentes tiposde técnicas de validação. Ela testa algumas suposições e doutrinas em modelos de risco percebido,submetendo essas medidas a uma validação convergente e discriminante usando a abordagem multi-atributo-multi-método. O total de firmas de dois setores (farmacêutico e confecções) nos maioresEstados da Federação Brasileira foi consultado. Os resultados indicam que ambas as escalas e suasvariações são válidas para mensurar percepção de risco. A abordagem certeza/seriedade mostrouser ligeiramente melhor que a unidimensional de risco.
Palavras-chaves: risco percebido; validação convergente e discriminante; multi-atributo-multi-método.
AAAAABSTRACTBSTRACTBSTRACTBSTRACTBSTRACT
Consumer marketing literature is abundant with research on perceived risk. However, little researchhas investigated the perceived risk measure in business-to-business, specially regarding its variousmeasurement methodologies employed with respect to their validity. A basic goal of marketing asa science is to provide theoretical explanations for buying-selling behaviour. Whoever seeks suchexplanations normally borrows and develops constructs and theoretical propositions that cannotbe promptly generalized. Thus, this research is primarily concerned with testing and discussingtwo perceived risk measurement scales across two buying situations (business-to-business) usingdifferent types of validation techniques. It tests some assumptions and tenets in models of perceivedrisk by submitting these measures to a convergent and discriminant validation using the multitrait-multimethod approach. The total of firms from two industrial sectors (pharmaceutical and clothing)in the largest States of the Brazilian Federation were consulted. The results indicate that both scalesand their variations are valid to assess risk perception. The certainty/seriousness approachproved to be slightly better than the riskiness approach.
Key words: perceived risk; convergent and discriminant validity; multitrait-multimethod.
168
Sérgio C. Benício de Mello e Martin Collins
RAC, v. 5, n. 3, Set./Dez. 2001
IIIIINTRODUCTIONNTRODUCTIONNTRODUCTIONNTRODUCTIONNTRODUCTION
“A basic goal of social science is to provide theoretical explanations for behaviour.In marketing, this goal includes attempts to explain the behaviour of consumers,salespersons, and others involved in discipline related activities. Marketing scholarswho seek such explanations frequently borrow and develop constructs andtheoretical propositions relating to them. Although marketing has little in the wayof fully developed, formally stated scientific theories, such theories cannot developunless there is a high degree of correspondence between abstract constructs andthe procedures used to operationalise them” (Peter, 1981, p. 133). In accordanceto Peter’s (1981) point, this research tests the construct validity of some perceivedrisk scales. It tests some assumptions and tenets in models of perceived risk bysubmitting these measures to a convergent and discriminant validation using themultitrait-multimethod approach.
PPPPPERCEIVEDERCEIVEDERCEIVEDERCEIVEDERCEIVED R R R R RISKISKISKISKISK M M M M MEASUREMENTEASUREMENTEASUREMENTEASUREMENTEASUREMENT
In the last 40 years, since Bauer’s (1960) conceptualisation of buyer behaviouras a risk taking activity, many different researchers have been attempting tooperationalise the perceived risk concept. Cunningham (1967) was one of thefirst to suggest a two-dimensional model designed to measure the perceivedcertainty of a given event happening and the consequences/losses involved ifthe event actually happens. Besides the two-dimensional model, another type ofperceived risk measure has been used. Dowling (1986) described it as aunideminsional measure. In this measure individuals are asked to rate the riskinessof a product/brand on a single scale such as, How risky is brand A? Withanswers ranging from not at all risky to very risky (Spence, Engel and Black-Well, 1970; Hampton, 1977; De Chernatony, 1988).
Uncertainty has been conceptualised as the overall likelihood that losses wouldoccur due to poor choice and consequence; the seriousness attributed to theoccurrence of each loss. Many decide to conceptualise this measure in this wayfor several reasons. However, the major reason for using the two-componentmodel is that such a measure has been successfully used (e.g., Cunningham,1967; Stone and Winter, 1987; Mitchell, 1991) over a long period of time and hasshown to be trustworthy.
RAC, v. 5, n. 3, Set./Dez. 2001 169
Convergent and Discriminant Validity of the Perceived Risk Scale
The second reason is that a great number of studies (e.g., Cunningham, 1967;Dash, Schiffman and Berenson, 1976; Boze, 1987; Mitchell, 1991; De Mello,1997), which have employed the two-component model in the past allow for themaking of future comparison. The third reason is that after an extensive meta-analysis (over 100 studies compared), Gemunden (1985) concluded that separatemeasures of uncertainty and consequences is a better predictor of informationsearch. Finally, there has been a previous report (Lumpkin and Massey, 1983) ofconvergent and discriminant validity of the two-component model.
After Cunningham (1967) many others (e.g., Hirisch, Dornoff and Kernan,1972; Peter and Ryan, 1976; Hoover, Green and Saegert, 1978; Guseman, 1981;Carrol, Siridhara and Fincham, 1986; Greatorex and Mitchell, 1991) attempted todevelop models to measure perceived risk. Constant arguments emerged fromthese models, especially if the risk model should be multiplicative or additive,however, little empirical work testing the functional forms and benefits of thesemodels was done.
Dowling (1986) has been advocating that there are theoretical and practicalarguments for selecting a multiplicative relationship between uncertainty andconsequences/losses. Accordingly, some of his arguments are (1) the absenceof either variable would eliminate the perception of risk and (2) the influence of anon-salient loss on the overall perceived risk is reduced.
On the other hand, some researchers (e.g., Bettman, 1973; Peter and Ryan,1976; Horton, 1976, 1979; Mitchell, 1991; De Mello, 1997) have presented someevidence that an additive model fits slightly better than the multiplicative model.Joag (1985) tested, in an organisational buying situation, a range of different modelsand concluded that there is only a slight difference between them. Until recentyears, the prevailing view maintained the same, that uncertainty and significanceof consequences (importance of losses) should combine either in a multiplicativeor additive form. Yates and Stone (1992) advanced this knowledge by saying thatthe two-dimensions of perceived risk are actually combined by an operator thatbehaves essentially, though not completely, like multiplication. In other words,their view is that uncertainty and consequence should combine interactively.
Thus, after reviewing the literature, no strong and convincing evidence indicatingwhich of these models (i.e., multiplicative versus additive) is the most adequate tomeasure perceived risk was found. Initially, we decided to operationalise perceivedrisk in both ways and test which model fits better.
Another idea has to do with the conceptualisation of an overall perceived risk.It is believed that in situations which more than one loss might occur, the effect ofthose losses is independently cumulative (Dowling, 1986; Yates and Stone, 1992).
170
Sérgio C. Benício de Mello e Martin Collins
RAC, v. 5, n. 3, Set./Dez. 2001
This assumption can be challenged based on the findings of some research (e.g.,Jacoby and Kaplan, 1972; Kaplan, Szybillo and Jacoby, 1974) that found highpositive correlation among some types of losses. However, the contribution tooverall risk made by one potential loss tends to be the same, regardless of theother potential losses that might accompany it (Yates and Stone, 1992).Consequently, the overall risk implied by a collection of potential losses is anaccumulation of the contributions made by each of them.
Dowling (1986) has postulated that the majority of measures of perceived riskare positioned at a low level of abstraction and can be found that have used oneof the following indices:
1 Perceived Risk = Uncertainty
2 Perceived Risk = Uncertainty x Adverse Consequences
3 Overall Perceived Risk = ∑ Uncertainty i x Adverse Consequences i
4 Overall Perceived Risk = ∑ Probability of Loss i
5 Overall Perceived Risk = ∑ Probability of Loss i x Importance of Loss i
where n = the number of types of loss i.
After a thorough investigation, no compelling evidence could be found indicatingthe best overall perceived risk model; therefore it was decided to use the followingconceptual equation as a safe approach. The final decision on which model to usewas taken after construct validation tests were done using both multiplicative andadditive models.
Perceived Risk [Risk (Loss i)] = Likelihood of Loss ⊕ Seriousness of Consequence
Overall Perceived Risk = ∑ Risk (Loss i)
where n = the number types of loss i; ⊕ = can be a multiplication-like or addition-like operator.
Cunningham (1967) has also pointed out the weakness of this model that restson the assumption of both factors in the equation being equally weighted. He has
n
i = 1n
i = 1
n
i = 1
n
i = 1
RAC, v. 5, n. 3, Set./Dez. 2001 171
Convergent and Discriminant Validity of the Perceived Risk Scale
suggested that the consequence dimension may be taken in consideration moreseriously by buyers’ than the uncertainty dimension. However, despite someeffort to determine the weighting relationships between these two factors, theappropriate weight could not be determined.
Most recent authors who have investigated perceived risk in buying situationshave been operationalising risk scales based on Cunningham’s (1967) formulation.His formulation was a composite of two indirect questions on certainty and danger.Both questions were rated initially on a 4-point scale that he later converted to a3-point one. These two scales combined in a multiplicative form to develop riskcategories.
Generally, studies subsequent to Cunningham’s (1967) have been using Likerttype and semantic differential scales with questions like: consider yourself involvedin a buying situation. Moreover, the possibility this acquisition did not satisfy theacceptance level of the firm you work for. What is the likelihood of the followinglosses occurring (at least one feasible loss situation must be described per risktype; e.g., you will feel personal dissatisfaction) and how serious would it be ifthese losses actually did occur? Possibilities of answers varying from a continuumranging from very certain to not at all certain and from very serious to not at allserious.
Guseman (1981) has used a 4-point scale like the one initially proposed byCunningham (1967); however other researchers have been measuring thecomponents of risk on a wide variety of ranging. Hisrich, Dornoff and Kernan(1972) used a 5-point scale, while Peter and Ryan (1976) preferred a 7-point one.Brooker (1984) amplified to a 9-point scale while Choffray and Johnston (1979)developed a 10-point scale for their study.
Mitchell (1991, 1994), after analysing 120 different studies on risk, found thatthe overall risk measure is usually operationalised in a 7-point scale. This scalingtechnique has proved its validity in many studies (e.g., Henthorne, Latour andWilliams, 1993; Stone and Gronhaug, 1993).
VVVVVALIDITYALIDITYALIDITYALIDITYALIDITY A A A A ASSESSMENTSSESSMENTSSESSMENTSSESSMENTSSESSMENT
Even if a measure can be considered highly reliable, showing little effect ofrandomly varying measurements, there is no guarantee that the scale is actuallymeasuring the theoretical constructs under investigation.
172
Sérgio C. Benício de Mello e Martin Collins
RAC, v. 5, n. 3, Set./Dez. 2001
According to Malhotra (1996), the validity of a scale may be defined as theextent to which differences in observed scale scores reflect true differencesamong objects on the characteristic being measured rather than systematic orrandom error. Testing validity is not a straightforward procedure. As Singleton,Straits and Straits (1993, p. 122) point out, “if we knew a case’s true value on avariable independent of a given measure - then there would be no need for themeasure”.
To assess validity one must either: (1) subjectively evaluate whether anoperational definition measures what it is intended to or (2) compare the resultsof an operational definition with the results of other measures with which it shouldor should not be related (Singleton, Straits and Strais, 1993). As can be seen, thesort of subjective judgements and objective evidence, which result, depend on thepurpose of the measurement.
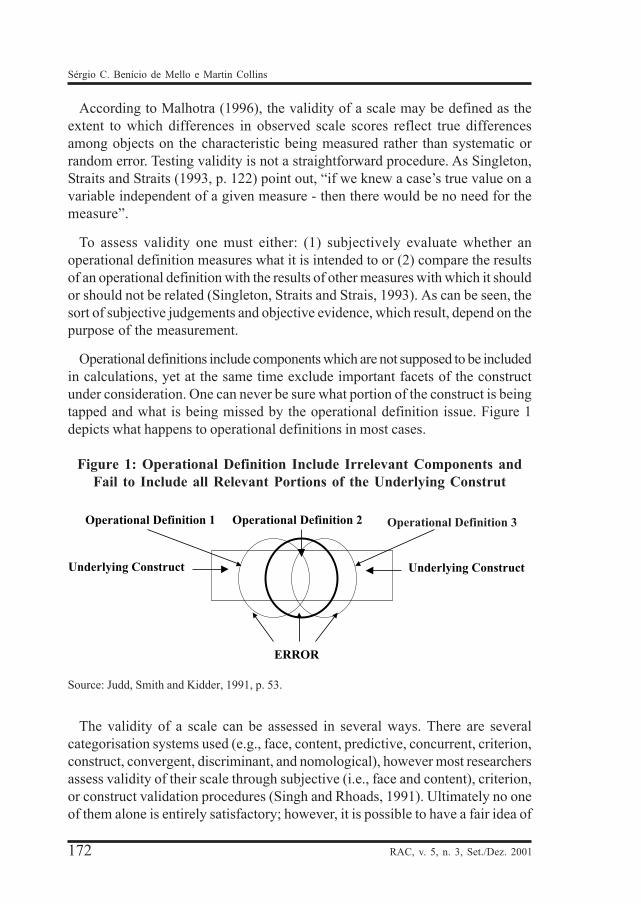
Operational definitions include components which are not supposed to be includedin calculations, yet at the same time exclude important facets of the constructunder consideration. One can never be sure what portion of the construct is beingtapped and what is being missed by the operational definition issue. Figure 1depicts what happens to operational definitions in most cases.
Figure 1: Operational Definition Include Irrelevant Components andFail to Include all Relevant Portions of the Underlying Construt
Source: Judd, Smith and Kidder, 1991, p. 53.
The validity of a scale can be assessed in several ways. There are severalcategorisation systems used (e.g., face, content, predictive, concurrent, criterion,construct, convergent, discriminant, and nomological), however most researchersassess validity of their scale through subjective (i.e., face and content), criterion,or construct validation procedures (Singh and Rhoads, 1991). Ultimately no oneof them alone is entirely satisfactory; however, it is possible to have a fair idea of
Operational Definition 1 Operational Definition 2
Underlying Construct Underlying Construct
ERROR
Operational Definition 3
RAC, v. 5, n. 3, Set./Dez. 2001 173
Convergent and Discriminant Validity of the Perceived Risk Scale
the validity of a scale through an assessment of it using two or more differentmeans.
MMMMMETHODOLOGYETHODOLOGYETHODOLOGYETHODOLOGYETHODOLOGY
To operationalise and test the above proposed perceived risk measure, we useda structured postal self-completion questionnaire as the data collection medium.The questions used to build up the questionnaire for this research were basicallyattitudinal questions. The measurement of these information areas is nowconsidered.
Many different researchers have attempted to operationalise the perceived riskconcept. The prevailing view is still the same; that uncertainty and significance ofconsequences (importance of losses) should combine interactively to composeperceived risk. After an extensive review of the literature, we decided to use theperceived risk scale in its traditional 7-point semantical measure (e.g., Lumpkinand Massey, 1983).
In order to validate the perceived risk construct, first some product fields had tobe selected. To reduce the set of products to a manageable number that couldencourage respondents to participate, some qualitative interviews were performed.After in-depth interviews with a selected sample it was possible to select the ITindustry as the focus of our attention. The results of the interviews indicatedworkgroup servers and mid-range laser printers as the two most prominent productfields of the industry. These products were also recognised as common in ourdays to all middle and large businesses.
Large and medium size Brazilian firms operating in industrial activities were thebasis of this research. To reduce the overall sample, some criteria were establishedto cover the most prominent industrial sectors of the Brazilian economy. After anextensive analysis, pharmaceuticals and clothing were chosen. An analysis of thedata published from the latest industrial census available led to the selection ofthe geographical areas to be covered and the number of firms in each geographicalarea. The total of these firms is 162.
To determine the relevant individuals to be approached an extensive snowballingprocedure was used to scan all possible decision-makers. After identifying thepopulation of individuals, a random selection of one individual per firm took place.A response rate of 48% was achieved and the data showed no significant differencebetween respondents and non-respondents. Two different reliability assessments
174
Sérgio C. Benício de Mello e Martin Collins
RAC, v. 5, n. 3, Set./Dez. 2001
(test-retest and internal consistency) were performed in this study; both showingthe data’s reliability. The scale was validated in two different ways (convergentand discriminant) .
CCCCCONSTRUCTONSTRUCTONSTRUCTONSTRUCTONSTRUCT V V V V VALIDATIONALIDATIONALIDATIONALIDATIONALIDATION
Construct validity is an approach to evaluate a measure based upon how wellthe measure conforms with theoretical expectation (De Vaus, 1996). Accordingto Singleton, Straits and Straits (1993), the meaning of any scientific construct isimplied by statements of its theoretical relations to other constructs. Thus, thevalidation process begins with an examination of the underlying theory of theconcept being measured.
This type of validity is the main form of validation upon which the trait relatedapproach to psychometrics is based (Rust and Golombock, 1989). The entitymeasured by the test is normally not directly measurable, and thus most of thetime researchers are limited to evaluating its usefulness by making inferencesfrom the relationship (i.e., correlations) between the test and the various phenomenapredicted by the theory. For example, if a particular Hierarchy of Effects Modeltheorises that in order for someone to buy a product he or she must first like theproduct better than others, then this preference is expected to be the case. If, onthe other hand, it is discovered that people do not know whether they liked thepurchased brand better than others before buying the product, then either thetheory is wrong, or the results of the study are invalid according to this theory(Block and Block, 1995).
Rust and Golombock (1989) purpose that construct validation is never complete,but is cumulative over the number of studies available, and in many respects issimilar to Popper’s (1969) idea of verification in science. It is thus a reflection ofa particular view of the scientific process, and is integrated within the positivistand hypothetico-deductive view of science.
This study conforms with this view of cumulative validation, having fitted withtwo previous studies which tested for construct validation empirically, using similarscales to the ones utilised in this research. Lumpkin and Massy (1983) examinedalternative perceived risk scales for convergent and discriminant validity (i.e.,construct validity) amongst a consumer sample. Nevertheless, some doubts remainas to the best method to assess risk perception especially in a business-to-businesscontext, and further investigation into construct validation was carried out to seek
RAC, v. 5, n. 3, Set./Dez. 2001 175
Convergent and Discriminant Validity of the Perceived Risk Scale
clarification on this issue. These further tests on the perceived risk scale will bediscussed in detail later on this section.
Construct validity is the most sophisticated and difficult validation to establish(Malhotra, 1996). According to Cohen (1979), if testing for construct validity, oneshould examine the scale being used by means of convergent, discriminant andnomological testing of validity. Convergent validity involves measuring aconstruct with independent measurement techniques and demonstrating a highcorrelation among the measures. Discriminant validity is exactly the opposite;it involves demonstrating a lack or a very low correlation among differentconstructs (Kinnear and Taylor, 1996). Last, nomological validity is tested byrelating measurements to a theoretical model that leads to further deductions,interpretations, and tests (Spiro and Weitz, 1990).
Even if one decides to examine its scale by assessing all three types of constructvalidation, in the end there is no ideal way of determining the validity of a scale.The most appropriate method will depend on the situation. As De Vaus (1996, p.57) suggests: “if a good criterion exists use it; if the definition of the concept iswell defined or well accepted use this approach; if there are well-establishedtheories which use the concept which we wish to validate, use this approach. Ifall else fails we have to say this is how the concept is defined and these measures,on the face of it, seem to cover the concept, and to give the measure to otherpeople (referred to as panel of judges) to see what they think”.
In the last four decades, many researchers (e.g., Bauer [1960], Cox [1967],Cunninham [1967], Ross [1974], Lumpkin and Massey [1983], Dowling [1986],Yates [1992], Greatorex and Mitchell [1993], to list only a few) have been engagedin discussions about the perceived risk concept. Neither total agreement nordisagreement can be discerned in this literature; however, there is a consensusamong some (e.g., Peter and Tarpey, 1975; Peter and Ryan, 1976) that perceivedrisk is a multidimensional-multifaceted construct. Nevertheless, what researchersfail to agree on, is a sound operational definition for perceived risk. Another pointof disagreement is with regard to the precise nature of the construct (e.g., Bettman,1973; Horton, 1979).
In view of such conceptual fuzziness, construct validation should be an importantpart of any attempt to advance knowledge in perceived risk (Dowling, 1986). Theperceived risk literature provides evidence of many attempts to validate thisconcept. Studies such as Bettman’s (1973) original and its validation, Bettman(1975) proposed a dichotomous perceived risk concept, in which two types ofrisk (i.e., inherent and handled) were operationalised. Jacoby and Kaplan (1972)and later its validation study Kaplan, Szybillo and Jacoby (1974) designed andtested the perceived risk concept as a multifaceted (e.g., performance, financial,
176
Sérgio C. Benício de Mello e Martin Collins
RAC, v. 5, n. 3, Set./Dez. 2001
physical, social, and psychological) construct. In one study among many, Hoover,Green and Saegert (1978) measured the association between an outside criterion(e.g., information search) and risk perception.
Research exists which attempts a type of scale validation. For example, Bettman(1973, 1975) analysed the relationship between his dichotomous scale andCunningham’s (1967) certainty/seriousness scale, and found similarities supportedby a significant analysis of variance. Woodside (1972) correlated his risk-takingscale with the choice dilemma scale of Kogan and Wallach (1964) and also foundsupport for his scale.
Several investigators (e.g., Hirish, Dornoff and Kernan, 1972; Zickmund andScott, 1973) have been exploring the discriminant relationship of perceived riskwith other related constructs (e.g., self-confidence). These studies have beensuccessful in providing evidence regarding the observed relationships proposed inthe predicted direction. However, after digging the literature for this research,only two studies (Lumpkin and Massey, 1983; Mitchell, 1991) were uncoveredwhich furthered an extensive construct validation of the perceived risk concept.
Lumpkin and Massey (1983) employed the multitrait-multimethod (MTMM)matrix approach proposed by Campbell and Fisk (1959) which provides evidencefor both convergent and discriminant validity. They explored two different perceivedrisk scales (the riskiness scale as the one used by Spence, Engel and Blackwell[1970]) and Cunningham’s (1967) certainty/seriousness scale and found bothmethods to be valid.
The multitrait-multimethod matrix is a table of correlations that enablessimultaneous assessment of both the convergent and discriminant validity of aconstruct. Dowling (1986) and Churchill (1979, 1995) have recommended thisprocedure as a convenient way of establishing the convergent and discriminantvalidity of a measure. The matrix is based on the principle that the more featurestwo measurements have in common, the higher their correlation will be. Accordingto Judd, Smith and Kidder (1991), measurements can share two types of features.They are traits and methods. Traits can be understood as the underlying constructthe measurement is supposed to tap and methods are the form of the measurement.Ideally, scores should reflect only the intended trait and not be influenced by themethod.
In this study a form of the MTMM was used to check if the traits underconsideration, here risk perception - network servers and risk perception - mid-range laser printers, could be measured by three different measuring methods.
The first method was the riskiness scale presented in a 7-point semanticdifferential form ascending from not at all risky (1) to very risky (7).
RAC, v. 5, n. 3, Set./Dez. 2001 177
Convergent and Discriminant Validity of the Perceived Risk Scale
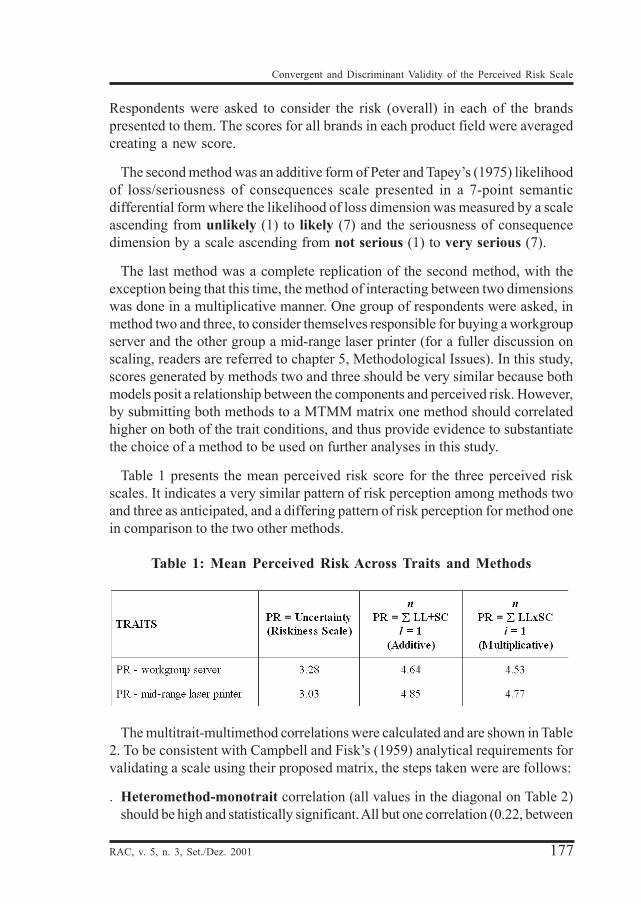
Respondents were asked to consider the risk (overall) in each of the brandspresented to them. The scores for all brands in each product field were averagedcreating a new score.
The second method was an additive form of Peter and Tapey’s (1975) likelihoodof loss/seriousness of consequences scale presented in a 7-point semanticdifferential form where the likelihood of loss dimension was measured by a scaleascending from unlikely (1) to likely (7) and the seriousness of consequencedimension by a scale ascending from not serious (1) to very serious (7).
The last method was a complete replication of the second method, with theexception being that this time, the method of interacting between two dimensionswas done in a multiplicative manner. One group of respondents were asked, inmethod two and three, to consider themselves responsible for buying a workgroupserver and the other group a mid-range laser printer (for a fuller discussion onscaling, readers are referred to chapter 5, Methodological Issues). In this study,scores generated by methods two and three should be very similar because bothmodels posit a relationship between the components and perceived risk. However,by submitting both methods to a MTMM matrix one method should correlatedhigher on both of the trait conditions, and thus provide evidence to substantiatethe choice of a method to be used on further analyses in this study.
Table 1 presents the mean perceived risk score for the three perceived riskscales. It indicates a very similar pattern of risk perception among methods twoand three as anticipated, and a differing pattern of risk perception for method onein comparison to the two other methods.
Table 1: Mean Perceived Risk Across Traits and Methods
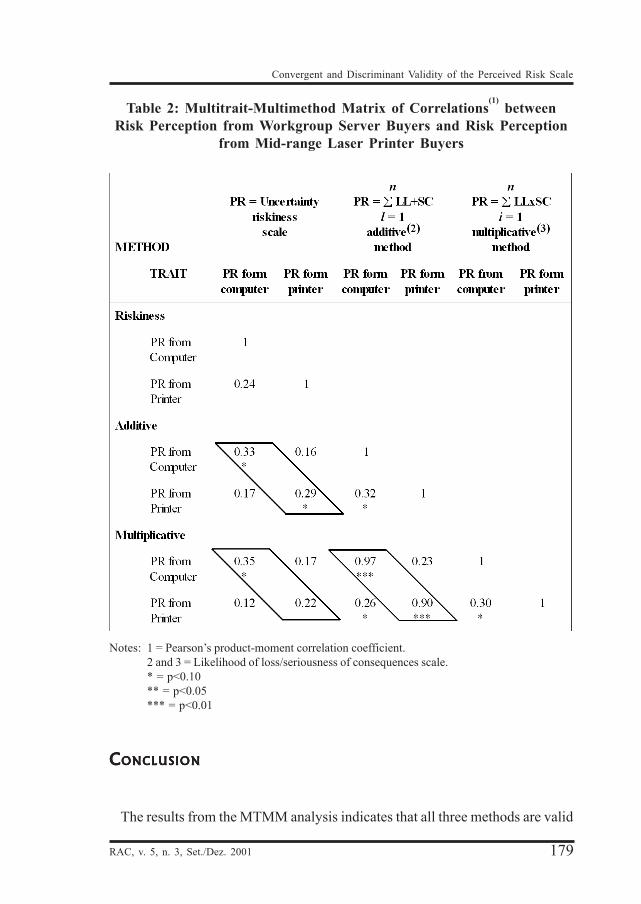
The multitrait-multimethod correlations were calculated and are shown in Table2. To be consistent with Campbell and Fisk’s (1959) analytical requirements forvalidating a scale using their proposed matrix, the steps taken were are follows:
. Heteromethod-monotrait correlation (all values in the diagonal on Table 2)should be high and statistically significant. All but one correlation (0.22, between
178
Sérgio C. Benício de Mello e Martin Collins
RAC, v. 5, n. 3, Set./Dez. 2001
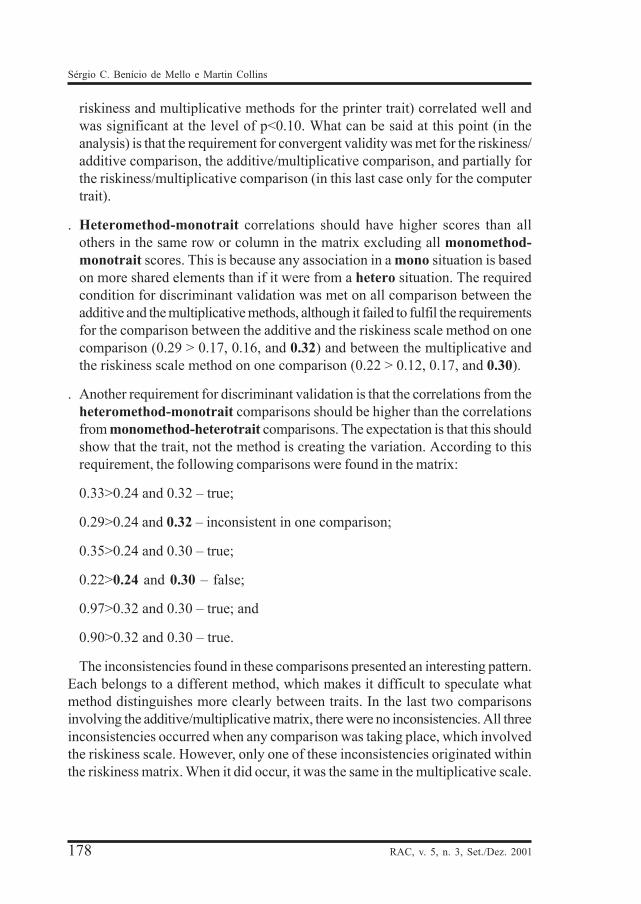
riskiness and multiplicative methods for the printer trait) correlated well andwas significant at the level of p<0.10. What can be said at this point (in theanalysis) is that the requirement for convergent validity was met for the riskiness/additive comparison, the additive/multiplicative comparison, and partially forthe riskiness/multiplicative comparison (in this last case only for the computertrait).
. Heteromethod-monotrait correlations should have higher scores than allothers in the same row or column in the matrix excluding all monomethod-monotrait scores. This is because any association in a mono situation is basedon more shared elements than if it were from a hetero situation. The requiredcondition for discriminant validation was met on all comparison between theadditive and the multiplicative methods, although it failed to fulfil the requirementsfor the comparison between the additive and the riskiness scale method on onecomparison (0.29 > 0.17, 0.16, and 0.32) and between the multiplicative andthe riskiness scale method on one comparison (0.22 > 0.12, 0.17, and 0.30).
. Another requirement for discriminant validation is that the correlations from theheteromethod-monotrait comparisons should be higher than the correlationsfrom monomethod-heterotrait comparisons. The expectation is that this shouldshow that the trait, not the method is creating the variation. According to thisrequirement, the following comparisons were found in the matrix:
0.33>0.24 and 0.32 – true;
0.29>0.24 and 0.32 – inconsistent in one comparison;
0.35>0.24 and 0.30 – true;
0.22>0.24 and 0.30 – false;
0.97>0.32 and 0.30 – true; and
0.90>0.32 and 0.30 – true.
The inconsistencies found in these comparisons presented an interesting pattern.Each belongs to a different method, which makes it difficult to speculate whatmethod distinguishes more clearly between traits. In the last two comparisonsinvolving the additive/multiplicative matrix, there were no inconsistencies. All threeinconsistencies occurred when any comparison was taking place, which involvedthe riskiness scale. However, only one of these inconsistencies originated withinthe riskiness matrix. When it did occur, it was the same in the multiplicative scale.
RAC, v. 5, n. 3, Set./Dez. 2001 179
Convergent and Discriminant Validity of the Perceived Risk Scale
Table 2: Multitrait-Multimethod Matrix of Correlations(1)
betweenRisk Perception from Workgroup Server Buyers and Risk Perception
from Mid-range Laser Printer Buyers
Notes: 1 = Pearson’s product-moment correlation coefficient.2 and 3 = Likelihood of loss/seriousness of consequences scale.* = p<0.10** = p<0.05*** = p<0.01
CCCCCONCLUSIONONCLUSIONONCLUSIONONCLUSIONONCLUSION
The results from the MTMM analysis indicates that all three methods are valid
180
Sérgio C. Benício de Mello e Martin Collins
RAC, v. 5, n. 3, Set./Dez. 2001
to assess risk perception. Nevertheless, it failed to provide strong evidence aboutwhich of these methods is better in distinguishing among traits. Thus, severalfacts were considered. These were:
. The two component model of certainty/consequences has been used for overthirty years by many perceived risk investigators (e.g., Cunningham [1967],Peter and Ryan [1976], Greatorex and Mitchell [1991], Yates [1992], to listseveral). The long-lasting history and tradition of this conceptualisation is evidencein itself that this form of measure has proved to be of some worth.
. The riskiness scale has also a long history and many advocates (e.g., Spence,Engel and Blackwell, 1970; De Chernatony, 1988, 1989). Nevertheless thenumber of enthusiasts of this method is smaller than those of the certainty/consequences model. When faced with a decision of choosing between twomethods, one should look first at the fact that studies using the certainty/consequence method constitute a wealthy data set for possible comparisons,while this is not the case regarding the other method (riskiness). The number ofstudies in the better case is smaller, limiting any comparability of measure.Thus, it seems logical to choose the two-component model.
. Another long-lasting discussion about the advantages and disadvantages of eachof the two major component models (i.e., additive or multiplicative) have beendividing researchers. Most of the work in perceived risk (mainly in psychologyand decision-making) has proposed some sort of multiplicative formulation (Sieberand Lanzetta, 1964), nevertheless such mathematical representation for consumerdecision processes may be overly complicated (Wright, 1973). Finally, Lanzettaand Driscoll (1968) after empirically testing; supported the liner model. Theyfound a positive correlation between certainty and consequences and inferredthat this relationship might lead to an additive model being better by hinderingthe performance of multiplicative models. Peter and Ryan’s (1976) study hasconcluded that the additive model was correlated more highly with brandpreference than the multiplicative form.
The findings indicate that all three types of scales had construct validity but theriskiness scale seemed to provoke some fuzzy effects when compared to othermethods. Moreover, it did not perform as well as the other methods in distinguishingamong traits. However, it did provide the smallest risk perception across traitsand methods. These results may have happened due to several reasons, like: (1)the riskyness scale is simplified and provides a clarity of presentation whichfacilitates the ability of respondents to associates the measure with risk; (2) thetraits are part of one product field and very closely associated along the riskdimension what could in some way favour the more complex and accurate methods
RAC, v. 5, n. 3, Set./Dez. 2001 181
Convergent and Discriminant Validity of the Perceived Risk Scale
of certainty/seriousness. On the other hand, the two-dimensional measures tendto confuse respondents due to their inherent complexity.
Future research should be directed towards improving construct validation ofthe perceived risk scale by using other statistical approach such as factor analysis.One should also look after resolving questions of respondent bias, respondentconfusion and exploring traits from different product fields. If these problems aretaken care of, a better measurement of perceived risk can emerge allowing amore precise understanding of buyer behaviour.
RRRRREFERENCESEFERENCESEFERENCESEFERENCESEFERENCES
BAUER, R.Consumer behavior as risk taking.In: HANCOCK, R. (Ed.).Dynamic marketing for achanging world. Chicago:American Marketing Association,1960. p. 389-398.
BETTMAN, J. R.Perceived risk and itscomponents: a model andempirical test. Journal ofMarketing Research, v. 10, p.184-190, 1973.
Information integration inconsumer risk perception: acomparison of two models ofcomponent conceptualization.Journal of Applied Psychology,v. 60, n. 3, p. 381-385, 1975.
BOZE, B. V.Selection of legal services: aninvestigation of perceived risk.
Journal of ProfessionalService Marketing, v. 3, n. 2,p. 287-97, 1987.
BROOKER, G.An assesssment of expandedmeasure of perceived risk.Advances in ConsumerResearch, v. 11, p. 439-41, 1984.
CAMPBELL, D.;FISK, D.
Convergent and discriminantvalidation by the multitrait-multimethod matrix.Psychological Bulletin, v. 56, p.81-105, 1959.
CARROL, N. V.;SIRIDHARA, C.;FINCHAM, J. E.
Perceived risks & pharmacists’generic substitution behaviour.Journal of Consumer Affairs,v. 20, p. 36-47, 1986.
182
Sérgio C. Benício de Mello e Martin Collins
RAC, v. 5, n. 3, Set./Dez. 2001
CHOFFRAY, J-M.;JOHNSTON, P. E.
Measuring perceived pre-purchase risk for a new industrialproduct. Industrial MarketingManagement, v. 8, p. 333-40,1979.
CHURCHILL, G. A.A paradigm for developing bettermeasures of marketingconstructs. Journal ofMarketing Research, v. 16, p.64-73, 1979.
Marketing research:methodological foundations. 6. ed.Forth Worth: The Dryden Press,1995.
COHEN, J. B.Exploring attitude constructvalidity: or are we? Advances inConsumer Research, v. 6, p.303-306, 1979.
CUNNINGHAM, S. M.The major dimensions ofperceived risk. In: COX, D. (Ed.).Risk taking and informationhandling in consumerbehavior. Boston: HarvardUniversity Press, 1967. p. 82-108.
DASH, J. F.;SCHIFFMAN, L. G.;BERENSON, C.
Risk and personality-related
dimensions of store choice.Journal of Marketing, v. 40, p.32-9, Jan. 1976.
DE CHERNATONY, L.Products as arrays of cues: howdo consumers evaluate competingbrands? In: 21ST ANNUALCONFERENCE - MARKETINGEDUCATION GROUP (1988:[s.l.]). Proceedings... [s.l.]:Huddersfield Polytechnic, 1988.p. 1-11.
Branding in an era of retailerdominance. Industrial Journalof Advertising, v. 8, p. 245-60,1989.
DE MELLO, S. C. B.An empirical of therelationship betweenperceived risk and the varyingpatterns of brand portrayal.London, 1997. Ph.D. (Thesis) -City University Business School.
DE VAUS, D. A.Surveys in social research. 4.ed. London: UCL Press, 1996.
DOWLING, G. R.Perceived risk: the concept andits measurement. Psychology &Marketing, v. 3, p. 193-210,1986.
RAC, v. 5, n. 3, Set./Dez. 2001 183
Convergent and Discriminant Validity of the Perceived Risk Scale
GEMUNDEN, H. G.Perceived risk and informationsearch: a systematic meta-analysis of the empirical evidence.International Journal ofResearch in Marketing, v. 2,n. 2, p. 79-100, 1985.
GREATOREX, M.;MITCHELL, V-W.
Risk reduction by industrial buyersof mid-range computers. In:MARKETING EDUCATIONGROUP CONFERENCE (1991:Cardiff). Proceedings... Cardiff:1991. p. 476-491.
Developing the perceived riskconcept. In: MARKETINGEDUCATION GROUPCONFERENCE (1993: [s.l.]).Proceedings... [s.l.]:Loughborough University, 1993.p. 405-415.
GUSEMAN, D. S.Risk perception & risk reductionin consumer services. In:AMERICAN MARKETINGASSOCIATION (1981: [s.l.]).Proceedings... [s.l.]: 1981. p.200-204.
HAMPTON, G. M.Perceived risk in buying productsmade abroad by American films.Baylor Business Studies, v. 8,p. 53-64, Aug. 1977.
HENTHORNE, T. L.;LATOUR, M. S.;WILLIAMS, A. J.
How organizational buyers reducerisk. Industrial MarketingManagement, v. 22, p. 41-48,1993.
HISRICH, R. D.;DORNOFF, R. J.;KERNAN, J. B.
Perceived risk in store choice.Journal of MarketingResearch, v. 9, p. 435-439, 1972.
HOOVER, R. J.;GREEN, R. T.;SAEGERT, J.
A cross-national study ofperceived risk. Journal ofMarketing, v. 42, n. 3, p. 102-108, 1978.
HORTON, R. L.The structure of decision risk:some further progress. Journalof the Academy of MarketingScience, v. 4, n. 4, p. 694-706,1976.
Some relationships betweenpersonality and consumer decisionmaking. Journal of MarketingResearch, v.16, p. 233-246, May1979.
184
Sérgio C. Benício de Mello e Martin Collins
RAC, v. 5, n. 3, Set./Dez. 2001
JACOBY, J.;KAPLAN, L. B.
The components of perceivedrisk. In: 3RD ANNUALCONFERENCE (1972: [s.l.]).Proceedings... Chicago:Association for ConsumerResearch, 1972. p. 382-393.
JOAG, S. G.Formation of risk perceptionsin industrial purchasingdecisions: an informationintegration analysis usingsimulated buying situations.Stillwater, 1985. Ph.D. (Thesis) –Oklahoma State University.
JUDD, C. M.;SMITH, E. R.;KIDDER, L. H.
Research methods in socialrelations. 6. ed. Forth Worth:Harcourt Brace JovanovichCollege Publishers, 1991.
KAPLAN, L. B.;SZYBILLO, G. J.;JACOBY, J.
Components of perceived risk inproduct purchase: a cross-validation. Journal of AppliedPsychology, v. 59, n. 3, p. 287-291, 1974.
KINNEAR, T. C.;TAYLOR, J. R.
Marketing research: an appliedapproach. 5. ed. New York:McGraw-Hill, 1996.
KOGAN, N.;WALLACH, M. A.
Risk taking: a study in cognitionand personality. New York: Holt,Rhinehart & Winston, 1964.
LANZETTA, J. T.;DRISCOLL, J. M.
Effects of uncertainty andimportance on information searchin decision making. Journal ofPersonality and SocialPsychology, v.10, n. 4, p. 479-486, 1968.
LUMPKIN, J. R.;MASSEY, T. K.
Convergent and discriminantvalidity of alternative perceivedrisk scales. In: SOUTHERNMARKETING ASSOCIATION(1983: [s.l.]). Proceedings...[s.l.]: 1983. p. 257-260.
MALHOTRA, N. K.Marketing research: an appliedorientation. 2. ed. EnglewoodCliffs, NJ: Prentice-Hall, 1996.
RAC, v. 5, n. 3, Set./Dez. 2001 185
Convergent and Discriminant Validity of the Perceived Risk Scale
MITCHELL, V-W.An empirical investigation ofperceived risk in the purchaseof planning consultancy bylocal authorities. Manchester,1991. Ph.D. (Thesis) - Instituteof Science and Technology,University of Manchester.
PETER, J. P.Construct validity: a review ofbasic issues and marketingpractices. Journal ofMarketing Research, v. 18, p.133-145, 1981.
PETER, J. P.;RYAN, M. J.
An investigation of perceived riskat the brand level. Journal ofMarketing Research, v.13, p.184-188, 1976.
PETER, J. P.;TARPEY, L. X.
A comparative analysis of threeconsumer decision strategies.Journal of ConsumerResearch, v. 1, p. 29-38, June1975.
ROSS, I.Perceived risk and consumerbehavior: a critical review.Advances in ConsumerResearch, v. 2, p. 1-19, 1974.
RUST, J.;GOLOMBOK, S.
Modern psychometrics: thescience of psychologicalassessment. London: Routledge,1989.
SIEBER, J. E.;LANZETTA, J. T.
Conflict and conceptual structureas determinants of decisionmaking behavior. Journal ofPersonality, v. 32, p. 622-641,Dec. 1964.
SINGH, J.;RHOADS, G. K.
Boundary role ambiguity inmarketing-oriented positions: amultidimensional, multifacetedoperationalization. Journal ofMarketing Research, v. 28, p.328-338, Aug. 1991.
SINGLETON JR., R. A.;STRAITS, B.;STRAITS, M. M.
Approaches to socialresearch . 2. ed. New York:Oxford University Press, 1993.
SPENCE, H. E.;ENGEL, J. F.;BLACKWELL, R. D.
Perceived risk in mail-order andretail store buying. Journal ofMarketing Research, v. 8, p.364-369, Aug. 1970.
186
Sérgio C. Benício de Mello e Martin Collins
RAC, v. 5, n. 3, Set./Dez. 2001
SPIRO, R. L.;WEITZ, B. A.
Adaptive selling:conceptualization, measurement,and nomological validity. Journalof Marketing Research, v. 27,p. 61-69, Feb. 1990.
STONE, R. N.;GRØNHAUG, K.
Perceived risk: furtherconsiderations for the marketingdiscipline. European Journal ofMarketing, v. 27, n. 3, p. 39-50,1993.
STONE, R. N.;WINTER, F. W.
Risk: is it still uncertainty timesconsequences. AmericanMarketing Association, [s.n.],p. 261-265, 1987.
WOODSIDE, A.Informal group influences on risktaking. Journal of MarketingResearch, v. 9, p. 223-225, May1972.
WRIGHT, P. L.The simplifying consumer:perspectives on informationprocessing strategies. AmericanMarketing AssociationDoctoral Consortium, [s.n.],1973.
YATES, J. F.Risk-taking behavior. NewYork: John Wiley & Sons, 1992.
YATES, J. F.;STONE, E. R.
The risk construct. In: YATES, J.F. (Ed.). Risk-taking behavior.New York: John Willey & Sons,1992. p. 1-26.
ZICKMUND, W. G.;SCOTT, J. E.
A multivariate analysis ofperceived risk, self-confidenceand information sources. In:WARD, S.; WRIGHT, P. (Eds.).Advances in consumerresearch. [s.l.]: 1973. p. 406-416.