Embed Size (px)
Citation preview

convergenceanalytics 3.0further challenges and consolidation in a volatile market
2014

Rand Schulman is a pioneer in digital marketing and new media. He was founder and chief executive of one of the first SaaS-based web-analytics com-panies, Keylime Software which was acquired by Yahoo!. Schul-man lead products and strategy at Webtrends, and was chief marketing officer of WebSide-Story through its IPO, which was
later acquired by Omniture/Adobe. Schulman was general manager of Unica’s Internet Division, acquired by IBM.
Schulman was a co-founder, board member and is an emeri tus board director of the DAA. He’s been a trustee of the Direct Marketing Educational Foundation and is an executive-in-residence at the University of the Pacific for New Media and Market ing. He was named one of the top 100 BtoB Market ers by BtoB Magazine and is widely quoted and has numerous published articles on digital marketing.
He is currently board member and advises numerous mo-bile and social media companies - Viral Heat, Inbound Writ-er, SRI/Tempo, InsideView, Motally, Kontagent, Oomolo, and Covario/Rio as well as larger organizations and investors about disruptive marketing trends. Schulman is a manag-ing partner with Efectyv Digital along with Andrew Edwards.
www.efectyv.com [email protected] @randschulman
Andrew Edwards has been a pioneer in the digital space since the 1980s. He introduced desktop publish-ing to the Yellow Pages, helped create “interactive television” with AT&T, taught advanced computer graphics at New York’s Pratt Institute; and founded Renaissance Multi-
media where he launched web sites for SoBe Beverage and Canon Digital Video. In 1998 he was awarded Deloitte and Touche’s National Fast 500 Award. Today he is one of the most senior thought-leaders in the digital analytics space and a regular columnist for ClickZ (Incisive Media).
Edwards is a founder and former board member of the Digital Analytics Association (DAA), as well as a managing partner at Technology Leaders where he has provided digi-tal analytics expertise to numerous F500 companies. Along with Rand Schulman, he founded Efectyv Digital in 2012.
www.efectyv.com [email protected] @AndrewVEdwards
About the Authors
convergenceanalytics 3.0further challenges and consolidation in a volatile market
By Andrew Edwards and Rand Schulman
Research Director: Jay McCarthy
Mixed signals: should you go or stop?
© Copyright 2014 Efectyv Digital. All rights reserved.
www.efectyv.com

Contents
Benefits of the Report 1
Update: Marketing Clouds and Convergence 2
Executive Summary 3
Stratification and Consolidation 5
Convergence Analytics Market Landscape (Visualizations of the Market) 8
Stacks and Channels 15
Where are the Real Solutions? 17
The Perils of Differentiation 19
Conclusions 21
Recommendations 23
Appendix A—Survey Charts 25
Appendix B: Sample Vendors 33
Escape the siren song of vendor promises.

CHANGES AND CONSOLIDATION IN A VOLATILE MARKET 1
Benefits of the Report
The Convergence Analytics 2.0 Report provides a wealth of market data and analysis. It is rich in value to both end-users and vendors of digital analytics and multi-channel analytics technology and services.
Benefits to End-Users: The Convergence Analytics 2.0 Report has been conducted objectively and with the benefit of end-users in mind.
End-users can gain insights into how their peers are leveraging and investing in data-driven businesses, multi-channel analyt-ics, cloud computing and big data.
End-users can also gain key insights into the overall charac-teristics of a wide variety of Convergence Analytics vendor offerings, as well as their relation to one another, what they say in the marketplace, and how their tools can help drive insights into multi-channel data.
They can also find matches between vendor features and benefits to their own requirements (see Appendix B: Sample Vendors); as well as use the report to aid in the identification and selection of multi-channel and BI vendors.
Benefits to Vendors: Vendors of multi-channel, mobile, social analytics tools, as well as business intelligence and visualization tools can also benefit from our report in several important ways:
Market Definition: • Our report defines a market and allows end-users to
focus their attention on a crucible of disciplines that ad-dress their pressing needs. Vendors benefit by enabling an easier definition of their offering that helps end-users get closer to acceptance of the ultimate vendor solution.
Planning and Positioning: • Vendors will be enabled to see where their offering fits in
comparison to others available in the market, as well as understand how customers identify their needs.
• Using insights gained from the report, vendors can better differentiate their product from those of their competi-tion; as well as exploit market opportunities identified in the report.

2 CHANGES AND CONSOLIDATION IN A VOLATILE MARKET
Update: Marketing Clouds and Convergence
What stands out most since the original Efectyv Digital-Incisive Media report on Convergence Analytics is not thescope of da-ta-driven marketing convergence itself, but unfortunately, the umbrella of marketing cloud branding obfuscation designed to provide “air cover” to many dissimilar products and processes. It ends up making the job of a marketer even more complex, where there are only early signs of adoption.
We’ve been involved in SaaS products (for digital marketers) for many years and have held a steadfast belief that marketers would flock to our tools. The reality - it hasn’t happened yet. It could be argued that it is an industry problem, as we tend to hide the description of our solutions and applications using ill-defined words like marketing cloud, “realtime,” and predic-tive, which need context. Or, it could be that this is so hard to understand, and that marketing people are not wired to get it quickly?
Today there are more than 1,000 marketing applications in addition to the clouds. In fact, recently Oracle launched their own Marketing Cloud while Salesforce launched the Exact-Target Marketing Cloud featuring the Radian6 Buddy Media Social Studio! There are now a total of at least seven converged
“marketing clouds,” one each from IBM, Adobe, Google, SAP, HP, Oracle, and Salesforce. Beyond these marketing cloud companies, there are innumerable new “disruptive” apps that have come to market. And yet many marketers barely use the most basic functionality of the Web analytics applications we created decades ago. And it isn’t getting any easier for the marketing team as the landscape continues to radically change.
While CRM, marketing automation, and Web analytics sys-tems have been the foundational elements in the past, do tag management systems (TMS) vendors become the nucleus of new clouds, or atoms of old ones in the future ? They’ve sure been making a lot of news of late, with large funding rounds for Ensighten and Tealium and the acquisition of Tag Man (by Ensighten). These vendors see
themselves as the natural place to collect and move data around to other CA systems, and have product names like Audience Stream. However, none of these companies see
themselves, so far, building applications for higher up the stack. Rather, they see themselves as the enablers of convergence. But TMS applications are also part of the Google and Adobe clouds, which will present some interesting challenges for vendors and buyers alike. Will one buy TMS grouting from one store and app bricks from another?
The good news over this last year is that data continues to drive the pace. But what will happen when we get into the era of high-frequency marketing, when marketers can know who you are, and how much you will pay, and when, using predic-tive technology - before you do? Is that going too far?
Beyond apps and technology, there has been a convergence of process in the sales and marketing app space, anchored by CRM, but driven by social apps like Radian6, Viral Heat, and HootSuite; sales intelligence companies, like InsideView and Data.com; marketing automation (MA) applications like Eloqua, Marketo, and HubSpot; and email service providers (ESPs) Sil-ver Pop, Responsys, and ExactTarget systems, which all start to overlap. Salesforce, for example, owns one of each and has oth-ers waiting on the sidelines, like Pardot. Does Marketo become the nucleus of another cloud or an atom?
While the platform choices have become more difficult, navel gazing and privacy questions obscure decisive action and further compounds choice. And there is a convergence of roles in the enterprise, as big and small data topics have created de-mand for jobs that didn’t exist, those of data scientist, growth hacker and content engineer emerge. Yet, data privacy is being questioned with more intensity and there is backlash ferment-ing. Care must be taken by these new leaders.
Our survey noted that there is the lack of internal resources and new data suggests marketers continue to struggle with analytics in general. So, what is one to do to stay competitive during climate change, when these marketing clouds form and darken? It has been a year of rapid change and I expect nothing less from this year, so I guess it’s time to break out the galoshes.

CHANGES AND CONSOLIDATION IN A VOLATILE MARKET 3
Executive Summary
When the Wright brothers built their flying machine, they took a cluster of existing technologies, combined them in an innovative manner and came up with something long-sought and never-before-achieved. They may have called it a “flying machine” but we know it today as an airplane.
Convergence Analytics: that’s our name for the confluence of digital marketing, big data, cloud computing, data connectors and sophisticated presentation-layer capabilities. The rush is on for nearly every company that ever measured anything for marketers (and many that never have) to claim they’ve got what it takes to provide the best single-view into all marketing data.
Think of convergence analytics as the marketing equivalent of “one ring to rule them all”: many application vendors are claim-ing that within a single application they can, by connecting data from multiple sources, allow the marketer a 360 degree view of their customers’ behavior as well as supporting data from resource planning, pricing, demographic sources and more. This has long been a request from the market, and now application vendors are able to combine technologies in an attempt to meet that request.
Convergence Analytics (also sometimes called “multi-channel analytics”) is growing perhaps too fast as a discipline, because right now it’s experiencing some rather considerable growing pains.
We believe something is holding us back. Some have said the latest multi-channel measurement offerings are nothing but repackaged business intelligence tools; but our most recent survey suggests otherwise.
A CROWDED FIELD
Based on our research, we believe there are probably too many vendors saying too many of the same things about the same subjects. We believe there is a plethora of unremarkable tech-nology in the market and certainly not enough expertise.
We have found that the notion of “platform primacy” is a case of putting the cart before the horse. In this report we discuss
“the new 4 Ps of marketing analytics” in which platform (e.g., vendor solution) comes last (but not because it isn’t important).
We’ve noticed that some of the terminology in use today amounts to little short of obfuscation. Among the terms we address, and somewhat debunk, are “big data,” “real time” and
“predictive [analytics].”
Does anyone really know how to use all these new measure-ments? We believe expertise is in short supply as perhaps never before. The technology has raced ahead of the general ability to deploy it—and certainly ahead of the general ability to make sense of the outputs.
OVERHEATED GROWTH?
As we stated in our first report, perhaps the most salient factor in Convergence Analytics today is the speed at which vendors from every sector are converging on it; and the similarity of the problems they seek to solve. In a phrase, it seems that everybody is measuring everything: and telling the world. And evidence suggests there are now too many companies chasing the same elusive customer.
Too many vendors are saying the same things. . .there is a plethora of unremarkable technology in the market.
In addition, we examine if we’re really getting close to that goal of a single view for all the data—and whether it will be helpful if we have it. We review the vendors, and the trends that guide them. We offer some suggestions to potential buyers, and what challenges they need to overcome before making a decision.
BUSINESS INTELLIGENCE
Many practitioners and vendors today see a blurred line be-tween multi-channel measurement and what has traditionally been called “business intelligence.”
This report is based in part on a new survey focusing on the commonly deployed term business intelligence, and we be-lieve the survey has helped to clarify a number of issues.
We received responses from hundred of participants and many of the answers may surprise you. A few key findings are as fol-lows:

4 CHANGES AND CONSOLIDATION IN A VOLATILE MARKET
SURVEY RESULTS
Our first survey asked a number of questions about important topics in Convergence Analytics; and asked them of both ven-dors and end-users. In our current survey, we asked questions about business intelligence to end-users only. This year we have created two surveys sent to over one-half million digital professionals, and have collected over 1,000 responses. The most common job description, by far, was “marketing”; which gives credence to our observation that marketers are adopt-ing sophisticated analytics techniques rapidly and in great numbers.
SUMMARY
Almost 60 percent of respondents said they use a business intelligence tool or “other multi-channel tracking tool” for marketing. Clearly “web-only” analytics is a shrinking portion of the market.
Of those who said they are tracking multi-channel data, 88 percent said they have web analytics in the mix; and 70 per-cent said they had an in-house analytics services team. This suggests saturation in the web analytics market and robust internal staffing for analytics; and the largest segment of them (32 percent) reports not to a technology manager but a senior marketing manager. This fact suggests that in many companies, marketing is taking more ownership of data than in the past.
A solid majority of respondents do not have “data scientists” on staff; at the same time fully 85 percent of them use presenta-tion decks to translate data into “human language” for execu-tive consumption. This pair of facts strongly suggests complex data discovery is beyond the ken of most companies, and that one of their most overriding concerns is boiling down the data
they do have into clear insights—presumably to drive decision-making.
More than 40 percent of respondents said they incorporated at least one of the following in their multi-channel reporting: web, mobile, social, logged-in data, CRM and standard demo-graphics. The least-reported metric in use was COGS or cost-of-goods-sold—only a few percent of respondents incorporated this metric.
Dashboarding is the most-used feature of BI tools. A majority of users want their BI tool to integrate more data sources than it currently does.
Overall, BI futures look to be on the cloudy side, to wit: of those who do not use BI tools, over 55 percent said it was either too expensive or that they lacked internal resources to handle it. Only 6 percent said they plan to begin using it in the next year. This suggests the parameters of this market are already rather fixed; that companies that are not using it today are relatively unlikely to begin using it any time soon. The lack of internal resources suggests a continuing struggle with analytics in general.
Overall, about 35 percent of respondents belonged to compa-nies employing over 250 people. A solid majority of respon-dents overall were marketers; and SEO/SEM seemed to be the most common specialty. We expect the latter figure to drop as mobile begins to take off (unless the technology changes, SEO doesn’t offer much help to app marketers in the mobile space).
Please see “Appendix A” for full report results.
CHANGES AND CONSOLIDATION IN A VOLATILE MARKET 5
Stratification and Consolidation
The explosion of companies we can identify as part of the Con-vergence Analytics movement has much in common with prior transformations both in the digital community and in business communities more generally. Successive boom and contrac-tion cycles have suggested that stratification and consolidation are hallmarks of a maturing market.
Chiefly, the similarities include:
• Sudden influx of vendors with similar messaging• Vendors racing ahead of where the customer base
resides• Premium on subject matter expertise• Market fragmentation and confusion• Emerging stratification of vendors• Incipient consolidation
SUDDEN INFLUX
Since our first CA report, in which we noted the emergence of a high number of vendors claiming they could deploy against multi-channel data and show it to marketers in a visually ap-pealing way, the pace at which vendors enter the space (with their own messaging) has only increased. It seems every few days another entrant has appeared in the market. Of late these include companies like Origami Logic, AgilOne and Bright-Funnel. Some of the technologies bundled into Convergence Analytics offerings (“real-time analytics” for instance) may be
“answers in search of questions”; a claim levied against tech-nologies in the past that have gone on to be successful (the Internet, for instance!*). That said, we believe the sheer number of new entrants suggests a trend towards overreach.
RACING AHEAD
Overreach occurs when vendors, empowered by new tech-nologies and superior vision, race to the edge of what’s pos-sible today—but too often, without having conducted market research to see where the customers are residing. While there is certainly a customer base for multi-channel analytics and visualization, many end-users remain either unaware that a
* Re: the Internet. For those who don’t recall, the Internet itself was seen as an esoteric non-starter by what was then called “big business.” Common complaints from both enterprises and advertising agencies were such as
“who needs this?” and “who is going to pay for this?” Only when the public began to adopt “the web” in sufficient numbers in the late 1990s did enter-prises become digital marketers.
class of tools exist for doing as much, or they are still struggling with more basic data analysis concerns. It may take some time before the end-user catches up to the vendor in the Conver-gence Analytics space. During this period it will be difficult for underfunded companies to survive—much like pioneers struggling out on the cold prairie waiting for railroad tracks to transport in the run of humanity (customers) that might make their pioneering pay off.
EXPERTISE
We know that many customers continue to struggle with more basic analytics challenges than those suggested by multi-channel, big data efforts. An enormous and under-attended challenge is that of talent deployment—or lack thereof. There’s a premium on technicians, analysts and expertise in Conver-gence Analytics generally. And you don’t have to be a fan of the term to see it: call it multi-channel, call it big data, call it marketing analytics or whatever. Outside of the small vendor communities where experts naturally congregate, there are very few practitioner-experts dealing with un-siloed data and its consequences. One of the primary barriers to adoption (and success!) is lack of expertise.
We believe that since analytics solutions have existed for nearly 20 years with only rudimentary understanding of how they function and what they deliver, then there must be a funda-mental disconnect between vendors and practitioners. It’s pos-sible higher education has failed to create the proper curricula. It is certainly the case that universities continue to graduate students ill-equipped to deploy and derive value from the best and most powerful analytics tools. It’s entirely possible that technological capability has begun to outstrip our ability to comprehend and socialize its ramification. If nothing else, our survey responses seem to illustrate that.
Technology has begun to outstrip our ability to comprehend and socialize it.
We can make a case for laying blame at the doorstep of the university. But even veteran analytics teams too often “max out” with web analytics; and it’s a stretch for them to accom-modate even modest extensions such as mobile analytics. For the remaining Convergence disciplines, the base of expertise is vanishingly small and often cannot be had in volume at any price.
6 CHANGES AND CONSOLIDATION IN A VOLATILE MARKET
It’s important to note that “expertise” is not a one-dimensional aspect of the equation. Expertise can be technical and deploy-ment-focused; it can be focused on a clear understanding of what the meaning and limitation of data implies for the organi-zation (especially when cohort data can lead to what is some-times referred to as a “false positive correlation”); and it may also mean the ability to interpret multi-dimensional reporting and communicate its meaning to a variety of constituencies at the organization.
In brief, expertise is both a complex and a pressing need.
We expect multi-channel analytics will fail to drive deci-sions in measurable volume until the expertise gap is narrowed.
FRAGMENTATION
One of the chief drivers for the very notion of Convergence Analytics is to defeat market fragmentation. We believe it’s unhelpful to both vendors and end-users that many ven-dors and practitioners are in pursuit of similar goals, yet lack a common dialect. Instead, vendors try to create posi-tioning more than we believe is healthy; and often without true differentiation. If they are not differentiating as much as they say they are, this suggests a gap between vendor marketing and vendor capabilities. It also serves only to confuse and turn away practitioners who need recognizable standards and line items in order to plan deployments and allocate budgets.
The closest we have seen to a real line item for the current disciplines is when organizations (often erroneously) cre-ate budgets for “big data” when such big data challenges hardly exist within the organization.
Clearly it’s time for vendors and practitioners to accept the similarities in features, benefits and goals in the current market. We believe the establishment of a Convergence Analytics market will encompass a sufficient amount of vendors in a viable space, helping them market more coherently to an engaged customer base. And we believe practitioners will more readily participate when they under-stand how this confluence of technologies and practices is both natural and very serviceable to their data-driven goals.
STRATIFICATION
Not all vendors are created equal. It’s laudable for a small company to aim high, but merely to say one competes with a behemoth does not make it so. Many niche-players
in Convergence Analytics today exploit market confusion to make claims they are the market equal of much larger vendors with much more mature product suites.
While the software industry is nothing if not conducive to clever startups and disruptive technologies, we believe the current analytics market has nonetheless already strati-fied into three tiers at least. The top tier includes large enterprises with analytics capabilities and broad, capable product suites (Adobe, IBM for example). The second tier includes robust, well-funded or profitable multi-channel analytics vendors with strong sales and a wide variety of customers (Gooddata, Birst, Tableau).
The third tier comprises everyone else. Many of these third tier companies may be valuable to the practitioner and may be headed for great days ahead. But many of them are currently limited players with small customer bases and either unproven or un-special technologies; it’s a grab-bag of companies and some will win and some will disappear.
But if history is our guide, most current vendors in the multi-channel analytics space will disappear altogether, or their technology will become available as a “tuck under” for a larger vendor. It’s important to note that in some in-stances, the larger vendor acquires the smaller firm for its customers, rather than the technology!
In any case, the most successful companies will need a broad base of customers or ample funding to survive the next phase of competition. For instance, Birst has raised over $30 million in a recent round of funding—because it has managed to establish itself as a platform to be reckoned with. Tableau in similar fashion seems to have garnered enough of a customer base and enough funding to get to the next level.
Beyond that, it will depend on how well the company can service its base, continue to innovate, and how it can craft a message that is both identifiable within a broader space and unique enough to be truly differentiated within that space. We believe the eventual shape of the market will be formed by companies that excel at more niche offerings—targeted at particular audiences with particular needs the solution to which has a high and consistent value.
CONSOLIDATION
The Convergence Analytics market may soon be larger but at some point it will have fewer vendors. We believe that practitioners will inevitably adopt these technologies and

CHANGES AND CONSOLIDATION IN A VOLATILE MARKET 7
their use will become much more widespread as they become more “mainstream.” But we also believe the process to broader adoption will be bruising and that the weaker players will either be forced to drop out or be acquired.
For the next year or 18 months, we expect to continue seeing new entrants in what seems today like a greenfield oppor-tunity for both vendors and practitioners. However, beyond that horizon, we believe the winning technologies will either
establish themselves as sales winners or be acquired by those in the field that are already large and will have access to capital enabling them to buy their competition or expand their of-ferings by purchasing best-of-breed. The rest will fall by the wayside, neither adopted by customers in sufficient number, nor bought by a larger rival. In three years the practice of Convergence Analytics will be much larger but the number of vendors servicing it will be smaller.
Rules of the road for vendors: buy, sell or make friends with customers.

8 CHANGES AND CONSOLIDATION IN A VOLATILE MARKET
Convergence Analytics Market Landscape (Visualizations of the Market)
While it’s true that “everybody is measuring everything,” we know the phrase is a kind of shorthand for saying there are lots of vendors and practitioners involved in measuring a variety of data clusters in a wide variety of ways. The Convergence Ana-lytics market is fairly broad, and some of our latest charts show how certain disciplines act as “attractors” to different technolo-gies in the space.
METHODOLOGY
Research Director Jay McCarthy describes the methodology he used to envision and create the charts shown below:
“We reviewed vendor external marketing materials (web site, webinars, and videos) extensively and spoke with vendors directly. Based on our review of their apparent positioning, we began to develop a visual matrix that represented their relationship to specific market segments and disciplines and in some cases, to one another.
If a vendor discussed marketing analytics we would look to see how much depth of discussion they engaged in; and if it looked shallow and they also had similar material about unrelated analytics use cases then we assumed a typical (wide) BI approach. If however they either (a) appeared to be solely fo-cused on a particular user or use case, or (b) showed an uncom-mon depth of expertise in a particular area then we assumed a greater level of focus.”
On the following pages, you’ll see some of our relationship graphs, as well as a graph describing an important marketing opportunity for vendors based on a continuing marketer chal-lenge.
Below you’ll see areas of focus laid out in the form of “gravita-tional bodies” around which vendors cluster much as moons do around Jupiter and Mars. We’ve placed the vendors in each case relative to their association with a particular type of disci-pline within the overall Convergence Analytics galaxy.

CHANGES AND CONSOLIDATION IN A VOLATILE MARKET 9
.
The chart below describes the features and use cases for each discipline in the prior chart:
The chart below shows important relationships between disciplines within groupings of companies. For instance, Digital and Web Analytics vendors often deliver both social analytics and mobile analytics as well as automation and attribution. Compa-nies with Specialized Analytics offerings typically add only Big Data Analytics to their product mix.
10 CHANGES AND CONSOLIDATION IN A VOLATILE MARKET
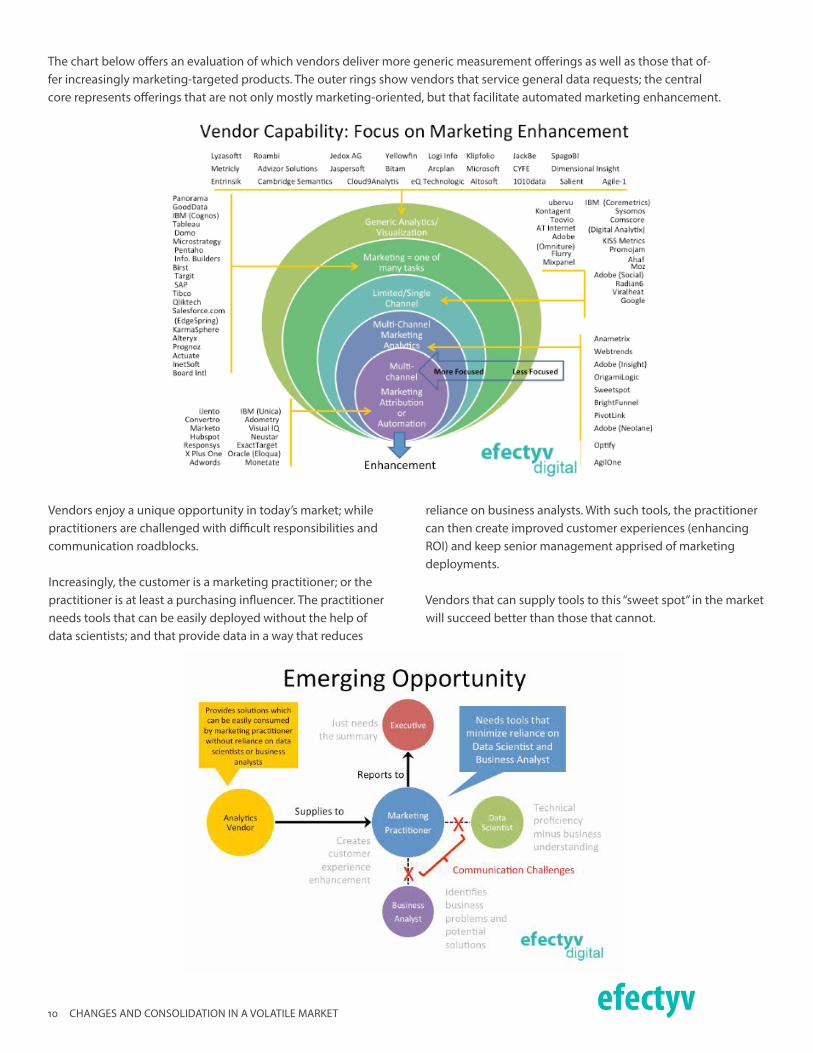
Vendors enjoy a unique opportunity in today’s market; while practitioners are challenged with difficult responsibilities and communication roadblocks.
Increasingly, the customer is a marketing practitioner; or the practitioner is at least a purchasing influencer. The practitioner needs tools that can be easily deployed without the help of data scientists; and that provide data in a way that reduces
reliance on business analysts. With such tools, the practitioner can then create improved customer experiences (enhancing ROI) and keep senior management apprised of marketing deployments.
Vendors that can supply tools to this “sweet spot” in the market will succeed better than those that cannot.
The chart below offers an evaluation of which vendors deliver more generic measurement offerings as well as those that of-fer increasingly marketing-targeted products. The outer rings show vendors that service general data requests; the central core represents offerings that are not only mostly marketing-oriented, but that facilitate automated marketing enhancement.

CHANGES AND CONSOLIDATION IN A VOLATILE MARKET 11
Terminology: What They’re Saying, What It Really MeansAt a recent “mobile” conference, one attendee expressed surprise that the Digital Analytics Association had ever been called the Web Analytics Association. The organiza-tional name-change took place not more than two years ago. But for at least some digital marketers, that time period is already prehistoric.
In a fast-changing landscape, it becomes harder to make sure terminology retains a semblance of true connection to the facts on the ground. Much as “web analytics” became an archaic form in rapid fashion, we expect terminology to continue evolving at Formula 1 speeds. Thus we remain on the lookout for redefinition and/or retirement of certain terms now in vogue.
The following terms are at this date perhaps at their zenith of popularity. At the same time they may have become untethered from original intent; or are misunderstood; or have become too amorphous to be of particular use.
• Big data• Mobile• Real time• Marketing analytics• Business intelligence
BIG DATA
Perhaps because it is a particularly catchy locution, this term has emerged as what seems like the most commonly used and maybe the most misunderstood term in the world of analytics today.
Trace its roots back to the notion that all organizations need to be “data-driven.” We are in full agreement that organizations need to be data-driven, but that is not to sug-gest a replacement mechanism for human interaction or creativity. “Data-driven” companies understand they can no longer fly the plane without instruments. But they should also take note that auto-pilot is not the answer. And we certainly want to avoid the marketing equivalent of errant drone strikes! Pilots are still needed.
Big data is the icon of the data-driven workplace. It has become a classic “buzzword.”
As such, it has become a term upon which many tend to project their own hopes and fears, while paying scant attention to whether big data is even a relevant part of their own conversation. Many organizations have taken to creating budgets for “big data” projects even when they only have “medium data”; and certainly marketers of every stripe have felt a need to somehow grapple with the con-cept (fewer actually deal with the reality).
A simplistic definition of “big data” would be that it is just another term for “lots of data.” And this is certainly part of the definition (if only we could figure out what “lots of” means!). But it’s more than that. It’s also the (skilled) peo-ple, practices and applications required to do things with data. And here’s where the classic “disconnect” occurs.
Big data has become an icon of the data-driven workplace…and has become a classic buzzword.
Many organizations may feel overwhelmed with data, but that’s not surprising in today’s environment. In a decade we have gone from living in a data-temperate zone to a flood-zone with frequent on-shore destruction. This, however, is not a “big data” problem. It’s more like a fundamental mis-understanding of even “small” data. Big data is not yet truly part of the equation—at least not for most marketers today.
By way of example, here is what big data (typically) is not:
It’s not digital analytics. It’s not found in dashboards most marketers encounter. It’s not the data you’ve been col-lecting in whatever silo you find yourself living in. It’s not typically collected by off-the-shelf analytics applications, though large data-sets can be accessed by the most recent crop of tools.
Big data is certainly part of the Convergence Analytics landscape, but it’s not for everybody; and most marketers need not fear it. Big data has been around for quite some time, and has been in use by data-centric parts of many large organizations for years. It combines the collection of vast amounts of data and then the deployment of query-ing tools against that data. Today, Hadoop (an open-source distributed processing library) is widely in use in big data environments. Creating custom queries and devising data access strategies is the domain of big data special-ists; and has been for quite some time. What has changed

12 CHANGES AND CONSOLIDATION IN A VOLATILE MARKET
dramatically is that the tools have become cheaper; and the practices more publicized.
Convergence Analytics tools can pull from “big data” where it’s available, but typically the vast amounts of data that are being collected are only selectively useful for the marketer. The key concept is “selective.” Big data means lots of data. But it is not realistic to believe you need to immerse your-self in big data to make use of it.
Financial services firms make use of big data. Insurance companies use big data. Enterprise manufacturers make use of big data. Lately it seems the NSA is doing it. Mar-keters access sips of big data when it suits them; and, as occasional users they’ll want to know that the babbling brook from which they draw water may drain at some point to the ocean; but they should know as well that the ocean is often many miles away, and that they can slake their thirst without having to wear a wetsuit.
Most likely the term itself is too widely applied. It’s de-ployed often when someone feels they are dealing with too much data, and that’s certainly a misuse of the term. As with most measurement paradigms, it makes sense to define your purpose before trying to tackle “big data.”
The desktop is yesterday’s lunchmeat. Mobile is the new black for digital marketers.
MOBILE
The desktop is yesterday’s lunchmeat. Mobile is the new black for digital marketers.
Every person on the planet, it seems, has a way to con-nect via a mobile device; and marketers have responded by creating mobile-oriented content in astonishing volume. We now find it routine that a “website” will have adaptive technology—that is, it detects your device and wraps its content around that device-profile to dynamically optimize the experience. Neat!
Everybody is in love with mobile. But mobile is still young and uncertain of itself. Among other shortcomings, some of the terminology is a bit squishy.
For instance: mobile means what, exactly? First, there’s a major difference between mobile web and mobile apps. Then the distinction between iOS and Android; and most folks kind of stop there. But what about user behavior as it
relates to tablets? What about minified tablets? Or massive smartphone screens? And using multiple devices, back and forth, and then buying in a store? What is the definition of engagement in a mobile world? Just what is “mobile first”? And what about feature phones in the third world? And what about laptop use in cafes?
Apps are experienced in very different ways than any web-site; and demand new measurement paradigms. They’re also not searchable in the same way a website is, because (for instance) Google can’t spider through the compiled code of an app, nor allow you to access its contents on the fly. However, a vendor can optimize its application for an app store using ASO products, which in turn influences search findability. This in itself represents a profound change in the way marketers need to think about mobile, because as of this writing, you cannot optimize an app for search engines.
The above example illustrates why expertise is so critical to the Convergence Analytics equation. Failing to recog-nize and address the peculiarities associated with mobile measurement can easily lead to erroneous, incomplete or misguided decision-making.
Prior to 2012, app measurement was a tiny twig upon the tree of digital analytics; now it’s a branch you might be able to swing from if you’re not too heavy. Early on there was Flurry, a company whose primary business was (and is) to sell ads via its ad network; and it offers today a free, rela-tively simple and easy tool to measure a reasonably robust basket of app activity. There are others in the market—Mix-panel, KISSMetrics, Localytics, Lavastorm and Kontagent, which has come from the gaming world and may have the most robust mobile measurement platform today. Even stalwarts like Adobe Omniture and Webtrends have app measurement capabilities if you care to indulge. And now more vendors like Swrve and Kontagent are releasing A/B test features, just like their web analytics equivalents.
Google Analytics entered the mobile measurement field in 2012 with an API for app data collection. Not surprisingly, it has become a force in mobile measurement; because now the full weight of GA is put to work on a glaring inefficiency in the digital analytics market: measuring the now-ubiqui-tous app. With GA’s new API, you can deploy the burgeoning sophistication of this measurement tool against your app. You will have to alter your nomenclature, adjust your KPIs and understand the nuances of “conversion” inside an app (beyond mere opens). This is because mobile “conversions,” measured by engagement, can mean many things. Some

CHANGES AND CONSOLIDATION IN A VOLATILE MARKET 13
of the more advanced measurements include time-spent/location, motion-relevance, color-exposure, angles as well as the capture of specific objects, or the sharing of objects collected by the camera. Very new technologies (like aug-mented reality) can be used to increase engagement and conversions in a mobile environment, and mobile applica-tions using AR are beginning to see impressive conversion statistics.
In any case, with GA now fully vested in this type of flex-ible data collection measurement, apps now become very measurable using an industry-standard tool.
So “mobile” can mean HTML content on multiple platforms and multiple device types, with very different development profiles and distinct experiences on each; it can also mean apps and games that conform not at all to any web para-digm.
In addition, mobile crosses departments. We can identify mobile for service, support and marketing and there may be more.
What seems clear today is that “mobile” is rather a misno-mer for several distinct disciplines; consequently there’s really no such thing as a “mobile strategy.” Mobile is multi-faceted, and the world of mobile content and measurement probably is due for some recalibration of its taxonomy be-fore we lose an opportunity to understand its rich potential.
Without a real-time execution plan, real-time analytics alone is without notable value.
REAL TIME
Our last survey in March 2013 revealed no common defini-tion of real time.
Classically, “real time” meant something like “no gap be-tween actual time and delivery time” as if we were ordering tacos from the drive-up window on a slow night. But then the term got picked up by spin doctors and pitchmen and came to mean any length of time from “under one second” to “less than a week.”
We continue to feel that “real time” really means “right time.” It’s a value proposition more than a timing defini-tion, and buyers should understand the marketing claim for what it is; and should be very careful about their require-ments before adoption of a “real-time” analytics solution.
None of this has stopped vendors from using the terminol-ogy to suggest they are very, very fast in delivering ana-lytics. This notion in itself may be obfuscation, as some vendors use “real time” to describe their speed in collect-ing information or, alternatively, their speed in delivering reports. And it points out that we are now entering a phase of computing power where we don’t need more speed as much as we need better process and better analysis. The actual value of having up-to-the-second data refreshment (or the notion that we should want to see live data stream-ing across our flatscreens) is questionable. Perhaps if we were in the midst of a live-broadcast, we might need to know that Belgium is loving/hating us right now; but apart from that, such technologies are elements of braggadocio at best and generally without useful application.
Further, “real-time” analytics, even when delivered in sub-second intervals, may well be useless in any context lacking a marketing automation, product recommendation or automated content delivery network that responds to data in real time.
While real-time analytics is of dubious merit, real-time action, based on analytics and automated, is growing in importance. Tools that put both of these into effect can genuinely help the marketer as she is ever more chal-lenged with gaining visibility before the right prospect at the right time. Examples of these fully automated systems are ad networks that place ads on pages you see while browsing, based on analytics about your online behavior; content management systems that display content based on user profiles; campaign systems that present real-time offers to those most likely to convert; and SERP results that are both optimized for local signals and location and also based on up-to-the-moment geo-location signals.
These systems certainly make use of real-time data.
But without a real-time execution capability, real-time (sub-second) analytics alone is without notable value.
Compare it to a car with a disconnected drive-train: the engine is revving but the car is not moving. This is because there is no connection between the power source (data/engine) and the desired motive activity (adaptive marketing/wheels). Until response to data can be accomplished in real time, “real time” itself is a questionable goal.
So, when someone says “we need this in real time” or “we deliver real time,” accept that they may mean any num-ber of different components (collection, display, analytics

14 CHANGES AND CONSOLIDATION IN A VOLATILE MARKET
subsets); or they may be talking about true immediacy that happens to be both “cool” and of little value to even the most rapid responder among marketers.
Of the three terms noted here, this one seems most ripe for retirement, as it has neither an intrinsic meaning nor, it would seem, an intrinsic value.
MARKETING ANALYTICS
This very broad term has somehow become nearly synony-mous with “digital analytics” and in all likelihood needs to be reined in considerably.
The way it’s been used of late suggests that “marketing” is “digital marketing” and that’s where the term begins to fall into disrepute. For digital marketers especially, it can be difficult to recall that marketing is more comprehen-sive than what’s served up in browsers and apps. It in-cludes such time-burnished artifacts as direct mail, 1-800 numbers, print advertising, radio advertising, television commercials, infomercials, t-shirts, taxi beacons, point-of-purchase displays, kiosks and billboards.
In even the most generous definition of Convergence Ana-lytics, can any of us multi-channellers or cloud-computing nerds really make a claim to be measuring any of those other things? Yet they are indisputably part of marketing; and in a large enterprise, if they don’t cross the desk of the CMO, then perhaps that CMO needs a different job title.
That said, there are a few companies that do perform ana-lytics on forms of marketing that go beyond digital. But they are typically older, more established outfits with the ability to deliver both digital and traditional marketing services; and they are not at all common. There are also no small number of agencies that, through a variety of rather unre-lated mechanisms, perform analytics on digital, print and what was once known as “broadcast media”; but we have not seen any of these companies use the words “marketing analytics” to describe the channels they monitor.
So, what is a marketing analytics company and how much of that is product-based functionality, versus services rendered based on the marketing “DNA” of its staff? And what is that anyhow? We advise potential buyers to really understand their technology partner and to understand what is positioning and what is uniquely differentiated.
“Digital analytics” is quite broad enough, we feel. “Market-ing analytics” in this context is in all likelihood too much of
a stretch, and, except for the exceptions noted above, we feel its use may reveal a lack of clarity on the part of the user.
BUSINESS INTELLIGENCE
Also known as “BI,” this term traditionally refers to the practice of gathering terabytes or more of data (e.g., “big data”) and then querying it using sophisticated techniques that, in the past, required carefully constructed “data joins” and in many cases the services of a true data scientist with a Ph.D. For a small army of longtime practitioners, it still means that. That said, there remains a large portion of BI users who are more workmanlike. Typically they are IT peo-ple servicing many departments and running off-the-shelf queries for their constituents.
But our digital marketing community has piled a fair amount of baggage on this patch of real estate and some of it probably does not belong.
In addition, there may be a love/hate affair among digital marketers for BI. Some have said they don’t like it because it was never a broad enough market (and largely this is true; BI was always too arcane for most of us). Some have decided they want the gravitas that comes with declaring BI as a capability either of their application or their opera-tions; so they call what they do a version of BI.
In nearly every case, digital marketers are not engaging in business intelligence practices. It’s true they are de-ploying elements of what BI consists, such as dashboard creation, but BI as a discipline goes far beyond where most marketers would fain tread. Even multi-channel analytics applications are typically BI-lite; or BI-for-marketers (the Ph.D.’s are trying not to laugh right now). We are gathering data from multiple sources; we are relying on algorithms; we are visualizing the results. But the datasets are more focused as a rule; the algorithms are often canned; and the results are prettier (more suited to marketing analysis rather than the stricter confines of science).
Business intelligence as a discipline tends to be very broad but also rather shallow where it performs analyt-ics; because typically it serves so wide a base as compared with multi-channel marketing analytics. So while it’s true that business intelligence may be proceeding on a separate track for a number of reasons unrelated to our goals, it’s also true that it represents a discipline apart from ours; and we should probably accept that and leave it alone.

CHANGES AND CONSOLIDATION IN A VOLATILE MARKET 15
Stacks and Channels
Convergence Analytics can be defined as the intersection of a stack of software capabilities with a series of marketing channels.
The stack is an interconnected set of capabilities that allow a software tool to perform its task.
In the case of a graphics tool, it might include the ability to receive motion-input from a mouse or stylus; the ability to control the color properties of individual pixels; the abil-ity to perform transformative actions on both colors and shapes; and the ability to display a preview or facsimile layer to the graphic designer.
In the case of a Convergence Analytics application, the stack includes the following capabilities:
So what is a Marketing Analytics company and how much of it is product versus services?
ACCESS TO DATA
Every analytics tool requires access to data in order to drive insights. Until recently, most analytics tools were closed systems and could only access data that was specially collected and formatted so that their own software engine could analyze it and display results. This was straightfor-ward, accurate and effective. But it was also one-dimen-sional. In a multi-channel world, where customers demand access to data from disparate sources in order to make comparisons between data from different data silos, the notion of a single stream of data (say from web analytics) becomes antithetical. Convergence Analytics tools access data from any number of sources, often collected by other tools and stored in systems not designed to work with the application now accessing the data.
EXTRACT THE DATA
Data may be the raw material of analytics, but it needs a great deal of refinement before it can be put to use. The chief task of extraction is in making sure that the data is fully and entirely pulled from the source in a non-lossy fashion much as a pipeline will not want to spill oil on the tundra. Corrupted data, or data that gets lost in transit will
make the rest of the task that much more difficult if not impossible.
This task is accomplished by a set of data communica-tion tools called “connectors.” Companies as divergent as iJento, Anametrix, Ensighten, Gooddata, OrigamiLogic and SnapLogic all build connectors to collect data from dispa-rate sources. In some cases, the connectors are bi-direc-tional such that true data exchange can take place between platforms.
Data integrity is perhaps the key virtue of a good data ex-traction exercise.
LOAD THE DATA
The raw data, now pulled from its source, needs to be stored in a new, flexible, robust database that is capable of responding to complex, multiple requests in rapid fashion (often referred to as “real time”). Often this database will be more flexible than that from which the data was pulled, and often the data will be reposing in a schema it shares with data from other sources. Much as any storage facil-ity needs its data to be safe as well as ready to send out to whatever request is made for it, so does the data storage facility need to be secure, unbreakable and agile. At this stage the data is no different than from whence it was collected, but it is housed in a new facility awaiting deploy-ment.
TRANSFORM THE DATA
Perhaps the most difficult part of the data organization stack is the need to transform, or “regularize” the data. Anyone who has ever had to get a mailing out based on a list can understand the need to map data properly. In a simple mailing, it means making sure the column contain-ing the first name (whatever it may be called), is properly sent to the correct column in the mailing database such that the first name shows up in the greeting of the letter or email. Data transformation is much the same in principle except for its complexity. In a simpler environment, there was little need to match data to other data. But Conver-gence Analytics companies need to be agile with data.
In a Convergence Analytics paradigm, data-agile applica-tions will be able to take data from multiple, disparate
16 CHANGES AND CONSOLIDATION IN A VOLATILE MARKET
sources, match common denominators on the fly and in essence reorganize the data into a common schema that can be queried for insight.
ANALYZE THE DATA
The data analysis engine is the heart of the application. Based upon an analog (human) request, the analysis software must immediately respond by accessing the transformed data and delivering results to the analyst. The analysis engine consists of a complex weave of algorithms that take business rules and data requests, extract the right data from the right source and prepare it for visu-alization. Convergence Analytics algorithms are many times more complex than single channel analytics, and the business logic is still in the process of definition for many multi-channel use cases (social analytics, for instance). The algorithms are more complex because they must deal with so many more datasets in order to satisfy the demand to see cohort (related) data in a single view. Without robust, rapid, accurate analysis, there is nothing to show the ana-lyst.
DISPLAY THE DATA
Data visualization is designed solely to assist the human observer to make associations and draw conclusions based on visual input. Of course there are a small number
of individuals who can make sense of data output without visualization, but few marketers or business owners are among that number. Visualization represents the democra-tization of analysis, such that anyone who can understand a trend line or pie chart can begin to make inferences from what is shown. While it may seem like a “surface” feature, the display layer is often the most critical in driving user acceptance, as it is really the only thing with which the user ever interacts. It can be observed that a tool with a clean user interface and well-functioning analysis engine will usually become more popular than a tool with a stellar analysis engine and a less-attractive interface. The impor-tance of an impressive visualization layer is only empha-sized by the fact, due to the commoditization of visualiza-tion technologies, fewer and fewer applications today lack a strong visual display capability.
In Convergence Analytics the data-agility of the tool becomes apparent at first glance.
In Convergence Analytics, the data-agility of the tool be-comes apparent at first glance: most applications provide robust and rapid charting capabilities, allowing users to mix and match data, and especially to perform overlays of data such that patterns can be discerned. The presumption is that well-presented data will make it easier for market-ers to make content and campaign decisions.

CHANGES AND CONSOLIDATION IN A VOLATILE MARKET 17
Where are the Real Solutions?
Convergence Analytics tools are powerful and plentiful, but something is clearly missing.
While there’s every sort of way to collect, slice, dice, pro-cess, visualize and integrate analytics data, there’s very little innovation in providing solutions for practitioners.
While the great majority of potential consumers of the mar-keting analytics information are marketing practitioners, it is these very practitioners that seem vastly under-serviced compared to their business analyst and data scientist col-leagues on one end; and executive management on the other.
Most practitioners yearn for more turnkey solutions to their day-to-day challenges.
VENDOR ASSUMPTIONS
The majority of the “off the shelf” analytics solutions for practitioners revolve around campaign attribution and reporting. While this is valuable, it’s not very innovative in a market that has been around now for a couple of decades. With the variety of challenges facing marketers today, it’s surprising that for the most part vendors have assumed a level of sophistication that is largely absent from smaller and mid-sized (SME) companies.
For while some enterprises have the expertise necessary to extract the insights from the ever more sophisticated analytics software, most practitioners yearn for more turn-key solutions to their day-to-day challenges.
Are practitioners expected to fill in the blanks for these increasingly complex tools? If so, they don’t seem inclined. And an argument can be made that it’s a lack of rigor on the part of solution providers, rather than a lack of ex-pertise on the practitioner side. It’s important to note that another word for practitioner is “customer”! Customers have requirements. Vendors meet them. Where vendors don’t meet them, they fail. We’re noticing lots of them not-meeting-the-customer right now. Technology races ahead while expertise continues to lag; and advanced features remain misunderstood and underutilized. This is not good for customers. It’s not for vendors.
But it should fall to the vendor to close this gap—and pro-vide solutions that answer business needs.
PRACTITIONER TYPES
It may be helpful to both vendors and practitioners to de-fine a few of the challenges in more detail. We will begin by describing typical roles and responsibilities currently found in a digital marketing organization. It should be noted that this list is not meant to be comprehensive, but illustrative.
Media Buyer—Brings highly targeted traffic to a property.
These marketers often struggle with the complexity of the ad-targeting networks and technologies. The analyt-ics should be able to inform a marketer with repeatable characteristics that can be attained, and importantly what ad networks might be best suited to their challenge.
Content Marketer—Looks for “inbound marketing gain” via more targeted, more engaging content in order to build a sustainable audience.
There’s been very little effort made to make sense of the in-terplay of paid and inbound marketing efforts. A marketing organization wants to understand whether to invest more in a particular type of content creation or to shift their efforts to other subject matters or marketing techniques. Content marketers also have very little insight into content topic affinity across their audience.
Social Media Manager—Builds loyalty, protects brand reputation and ultimately generates targeted traffic and leads.
These marketers have been struggling to correlate their actions to customer success. Very few success metrics exist for social media marketing. Campaign attribution and social sentiment have been difficult to place into context with other efforts.
Merchandiser—Ensures visibility and cross-sell/upsell op-portunities for their products.
This is probably the best served of the marketing disci-plines. Specific e-tail analytics products can be models for other marketing solution innovations. There’s still much

18 CHANGES AND CONSOLIDATION IN A VOLATILE MARKET
room for innovation here around affiliate marketing and product feed efficacy, in particular at the SME level.
Of course, these examples are just beginning to scratch the surface of some of the areas screaming out for solutions. In particular, solutions that do not require highly technical staff or professional services from the vendor.

CHANGES AND CONSOLIDATION IN A VOLATILE MARKET 19
The Perils of Differentiation
In 2012, we defined Convergence Analytics as a new market for multi-channel measurement applications that can show reports on data from disparate sources in attractive dash-boards. In our March 2013 report, we discussed the way in which the buyer was changing; and how vendors histori-cally had created products known as “point solutions” to a class of buyers that was changing rapidly.
Convergence Analytics applications have now fully em-braced the notion that “everybody is measuring everything” and that point solutions may well be outdated. And with that embrace has come a near-avalanche of analytics offerings that seem as if they want to be everything to all buyers.
With this, we think a new challenge is rising, and the mea-surement community needs to take notice. One might even call it a crisis.
Clearly, something is holding back the market—adoption is not taking off as quickly as vendors had hoped. Some might say customers are still struggling with the basics and have no ability yet to leverage multi-channel data delivery. This will change, and we think the real barriers lie elsewhere.
“MULTI-CHANNEL” NOT A DIFFERENTIATOR
First and foremost, “multi-channel” is certainly not a sufficient differentiator any more. Too many vendors are at-tempting to address multiple verticals, while the latest view from venture capital suggests they are typically funding systems sometimes referred to as “bespoke” that service niches or small vertical systems.
Perhaps as important is the equation of value to effort in “connecting everything.” Certainly it has its place when done well and properly presented. But with many vendor applications, perhaps only 50 percent of the total cost of ownership is the purchase of the tool itself. Another 50 per-cent goes towards turning that platform into an enterprise solution. Does the vendor really go far enough towards solving a customer problem? Or is it really just half of the loaf?
HUBRISTIC VENDORS
What’s happened is that technologists have allowed them-selves to become seduced by their own capabilities: since I can do it, I shall do it. That, and the accumulation of no small amount of hubris. Is it realistic for a startup with the ability to measure lots of channels to claim they’re the equivalent of Adobe? Probably not. But it has not stopped some from claiming as much.
In marketing analytics, this has resulted in a landscape populated by too many non-specialized vendors with amor-phous offerings and little concern for real solutions. Too often they take a hands-off approach and say to their cus-tomers: “This Swiss Army knife does wonderful things; and we can show you how to unfold all the blades.” Customers, for their part perhaps equally unrealistic, don’t really want a Swiss Army knife. They would love to have a finished wooden icon already carved out.
We suggest they may need to meet halfway: via special-ized, “vertical” solutions that are tailored to solve particular measurement problems. While the Convergence Analytics concept encompasses multiple channels, we do not sug-gest that multiple vendors each need to address multiple channels. Rather, many must find a way to satisfy a small segment of the digital measurement market with targeted solutions.
CONVERGENCE ANALYTICS IS A SUPERSET
As we’ve further researched vendors since our last report in March, we’ve noticed a market becoming so crowded that even vendors with robust, multi-channel offerings need to publicize fringe cases in order to differentiate. And there are precious few customer successes in the dialogue. We believe it’s because adoption is hindered by a mismatch between technological capability and the customers’ im-mediate needs.
What’s become evident is that Convergence Analytics itself is a superset comprising disciplines like web analytics, mobile analytics, BI (as applied to marketing), ERP or cost analytics, CRM, financial and operational analytics—each as they relate to marketing. The notion that all vendors shall now measure all things does not represent a viable

20 CHANGES AND CONSOLIDATION IN A VOLATILE MARKET
branch on the tree of marketing analytics. We make some recommendations below.
FOCUS ON A NICHE
We strongly suggest that the wise vendor might want to narrow focus and find a niche to service. We’d like to see a market comprised of many masters of single
channels—rather many multi-channel Swiss Army knives. In any case, the market won’t support that many vendors all saying the same thing. As we’ve already stated, consoli-dation is in order; we would like to see vendors find their niche, rather than get marginalized because they tried to accomplish more than the customer really wanted while ignoring the focus the customer really needed.

CHANGES AND CONSOLIDATION IN A VOLATILE MARKET 21
Conclusions
The end-user (practitioner) of multi-channel analytics has a right to be skeptical at this juncture. Measurability is still the key differentiator for digital media versus every other kind of media, and we would not suggest that measure-ment can’t be very effective when powered by great tech-nology expertly deployed and operated.
That words like “big data” and “predictive analytics” are be-ginning to cause fatigue should not take away from the fact that more data is available to more marketers if they can use it; and that it still makes sense to put the right product or message in front of the right person in the right context.
Where perhaps 200 vendors have sprouted, we’ll still find fertile soil even if some of the hybrids won’t survive the winter. They may die but other, more robust strains will replace them. So the well-informed customer today will continue to enjoy a rich variety of choices.
But the market today is in such flux that it asks the end-user to be a beta-participant in many of the current vendor offerings. Microsoft got away with this tactic because it owned the market. Smaller players that flutter like may-flies in the market may possess some glitter in the light of day, but they will be gone by moonrise; and in all likelihood don’t deserve our participation in their exploratory phases. It will pay to look carefully at both the strength of the com-plete offering (including expertise) and the strength of the company.
Is their technology truly valuable, or is it unremarkable? If it’s unremarkable, is it at least useful? If it’s useful, does the vendor have customers you can recognize? Do they deliver significant expertise? If they don’t have that, then how about funding? Has a good VC placed a stack of chips on their number? Or, like too many vendors today, is their technology so-so, are they short of customers and does it seem like they’re scrappy and underfunded? Caveat emptor.
Words like big-data and predictive analytics are beginning to cause fatigue.
CONSOLIDATION
If history is any guide, vendor consolidation is in order. Where vendors had staked out claims in what appeared to
be a set of well-differentiated digital intelligence domains, many now “light out for territories”—some will call it
“greenfield opportunities”—in an attempt to be everything to everyone. In doing so, they may often leave practitioners with specific needs out in the cold.
While we recognize that “everybody is measuring every-thing” and take pains to identify it as a market, we don’t take a position that this evolution is necessarily one with a happy outcome for the end-user. And it certainly does not suggest that every vendor should measure everything—in fact, we see the pendulum swinging back the other way. The customer may want to measure everything. But she or he may need a suite of specialized tools to do it.
We believe the market will continue to sort itself out and there will at some point be a closer match between appli-cation capabilities and market requirements. In the mean-time, we believe the current trends portend the destruction of weaker companies and the absorption of smaller, strong companies into larger, more well-funded (or more profit-able) companies. We are at the very beginning stages of this process.
“X” FACTOR FOR THE MARKET
As of this writing, there is one other major factor that will influence the shape of the Convergence Analytics space—and anything related to the cloud. The facts are so new, we hesitate to draw any conclusions because we are pretty sure we have not heard the worst of it yet. But make no doubt, one name will ring loud in the years to come as we wonder what direction “the marketing cloud” has taken. And “the marketing cloud” directly affects everything we discuss in this report.
SNOWDEN
In our last report, we cited Google as an X-factor; and we still believe Google remains primary in any discussion of analytics because of the amount of data it collects. With its tremendous market reach, it has been able to create free applications that drive other vendors off its land and up into the woods.
But now that Google—and every other cloud-computing gi-ant—has been revealed as an arm of the massive NSA data

22 CHANGES AND CONSOLIDATION IN A VOLATILE MARKET
collection network (even if involuntarily), how does that change the future of the data collection market generally?
It’s too early to tell. We do suspect there could be serious repercussions to having a harsh light focused on mea-surement and data collection practices. Customers may well look at all data collection with a far more critical eye. We know that a company selling paper goods that wants to know how thick to make the towel is a far cry from a
government operative digging up dirt on a whistleblower. But to the public, this not-so-subtle difference might be lost in a wave of paranoia.
The manner in which online behavioral data has been ap-propriated by spy agencies will be impactful on society at large and on analytics in some way, shape or form. We have no choice but to wait and see.
Does government spying hurt data collection by by businesses?

CHANGES AND CONSOLIDATION IN A VOLATILE MARKET 23
Recommendations
With technology now enabling data visualization of almost anything, and with bigger and bigger data sets available to the customer, it’s easy to lose site of what really drives success.
It isn’t technology.
It’s the way we use technology.
In years past, the 4 Ps of marketing were: product, promo-tion, price and place.
THE NEW 4 PS OF MARKETING ANALYTICS
With the advent of multi-channel and Convergence Analyt-ics, the new 4 Ps of digital analytics are:
1. People2. Purpose3. Process4. Platform
Take notice of the order in which we state these factors; and which one comes last. “Platform” is the vendor.
The vendor will want to own the conversation and get the customer focused on platform before anything else and this is, by and large, a distraction. Many customers focus on platform because of the sales calls they get, and, unfor-tunately for them, buy into a platform as if it is a solution.
We believe this is a mistake.
PEOPLE
The first element in Convergence Analytics success is to have the right skills in place. Expertise in the form of in-house professionals or outsourced to a professional services organization is at the core of success. Expertise is both much more prevalent in Convergence Analytics than is widely known, and more of a critical failure point than is commonly admitted. That said, it also represents the great-est opportunity for both vendors and practitioners. Working with a team that knows how to deploy both technology and the insights gained from it is of primary importance. With-out it, the rest hardly matters.
Platform is essential--in fact it’s indispensable. But it comes last.
PURPOSE
Why are you engaging in measurement? What are you trying to learn? What will you do once you learn it? What customers are you trying to reach, and what outcomes do you expect from your interactions? These must be carefully defined well in advance of thinking about where to invest in technology.
PROCESS
People with a purpose will almost naturally come up with a process that can result in success. How will the technology be deployed? How will you make sure it’s evenly distributed over all of your important channels? How will you ensure governance and data integrity? How will you know the right data gets to the right people in the organization? The an-tithesis of process is the all-too-common scenario where an analyst looks at the reporting suite and notices that the newest profile is a year old and hasn’t been looked at in nine months. It means there’s no process. No drive to use analytics globally. No responsibility to be data-driven. No likely results.
PLATFORM
Platform is important—in fact, it’s indispensable. But it comes last. That’s because you cannot really know what platform is right until you’ve solved the above three fac-tors. At the same time, we don’t want to suggest the above three can be solved in a vacuum. It is absolutely essential to be aware of platforms and their capabilities. You cannot build a transoceanic ship without knowing the width of the Panama Canal. But you don’t buy the ship first before you have the crew, or something you plan putting in the ship, or a command structure to run the ship. The customer should know a variety of tools in the market—both generalized and specialized; and, taking care not to get sidetracked by any vendor claim to be “the solution,” pick the ones that best suit your purpose; and that can be deployed in a repeatable process by your people!
24 CHANGES AND CONSOLIDATION IN A VOLATILE MARKET
TAKEAWAYS
Convergence Analytics is poised to change everything about the digital marketing industry. But it may falter if custom-ers can’t stay focused on their business goals. They may get distracted by the overuse of terms like “big data” and
“real time” and “predictive.” They may believe that the review of cohort data is the equivalent of insight. They may buy a solution before they know what they want to do with it. And the general public may get distracted by a sudden onset of mistrust in data collection thanks to the Snowden factor.
That said, we still suggest following the New 4 Ps in order to avoid most pitfalls. Understand that just because a certain technology exists, does not mean it will certainly help your business. Strip away the buzzwords and look at a vendor’s functionality and stability. Remember that exper-tise is what stirs the drink—not algorithms.
As an organization, you may need to “measure everything.” Or at least much more than you had before. And you’ll need to remember that “measuring everything” does not mean
“one size fits all.”
We believe consolidation and stratification are coming soon to a young industry. And that the result will be more tar-geted, more valuable offerings than are currently compet-ing for the digital marketing dollar.

CHANGES AND CONSOLIDATION IN A VOLATILE MARKET 25
WELCOME
Appendix A—Survey Charts
NONUSERS

26 CHANGES AND CONSOLIDATION IN A VOLATILE MARKET
USERS
Appendix A—Survey Charts (Cont’d)
NONUSERS

CHANGES AND CONSOLIDATION IN A VOLATILE MARKET 27
Appendix A—Survey Charts (Cont’d)
USERS

28 CHANGES AND CONSOLIDATION IN A VOLATILE MARKET
Appendix A—Survey Charts (Cont’d)
USERS

CHANGES AND CONSOLIDATION IN A VOLATILE MARKET 29
Appendix A—Survey Charts (Cont’d)
USERS

30 CHANGES AND CONSOLIDATION IN A VOLATILE MARKET
Appendix A—Survey Charts (Cont’d)
USERS

CHANGES AND CONSOLIDATION IN A VOLATILE MARKET 31
Appendix A—Survey Charts (Cont’d)
USERS
DEMOGRAPHICS

32 CHANGES AND CONSOLIDATION IN A VOLATILE MARKET
Appendix A—Survey Charts (Cont’d)
DEMOGRAPHICS
CHANGES AND CONSOLIDATION IN A VOLATILE MARKET 33
Appendix B: Sample Vendors
Convergence Analytics represents a rapidly evolving mar-ket. One of the chief contributors to this change is the way new and more traditional vendors are combining analytics features to become more multi-channel aware and more user-friendly.
The following alphabetical list is not meant to be in any way exhaustive but lists a sampling of companies that en-gage in Convergence Analytics practices to varying extents.
Bold entries include a brief company description.
1010dataChiefly focusing on the financial services industry with powerful parallel computing platforms that generate very rapid data delivery times.
Actuate“Next generation Rich Internet Applications ready infor-mation platform for both customer and employee-facing applications.” Business Intelligence Software, Executive Dashboards, Performance Management, Financial report-ing, including data visualization.
Adobe (Insight); Adobe (Neolane); Adobe (Omniture); Adobe (Social)Adobe has continued to acquire assets related to digital marketing success and has the market presence to make every offering an industry-leader.
AdometryAdvizor Solutions
Agile-1Integrated service and technology solutions to support all workforce needs. Includes Business Analytics.
AgilOneAha!
AlteryxBuilding connectors to multiple data sources; offering a full range of BI data collection and visualization layers for marketers and business executives.
Altosoft
AnametrixMulti-channel analytics for marketers with sophisticated visualization and cohort analysis.
ArcplanAT Internet
Birst“Agile Business Analytics” uses extensive dashboarding and visualization; “allows users to combine data from different source systems to get answers to their most pressing busi-ness concerns in real time.”
BitamBoard IntlBrightFunnelCambridge SemanticsClearSaleingClickfuelCloud9Analytics
ComScore (Digital Analytix)Competitive analysis for sites; collects data from panel-based user pool.
ConvertroCountlyCYFEDimensional Insight
Domo“Domo is BI for the cloud.” An “agile BI” product, Domo seeks to put all your data into one dashboard. Domo de-clined to comment for this report.
EdgeSpring (Salesforce.com)“A radical new approach to visual analytics” and business intelligence. SalesEdge product allows customers to “gain critical insights to pipeline, forecasts, team performance, and trends.”
EntrinsikeQ Technologic
ExactTargetEnterprise email management offering that includes ana-lytics; today the company is “transforming how businesses

34 CHANGES AND CONSOLIDATION IN A VOLATILE MARKET
connect with their consumers using data-driven digital marketing across all channels, at scale.”
FlurryChiefly in app measurement; its main business is actually a mobile ad network and monetization platform. Helps orga-nizations measure behavior, advertise to the right audience and monetize visitors. Free tool helps customers under-stand how users interact with mobile applications; includes conversion funnels, demographics, interest graphs and geographic information.
GoodDataOffers SaaS business intelligence and custom reporting to help companies monetize data. Includes “Bash” technology,
“business intelligence data mashups” that include data from multi-channel sources and displays them in visually astute dashboards.
GoogleTranscends every category; dominant in digital marketing with its ad network, search, Google Analytics, Google Uni-versal Analytics, Google Tag Manager and more; capable of distorting every digital marketplace by giving away free tools, forcing the rest to innovate. Consumers generally win.
HubSpotHelping customers in many market segments develop lead nurturing campaigns through email and content creation management, driving lead acquisition and sales. Integrates with numerous analytics systems and Salesforce.
IBM (Cognos); IBM (Coremetrics); IBM (Unica)Offerings in nearly every category of Convergence Analytics including: Unica (Campaigns); Coremetrics (Web/Market-ing Analytics); IBM Global Services; Business Intelligence (Cognos); ERP (Tivoli)
iJentoBy deploying a technology that watches for authentication across platforms, it allows marketers to stitch together visits to a variety of sites and properties.
InetSoftInformation BuildersJackBeJaspersoftJedox AG
KarmaSphereProvides a “data analyst workspace for Hadoop” (the open-source BI platform). Includes “actionable, self-service, Big Data Insights,” as well as “Collaborative, Social and Uncon-strained Analytics.”
KISSmetricsPerson-based analytics. Saas offering for tracking e-com-merce, mobile apps, social and content. The basic metric in KISSmetrics “is a person.” Integrates with CRM, email providers, helpdesk software and billing systems.
Klipfolio
KontagentPeople, process and platform combine to provide Mobile Customer Intelligence. Includes product management tools, robust visualization and tools for C-level executives to understand drivers of P/L performance.
Logi InfoLyzasoft
MarketoFounded in 2007. It builds SaaS products to help marketers
“interact seamlessly with their customers across [multiple] channels, and [help them get] analytic insights to under-stand where and how to allocate their budgets for maxi-mum return.”
MerkleIt has long been a player since the days of direct marketing. Cross-channel analytics include online, offline, predictive; direct marketing, demographic targeting, geography; Bril-lig acquisition in 2012.
Metricly
MicrosoftExcel is at the core of so many marketing analytics experi-ences, with multiple offerings in multiple BI markets and verticals. Sharepoint, SQL, etc. are at the heart of digital marketing data transfer and analytics. Offers BI tools as well; too many products to list.
Microstrategy“Self-Service Analytics—No IT”: Multiple applications for desktop, web, marketing intelligence, predictive analytics, with multiple data connectors; “accessing all data through-out the enterprise.”

CHANGES AND CONSOLIDATION IN A VOLATILE MARKET 35
MixpanelOffers “micro stats” for mobile; includes time-in-app; return visitors, and cohort analysis for iOS and Android.
Oracle (Eloqua); Oracle (Siebel)Eloqua was acquired by Oracle in February 2013. Building a
“Customer Experience Cloud.” Helps enterprise customers “automate marketing, target the right buyer, easily execute campaigns, connect social and revenue, deliver sales intel-ligence, and measure everything.” Siebel is an entrenched enterprise data management system.
OrigamiLogicRelatively new entrant, Israeli-based multi-channel analyt-ics offering.
Panorama
PentahoOpen-source heritage. Big data integration, analytics, rapid Hadoop deployment; “a comprehensive platform for data integration and visualization.”
PivotLinkPrognozPromojam
QliktechEasy to use interface integrates data from multiple sources and provides visualization; self-service BI with solutions for numerous verticals.
Radian6Acquired by Salesforce (see below).
ResponsysFounded in 1998 to provide software that would enable marketers to design, execute and manage email cam-paigns. Today it is “helping the best brands in the world effectively execute marketing campaigns across all key digital channels—email, mobile, social, display and the web.”
Roambi
SalesforceNow the standard for CRM in nearly Google-like fashion. We expect to see more acquisitions like Radian6 as the company ramps up. Nearly every other tool mentioned in this list connects to and can be integrated with Salesforce.
Salient Management CompanySAP / Business Objects
SASLargest independent vendor in the BI market; includes Analytics Offerings in: Business Analytics/Intelligence; Customer Intelligence; Information Mgmt., Performance Mgmt., Supply Chain Intelligence and more.
SpagoBI
Sweetspot IntelligenceSweetspot says it is “a business intelligence reporting solution that does not involve IT.” By combining data visu-alization with Insight Management capabilities, Sweetspot simplifies the decision-making process across the data-driven organization.
Sysomos“Sysomos, Greek for “everything together,” emerged from an advanced research project started in 2005 at the Uni-versity of Toronto.” Brings “business intelligence to social media, providing instant and unlimited access to all social media conversations to quickly see what’s happening, why it’s happening, and who’s driving the conversations.”
TableauIncludes data analysis, business dashboards, extensive data visualization, drag & drop data analysis; “supports people’s natural ability to think visually.”
TargitTeradata (Aprimo)TibcoToovioubervu
ViralheatHelps enterprises understand their customers by providing robust social monitoring and management, brand manage-ment, competitive analysis and reputation management in a multi-channel environment.
VisiStat
Visual IQMarketing Data Management and Integration; integrates Search, Bid Management, Campaign Management, Ad Net-work, CRM, POS, Call Center, Clickstream; overall market-ing data management with robust dashboarding

36 CHANGES AND CONSOLIDATION IN A VOLATILE MARKET
WebtrendsThe remaining independent SaaS and Software web analyt-ics vendor has perhaps the most robust clickstream analyt-ics platform in the market and continues to offer software unlike most. Recently it added “streams” as a way to view
“real-time” data.
Yellowfin