Embed Size (px)
DESCRIPTION
It talks about different power plants
Citation preview
Group 13 PGPME 2014
CEST (PGPM – Energy 2012-2014) Great Lakes Institute of Energy Management & Research Page 1
Group – 13
PGPME Class of 2014
CEST Project Report
Coal, Nuclear, Natural Gas, Oil or Renewable: Which
type of power plant should be built in India?
TEAM MEMBERS: FACULTY:
ABHINAV GUPTA
KALPESH GAWALI Naveen Aggarwal
ANSHU KUMAR CHOUDARY
JATIN MAHANI
VIKRAM M AVINA
Great Lakes Institute of Energy Management
& Research
Gurgaon, Haryana

Group 13 PGPME 2014
CEST (PGPM – Energy 2012-2014) Great Lakes Institute of Energy Management & Research Page 2
Contents:
1) Power Industry Overview……………………………………………………..03
2) Natural Gas Demand for Power Generation……………………………….06
3) Summary of cost of generation of various fuels at 80% PLF…………..10
4) Summary of cost of generation of various fuels at 30% PL…………….11
5) Financial Condition of Power Sector Companies.………………………..12
6) COAL Based Power Plants……………….…………………………………...13
7) Solar Power – Requirement for Tomorrow………………….……………..19
8) Hydro Power Generation……………………………………………………...25
9) Nuclear Power Generation……………………………………………………31
10) Conclusion………………………………………………………………………34
11) References………………………………………………………………………34
Group 13 PGPME 2014
CEST (PGPM – Energy 2012-2014) Great Lakes Institute of Energy Management & Research Page 3
Power Industry overview
India‟s power sector has had a remarkable growth in past few decades. There has been a significant push towards opening the electricity sector to competition and to redesign the electricity markets to achieve more efficient outcomes. Consequently, the sector has moved from a mostly vertically integrated structure –with the state electricity boards (SEB) owning the generation, transmission and distribution businesses –to a more unbundled corporate structure. As compared to 23 integrated utilities, i.e. SEBs, that existed before the electricity reforms began in the 1990s, there are now more than 80 utilities or companies with varied ownership structures and mandates, viz., central government‟s power generation and transmission companies; state governments‟ generation, transmission and distribution utilities; city-specific private utilities; captive power units of companies; and independent power producers (IPP).Intra-state power transmission is the sole responsibility of the state transmission utilities (STU) while inter-state and inter-region transmission is entrusted to Power Grid Corporation of India Limited (PGCIL), a central public sector unit (CPSU). Distribution of power is mostly controlled by state distribution companies (discoms) though there are also a few private companies in this business in a few states and cities. To comply with the provisions of Electricity Regulatory Commission Act, 1998, most states have set up state electricity regulatory commissions (SERCs), which regulate tariffs for the generation, transmission and distribution companies. (Source: The Central Electricity India: Energy Sector September 2010 INDUSTRY OVERVIEW-POWER)
Regulatory Authority (CERC) fulfils the responsibility for the central power utilities. There is an appellate tribunal for disputes resolution. There are also a few power trading companies that facilitate the exchange of power between regionally separated companies and utilities at a price/margin determined by CERC. Section 246 of the Indian Constitution puts power sector on the „concurrent list‟, which implies that both the state legislatures and the Parliament have the power to create policies for the sector. However, in the event of a conflict, the central law prevails. In recent decades, the Government of India has focused on infrastructure development with top priority given to the power sector.
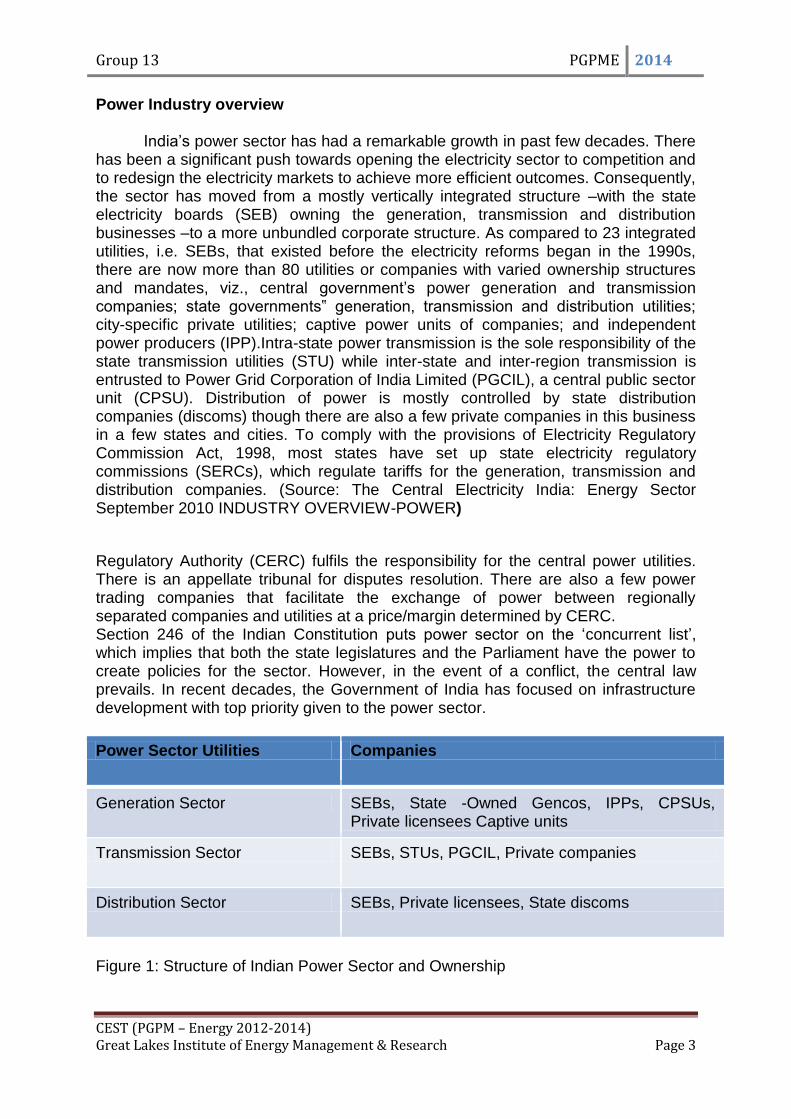
Power Sector Utilities Companies
Generation Sector SEBs, State -Owned Gencos, IPPs, CPSUs, Private licensees Captive units
Transmission Sector SEBs, STUs, PGCIL, Private companies
Distribution Sector SEBs, Private licensees, State discoms
Figure 1: Structure of Indian Power Sector and Ownership

Group 13 PGPME 2014
CEST (PGPM – Energy 2012-2014) Great Lakes Institute of Energy Management & Research Page 4
The history of governance in the sector dates back to The Electricity Act, 1910, which provided the initial legal framework. It was followed by an amended Electricity (Supply) Act, 1948, which provided the overall regulatory framework for the sector. Recognising the need for accelerating reforms, the Electricity Act, 2003 was enacted in June 2003. It repealed and replaced the earlier laws. Although, since then several additional rules and laws have been passed to regulate the sector, the Electricity Act, 2003, remains the basis for all legal provisions and guiding principles for the sector. Importance to Economy
Electricity is a key driver of rapid economic growth and industrialisation of the
country. Decades of economic planning have placed significant emphasis on
developing the power sector. Rapid economic growth and higher standards of living
depend considerably on the availability of adequate and reliable power at an
affordable price. The gross domestic product (GDP) from electricity supply at
constant prices was US$ 14.71 billion in 2008-09, accounting for 1.63 per cent of
GDP. The employment generated by the sector is in excess of 1 million.
External investment in India‟s electricity sector has also had a strong growth. Despite
global economic problems, India has had only marginal variation in FDI inflows, and
the inflows to power sector increased from US$ 157 million in 2006-07 to US$ 1.44
billion in 2009-10. However, as demand growth and power supply shortages
increase, there is scope for even more investment in the sector. The average per
capita electricity consumption in India is only 704 kWh as compared to worldwide per
capita consumption of 2,752 kWh
Generation Capacity The total generation capacity of the grid-connected power utilities was 159,398 megawatts (MW) as of March 2010. The thermal power capacity of utilities was 102,453.98 MW, followed by hydropower (36,863.40 MW), renewable energy sources or RES (15,521.11 MW) and nuclear power (4,560 MW). The following table summarizes the growth in installed capacity.
Overview
Fuel-wise Generation
Capacity Capacity (MW) Share (%)
FY Thermal Hydro Nuclear RES Total Thermal Hydro Nuclear RES
2003 76,762 26,767 2,720 1,628 1,07,877 71.2 24.8 2.5 1.5
2004 77,969 29,507 2,720 2,488 1,12,683 69.2 26.2 2.4 2.2
2005 80,902 30,942 2,770 3,811 1,18,426 68.3 26.1 2.3 3.2

Group 13 PGPME 2014
CEST (PGPM – Energy 2012-2014) Great Lakes Institute of Energy Management & Research Page 5
2006 82,411 32,326 3,360 6,191 1,24,287 66.3 26 2.7 5
2007 86,015 34,654 3,900 7,761 1,32,329 65 26.2 2.9 5.9
2008 91,907 35,909 4,120 11,125 1,43,061 64.2 25.1 2.9 7.8
2009 93,998 36,878 4,120 13,243 1,48,238 63.4 24.9 2.8 8.9
2010 1,02,454 36,863 4,560 15,521 1,59,398 64.3 23.1 2.9 9.7
As of March 2010, the state government utilities owned 49.8 per cent of the total installed generation capacity of 159.39 gigawatts(GW). The remaining was owned by central utilities (32 per cent) and private utilities (18.2 per cent). In the past decade there has been a shift in the trend of capacity addition. After many decades of near monopoly of state utilities in fresh capacity creation, private utilities‟ share has grown significantly. Clearly, the reforms have succeeded in inducing private investment in the sector.
Sector-wise Installed Utility Capacity
2002 2003 2004 2005 2006 2007 2008 2009 2010
State 62,995 66,582 67,380 65,942 70,184 70 095 74 689 76,388 79,392
Central 31,335 29,944 32,979 38,790 39,959 45,121 48,361 48,971 50,993
Private 10,717 11,351 12,325 13,688 14,144 17,108 20,010 22,879 29,014
Total 1,05,047 1,07,877 1,12,684 1,18,420 1,24,287 1,32,324 1,43,060 1,48,238 1,59,398
Demand-supply position
For the past two decades, India has had to face increasing deficit in power supply, both for meeting its normal energy requirements as well as its peak load demand. The problem is acute during peak hours and summers, and necessitates planned load shedding by many utilities to maintain the grid in a healthy state. The average all-India shortages in 2009-10 were at 10 per cent in terms of normal energy requirement and about 13 per cent in terms of peak load. Table 12: Electricity Demand and Supply
Overview Energy Peak Demand MW
Availability (MW)
Shortage % Demand Met Shortage %
2002-03 5,45,983 4,97,890 48,093 8.8 81,492 71,547 9,945 12.2
2003-04 5,59,264 5,19,398 39,866 7.1 84,574 75,066 9,508 11.2
2004-05 5,91,373 5,48,115 43,258 7.3 87,906 77,652 10,254 11.7
2005-06 6,31,024 5,78,511 52,513 8.3 93,214 81,792 11,422 12.3
Group 13 PGPME 2014
CEST (PGPM – Energy 2012-2014) Great Lakes Institute of Energy Management & Research Page 6
2006-07 6,93,057 6,24,716 68,341 9.9 1,00,715 86,818 13,897 13.8
2007-08 7,37,052 6,64,660 72,392 9.8 1,08,866 90,793 18,073 16.6
2008-09 7,77,039 6,91,038 86,001 11.1 1,09,809 96,785 13,024 11.9
2009-10 8,30,594 7,46,644 83,950 10.1 1,18,472 1,02,725 15,747 13.3
Natural Gas Demand for Power Generation:
There are two potential areas of gas demand in the power sector, grid-
connected, gas-fired power generation and captive generation. In both of these, the
price competitiveness of gas compared to competing fuels will determine future
demand. In grid connected power, gas has to compete with coal. Official forecast
assume price competitiveness without fully elaborating on the assumption, and we
investigate these further in section 6. Power supply needs to grow by 31 percent
(overall) and 40 % (peak) between 2008 and 2012, to support GDP growth rate of
between 9 and 11 per cent (CEA, 2007: seventeenth electric power survey of India)
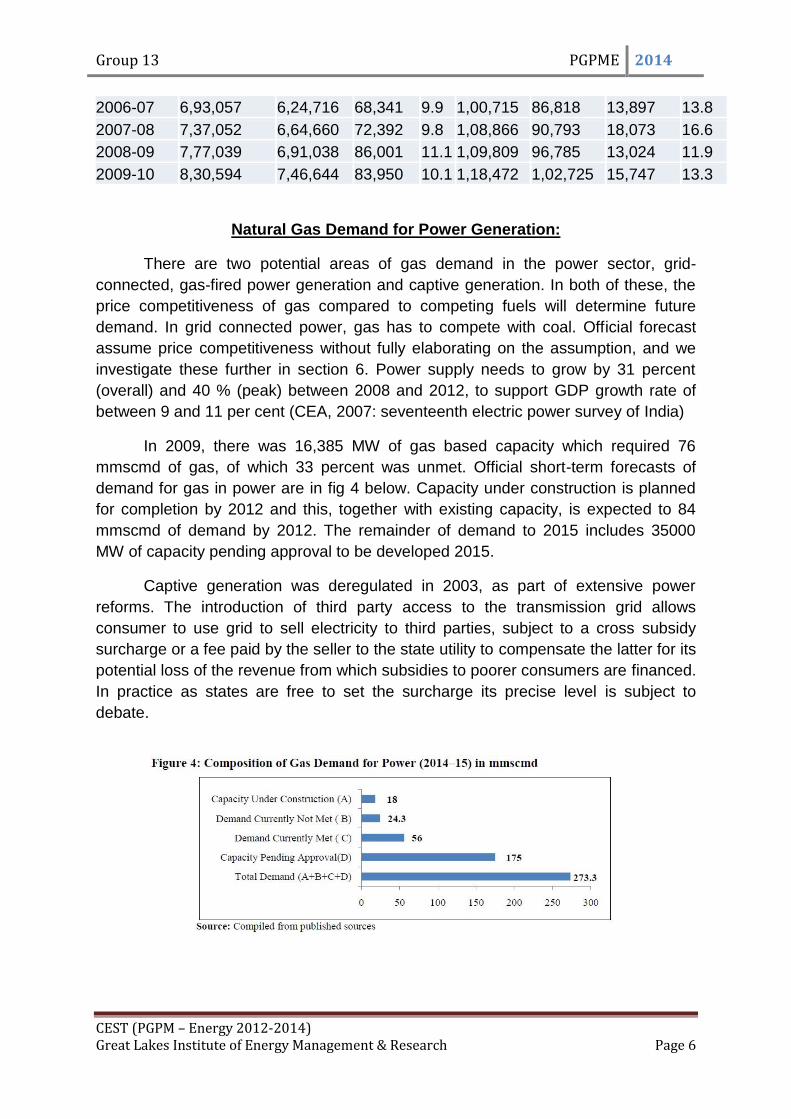
In 2009, there was 16,385 MW of gas based capacity which required 76
mmscmd of gas, of which 33 percent was unmet. Official short-term forecasts of
demand for gas in power are in fig 4 below. Capacity under construction is planned
for completion by 2012 and this, together with existing capacity, is expected to 84
mmscmd of demand by 2012. The remainder of demand to 2015 includes 35000
MW of capacity pending approval to be developed 2015.
Captive generation was deregulated in 2003, as part of extensive power
reforms. The introduction of third party access to the transmission grid allows
consumer to use grid to sell electricity to third parties, subject to a cross subsidy
surcharge or a fee paid by the seller to the state utility to compensate the latter for its
potential loss of the revenue from which subsidies to poorer consumers are financed.
In practice as states are free to set the surcharge its precise level is subject to
debate.
Group 13 PGPME 2014
CEST (PGPM – Energy 2012-2014) Great Lakes Institute of Energy Management & Research Page 7
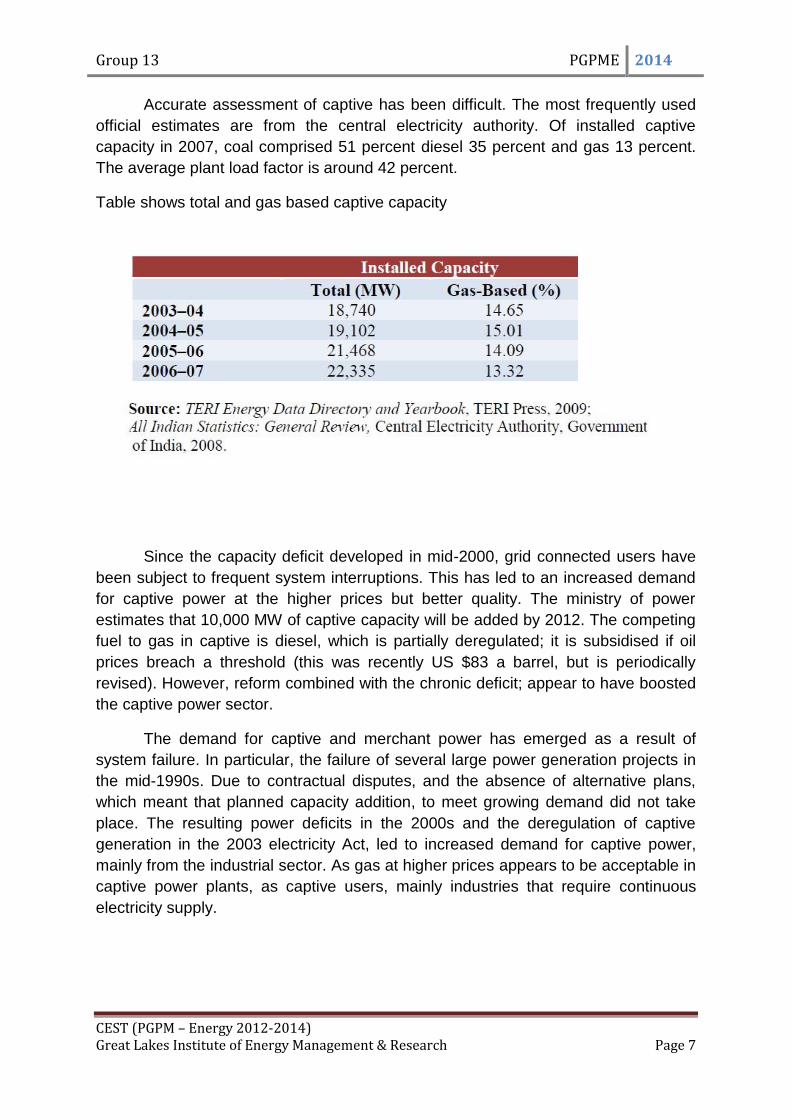
Accurate assessment of captive has been difficult. The most frequently used
official estimates are from the central electricity authority. Of installed captive
capacity in 2007, coal comprised 51 percent diesel 35 percent and gas 13 percent.
The average plant load factor is around 42 percent.
Table shows total and gas based captive capacity
Since the capacity deficit developed in mid-2000, grid connected users have
been subject to frequent system interruptions. This has led to an increased demand
for captive power at the higher prices but better quality. The ministry of power
estimates that 10,000 MW of captive capacity will be added by 2012. The competing
fuel to gas in captive is diesel, which is partially deregulated; it is subsidised if oil
prices breach a threshold (this was recently US $83 a barrel, but is periodically
revised). However, reform combined with the chronic deficit; appear to have boosted
the captive power sector.
The demand for captive and merchant power has emerged as a result of
system failure. In particular, the failure of several large power generation projects in
the mid-1990s. Due to contractual disputes, and the absence of alternative plans,
which meant that planned capacity addition, to meet growing demand did not take
place. The resulting power deficits in the 2000s and the deregulation of captive
generation in the 2003 electricity Act, led to increased demand for captive power,
mainly from the industrial sector. As gas at higher prices appears to be acceptable in
captive power plants, as captive users, mainly industries that require continuous
electricity supply.
Group 13 PGPME 2014
CEST (PGPM – Energy 2012-2014) Great Lakes Institute of Energy Management & Research Page 8
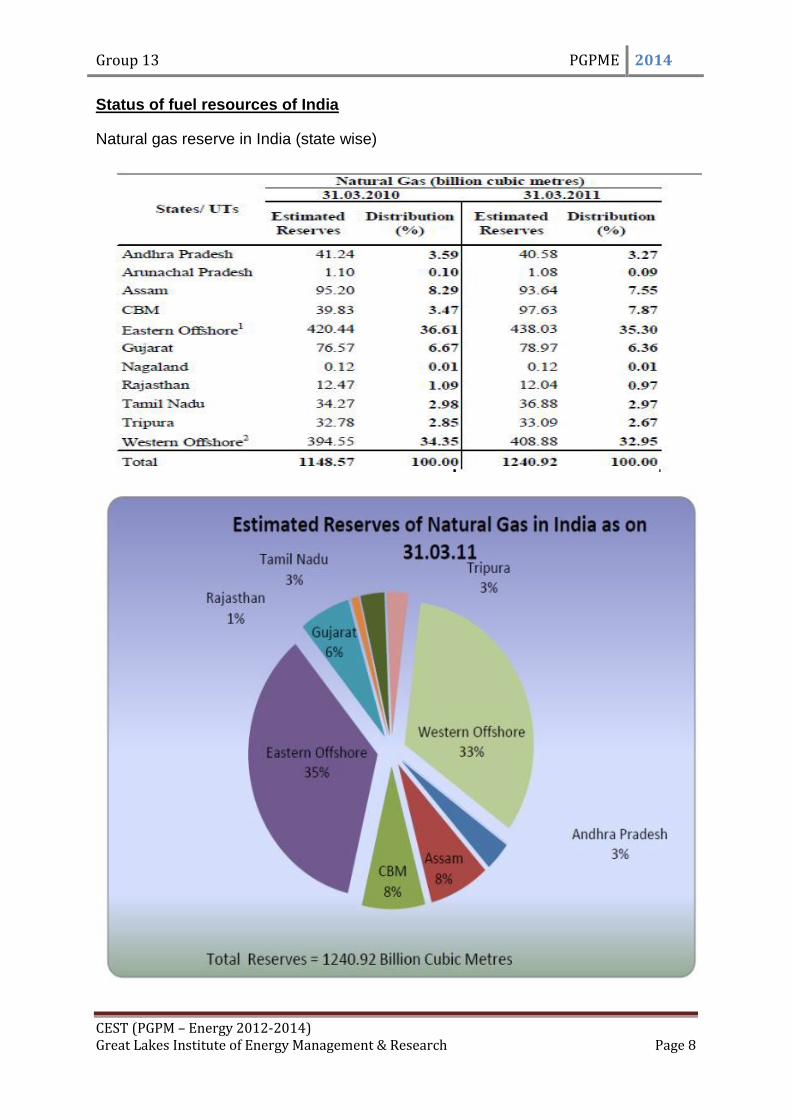
Status of fuel resources of India
Natural gas reserve in India (state wise)
Group 13 PGPME 2014
CEST (PGPM – Energy 2012-2014) Great Lakes Institute of Energy Management & Research Page 9
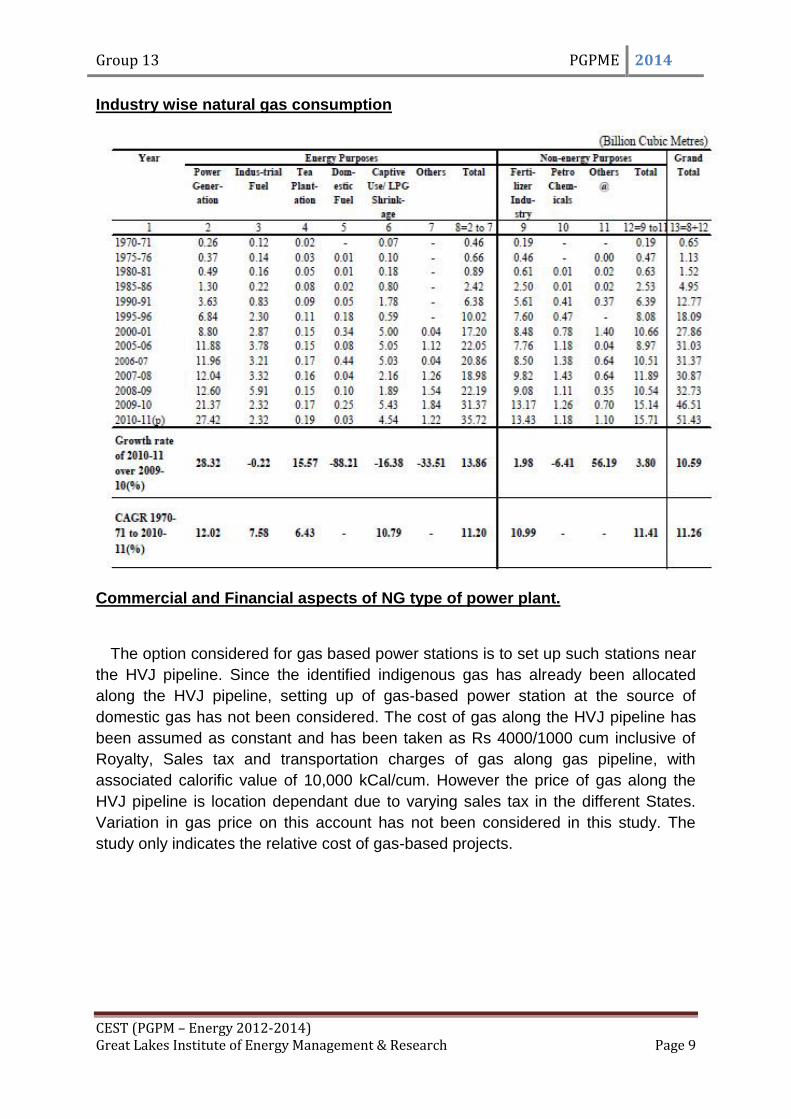
Industry wise natural gas consumption
Commercial and Financial aspects of NG type of power plant.
The option considered for gas based power stations is to set up such stations near
the HVJ pipeline. Since the identified indigenous gas has already been allocated
along the HVJ pipeline, setting up of gas-based power station at the source of
domestic gas has not been considered. The cost of gas along the HVJ pipeline has
been assumed as constant and has been taken as Rs 4000/1000 cum inclusive of
Royalty, Sales tax and transportation charges of gas along gas pipeline, with
associated calorific value of 10,000 kCal/cum. However the price of gas along the
HVJ pipeline is location dependant due to varying sales tax in the different States.
Variation in gas price on this account has not been considered in this study. The
study only indicates the relative cost of gas-based projects.

Group 13 PGPME 2014
CEST (PGPM – Energy 2012-2014) Great Lakes Institute of Energy Management & Research Page 10
SUMMARY OF COST OF GENERATION BY VARIOUS FUELS AT 80 % PLF (Rs/kwh)
COST AT 80 % PLF DISTANCE IN km
200 300 500 800 1000 1200 1500 1800 2000
Domestic Coal PH 1.56 1.59 1.62 1.69 1.73 1.77 1.83 1.88 1.92
Domestic Coal LC 1.58 1.63 1.73 1.88 1.97 2.06 2.20 2.31 2.36 Imported Coal At Port 2.15 2.18 2.22 2.29 2.32 2.36 2.42 2.48 2.52
Imported Coal LC 2.11 2.15 2.22 2.32 2.39 2.46 2.56 2.65 2.69
Lignite At PH 2.11 2.14 2.18 2.25 2.28 2.32 2.38 2.44 2.48
LNG At Port 2.16 2.19 2.23 2.29 2.33 2.36 2.42 2.47 2.51
Naphtha At Port 4.33 4.36 4.39 4.46 4.49 4.53 4.59 4.64 4.68
Naphtha At LC 4.19 4.22 4.27 4.36 4.41 4.47 4.55 4.62 4.66
Gas Along Pipeline 1.49 1.49 1.49 1.49 1.49 1.49 1.49 1.49 1.49
Diesel At LC 5.96 5.96 5.96 5.96 5.96 5.96 5.96 5.96 5.96
Ranking Fuel and location Cost of delivered energy Rs/ kwh
1 Gas Along Pipeline 1.49
2 Domestic Coal at Pit Head. 1.69
3 Domestic Coal at Load 1.88
4 Lignite at Pit Head. 2. 25
5 Imported Coal at Port 2.29
6 LNG at Port 2.29
7 Imported Coal at Load Centre 2.32
8 Naphtha at Port 4.46
9 Naphtha at Load Centre 4.36
10 Diesel at LC 5.96
At prevailing fuel prices considered in the report, gas-based power plants
along HVJ pipeline are the cheapest option at all distances. At present the price of
gas is administered whereas in future it is likely to be deregulated and linked to
international price of crude oil. Therefore, since future trend of gas prices is not
known, the relative economics of gas based plants vis-à-vis the other options
could undergo a change in future.
Comparison of cost of generation of peaking plants (30%PLF) by types of
fuels is given below. As coal and lignite based plants are base load stations and
cannot operate at low PLF as peaking plants, cost of generation of these types of
plants is not considered in the analysis.
Group 13 PGPME 2014
CEST (PGPM – Energy 2012-2014) Great Lakes Institute of Energy Management & Research Page 11
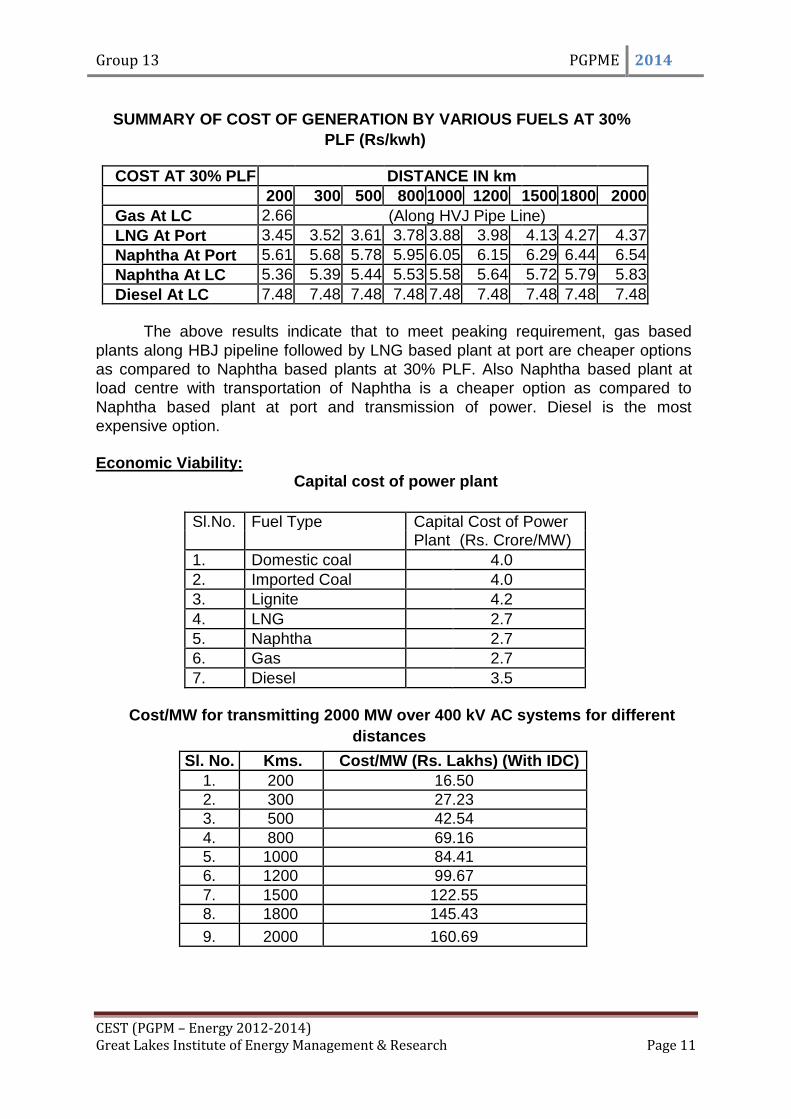
SUMMARY OF COST OF GENERATION BY VARIOUS FUELS AT 30%
PLF (Rs/kwh)
COST AT 30% PLF DISTANCE IN km
200 300 500 800 1000 1200 1500 1800 2000
Gas At LC 2.66 (Along HVJ Pipe Line)
LNG At Port 3.45 3.52 3.61 3.78 3.88 3.98 4.13 4.27 4.37
Naphtha At Port 5.61 5.68 5.78 5.95 6.05 6.15 6.29 6.44 6.54
Naphtha At LC 5.36 5.39 5.44 5.53 5.58 5.64 5.72 5.79 5.83
Diesel At LC 7.48 7.48 7.48 7.48 7.48 7.48 7.48 7.48 7.48
The above results indicate that to meet peaking requirement, gas based
plants along HBJ pipeline followed by LNG based plant at port are cheaper options
as compared to Naphtha based plants at 30% PLF. Also Naphtha based plant at
load centre with transportation of Naphtha is a cheaper option as compared to
Naphtha based plant at port and transmission of power. Diesel is the most
expensive option. Economic Viability:
Capital cost of power plant
Sl.No. Fuel Type Capital Cost of Power Plant (Rs. Crore/MW)
1. Domestic coal 4.0
2. Imported Coal 4.0
3. Lignite 4.2
4. LNG 2.7
5. Naphtha 2.7
6. Gas 2.7
7. Diesel 3.5
Cost/MW for transmitting 2000 MW over 400 kV AC systems for different
distances
Sl. No. Kms. Cost/MW (Rs. Lakhs) (With IDC)
1. 200 16.50
2. 300 27.23
3. 500 42.54
4. 800 69.16
5. 1000 84.41
6. 1200 99.67
7. 1500 122.55
8. 1800 145.43
9. 2000 160.69
Group 13 PGPME 2014
CEST (PGPM – Energy 2012-2014) Great Lakes Institute of Energy Management & Research Page 12
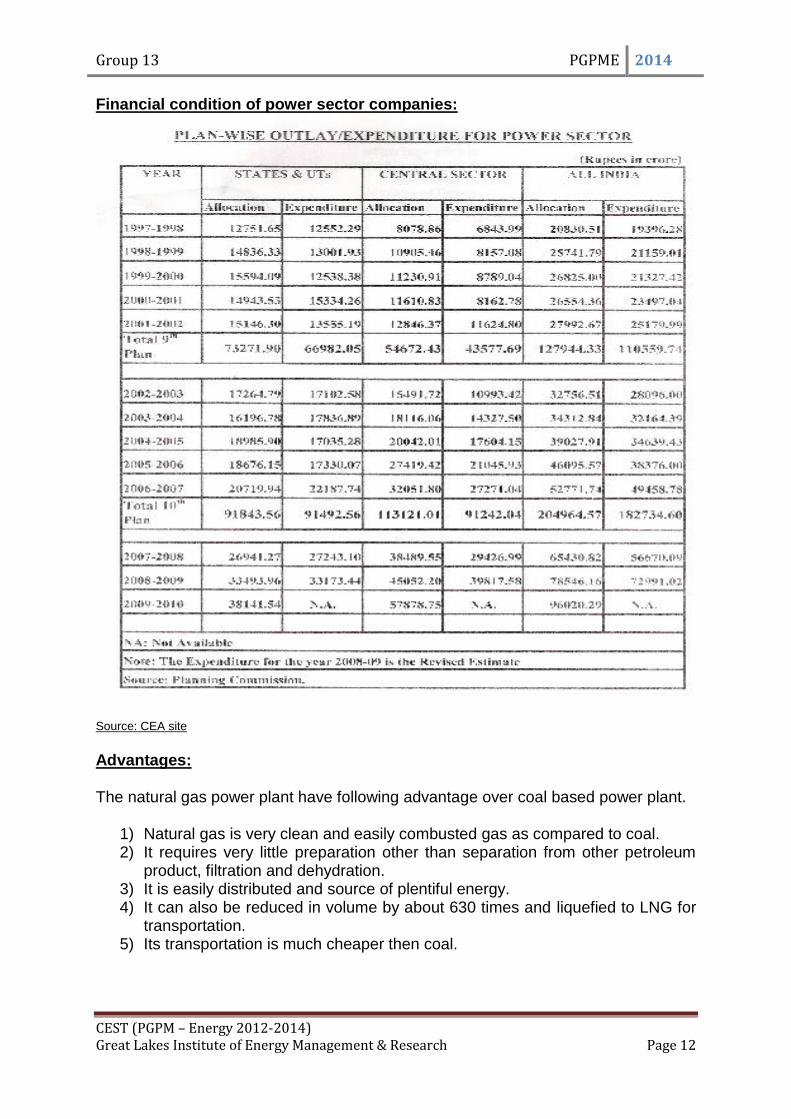
Financial condition of power sector companies:
Source: CEA site
Advantages:
The natural gas power plant have following advantage over coal based power plant.
1) Natural gas is very clean and easily combusted gas as compared to coal. 2) It requires very little preparation other than separation from other petroleum
product, filtration and dehydration. 3) It is easily distributed and source of plentiful energy. 4) It can also be reduced in volume by about 630 times and liquefied to LNG for
transportation. 5) Its transportation is much cheaper then coal.

Group 13 PGPME 2014
CEST (PGPM – Energy 2012-2014) Great Lakes Institute of Energy Management & Research Page 13
Future of natural gas based power plant in India:
Though natural gas has many advantage over coal Indian government and CEA (Central Electricity Authority) has said no to more gas based power plant set up till 2015-16. The reason behind this decision is natural gas output is expected to fall considerably.
Ministry of P&G projected that the natural gas production may fall by 35 to 27.64 million metric standard cubic meter per day and in the next fiscal may fall to another 12 %(24.22mmscmd) in 2013-14.
Ministry of Petroleum and Natural Gas regarding recently stated that the production is likely to go down by 15.03 mmscmd in 2012-13 and additional 3.42 mmscmd in 2013-14 against of 42.67 mmscmd in 2011-12.
The use of Shale Gas which is in hype in India can only be known when we come to know the proven reserves in the country and based on the availability of gas further planning and utilization of gas can be done.
Power plants which are based on natural gas are still sitting idle as non-availability of gas. MoP&NG indicated that whenever availability of gas developer will be informed.

Group 13 PGPME 2014
CEST (PGPM – Energy 2012-2014) Great Lakes Institute of Energy Management & Research Page 14
COAL Based Thermal Power Plants
India‟s total installed power capacity is 209 GW, out of which State sector
gives 87 GW(42%), Central sector gives 62 GW(30%) & Private sector gives 60
GW(28%) power. Depending upon the fuel/ source used to produce power, different
types of power plants are designed. Starting from Thermal Power Plants (67%),
Hydro Power Plants (19%), Nuclear (02%) & RES (Renewable Energy Sources,
Small Hydro, Biomass Gasifier, Biomass Power, 12%). All thermal power plants can
be categorised depending upon the fuel used in the power generation like if the Coal
is used to convert water into steam which ultimately rotates the turbine, to produce
electricity then it is called Coal based thermal power plants (120 GW, 57%), then
Gas based thermal plants (18 GW, 9%) & Oil based thermal plants (1 GW, 0.5%).
Demand & Supply
Till the end of the 11th 5 year plan, our peak demand was 127 GW & peak
available power was 114 GW which resulted in power deficit of 13 GW & deficit =
10.6%. Total Energy requirement was 694 GU (Giga Units) & energy available was
639 GU which resulted in Energy deficiency of 54 GU (08%). According to the 12th 5
year plan of govt., till the end of 5 years India should satisfy the 210 GW as a peak
load & 1500 BU (Billion Units). Capacity addition of Coal based Thermal Power plant
is 63 GW considering 9% GDP & 0.9 elasticity & Total addition in the India‟s power
sector is 76 GW, for the 12th year plan. Now, the Energy requirement that is to be
met by Coal based plants would be 1000 BU. Further, assuming that power available
from the Hydro is 30% less than the designed then 120 BU have to be generated
from the Coal only as India is totally dependent upon this fossil fuel for its energy
production. Present Demand Supply gap of Coal is 85 MT which is to be met by
either Domestic or Imported Coal.
Fuel Resources
India is the 5th Largest producer of the Coal in the World after USA, Russia,
China & Australia. India‟s Coal quality is very low ie. the calorific value of the Indian
Coal is low & Ash content is very high. Currently, India's total Coal Reserves are 293
Billion Tons (BT), comprising of Gondwana Coal & tertiary Coal. Gondwana‟s
Reserves: Proved – 117 BT, Indicated – 142 BT and Inferred – 32 BT. India‟s
inventory for High Gondwana Coal can be found in Jharkhand, Chhattisgarh, Orissa
etc & for Tertiary Coal Meghalaya, Nagaland with 1500 MT are prominent places in
India. Presently, main Exporters of Coal are Indonesia, Australia, South Africa etc &
Canada & USA are among the emerging suppliers of the Coal. India‟s Coal Handling
Capacity is 90 MT per annum.
International Condition of Fuels
USA is the largest producer of the Coal in the world followed by Russia, China
& Australia. These countries have many Coal reserves that they do not require to

Group 13 PGPME 2014
CEST (PGPM – Energy 2012-2014) Great Lakes Institute of Energy Management & Research Page 15
Import from other foreign countries. India imports Coal from various countries like
Australia, Indonesia etc. to meet their Coal requirement at home. Though India is the
5th Largest Coal Producer country in the world, it lags behind to exploit the reserves
effectively. Unlike USA, which has found the Shale gas reserves & isn‟t dependent
on Coal like India do, India spends a lot of Money in Importing quality Coal from
Foreign countries.
Status Of Different Technologies
There are various Fossil–Fuelled Electricity Generating Technologies for New
Power Plants & they are as follows:
1. Sub Critical Pulverised Coal Combustion.
2. Super Critical.
3. Ultra Super Critical.
4. Sub Critical Circulating Fluid Bed Combustion.
5. IGCC (Integrated Combined Cycle Gasification).
Subcritical, Supercritical and Ultra-Supercritical Pulverized Coal:
When the water is converted into steam, by burning Coal in the Boiler, & sent
to the Turbine‟s blade to rotate the turbine, the electricity is produced. After moving
the Turbine, this same steam is sent back to the boiler to get re-heated to the temp.
before & then again set to rotate the turbine. This process increases the cycle
efficiency.
A typical sub-critical power plant is designed to operate at pressure 2400 psi
with steam temp. at 1000 F which is reheated to 1000 F to increase the overall
efficiency of the system to about 35%. Whereas, a Super Critical Unit operates at
3500 psi & temp. at 1050 F which gives the efficiency of the system 38% or more. An
Ultra- super critical unit works at 4500 psi & 1100 F & its efficiency is 42% or more.
Circulating Fluid Bed Combustion (CFBC)
In this type of technology, Coal & Limestone are crushed & fed into the Boiler
where Calcination takes place & sulphur content present in the Carbon, gets reacted
with oxygen to produce Calcium Sulphate, which is collected afterwards. Addition of
the Limestone avoids the formation of H2SO4 in the boiler. Here, bed operates at
low temp which favours low NOx formation & SO2 captured by the Lime.
IGCC (Integrated Combined Cycle Gasification)
In this Technology, Coal is gasified i.e. Coal is converted into a Gas called
Synthesis Gas or Syngas, which is further used as a clean fuel. There are three
purposes to convert Coal into Syngas: For getting a clean Fuel i.e. Syngas,
Production of Chemicals & as a fuel in Power Plant. Using control technologies,
Syngas could be cleaned of particulates & sulphur and could be used as a fuel for

Group 13 PGPME 2014
CEST (PGPM – Energy 2012-2014) Great Lakes Institute of Energy Management & Research Page 16
electricity production OR processed further to create methane & put into a pipeline to
replace Natural Gas.
So, fine ground Coal is mixed with Oxygen/Air & steam in a gasifier. The partial
oxidation of coal raises the temp. to produce a gas mixture of H2 & CO – syngas.
This gas is Clean & then burned to produce electricity.
Financial side of the Power Plants could be realised through following costs:
1). Investment Cost:
Investment Costs include Engineering, Construction, Procurement &
Transmission. Engineering, Procurement & Construction include all the costs
occurring after making a decision to set up a Thermal Power Plant like costs
providing the required equipments, various construction activities, preparation for the
coming project. Type of power plant is the basic phenomenon to determine the cost
of the Project. Like Nuclear Power Plants have the highest investment cost followed
by Coal, wind, solar & gas fired thermal plants. Moreover, increase in the basic
construction materials like Cement, Steel, Iron & even demand of equipments will
increase these 3 costs.
As Power Plants are mostly set up near the shore or away from the
cities/towns, the need for the investment in transmission lines is essential. They are
established near water sources or coal pits just to reduce their transportation costs
etc.
2). Operating Cost:
Operating Cost is nothing but the expenses occurred during the production of
electricity from a Thermal Power Plant. These expenses include Direct Labour Cost,
Raw Material Cost, Manufacturing Over-Head Cost, Marketing & Administration
Cost. Direct labour cost includes the wages of the working staff, direct material cost
constitutes of Raw material & semi-finished materials & manufacturing over-head
includes direct or indirect expenses on production.
The most important cost item in operating cost of a power plant is the fuel
cost. In a coal-fired power plant, the operating expenses are 60-70% of the total
expenses.
3). Supporting Cost:
All Costs related to environment, strategic, R&D, Socio-political, Socio-
economic and which do not affect the investment & operating costs, come into this
group. Like we are in a great need to develop a clean fuel technology which could be
coming in future by spending some amount in R&D. So, its expenses will come
under Support Costs OR we need to revise our energy policy in view of natural

Group 13 PGPME 2014
CEST (PGPM – Energy 2012-2014) Great Lakes Institute of Energy Management & Research Page 17
disasters etc. These costs are generally invisible & its effectiveness could be seen if
they could be planned before they actually occur.
Economic Viability
In USA, the Shale Gas revolution has resulted in closing of many Coal Plants.
Its prices are very less in comparison to the most widely used source of energy i.e.
COAL. Because of the availability of the Natural Gas, it is difficult for the Coal power
plants around the state & country to sell their power. Also, there‟s not much emission
of CO2 when Shale Gas is used as a source of energy. The efficiency of the gas is
also better than Coal. Using shale gas will result in more than 20% efficiency & also
reduced greenhouse gas emission. It produces half of the CO2 produced by Coal,
less than 1/3 of the NOx. In 2010, nearly 12GW coal power plants were retired & 25-
100 GW power plants are expected to retire till 2020. Moreover, 72% of US power
plants are older than 30 years & 34% more than 40 years old. These plants ask for
high maintenance costs & are highly in-efficient as well.
In India, the situation is all different. India is in a growing stage where the
energy consumption is increasing rapidly. Coal being the primary energy source will
remain as a main source of power for the near future. Natural Gas exploration is
being started in India but India doesn‟t have the reserves as well the technology
required to extract the gas easily. So, India‟s GDP still depends upon the energy
consumption & hence coal power plants will keep running & keep increasing the
temp. by producing Green House Gases. If India‟s economy has to grow fast, India
should increase its per capita energy consumption which will increase the Demand
for coal which ultimately led to more dependency on Coal as Coal Power Plants can
run 24X7.
Financial condition of power sector companies
India‟s economy is one of the fastest growing in the world. This means India‟s
energy consumption is also increasing day by day. Though many reforms are being
put on the Power sector for making the system more efficient & competitive,
shortage of power & lack of access continues to be a major constraint on economic
growth. The average peak shortage is 12% & average energy shortage is 11% in
2008-09. This indicates the energy deficiency in the country due to insufficient
generating capacity & inadequate transmission and distribution network. The major
problem is in the distribution network i.e. DISCOMs as the avg. AT&C losses are up
to 40% in the country. This results in poor financial health of the DISCOMs & which
ultimately affects generating units as DISCOMs aren‟t able to pay to the Generating
companies whose power they distributed. Collection & Billing processes also have
many flaws in their system.
Accelerated Power Development & Restructuring Programme (APDRP) was introduced in the system to bring down the AT&C losses but it could not even come

Group 13 PGPME 2014
CEST (PGPM – Energy 2012-2014) Great Lakes Institute of Energy Management & Research Page 18
near to the targeted 15%. By working effectively & efficiently over the Collection & Billing of the tariffs & reduction in the theft could result in lower losses & hence the financial state of the DISCOMs would become healthy.
Future Aspects
To achieve the 12th, 5 year plan of govt., we must arrange for the required
amount of the Coal either from Domestic or Imported Coal. As per the Business As
Usual (BAU), Coal requirement during the year 2016-17 is around 842 MT & Coal
availability expected from CIL (Coal India Limited) & SCCL(Singareni Collieries
Company limited) is 415 MT & 35 MT respectively. Captive blocks allocated to
Power Utilities by CIL is 100 MT & Coal to be imported is 54 MT as those plants are
designed for imported coal because of their high calorific value. Hence, the total coal
availability expected is 604 MT which is 238 MT short. Therefore, CIL should
increase their output of providing required Coal so that India could not depend on
Imported Coal for Power generation.
Coal shortage could result in lower PLF (Plant Load Factor) of the Thermal
Power Plants. Running plants are already facing coal shortage due to multiple
reasons. Maximum Coal blocks are already with Coal India Ltd. which is under CAG
scanner for doing wrong bidding in allocation of the coal blocks to various private
players. This resulted in underutilisation of the plants & many plants were shut down
due to high maintenance costs under low load. Private players are purchasing the
Coal blocks overseas to keep on producing power & earn profits by running over the
imported coal until CAG sorts out the on-going Coal Block scam.
With time, natural gas will take over Coal as a primary source of energy when
the advanced technology will help extracting gas fuels from the reserves.
Dependency on the dirtiest form of fossil would be no more & more efficient plant
would be made to run effectively. CO2 emission would be reduced big time & hence
would be called as Clean Fuel.
Environmental Consideration
Coal is the Dirtiest fossil fuel, used to generate power as it emits CO2, SO2
etc. which affect the environment adversely. CO2 so produced heats up the earth
which results in dropping of the temperature & hence led to melting of Glaciers &
Mountains. CO2 doesn‟t allow the heat radiations to get reflected from the Earth‟s
surface & results in increasing of surrounding temp. SO2 results in Acid Rain which is
dangerous for living beings on land & aquatic. Moreover, Ash produced after
complete combustion of the Coal is to be disposed safely. They are hazardous to the
surroundings & that‟s why they are either dig into the earth OR used in the
Construction of the buildings, to provide strength to the structure.
At present, both China & India are growing at a fast rate with Coal as the
primary source of Energy. Therefore, each of the country‟s govt. should adopt the

Group 13 PGPME 2014
CEST (PGPM – Energy 2012-2014) Great Lakes Institute of Energy Management & Research Page 19
Super Critical Steam technology to reduce the emission of these dangerous gases &
stop installation of the old Sub Critical steam Technology Coal power plants.
Solar Power – Requirement of Tomorrow
1. Introduction
India is one of the fastest growing countries in terms of energy consumption. Currently, it is the fifth largest consumer of energy in the world, and will be the third largest by 2030. The country is heavily dependent on fossil sources of energy for most of its demand. Energy supply is a challenge and is becoming more so every minute. Producing fossil fuels is far from easy and nuclear energy with its irresponsible short- and long-term threats is not the solution either.The fact is that our approach to consuming energy needs to become responsible. It is believed that the geographical location of India allows the country to receive well over 5000 trillion kWh of pure solar energy each year, which is far beyond the annual power consumption of India. With the help of the solar cells and solar panels it is possible to generate electricity in areas where the exposure to sun is comparatively lesser .
The launch of Jawaharlal Nehru National Solar Mission (JNNSM) has created a lot of interest in the India solar sector. To create demand and attract investment in the sector, the government is providing various incentives. India‟s solar PV market has grown by 75% in 2010 and 50% in 2011. India has huge potential for solar PV and with the right policy support by the Indian Government; India can become a major player in the solar market globally. 2. Solar power potential in India
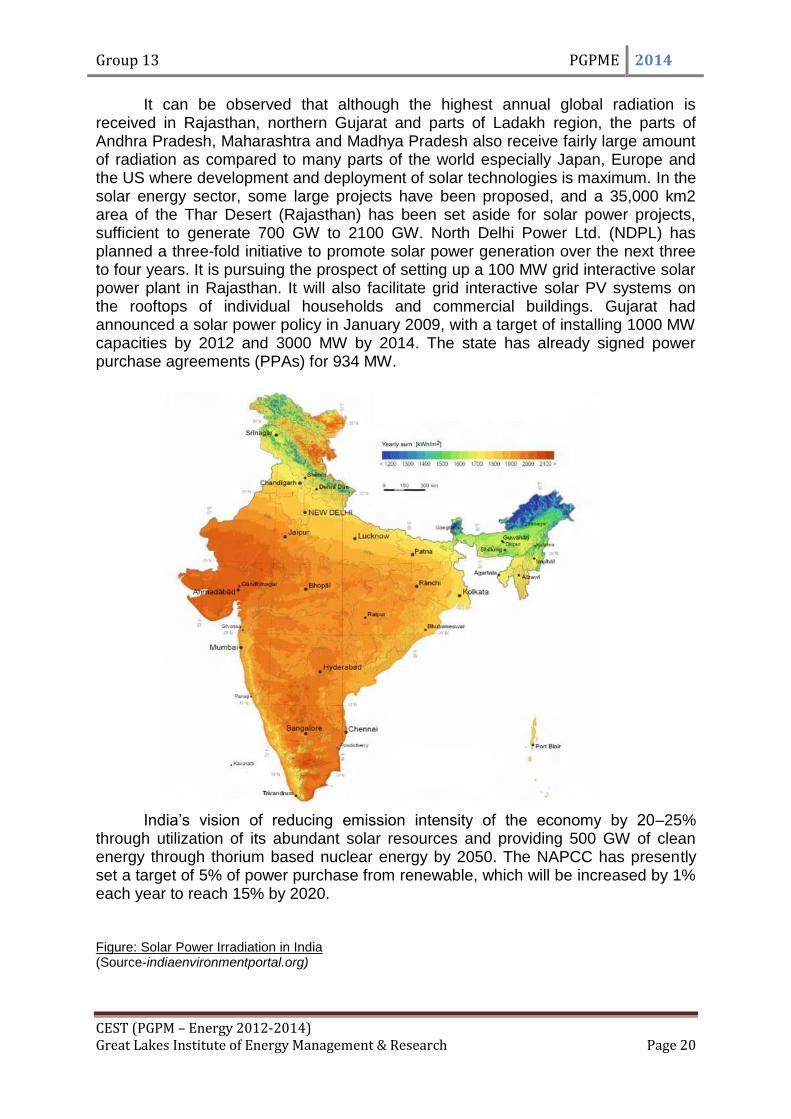
In response to present scenario of energy consumption, India is gradually shifting focus towards its renewable energy resources. Driven by an increasing demand for electricity and widening gap between demand and supply, India has targeted 20GW of Solar Power by 2022. India is endowed with rich solar energy resource. Because of its location between the Tropic of Cancer and the Equator, India has an average annual temperature that ranges from 25°C –27.5 °C. Being a tropical country, India has huge potential for solar power generation. The average intensity of solar radiation received on India is 200 MW/km2 with 250–300 sunny days in a year. As per government estimates, India receives 5,000tn kWh per year, with most parts of the country receiving 4-7 kWh per square metre per day. Solar is an important, although currently underutilized, energy resource in India with the potential to offer an improved power supply (especially in rural and remote areas) and increase the security of India‟s energy supply. Solar energy intensity varies geographically with Western Rajasthan receiving the highest annual radiation energy and the north-eastern regions receiving the least. India has a good level of solar radiation, receiving the solar energy equivalents of more than 5,000 trillion kWh/year. Depending on the location, the daily incidence ranges from 4 - 7 kWh/m2, with the hours of sunshine ranging from 2300 to 3200 per year. The annual global radiation varies from 1600 to 2200 kWh/m2, which is comparable with radiation received in the tropical and sub-tropical regions. The equivalent energy potential is about 6000 million GWh of energy per year. Solar radiation levels in different parts of the country are given in Fig. 1.
Group 13 PGPME 2014
CEST (PGPM – Energy 2012-2014) Great Lakes Institute of Energy Management & Research Page 20
It can be observed that although the highest annual global radiation is received in Rajasthan, northern Gujarat and parts of Ladakh region, the parts of Andhra Pradesh, Maharashtra and Madhya Pradesh also receive fairly large amount of radiation as compared to many parts of the world especially Japan, Europe and the US where development and deployment of solar technologies is maximum. In the solar energy sector, some large projects have been proposed, and a 35,000 km2 area of the Thar Desert (Rajasthan) has been set aside for solar power projects, sufficient to generate 700 GW to 2100 GW. North Delhi Power Ltd. (NDPL) has planned a three-fold initiative to promote solar power generation over the next three to four years. It is pursuing the prospect of setting up a 100 MW grid interactive solar power plant in Rajasthan. It will also facilitate grid interactive solar PV systems on the rooftops of individual households and commercial buildings. Gujarat had announced a solar power policy in January 2009, with a target of installing 1000 MW capacities by 2012 and 3000 MW by 2014. The state has already signed power purchase agreements (PPAs) for 934 MW.
India‟s vision of reducing emission intensity of the economy by 20–25% through utilization of its abundant solar resources and providing 500 GW of clean energy through thorium based nuclear energy by 2050. The NAPCC has presently set a target of 5% of power purchase from renewable, which will be increased by 1% each year to reach 15% by 2020. Figure: Solar Power Irradiation in India (Source-indiaenvironmentportal.org)

Group 13 PGPME 2014
CEST (PGPM – Energy 2012-2014) Great Lakes Institute of Energy Management & Research Page 21
3. Indian solar market potential
It is believed that Indian Photovoltaic market have huge potential. The future
generation of gadgets will mostly comprise those powered by the solar energy.
Depleting non-renewable energy resources, rising electricity bill and increasing
awareness about green energy sources, have prompted people to adopt
technologies to harness the abundantly available solar energy. It is clean, reliable
and safe and if used skilfully, can reduce our dependency on conventional form of
energy and save money as well as environment. Today, there is a wide range of
solar devices available in the market including solar mobile phones, solar chargers,
solar shaver, solar candles, solar lamps, solar headphones, solar exhaust fans, solar
heating devices, solar energy saver etc. India today is the world‟s fourth largest
economy. Its economy has grown steadily over the last30 years, averaging 7%
annually since 2000. Electricity demand is growing at 8% annually, similar to the
growth of the economy. According to some articles, there is a 92 GW electricity
demand over the next 10 years. India has a power generation capacity of about 170k
MW of which only about 8 – 10% is generated through renewable sources. The
country has an estimated renewable energy potential of around 85 GW from
commercially exploitable sources: wind: 45 GW, small hydro: 15 GW and
biomass/bio-energy: 25 GW. India has the potential to generate 35 MW/km2 using
solar photovoltaic and solar thermal energy. The Government of India and its state
governments have created a major initiative called „The National Solar Mission‟. One
of the main features of the Mission is to make India a global leader in solar energy
and the mission envisages an installed solar generation capacity of 20 GW by 2022.
This could in fact be much larger due to private initiatives that will no longer need
state aid.
4. Demand and opportunities in solar market There is an immense potential for solar gadgets in India, but certain hurdles prevent the rise in their demand. Environmental awareness is a prime factor fueling the demand of solar gadgets; however, in India this awareness is not as high as it should be. About 70 per cent of India lives in villages with very poor or no electricity supply. The demand for solar gadgets has increased in the past two to three years and the solar market has gained momentum. During the last quarter we have noticed a 25 to 30 percent rise in sales. However, this demand has mostly come from small scale industries and villages. Although the market potential for solar products is huge, availability of coal generated electricity at Rs. 2.80/Kwh is the biggest hindrance for selling solar generated electricity that costs Rs 15/Kwh. It implies that when it comes to spending money, people prefer to save rather than care for the environment. Based on likely predictions of growth for the next decade, the solar module demand worldwide until is forecast as follows:
2010 2011 2012 2013 2014 2017 2020
13.6 20.2 23.8 33 45.3 85 200

Group 13 PGPME 2014
CEST (PGPM – Energy 2012-2014) Great Lakes Institute of Energy Management & Research Page 22
Demand for Solar PV Modules by Year (GW).The JNNSM guidelines stipulate that all the grid connected Solar PV plants in India coming under the scheme will have to use Solar PV modules that are made in India. 5. International Status of Solar Power Solar PV is the term used to designate generation that uses the photoelectric effect to produce electricity. Globally, solar PV accounted for 69.8 GW of installed capacity at the end of 2011, and its capacity is expected to increase by about 29.9 GW in 2012. Solar capacity growth in 2011 was dominated by two countries, Italy (9.3 GW added) and Germany (7.5 GW). Together they accounted for 57.1% of global capacity growth in 2011. Germany remains the leader for cumulative installed capacity (24.8 GW), and Italy (12.8 GW) has leapt into second place ahead of Japan (4.9 GW). 6. Economic Viability of Solar Power Photovoltaic efficiency and manufacturing costs have not reached the point that photovoltaic power generation can compete with conventional coal-, gas-, and nuclear powered facilities. The cost of solar power is approximately four times that of
conventionally (Coal based Thermal Power Station) produced power. There are various factors that affect the cost of producing and distributing conventional electrical power. Due to the wide range of these variables, some applications of photovoltaic power are economically superior to conventional systems. (Source: EIA)
Group 13 PGPME 2014
CEST (PGPM – Energy 2012-2014) Great Lakes Institute of Energy Management & Research Page 23
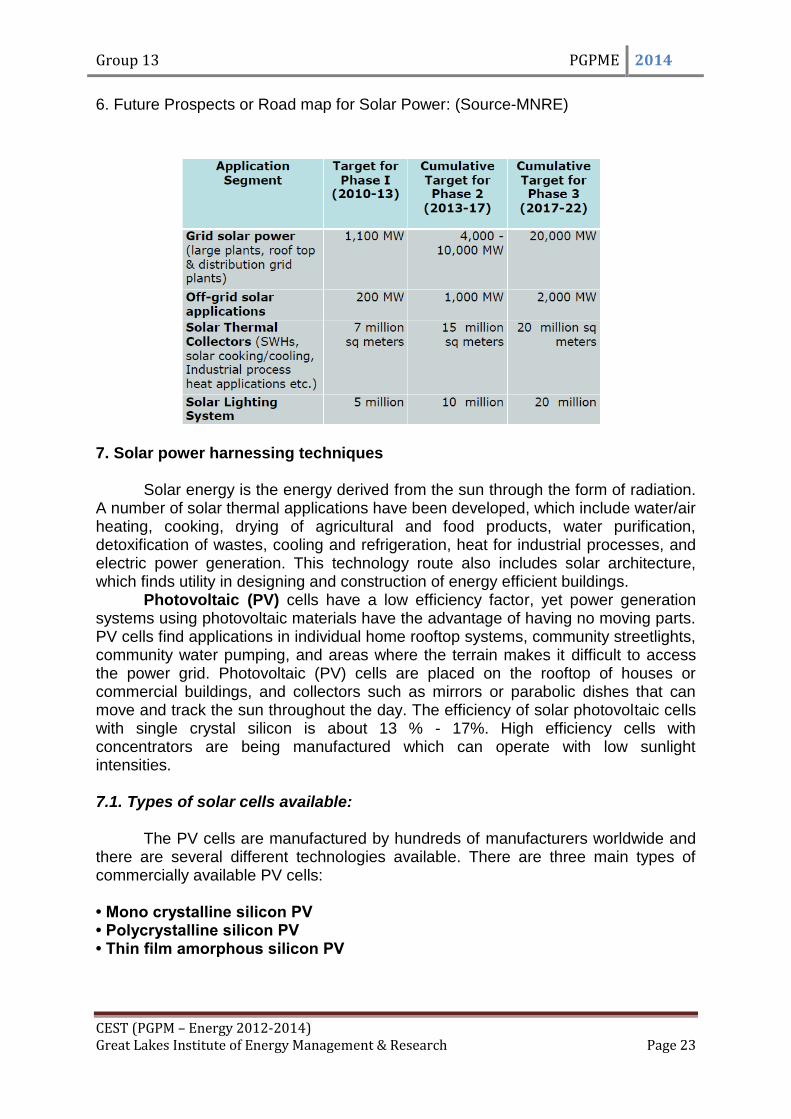
6. Future Prospects or Road map for Solar Power: (Source-MNRE) 7. Solar power harnessing techniques
Solar energy is the energy derived from the sun through the form of radiation.
A number of solar thermal applications have been developed, which include water/air heating, cooking, drying of agricultural and food products, water purification, detoxification of wastes, cooling and refrigeration, heat for industrial processes, and electric power generation. This technology route also includes solar architecture, which finds utility in designing and construction of energy efficient buildings.
Photovoltaic (PV) cells have a low efficiency factor, yet power generation systems using photovoltaic materials have the advantage of having no moving parts. PV cells find applications in individual home rooftop systems, community streetlights, community water pumping, and areas where the terrain makes it difficult to access the power grid. Photovoltaic (PV) cells are placed on the rooftop of houses or commercial buildings, and collectors such as mirrors or parabolic dishes that can move and track the sun throughout the day. The efficiency of solar photovoltaic cells with single crystal silicon is about 13 % - 17%. High efficiency cells with concentrators are being manufactured which can operate with low sunlight intensities. 7.1. Types of solar cells available:
The PV cells are manufactured by hundreds of manufacturers worldwide and there are several different technologies available. There are three main types of commercially available PV cells: • Mono crystalline silicon PV • Polycrystalline silicon PV • Thin film amorphous silicon PV

Group 13 PGPME 2014
CEST (PGPM – Energy 2012-2014) Great Lakes Institute of Energy Management & Research Page 24
At present the first two categories dominate world markets constituting 93% of it the last one account for 4.2% of the market. There are other types of solar cells but is less in use which includes concentrated photovoltaic, hybrid solar cells, multi junction solar cells etc. The silicon based technologies, crystalline Silicon, multi-crystalline Silicon, amorphous silicon are the dominant technologies at 24%, 19% and 12% efficiencies respectively at cell levels. The efficiencies at module levels are 5-6 % lower due to variety of reasons. Most of the Indian companies are producing at 15-17% efficiencies at cell levels and at about 12-13% at module levels. There is scope of improvement in different technologies. A Thin-Film Solar Cell (TFSC), also called a Thin-Film Photovoltaic Cell (TFPV), is a solar cell that is made by depositing one or more thin layers (thin film) of photovoltaic material on a substrate. The thickness range of such a layer is wide and varies from a few nanometres to tens of micrometres. Many different photovoltaic materials are deposited with various deposition methods on a variety of substrates. Thin Film Solar Cells are usually categorized according to the photovoltaic material used. The following categories exist:
• Cadmium Telluride (CdTe) • Copper indium gallium selenide (CIS or CIGS) • Dye-sensitized solar cell (DSC) • Organic solar cell • Amorphous silicon (a-Si)
On an average the efficiency of thin film cells are 6-12% furthermore the thin-
film PV market is showing a spectacular annual growth rate of 126% in 2007. These thin film solar cells will be suitable for window and facades in Building Integrated PV (BIPV) technologies.
High efficiency solar cells with concentrators: Highest efficiency solar cells have micro morph triple junction Ge/GaAs/GaInAsP materials. Technology is quite intricate and cost of triple junction solar is quite high. Hence, these cells are primarily used for satellite applications. For terrestrial applications, these cells are used in high concentration mode to reduce usage of costlier cells. Using optical reflectors, light is concentrated from 200-500 times on 1 cm2 active area. The Sun is tracked daylong in two dimensions to keep the sunspot on device area. Only few companies have mastered the cell and tracker technologies. There is need to know better and perfect the cell and tracker technologies 8. Conclusion
Economic feasibility is not always the determining factor in selecting a power generation system. More over days has passed when the cost of conventional energy was significantly lower than the cost of solar energy. At present the increased price in coal is driving the higher cost of electricity. For instance in eastern India cost of B Grade coal was around Rs. 1750 during 2006-07 which has escalated to Rs. 3350 during 2011-12. The price has almost doubled in a span of just 5 yrs. Also today if we compare the price of Traded Electricity during peak hours and cost of Solar KWH we will find days are not far when Solar will be the cheapest source of

Group 13 PGPME 2014
CEST (PGPM – Energy 2012-2014) Great Lakes Institute of Energy Management & Research Page 25
energy. It may not be always cost effective to supply all the energy requirements from the sun but economic feasibility is not always the determining factor in selecting a power generation system. If we consider a conventional power plant, it depends on fuel that is purchased as a continuous string of payments during the lifetime of the plant. However a solar power plant needs to finance its “fuel costs” through capital investment at the beginning of the project. The deregulation of the power market in almost all countries of the world led to the emergence of independent power producers and project finance techniques. Even if only a small percentage of its potential put to work, solar electricity generation will be an important pillar in the struggle against “Energy Security” & “Climate change”.
HYDRO POWER GENERATION
Introduction
Hydropower is a renewable energy resource because it uses the Earth's water cycle to generate electricity. Water evaporates from the Earth's surface, forms clouds, precipitates back to earth, and flows toward the ocean. The movement of water as it flows downstream creates kinetic energy that can be converted into electricity. 2700 TWH is generated every year. Hydropower supplies at least 50% of electricity production in 66 countries and at least 90% in 24 countries. Out of the total power generation installed capacity in India of 1,76,990 MW (June, 2011), hydro power contributes about 21.5% i.e. 38,106 MW. A capacity addition of 78,700 MW is envisaged from different conventional sources during 2007-2012 (the 11th Plan), which includes 15,627 MW from large hydro projects. In addition to this, a capacity addition of 1400 MW was envisaged from small hydro up to 25 MW station capacity. The total hydroelectric power potential in the country is assessed at about 150,000 MW, equivalent to 84,000 MW at 60% load factor. The potential of small hydro power projects is estimated at about 15,000 MW. Technology A hydroelectric power plant consists of a high dam that is built across a large river to create a reservoir, and a station where the process of energy conversion to electricity takes place. The first step in the generation of energy in a hydropower plant is the collection of run-off of seasonal rain and snow in lakes, streams and rivers, during the hydrological cycle. The run-off flows to dams downstream. The water falls through a dam, into the hydropower plant and turns a large wheel called a turbine. The turbine converts the energy of falling water into mechanical energy to drive the generator After this process has taken place electricity is transferred to the communities through transmission lines and the water is released back into the lakes, streams or rivers. This is entirely not harmful, because no pollutants are added to the water while it flows through the hydropower plant. Potential in India India is blessed with immense amount of hydro-electric potential and ranks 5th in terms of exploitable hydro-potential on global scenario. As per assessment made by CEA, India is endowed with economically exploitable hydro-power potential to the tune of 1 48 700 MW of installed capacity. The basin wise assessed potential is as under:-

Group 13 PGPME 2014
CEST (PGPM – Energy 2012-2014) Great Lakes Institute of Energy Management & Research Page 26
Basin/RiversProbable Installed Capacity (MW)
Indus Basin 33,832
Ganga Basin 20,711
Central Indian River system 4,152
Western Flowing Rivers of southern India 9,430
Eastern Flowing Rivers of southern India 14,511
Brahmaputra Basin 66,065
Total 1,48,701
In addition, 56 number of pumped storage projects have also been identified
with probable installed capacity of 94 000 MW. In addition to this, hydro-potential from small, mini & micro schemes has been estimated as 6 782 MW from 1 512 sites. Thus, in totality India is endowed with hydro-potential of about 2 50 000 MW. Installed Capacity The total installed capacity of India is 36878 MW.

Group 13 PGPME 2014
CEST (PGPM – Energy 2012-2014) Great Lakes Institute of Energy Management & Research Page 27
Projects:
Major Hydropower generating units
NAME STATE CAPACITY (MW)
BHAKRA PUNJAB 1100
NAGARJUNA ANDHRA PRADESH 960
KOYNA MAHARASHTRA 920
DEHAR HIMACHAL PRADESH 990
SHARAVATHY KARNATAKA 891
KALINADI KARNATAKA 810
SRISAILAM ANDHRA PRADESH 770
Top ten countries (in terms of capacity)
COUNTRY POWER CAPACITY (MWh) INSTALLED CAPACITY (MW)
TAJIKISTAN 527000 4000
CANADA 341312 66954
USA 319484 79511
BRAZIL 285603 57517
CHINA 204300 65000
RUSSIA 160500 44000
NORWAY 121824 27528
JAPAN 84500 27229
INDIA 82237 22083
FRANCE 77500 77500

Group 13 PGPME 2014
CEST (PGPM – Energy 2012-2014) Great Lakes Institute of Energy Management & Research Page 28
Growth in Hydropower:
SMALL HYDRO:
In India, hydro power projects with a station capacity of up to 25 megawatt (MW) each fall under the category of small hydro power (SHP).
Potential
India has an estimated SHP potential of about 15 000 MW.
Installed Capacity
The total installed capacity of small hydro power projects (upto 25 MW) as on 31.03.2009 is 2429.77 MW from 674 projects and 188 projects with aggregate capacity of 483.23 MW are under construction.
Group 13 PGPME 2014
CEST (PGPM – Energy 2012-2014) Great Lakes Institute of Energy Management & Research Page 29
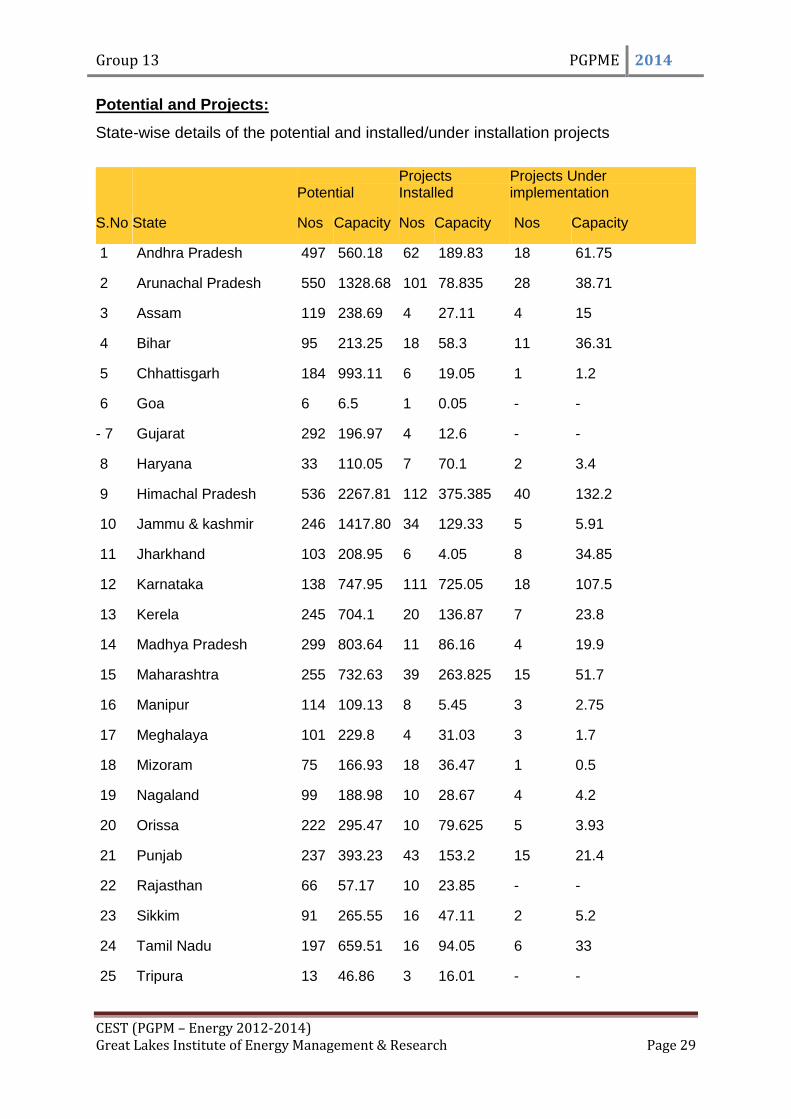
Potential and Projects:
State-wise details of the potential and installed/under installation projects
S.No State
Potential Projects Installed
Projects Under implementation
Nos Capacity Nos Capacity Nos Capacity
1 Andhra Pradesh 497 560.18 62 189.83 18 61.75
2 Arunachal Pradesh 550 1328.68 101 78.835 28 38.71
3 Assam 119 238.69 4 27.11 4 15
4 Bihar 95 213.25 18 58.3 11 36.31
5 Chhattisgarh 184 993.11 6 19.05 1 1.2
6 Goa 6 6.5 1 0.05 - -
- 7 Gujarat 292 196.97 4 12.6 - -
8 Haryana 33 110.05 7 70.1 2 3.4
9 Himachal Pradesh 536 2267.81 112 375.385 40 132.2
10 Jammu & kashmir 246 1417.80 34 129.33 5 5.91
11 Jharkhand 103 208.95 6 4.05 8 34.85
12 Karnataka 138 747.95 111 725.05 18 107.5
13 Kerela 245 704.1 20 136.87 7 23.8
14 Madhya Pradesh 299 803.64 11 86.16 4 19.9
15 Maharashtra 255 732.63 39 263.825 15 51.7
16 Manipur 114 109.13 8 5.45 3 2.75
17 Meghalaya 101 229.8 4 31.03 3 1.7
18 Mizoram 75 166.93 18 36.47 1 0.5
19 Nagaland 99 188.98 10 28.67 4 4.2
20 Orissa 222 295.47 10 79.625 5 3.93
21 Punjab 237 393.23 43 153.2 15 21.4
22 Rajasthan 66 57.17 10 23.85 - -
23 Sikkim 91 265.55 16 47.11 2 5.2
24 Tamil Nadu 197 659.51 16 94.05 6 33
25 Tripura 13 46.86 3 16.01 - -

Group 13 PGPME 2014
CEST (PGPM – Energy 2012-2014) Great Lakes Institute of Energy Management & Research Page 30
26 Uttar Pradesh 251 460.75 7 23.3 - -
27 Uttarakhand 444 1577.44 95 134.12 55 230.65
28 West Bengal 203 396.11 24 98.9 16 79.25
29 Andaman & Nicobar
Islands 7 7.27 1 5.25 - -
Total 5718 15384.15 801 2953.58 271 914.81
SHP projects installed in Private Sector (as on 31.03.2009)
Sl.No State Total Number Total Capacity
1 Andhra Pradesh 43 104.43
2 Assam 1 0.10
3 Gujarat 2 5.6
4 Himachal Pradesh 63 271.25
5 Haryana 2 7.4
6 Jammu & Kashmir 2 17.5
7 Karnataka 95 694.90
8 Kerela 3 36.00
9 Madhya Pradesh 1 2.20
10 Maharashtra 13 74.00
11 Orissa 2 32.00
12 Punjab 18 26.20
13 Tamil Nadu 1 0.35
14 Uttaranchal 10 48.30
15 West Bengal 5 6.45
Total 261 1326.68
Barriers:
The energy of running water has been exploited for very many years. However, traditional approaches have suffered disadvantages due to environmental factors. For example:
Group 13 PGPME 2014
CEST (PGPM – Energy 2012-2014) Great Lakes Institute of Energy Management & Research Page 31
Building a dam across a river floods the land that would otherwise be available for use, alters the landscape, affects the local community that would have lived and worked on the flooded land, alters the character of the river, and prevents the free movement of fish;
Diverting a river affects the nature of the countryside and does not lend itself to use on a large scale.
Permanent complete or partial blockage of a river for energy conversion is adversely affected by variations in flow.
Building large-scale hydro power plants can be polluting and damaging to surrounding ecosystems. Changing the course of waterways can also have a detrimental effect on human communities, agriculture and ecosystems further downstream.
Hydro projects can also be unreliable during prolonged droughts and dry seasons when rivers dry up or reduce in volume.
NUCLEAR POWER PLANTS
Introduction:
Nuclear power is the power generated by nuclear reactions with the help of nuclear
reactors. The whole process is carried out in a controlled environment. In a nuclear
power plant, radioactive elements are used as fuel to heat water to such an extent
that the steam created by it rotates the turbines of the plant to produce electricity.
The radioactive elements used in nuclear power plants include uranium, thorium and
plutonium. The atoms of these radioactive elements are allowed to split in a process
known as nuclear fission. This splitting of atoms produces enormous amount of
energy which is used to heat water and produce steam. The nuclear reactor controls
the reactions occurring in the plant. Estimates suggest that the use of nuclear power
to generate electricity for civilian use has the capacity to solve power crisis of the
entire world. Nuclear power plants are being built by many nations to cater their
power needs. As of today, nuclear power constitutes for about 16 per cent of the
total power generation in the world. Several countries, such as Japan and France,
have acknowledged the prominent advantages of nuclear power and resorted to it.
For example, more than 75 per cent of power generation in France can be attributed
to nuclear energy. Other countries are expected to follow the suit soon. India has
huge power requirement for which it has to build new power stations. It‟s time now
that India thinks in the same pitch to build nuclear power units to cope up with the
rising demand.
Group 13 PGPME 2014
CEST (PGPM – Energy 2012-2014) Great Lakes Institute of Energy Management & Research Page 32
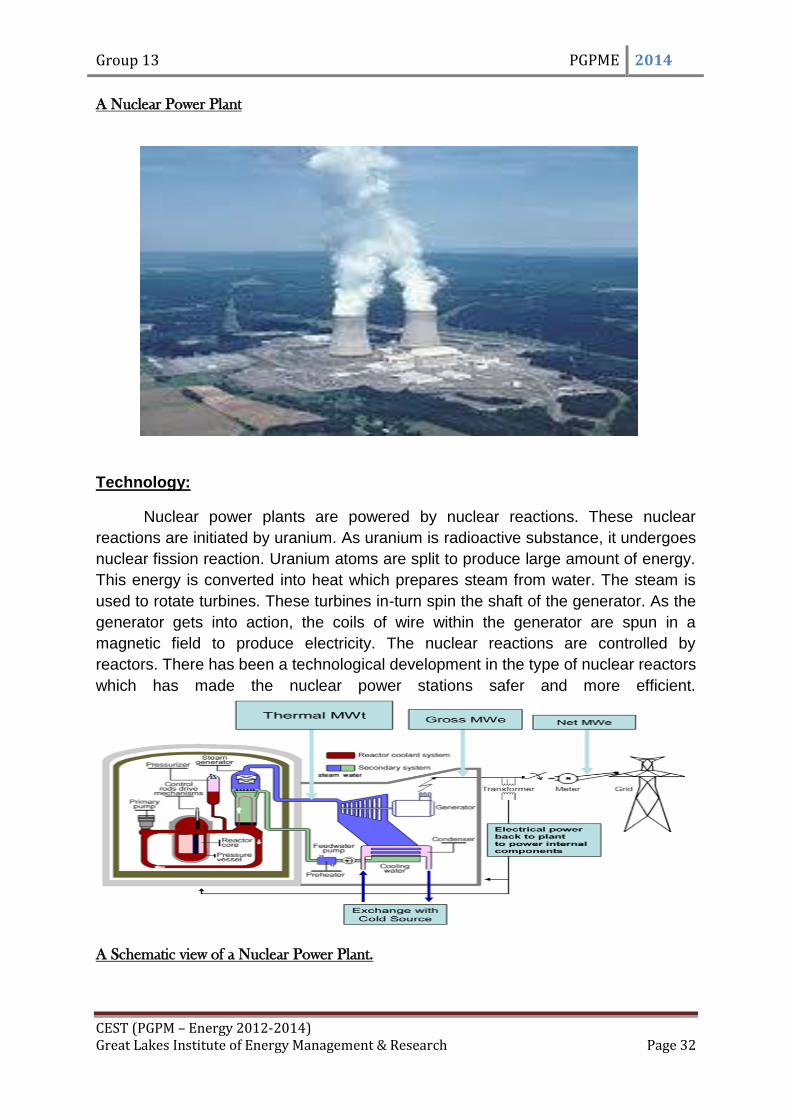
A Nuclear Power Plant
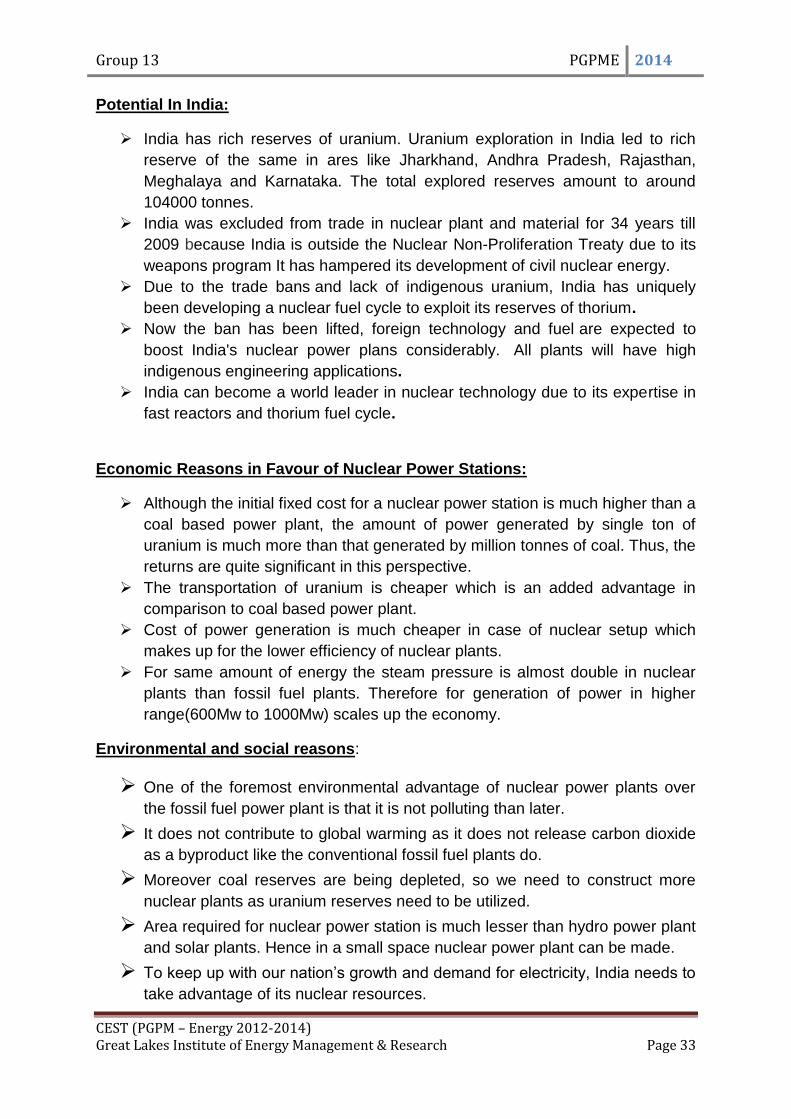
Technology:
Nuclear power plants are powered by nuclear reactions. These nuclear
reactions are initiated by uranium. As uranium is radioactive substance, it undergoes
nuclear fission reaction. Uranium atoms are split to produce large amount of energy.
This energy is converted into heat which prepares steam from water. The steam is
used to rotate turbines. These turbines in-turn spin the shaft of the generator. As the
generator gets into action, the coils of wire within the generator are spun in a
magnetic field to produce electricity. The nuclear reactions are controlled by
reactors. There has been a technological development in the type of nuclear reactors
which has made the nuclear power stations safer and more efficient.
A Schematic view of a Nuclear Power Plant.
Group 13 PGPME 2014
CEST (PGPM – Energy 2012-2014) Great Lakes Institute of Energy Management & Research Page 33
Potential In India:
India has rich reserves of uranium. Uranium exploration in India led to rich
reserve of the same in ares like Jharkhand, Andhra Pradesh, Rajasthan,
Meghalaya and Karnataka. The total explored reserves amount to around
104000 tonnes.
India was excluded from trade in nuclear plant and material for 34 years till
2009 because India is outside the Nuclear Non-Proliferation Treaty due to its
weapons program It has hampered its development of civil nuclear energy.
Due to the trade bans and lack of indigenous uranium, India has uniquely
been developing a nuclear fuel cycle to exploit its reserves of thorium.
Now the ban has been lifted, foreign technology and fuel are expected to
boost India's nuclear power plans considerably. All plants will have high
indigenous engineering applications.
India can become a world leader in nuclear technology due to its expertise in
fast reactors and thorium fuel cycle.
Economic Reasons in Favour of Nuclear Power Stations:
Although the initial fixed cost for a nuclear power station is much higher than a
coal based power plant, the amount of power generated by single ton of
uranium is much more than that generated by million tonnes of coal. Thus, the
returns are quite significant in this perspective.
The transportation of uranium is cheaper which is an added advantage in
comparison to coal based power plant.
Cost of power generation is much cheaper in case of nuclear setup which
makes up for the lower efficiency of nuclear plants.
For same amount of energy the steam pressure is almost double in nuclear
plants than fossil fuel plants. Therefore for generation of power in higher
range(600Mw to 1000Mw) scales up the economy.
Environmental and social reasons:
One of the foremost environmental advantage of nuclear power plants over
the fossil fuel power plant is that it is not polluting than later.
It does not contribute to global warming as it does not release carbon dioxide
as a byproduct like the conventional fossil fuel plants do.
Moreover coal reserves are being depleted, so we need to construct more
nuclear plants as uranium reserves need to be utilized.
Area required for nuclear power station is much lesser than hydro power plant
and solar plants. Hence in a small space nuclear power plant can be made.
To keep up with our nation‟s growth and demand for electricity, India needs to
take advantage of its nuclear resources.
Group 13 PGPME 2014
CEST (PGPM – Energy 2012-2014) Great Lakes Institute of Energy Management & Research Page 34
Nuclear plants create as many as 400 to 700 jobs at each of its facility. Hence
it can reduce unemployment.
Nuclear energy costs are more sable than other forms of electricity
generation, hence it keeps cost low for consumers which is an issue in India
because certain section of Indian population find it difficult to pay for current
amount electric bill.
Since the ban on nuclear trade on India has been lifted nuclear power plants
must be focussed. India should make the full use of this in developing its
nuclear technology with the help of other nations to boost its civil nuclear
programme.
Although there are dangers associated with nuclear plants like toxic
radioactive wastes which are hazardous but these are managed by current
available technology. Apart from Chernobyl and Fukushima incident there has
not been any serious accident. More casualities and radiations occur in case
of coal based power plants.
Conclusion:
Operation of the nuclear power reactors with overall capacity factor upto to
90% has been demonstrated with highest standards of safety. Latest projects have
been completed in about five years gestation periods. The Indian industry has also
evolved to manufacture all equipment and components to the required exacting
standards. Infrastructure for R&D, Human Resource Development and training and
other needs of the programme is also in place. The construction of nuclear power
plants must be increased in order to make a better use of technology and improvise
on after the removal of trade bans. It is also necessary to construct nuclear plants in
order to preserve other energy resources.
The Group upon analysis would like to conclude that, at present, India should
invest more in Renewable Energy Sector to meet its shortage of power supply and
preferrably to Solar PV and Solar thermal. The technology would help in powering
the base load of the region in which it is installed and peak demand can be met by
Hydro and Thermal power plants. The Nuclear power plants could get the fuelling
from Japan after its recent elections in which the prime minister Shinzo Abe, support
India for Nuclear Developments and would be able to increase the production of
power from present Nuclear Power plants. Due to unavailibility of fossil fuels in India
the thermal power plants will be slowly reduce the power output and fate remains
unclear till the India‟s Shale gas reserves are exploited and the production begins. If
we are able to get some good amount of Shale reserves that can be utilized to fuel
the power plants and fertilizer companies in India. The wind turbine should also be
exploited in India as the potential is huge and we have had very less number of
generation units. Biomass power generation coupled with Solar energy exploitation
could lead the way at present for India‟s power requirement at present.
Group 13 PGPME 2014
CEST (PGPM – Energy 2012-2014) Great Lakes Institute of Energy Management & Research Page 35
References
1. Indian Power Sector – Challenge and Response By: R V Shahi
2. http://www.powermin.nic.in/indian_electricity_scenario/introduction.htm
3. http://www.cea.nic.in/reports/powersystems/nep2012/generation_12.pdf
4. http://planningcommission.nic.in/aboutus/committee/wrkgrp12/wg_pow
er1904.pdf
5. http://indiaenergycongress.in/iec2012/ieb2012/ieb2012.pdf
6. http://www.bp.com/liveassets/bp_internet/globalbp/globalbp_uk_english
/reports_and_publications/statistical_energy_review_2011/STAGING/loc
al_assets/pdf/statistical_review_of_world_energy_full_report_2012.pdf
7. http://www.coal.nic.in/welcome.html
8. http://www.naruc.org/grants/Documents/CoalGenerationTechnologies.p
df
9. http://cdn.intechopen.com/pdfs/26043/InTech-
An_overview_of_financial_aspect_for_thermal_power_plants.pdf
10. www.google.co.in/url?sa=t&rct=j&q=different types coal power plant
technologies&source=web&cd=3&cad=rja&sqi=2&ved=0CEsQFjAC&url=
http://www.naruc.org/grants/Documents/CoalGenerationTechnologies.p
df&ei=5TnQUOmxI8bprAfmwIC4Ag&usg=AFQjCNF4sYk8x9_Vlal3Jj88pH
lDt_P81g&bvm=bv.1355534169,d.bmk
11. http://www.ucsusa.org/assets/documents/clean_energy/EPA-standards-
and-electricity-reliability.pdf
12. www.eai.in/ref/ae/hyd/hyd.html