Embed Size (px)
Citation preview

U.S. Department of Transportation
Federal Railroad Administration
Conventional and CEM Passenger Locomotive Impact Test
Office of Research, Development and Technology Washington, DC 20590
DOT/FRA/ORD-21/02 Final Report January 2021

NOTICE
This document is disseminated under the sponsorship of the Department of Transportation in the interest of information exchange. The United States Government assumes no liability for its contents or use thereof. Any opinions, findings and conclusions, or recommendations expressed in this material do not necessarily reflect the views or policies of the United States Government, nor does mention of trade names, commercial products, or organizations imply endorsement by the United States Government. The United States Government assumes no liability for the content or use of the material contained in this document.
NOTICE
The United States Government does not endorse products or manufacturers. Trade or manufacturers’ names appear herein solely because they are considered essential to the objective of this report.

i
REPORT DOCUMENTATION PAGE Form Approved OMB No. 0704-0188
Public reporting burden for this collection of information is estimated to average 1 hour per response, including the time for reviewing instructions, searching existing data sources, gathering and maintaining the data needed, and completing and reviewing the collection of information. Send comments regarding this burden estimate or any other aspect of this collection of information, including suggestions for reducing this burden, to Washington Headquarters Services, Directorate for Information Operations and Reports, 1215 Jefferson Davis Highway, Suite 1204, Arlington, VA 22202-4302, and to the Office of Management and Budget, Paperwork Reduction Project (0704-0188), Washington, DC 20503. 1. AGENCY USE ONLY (Leave blank)
2. REPORT DATE
January 2021 3. REPORT TYPE AND DATES COVERED
Technical Report, January 2019
4. TITLE AND SUBTITLE
Conventional and CEM Passenger Locomotive Impact Test 5. FUNDING NUMBERS Task Order 0793 DTFR53-11-D-00008L FR17RPD00-TTCI-00-040 6. AUTHOR(S)
Przemyslaw Rakoczy, Travis Gorhum 7. PERFORMING ORGANIZATION NAME(S) AND ADDRESS(ES)
Transportation Technology Center, Inc., a subsidiary of Association of American Railroads 55500 DOT Road Pueblo, CO 81001
8. PERFORMING ORGANIZATION REPORT NUMBER
9. SPONSORING/MONITORING AGENCY NAME(S) AND ADDRESS(ES)
U.S. Department of Transportation Federal Railroad Administration Office of Railroad Policy and Development Office of Research, Development and Technology Washington, DC 20590
10. SPONSORING/MONITORING AGENCY REPORT NUMBER
DOT/FRA/ORD-21/02
11. SUPPLEMENTARY NOTES
COR: Jeff Gordon
12a. DISTRIBUTION/AVAILABILITY STATEMENT
This document is available to the public through the FRA eLibrary. 12b. DISTRIBUTION CODE
13. ABSTRACT
Transportation Technology Center, Inc. conducted an impact test with two F40 locomotives to evaluate the performance of both vehicles under dynamic conditions. One locomotive was retrofitted with crash energy management (CEM) components including a push-back coupler (PBC), deformable anti-climbers, and a sliding lug connected to the draft pocket with a set of shear bolts. The impact test was performed January 23, 2019, at the Transportation Technology Center in Pueblo, Colorado. The stationary locomotive was impacted by the CEM-equipped locomotive at 19.3 mph. The impact-initiated deformation on one set of anti-climbers and activated the PBC. However, the remaining impact energy was insufficient to initiate shearing in the shear bolts. 14. SUBJECT TERMS
Coupling impact test, crash energy management, transportation safety, passenger car safety 15. NUMBER OF PAGES
54 16. PRICE CODE
17. SECURITY CLASSIFICATION OF REPORT Unclassified
18. SECURITY CLASSIFICATION OF THIS PAGE Unclassified
19. SECURITY CLASSIFICATION OF ABSTRACT Unclassified
20. LIMITATION OF ABSTRACT
NSN 7540-01-280-5500 Standard Form 298 (Rev. 2-89) Prescribed by ANSI Std. 239-18
298-102

ii
METRIC/ENGLISH CONVERSION FACTORS ENGLISH TO METRIC METRIC TO ENGLISH
LENGTH (APPROXIMATE) LENGTH (APPROXIMATE) 1 inch (in) = 2.5 centimeters (cm) 1 millimeter (mm) = 0.04 inch (in) 1 foot (ft) = 30 centimeters (cm) 1 centimeter (cm) = 0.4 inch (in)
1 yard (yd) = 0.9 meter (m) 1 meter (m) = 3.3 feet (ft) 1 mile (mi) = 1.6 kilometers (km) 1 meter (m) = 1.1 yards (yd)
1 kilometer (km) = 0.6 mile (mi)
AREA (APPROXIMATE) AREA (APPROXIMATE) 1 square inch (sq in, in2) = 6.5 square centimeters (cm2) 1 square centimeter (cm2) = 0.16 square inch (sq in, in2)
1 square foot (sq ft, ft2) = 0.09 square meter (m2) 1 square meter (m2) = 1.2 square yards (sq yd, yd2) 1 square yard (sq yd, yd2) = 0.8 square meter (m2) 1 square kilometer (km2) = 0.4 square mile (sq mi, mi2) 1 square mile (sq mi, mi2) = 2.6 square kilometers (km2) 10,000 square meters (m2) = 1 hectare (ha) = 2.5 acres
1 acre = 0.4 hectare (he) = 4,000 square meters (m2)
MASS - WEIGHT (APPROXIMATE) MASS - WEIGHT (APPROXIMATE) 1 ounce (oz) = 28 grams (gm) 1 gram (gm) = 0.036 ounce (oz) 1 pound (lb) = 0.45 kilogram (kg) 1 kilogram (kg) = 2.2 pounds (lb)
1 short ton = 2,000 pounds (lb)
= 0.9 tonne (t) 1 tonne (t)
= =
1,000 kilograms (kg) 1.1 short tons
VOLUME (APPROXIMATE) VOLUME (APPROXIMATE) 1 teaspoon (tsp) = 5 milliliters (ml) 1 milliliter (ml) = 0.03 fluid ounce (fl oz)
1 tablespoon (tbsp) = 15 milliliters (ml) 1 liter (l) = 2.1 pints (pt) 1 fluid ounce (fl oz) = 30 milliliters (ml) 1 liter (l) = 1.06 quarts (qt)
1 cup (c) = 0.24 liter (l) 1 liter (l) = 0.26 gallon (gal) 1 pint (pt) = 0.47 liter (l)
1 quart (qt) = 0.96 liter (l) 1 gallon (gal) = 3.8 liters (l)
1 cubic foot (cu ft, ft3) = 0.03 cubic meter (m3) 1 cubic meter (m3) = 36 cubic feet (cu ft, ft3) 1 cubic yard (cu yd, yd3) = 0.76 cubic meter (m3) 1 cubic meter (m3) = 1.3 cubic yards (cu yd, yd3)
TEMPERATURE (EXACT) TEMPERATURE (EXACT)
[(x-32)(5/9)] °F = y °C [(9/5) y + 32] °C = x °F
QUICK INCH - CENTIMETER LENGTH CONVERSION10 2 3 4 5
InchesCentimeters 0 1 3 4 52 6 1110987 1312
QUICK FAHRENHEIT - CELSIUS TEMPERATURE CONVERSIO -40° -22° -4° 14° 32° 50° 68° 86° 104° 122° 140° 158° 176° 194° 212°
°F
°C -40° -30° -20° -10° 0° 10° 20° 30° 40° 50° 60° 70° 80° 90° 100°
For more exact and or other conversion factors, see NIST Miscellaneous Publication 286, Units of Weights and Measures. Price $2.50 SD Catalog No. C13 10286

iii
Contents
1. Introduction ................................................................................................................. 2 1.1 Background ................................................................................................................. 2 1.2 Objectives .................................................................................................................... 2 1.3 Overall Approach ........................................................................................................ 2 1.4 Scope ........................................................................................................................... 4 1.5 Organization of the Report .......................................................................................... 4
2. Test Instrumentation .................................................................................................... 5 2.1 Definition of Coordinate Axes .................................................................................... 5 2.2 Mobile Locomotive Accelerometers ........................................................................... 5 2.3 Mobile Locomotive String Potentiometers ................................................................. 7 2.4 Mobile Locomotive Strain Gages .............................................................................. 11 2.5 Locomotive Speed Sensors ....................................................................................... 14 2.6 Stationary Locomotive Accelerometers .................................................................... 14 2.7 Stationary Locomotive String Potentiometers .......................................................... 16 2.8 Stationary Locomotive Strain Gages ......................................................................... 19 2.9 Real-Time and High-Speed Photography .................................................................. 20 2.10 Data Acquisition ........................................................................................................ 21
3. Results ....................................................................................................................... 22 3.1 Test Details ................................................................................................................ 22 3.2 Measured Data ........................................................................................................... 22 3.3 Post-Test Damage and CEM Activation ................................................................... 31
4. Conclusion ................................................................................................................. 34
5. References ................................................................................................................. 35
Abbreviations and Acronyms ....................................................................................................... 36
Appendix A. Target Positions .................................................................................................... 37
Appendix B. Test Data ............................................................................................................... 38

iv
Illustrations
Figure 1. F40 Locomotive 4117...................................................................................................... 3
Figure 2. F40PH Locomotive 234 .................................................................................................. 3
Figure 3. Accelerometer Locations on Mobile Locomotive ........................................................... 6
Figure 4. Locations of Accelerometers on Mobile Locomotive Truck .......................................... 7
Figure 5. Mobile Locomotive Truck Secondary Suspension String Potentiometers ...................... 8
Figure 6. Mobile Locomotive Coupler Instrumentation ................................................................. 8
Figure 7. Mobile Locomotive Top Anti-climber String Potentiometers ........................................ 9
Figure 8. Mobile Locomotive Underframe String Potentiometers ................................................. 9
Figure 9. Right Side Mobile Locomotive String Potentiometers ................................................. 10
Figure 10. Mobile Locomotive Coupler String Potentiometers.................................................... 10
Figure 11. Strain Gage Locations on Mobile Locomotive Coupler Shank ................................... 12
Figure 12. Strain Gage Locations on Mobile Locomotive Sliding Lug ....................................... 12
Figure 13. Strain Gage Locations on Mobile Locomotive Draft Pocket ...................................... 13
Figure 14. Strain Gage Locations on Mobile Locomotive Draft Pocket and Center Sill ............. 13
Figure 15. Strain Gage Locations on Cross-Plate and Draft Gear Pocket Back Plate .................. 14
Figure 16. Accelerometer Locations on Stationary Locomotive .................................................. 16
Figure 17. Accelerometers on Stationary Locomotive Truck ....................................................... 17
Figure 18. String Potentiometers on Stationary Locomotive Truck ............................................. 17
Figure 19. Stationary Locomotive Coupler Instrumentation ........................................................ 18
Figure 20. Stationary Locomotive Underframe String Potentiometer Left .................................. 18
Figure 21. Stationary Locomotive Underframe String Potentiometer Right ................................ 19
Figure 22. Strain Gage Locations on Stationary Locomotive Coupler ......................................... 20
Figure 23. Strain Gage Locations on Stationary Locomotive Center Sill and Draft Pocket ........ 20
Figure 24. High-Speed Camera Locations .................................................................................... 21
Figure 25. High Definition Camera Locations ............................................................................. 21
Figure 26. Longitudinal Average Acceleration ............................................................................ 23
Figure 27. Coupler Displacements ................................................................................................ 24
Figure 28. Anti-climber Displacements ........................................................................................ 24
Figure 29. Mobile Locomotive Coupler Shank Strain Results ..................................................... 25
Figure 30. Mobile Locomotive Sliding Lug Strain Results .......................................................... 26
Figure 31. Mobile Locomotive Draft Pocket Strain Results ......................................................... 26

v
Figure 32. Mobile Locomotive Top of Draft Pocket Strain Results ............................................. 27
Figure 33. Mobile Locomotive Center Sill Strain Results ............................................................ 27
Figure 34. Mobile Locomotive Back of Draft Pocket and Crossplate Strain Results .................. 28
Figure 35. Stationary Locomotive Coupler Shank Strain Results ................................................ 28
Figure 36. Stationary Locomotive Draft Sill Strain Results ......................................................... 29
Figure 37. Stationary Locomotive Back of Draft Pocket and Crossplate Strain Results ............. 29
Figure 38. Impact Force ................................................................................................................ 30
Figure 39. Energy Balance ............................................................................................................ 31
Figure 40. Crushed Anti-climber .................................................................................................. 32
Figure 41. Activated Push-Back Coupler ..................................................................................... 32
Figure 42. Sliding Lug Bolted into Draft Pocket after Test .......................................................... 33
Figure 43. Intact Shear Bolt After Test ......................................................................................... 33

vi
Tables
Table 1. Instrumentation Summary ................................................................................................. 5
Table 2. Mobile Locomotive Accelerometers Summary ................................................................ 6
Table 3. Mobile Locomotive String Potentiometers Summary ...................................................... 7
Table 4. F40 Locomotive Strain Gage Summary ......................................................................... 11
Table 5. Stationary Locomotive Accelerometers .......................................................................... 15
Table 6. Stationary Locomotive Instrumentation – String Potentiometers ................................... 16
Table 7. Stationary Locomotive Instrumentation – Strain Gages ................................................. 19
Table 8. Summary of Ambient Conditions ................................................................................... 22
Table 9. Summary of Test Results ................................................................................................ 22

1
Executive Summary
In January 2019, Transportation Technology Center, Inc. conducted an impact test between a conventional EMD F40 passenger locomotive and a locomotive equipped with CEM components to evaluate the performance of these components under dynamic conditions. The retrofitted CEM locomotive was equipped with a push-back coupler (PBC), deformable anti-climbers, and shear bolts. This test was performed on January 23, 2019, at the Transportation Technology Center in Pueblo, Colorado. The locomotives impacted at 19.3 mph. The locomotive couplers were open at impact, with the intention that they would couple. However, the locomotives did not couple during the test. The locomotives sustained no noticeable structural damage during the test other than the expected deformation of the CEM components. The impact caused the crushing of one set of anti-climbers and the activation of the PBC. However, after these components activated, the remaining energy was not sufficient to initiate shearing in the sliding lug bolts. Future work will include a second test using the same retrofitted CEM locomotive and an M1 cab car. For this test, the impact speed will be increased to ensure activation of all of the CEM elements. The final test in this program will be a full-scale train-to-train test to evaluate the performance of the retrofit CEM components in a high-energy collision scenario.

2
1. Introduction
In January 2019, Transportation Technology Center, Inc. (TTCI) conducted an impact test between a conventional passenger locomotive and a passenger locomotive equipped with crash energy management (CEM) components. This test characterized the combined performance of all the CEM components that had been installed. This research program integrated three CEM components onto a locomotive to demonstrate that they work together to mitigate the effects of a collision and prevent override. The CEM system includes a deformable anti-climber (DAC), a push-back coupler (PBC), and a sliding lug connected to the draft pocket with a set of shear bolts.
1.1 Background The Office of Research, Development and Technology of the Federal Railroad Administration (FRA) and the Volpe National Transportation Systems Center (Volpe) continue to evaluate new technologies for increasing the safety of passengers and operators in rail equipment. In recognition of the importance of override prevention in train-to-train collisions in which one of the vehicles is a locomotive, FRA seeks to evaluate the effectiveness of components integrated into the end structure of a locomotive specifically designed to mitigate the effects of a collision and to prevent override of one onto the other.
1.2 Objectives This test was intended to demonstrate the combined functionality of the PBC and the DAC as the CEM system. Volpe and TTCI designed the test to characterize the structural performance of the CEM components and impacted locomotive at a speed sufficient to activate all the CEM system components.
1.3 Overall Approach
1.3.1 Stationary Locomotive The F40PH-2CAT locomotive is a four-axle diesel-electric locomotive intended for use in passenger service. This test used F40PH-2CAT Locomotive 4117 as the stationary vehicle (Figure 1). The weight of this locomotive was measured to be 257,325 lbs.
3
Figure 1. F40 Locomotive 4117
1.3.2 Mobile Locomotive The F40PH locomotive is a four-axle diesel-electric locomotive intended for use in passenger service. This test used F40 Locomotive 234 as the impacting vehicle (Figure 2). The weight of this locomotive was measured to be 232,000 lbs. This locomotive was retrofitted with the CEM system.
Figure 2. F40PH Locomotive 234
4
1.3.3 Test Setup The impact test was performed on January 23, 2019, at the Transportation Technology Center (TTC) in Pueblo, Colorado. The testing was performed by positioning the mobile locomotive uphill from the stationary locomotive and allowing the mobile locomotive to roll into the stationary locomotive. The release position of the mobile locomotive was determined through speed trials and adjusted shortly before the release to achieve the desired impact speed. The couplers of both locomotives were opened and aligned to allow coupling to occur upon impact. The stationary locomotive’s air brakes were applied, and the hand brake was secured before the impact. A string of loaded hopper cars was placed approximately 200 feet behind the stationary locomotive to arrest any remaining momentum if the brakes were not sufficient. Before the test, speed trials were conducted using the mobile locomotive to determine the optimum release location for the desired impact speed. Data from the speed runs were used in calculations, accounting for wind speed and direction, in order to determine a more precise release location for the desired target speed.
1.4 Scope This report presents the test results, discusses the execution of the test, and summarizes the overall results of the test.
1.5 Organization of the Report • Section 1 of this report includes the introduction, a description of the objectives and
scope of the report, as well as a description of the organization of the report. • Section 2 describes the test instrumentation and data collection system used in testing. • Section 3 describes the results of the test. These results include the test details, the data
measured, and a discussion of the post-test damage. • Section 4 contains the concluding remarks. • Section 5 contains a list of the references made in this report. • Appendix A describes the target positions. • Appendix B contains the test data.

5
2. Test Instrumentation
The test configuration and instrumentation were all consistent with the specifications in the test implementation plan. Table 1 lists all instrumentation used for this testing. Additional descriptions of instrumentation are provided in the following subsections.
Table 1. Instrumentation Summary
2.1 Definition of Coordinate Axes All local acceleration and displacement coordinate systems were defined relative to the front (lead) end of each locomotive. Positive X, Y, and Z directions are forward, left, and up, relative to the lead end of each locomotive.
2.2 Mobile Locomotive Accelerometers Tri‐axial accelerometers were placed at the center and at the two ends along the carbody center line. The locomotive had longitudinal and vertical accelerometers placed on the left and right sides of its underframe at its center. Each truck was equipped with a vertical accelerometer and two longitudinal accelerometers, right and left. The locomotive’s push‐back coupler was fitted with three longitudinal accelerometers, one on each side of the coupler and one on the bottom of the sliding lug. The typical scale factor calibration error for the accelerometers used is 2 percent. Table 2 summarizes all accelerometers on Locomotive 234. Figure 3 shows the locations of the accelerometers on the locomotive.

6
Table 2. Mobile Locomotive Accelerometers Summary
Figure 3. Accelerometer Locations on Mobile Locomotive
7
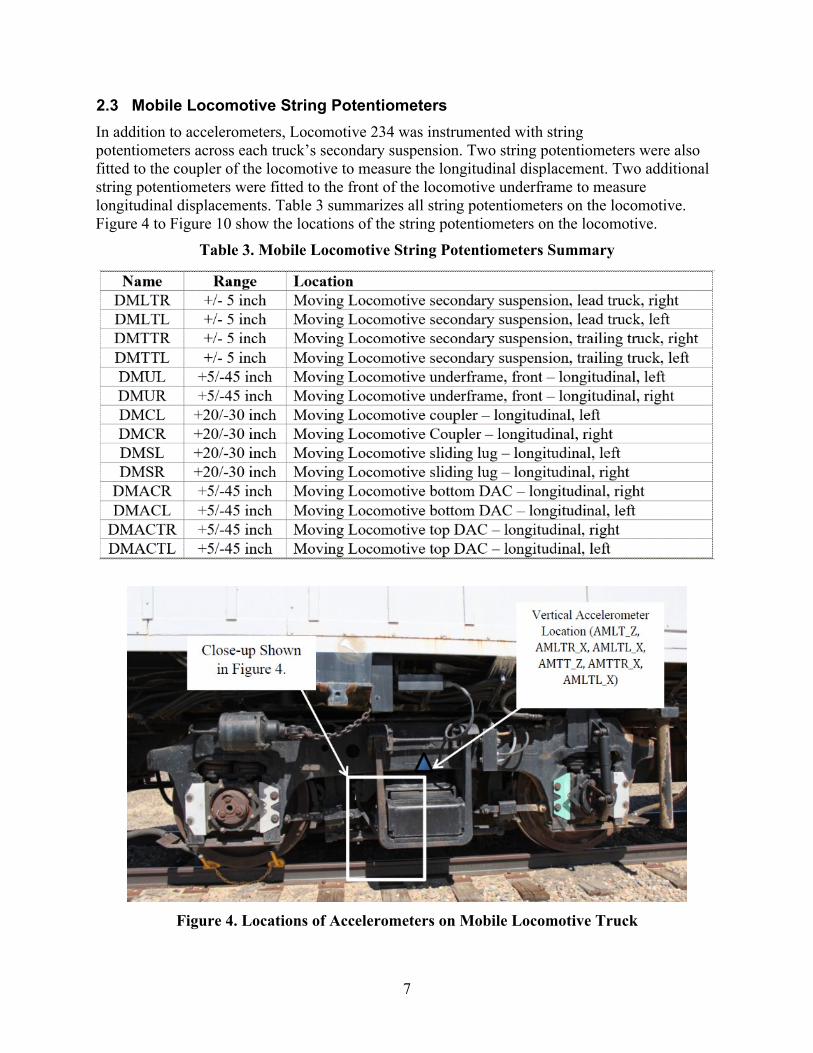
2.3 Mobile Locomotive String Potentiometers In addition to accelerometers, Locomotive 234 was instrumented with string potentiometers across each truck’s secondary suspension. Two string potentiometers were also fitted to the coupler of the locomotive to measure the longitudinal displacement. Two additional string potentiometers were fitted to the front of the locomotive underframe to measure longitudinal displacements. Table 3 summarizes all string potentiometers on the locomotive. Figure 4 to Figure 10 show the locations of the string potentiometers on the locomotive.
Table 3. Mobile Locomotive String Potentiometers Summary
Figure 4. Locations of Accelerometers on Mobile Locomotive Truck

8
Figure 5. Mobile Locomotive Truck Secondary Suspension String Potentiometers
Figure 6. Mobile Locomotive Coupler Instrumentation

9
Figure 7. Mobile Locomotive Top Anti-climber String Potentiometers
Figure 8. Mobile Locomotive Underframe String Potentiometers

10
Figure 9. Right Side Mobile Locomotive String Potentiometers
Figure 10. Mobile Locomotive Coupler String Potentiometers

11
2.4 Mobile Locomotive Strain Gages Locomotive 234 was instrumented with 33 strain gages on the sliding lug, draft gear pocket, coupler, and center sill as shown in Table 4 and Figures 11 through 15.
Table 4. F40 Locomotive Strain Gage Summary

12
Figure 11. Strain Gage Locations on Mobile Locomotive Coupler Shank
Figure 12. Strain Gage Locations on Mobile Locomotive Sliding Lug
13
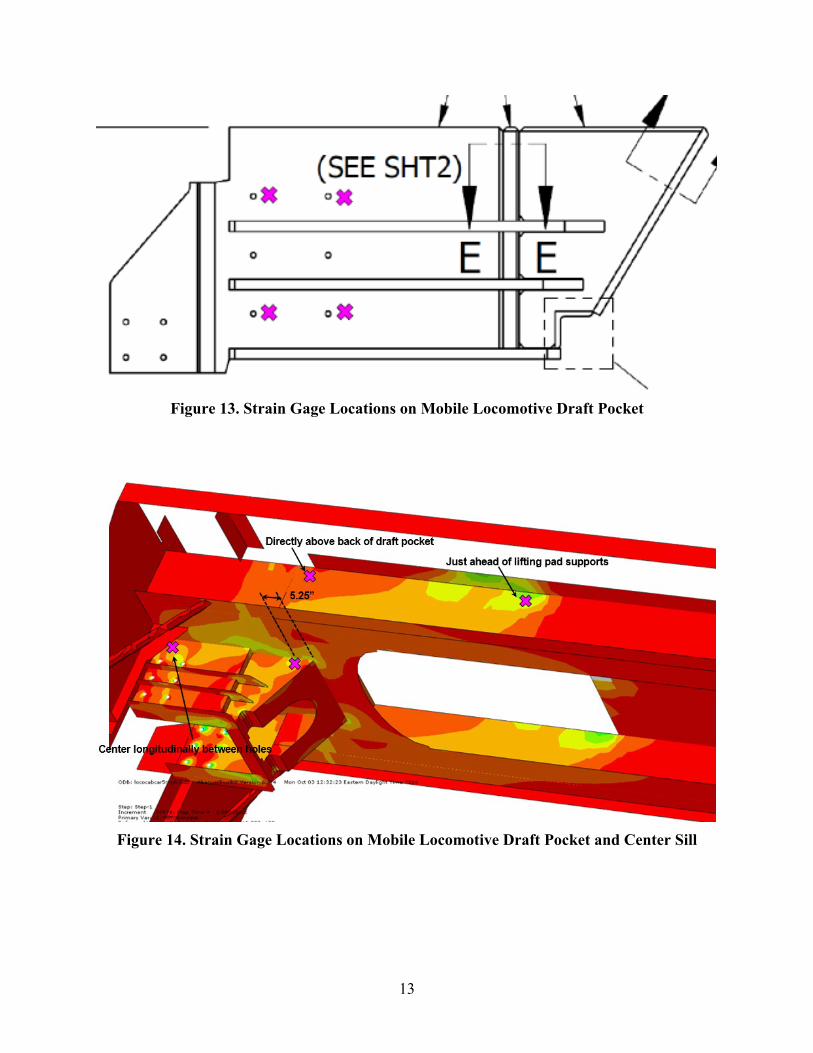
Figure 13. Strain Gage Locations on Mobile Locomotive Draft Pocket
Figure 14. Strain Gage Locations on Mobile Locomotive Draft Pocket and Center Sill

14
Figure 15. Strain Gage Locations on Cross-Plate and Draft Gear Pocket Back Plate
2.5 Locomotive Speed Sensors Multiple speed sensors accurately measured the impact speed of the mobile F40 locomotive when it was within 20 inches of the impact point. The speed trap is a reflector-based sensor. It uses ground-based reflectors separated by a known distance and a vehicle-based light sensor that triggers as the locomotive passes over the reflectors. The last reflector is within 10 inches of the impact point. The time interval between reflector passing was recorded, and speed was calculated from reflector spacing (distance) and time. Backup speed measurements were made with a handheld radar gun.
2.6 Stationary Locomotive Accelerometers Tri‐axial accelerometers were placed at the two ends and the center along the locomotive centerline. The locomotive had longitudinal and vertical accelerometers placed on the left and right sides of its underframe at its center. Each locomotive truck was equipped with a vertical accelerometer and two longitudinal accelerometers (right and left). The typical scale factor calibration error for the used accelerometers is 2 percent. Table 5 summarizes all accelerometers on Locomotive 4117. Figure 16 shows locations of the accelerometers.

15
Table 5. Stationary Locomotive Accelerometers
16
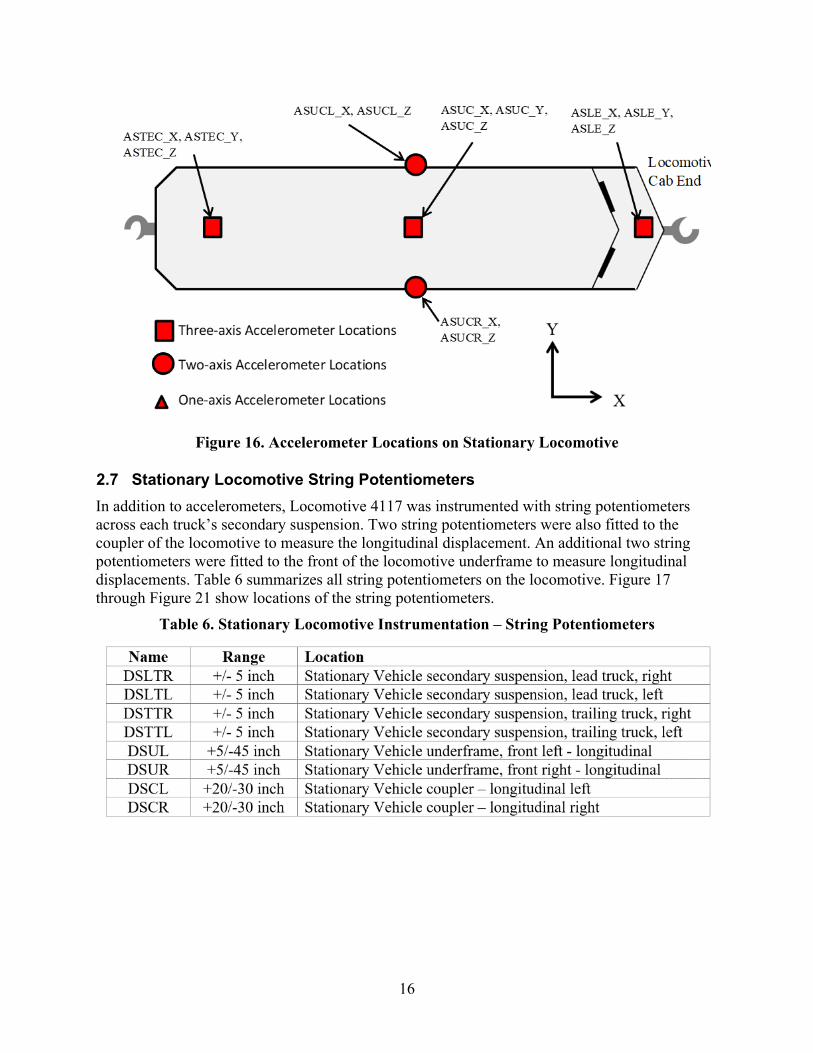
Figure 16. Accelerometer Locations on Stationary Locomotive
2.7 Stationary Locomotive String Potentiometers In addition to accelerometers, Locomotive 4117 was instrumented with string potentiometers across each truck’s secondary suspension. Two string potentiometers were also fitted to the coupler of the locomotive to measure the longitudinal displacement. An additional two string potentiometers were fitted to the front of the locomotive underframe to measure longitudinal displacements. Table 6 summarizes all string potentiometers on the locomotive. Figure 17 through Figure 21 show locations of the string potentiometers.
Table 6. Stationary Locomotive Instrumentation – String Potentiometers

17
Figure 17. Accelerometers on Stationary Locomotive Truck
Figure 18. String Potentiometers on Stationary Locomotive Truck

18
Figure 19. Stationary Locomotive Coupler Instrumentation
Figure 20. Stationary Locomotive Underframe String Potentiometer Left
19
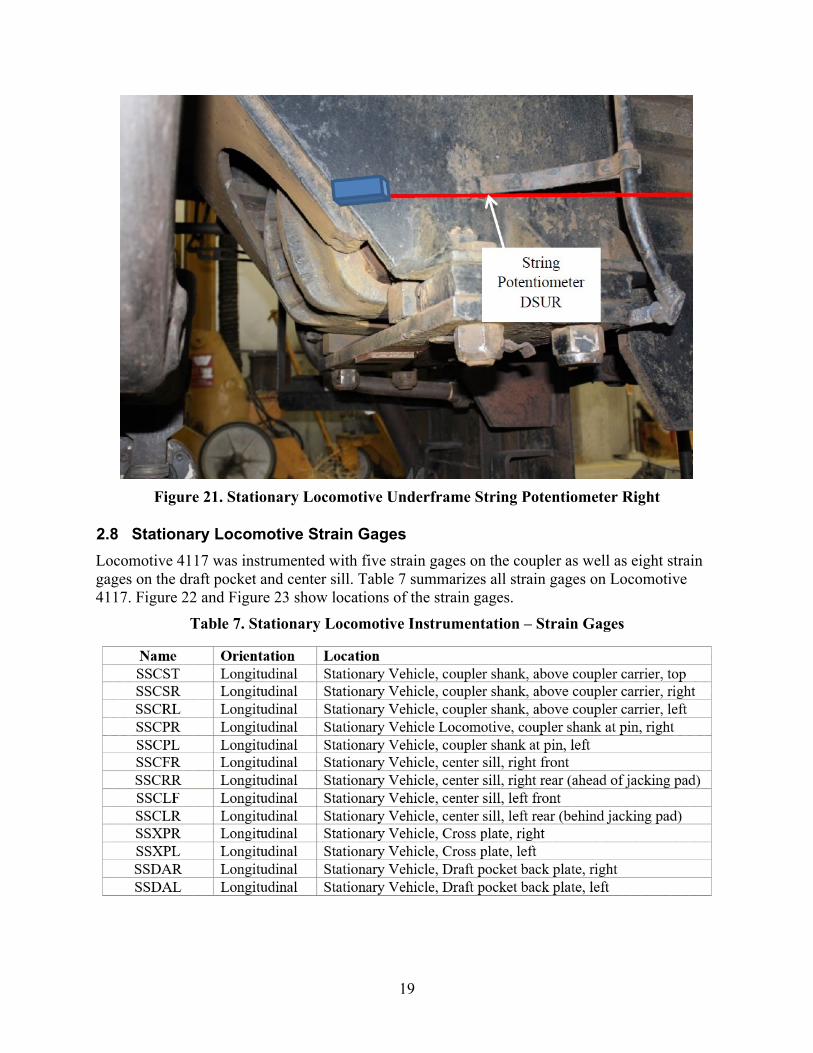
Figure 21. Stationary Locomotive Underframe String Potentiometer Right
2.8 Stationary Locomotive Strain Gages Locomotive 4117 was instrumented with five strain gages on the coupler as well as eight strain gages on the draft pocket and center sill. Table 7 summarizes all strain gages on Locomotive 4117. Figure 22 and Figure 23 show locations of the strain gages.
Table 7. Stationary Locomotive Instrumentation – Strain Gages

20
Figure 22. Strain Gage Locations on Stationary Locomotive Coupler
Figure 23. Strain Gage Locations on Stationary Locomotive Center Sill and Draft Pocket
2.9 Real-Time and High-Speed Photography Six high-speed and five real-time, high-definition video cameras documented the impact event. Figures 24 and 25 show schematics of the setup positions of the high-speed and high-definition cameras. All high-speed cameras are crashworthy and rated for peak accelerations of 100 g. Final alignment and sighting of the cameras was done when the locomotives were positioned at the impact point prior to the start of the test. Two flashes were installed on both locomotives, and they were triggered at the same time as the data acquisition systems. Flashes were visible from the high-speed cameras and were used to confirm the time of trigger and to evaluate any trigger time discrepancies between both vehicles.

21
Figure 24. High-Speed Camera Locations
Figure 25. High Definition Camera Locations
2.10 Data Acquisition A set of eight-channel, battery-powered, onboard data acquisition systems recorded data from instrumentation mounted on both the locomotives. These systems provided excitation to the instrumentation as well as analog anti-aliasing filtering of the signals, analog-to-digital conversion, and recording of each data stream. The data acquisition systems were GMH Engineering DataBRICK3 units. Data acquisition was in compliance with the appropriate sections of SAE J211 [1]. Data from each channel were anti-alias filtered at 1,735 Hz, and then sampled and recorded at 12,800 Hz. Data recorded on the DataBRICK3s were synchronized to time zero at initial impact. The time reference came from closure of the tape switches on the front of the test vehicle. Each DataBRICK3 was ruggedized for shock loading up to at least 100 g. Onboard battery power was provided by GMH Engineering, comprised of 1.7-amp-hour, 14.4-volt NiCad packs. Tapeswitch, model 1201-131-A tape switches, provided event initial contact time. Software in the DataBRICK3s was used to determine zero levels and calibration factors rather than relying on set gains and expecting no zero drift. The DataBRICK3s were set to record 1 second of data before initial impact and 7 seconds of data after initial impact.
22
3. Results
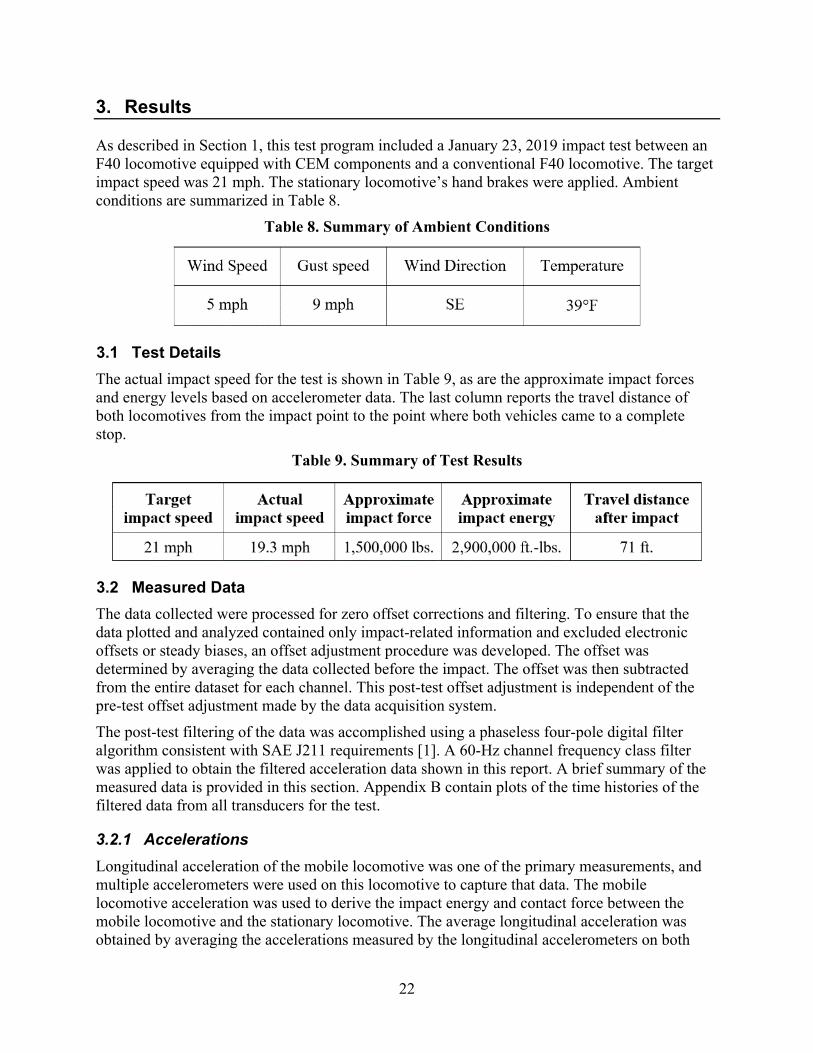
As described in Section 1, this test program included a January 23, 2019 impact test between an F40 locomotive equipped with CEM components and a conventional F40 locomotive. The target impact speed was 21 mph. The stationary locomotive’s hand brakes were applied. Ambient conditions are summarized in Table 8.
Table 8. Summary of Ambient Conditions
3.1 Test Details The actual impact speed for the test is shown in Table 9, as are the approximate impact forces and energy levels based on accelerometer data. The last column reports the travel distance of both locomotives from the impact point to the point where both vehicles came to a complete stop.
Table 9. Summary of Test Results
3.2 Measured Data The data collected were processed for zero offset corrections and filtering. To ensure that the data plotted and analyzed contained only impact-related information and excluded electronic offsets or steady biases, an offset adjustment procedure was developed. The offset was determined by averaging the data collected before the impact. The offset was then subtracted from the entire dataset for each channel. This post-test offset adjustment is independent of the pre-test offset adjustment made by the data acquisition system. The post-test filtering of the data was accomplished using a phaseless four-pole digital filter algorithm consistent with SAE J211 requirements [1]. A 60-Hz channel frequency class filter was applied to obtain the filtered acceleration data shown in this report. A brief summary of the measured data is provided in this section. Appendix B contain plots of the time histories of the filtered data from all transducers for the test.
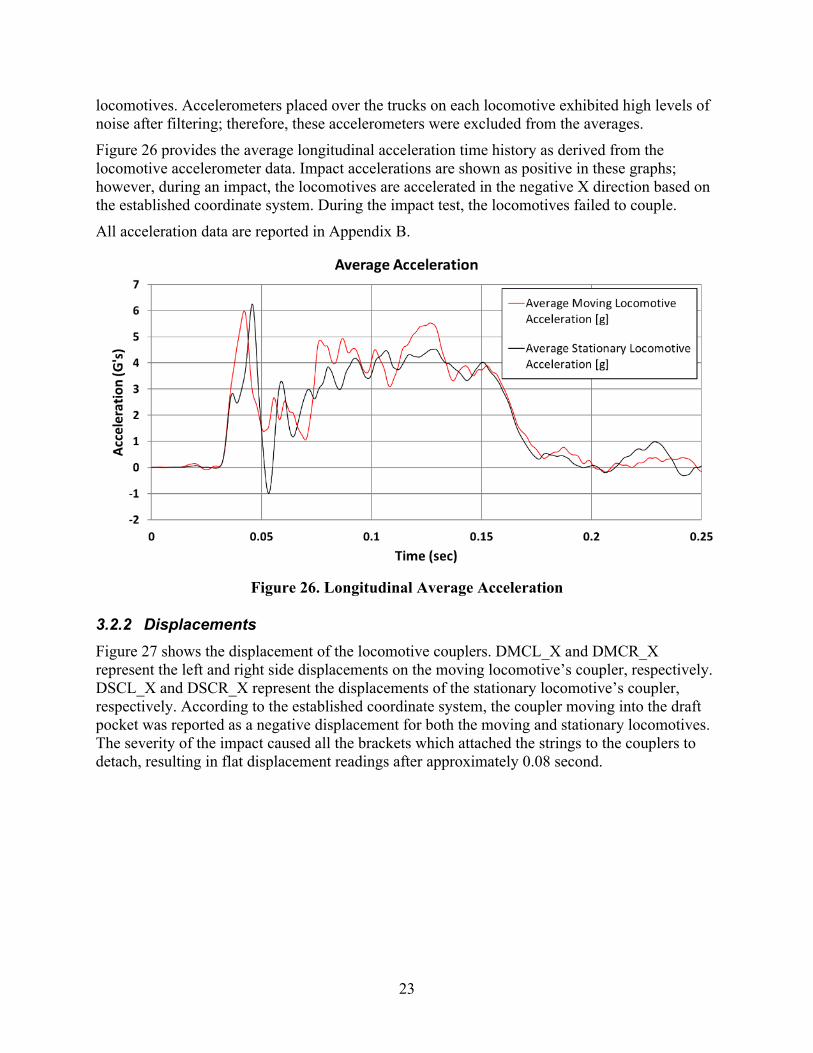
3.2.1 Accelerations Longitudinal acceleration of the mobile locomotive was one of the primary measurements, and multiple accelerometers were used on this locomotive to capture that data. The mobile locomotive acceleration was used to derive the impact energy and contact force between the mobile locomotive and the stationary locomotive. The average longitudinal acceleration was obtained by averaging the accelerations measured by the longitudinal accelerometers on both
23
locomotives. Accelerometers placed over the trucks on each locomotive exhibited high levels of noise after filtering; therefore, these accelerometers were excluded from the averages. Figure 26 provides the average longitudinal acceleration time history as derived from the locomotive accelerometer data. Impact accelerations are shown as positive in these graphs; however, during an impact, the locomotives are accelerated in the negative X direction based on the established coordinate system. During the impact test, the locomotives failed to couple. All acceleration data are reported in Appendix B.
Figure 26. Longitudinal Average Acceleration
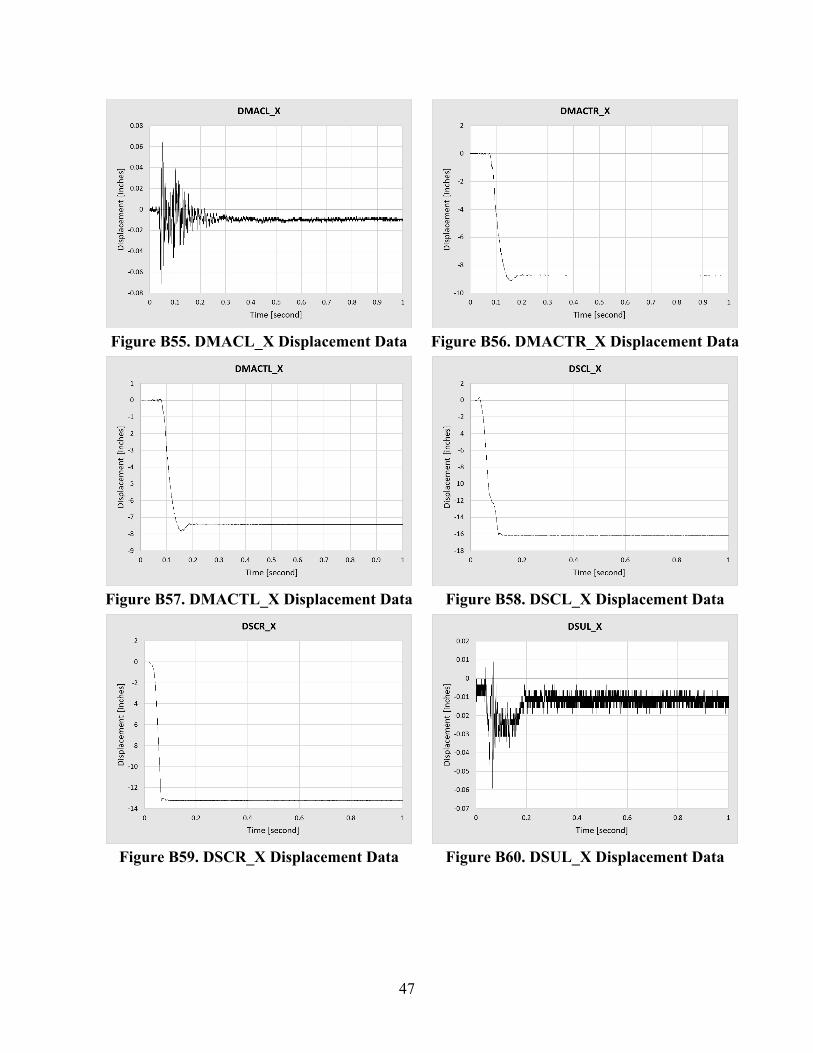
3.2.2 Displacements Figure 27 shows the displacement of the locomotive couplers. DMCL_X and DMCR_X represent the left and right side displacements on the moving locomotive’s coupler, respectively. DSCL_X and DSCR_X represent the displacements of the stationary locomotive’s coupler, respectively. According to the established coordinate system, the coupler moving into the draft pocket was reported as a negative displacement for both the moving and stationary locomotives. The severity of the impact caused all the brackets which attached the strings to the couplers to detach, resulting in flat displacement readings after approximately 0.08 second.

24
Figure 27. Coupler Displacements
Figure 28 shows measured displacements of all anti-climbers. The top anti-climber was engaged at the impact and deformed. The measured displacements (DMACTR and DMACTL) include bending of the front plate and crush displacements of the tubes. The deformation on both sides was fairly symmetrical with slightly over 1 inch of difference. Two bottom anti-climbers were not engaged; thus, their displacements are zero.
Figure 28. Anti-climber Displacements

25
The sliding lug bolts were not sheared; therefore, there was no displacement. Measured displacements of the sliding lug by one of the channels (DMSR) was due to impact by the coupler carrier that was detached early in the impact. All measured displacements have been plotted and included in Appendix B.
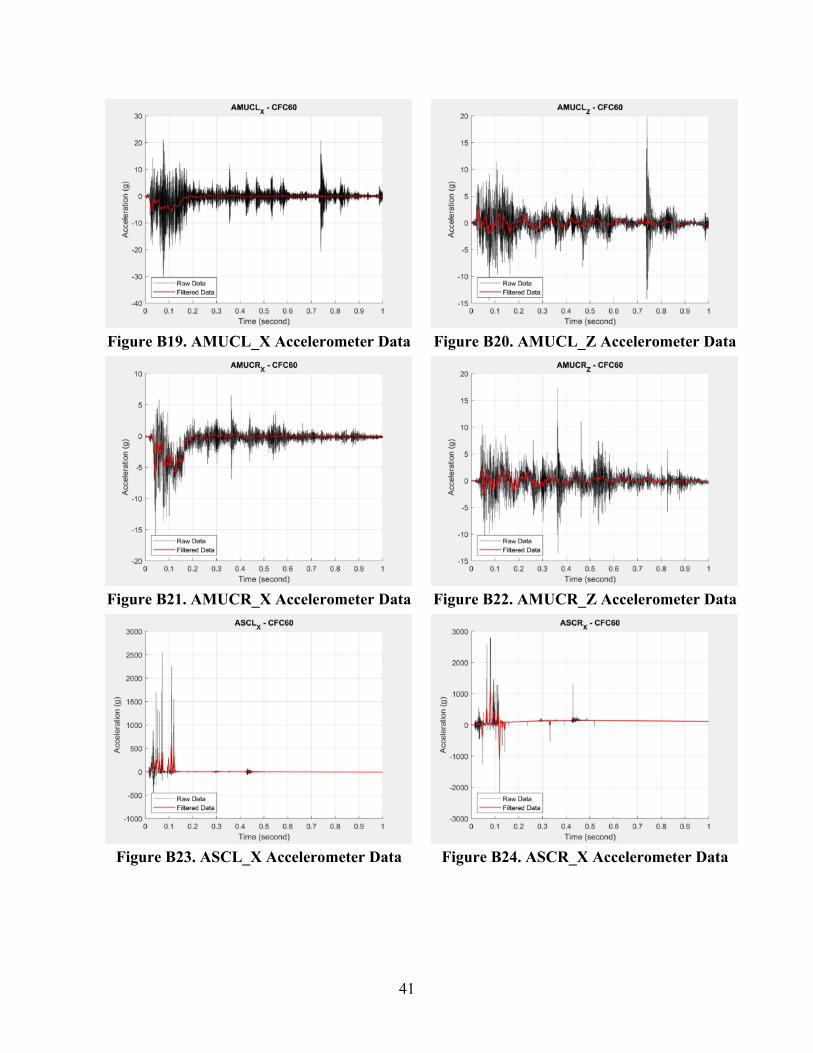
3.2.3 Strains The moving locomotive was equipped with 33 strain gages, and another 13 strain gages were on the stationary locomotive. Strain gage data from both the moving and stationary locomotives are grouped according to their positions in the vehicles. Figures 29 to 37 show the strain gage data for both locomotives. During the impact, the cables connected to several strain gages were hit by debris or severed, resulting in a loss of useful data after approximately 70 milliseconds. This effect was particularly noticeable on the moving locomotive’s coupler and sliding lug strain gages, but other strain gages showed good agreement. Plots below show data from the first 250 milliseconds of impact, which covers the duration of the initial impact.
Figure 29. Mobile Locomotive Coupler Shank Strain Results

26
Figure 30. Mobile Locomotive Sliding Lug Strain Results
Figure 31. Mobile Locomotive Draft Pocket Strain Results

27
Figure 32. Mobile Locomotive Top of Draft Pocket Strain Results
Figure 33. Mobile Locomotive Center Sill Strain Results

28
Figure 34. Mobile Locomotive Back of Draft Pocket and Crossplate Strain Results
Figure 35. Stationary Locomotive Coupler Shank Strain Results

29
Figure 36. Stationary Locomotive Draft Sill Strain Results
Figure 37. Stationary Locomotive Back of Draft Pocket and Crossplate Strain Results

30
3.2.4 Forces Impact forces between the locomotives can be calculated as a product of the average acceleration and mass of the corresponding vehicle. Figure 38 shows the time history of the locomotive impact forces.
Figure 38. Impact Force
The force was calculated by multiplying vehicle weight and average carbody acceleration. The average acceleration was calculated as described in Section 3.2.1 and was taken from longitudinal accelerometers mounted on the underframe of each vehicle. The peak impact force was approximately 1,500,000 lbf for both the mobile and stationary locomotives.
3.2.5 Energies Energy balance is the summary of the energy evolution during the impact. The total energy at the beginning of the impact is equal to the kinetic energy of the moving locomotive. After the first impact, both locomotives moved forward on the track until they stopped. The dissipated energy accounted for CEM component deformation, braking, and other energy losses. Because the energies should balance, the dissipated energy was obtained by subtracting the kinetic energies from the total energy. Figure 39 shows the energy balance for the initial impact.

31
Figure 39. Energy Balance
3.3 Post-Test Damage and CEM Activation After the impact, no structural damage was observed to have occurred on either the stationary or moving locomotives. During the impact, the PBC was activated and nearly exhausted its available stroke. In addition, the upper deformable anti-climber was engaged by the nose of the stationary locomotive. This anti-climber and its crush tubes were deformed under the impact force. The lower set of anti-climbers did not come into contact with the stationary locomotive and were intact after the test. The impact was not sufficient to activate the shear bolts, which were found to be intact after they were removed from the sliding lug. The CEM components after the test are shown in Figures 40 through 43.

32
Figure 40. Crushed Anti-climber
Figure 41. Activated Push-Back Coupler

33
Figure 42. Sliding Lug Bolted into Draft Pocket after Test
Figure 43. Intact Shear Bolt After Test

34
4. Conclusion
This report documents the impact test conducted by TTCI between a passenger locomotive and a locomotive retrofitted with the CEM components. This testing was intended to evaluate the combined performance of the CEM components, including the push-back coupler, the deformable anti-climbers, and the shear bolts and sliding lug. This impact test was conducted on January 23, 2019, at TTC near Pueblo, Colorado. The stationary locomotive was impacted by the 232,200-lb locomotive at 19.3 mph. The locomotives did not couple during the impact. The front of the stationary locomotive came into contact with the top set of deformable anti-climbers during the impact, causing them to partially crush. The lower set of deformable anti-climbers did not engage the stationary locomotive and did not experience any deformation. The push-back coupler was activated and nearly exhausted its available stroke. However, the remaining impact energy was not sufficient to shear the sliding lug bolts, which emerged completely intact. The total impact energy was close to 4 million ft.-lbs. The engaged CEM components absorbed over half of the energy in first 150 milliseconds. The test confirmed that the PBC and the anti-climbers were activated, prevented overclimbing, and absorbed the impact energy as intended. However, because of the lower than intended impact speed, the energy was not sufficient to shear the sliding lug bolts, assess the force level of the bolts, and observe the sliding-action of the lug. Data collected in this test will be used to validate the computer model and to prepare for the next impact test with a different type of vehicle.

35
5. References
1. SAE International. (2007). SAE J211/1 Standard. 1995. Instrumentation for Impact Test – Part 1: Electronic Instrumentation. Warrendale, PA: SAE International. www.sae.org

36
Abbreviations and Acronyms
CEM Crash Energy Management
FRA Federal Railroad Administration
PBC Push-Back Coupler
TTC Transportation Technology Center (the site)
TTCI Transportation Technology Center, Inc. (the company)
Volpe Volpe National Transportation Systems Center

37
Appendix A. Target Positions
Figure A1. Target Spacing for CEM Locomotive
Figure A2. Target Spacing for Locomotive 4117

38
Appendix B. Test Data
Figure B1. AMCL_X Accelerometer Data
Figure B2. AMCR_X Accelerometer Data
Figure B3. AMLE_X Accelerometer Data
Figure B4. AMLE_Y Accelerometer Data
Figure B5. AMLE_Z Accelerometer Data
Figure B6. AMLTL_X Accelerometer Data

39
Figure B7. AMLTL_Z Accelerometer Data
Figure B8. AMLTR_X Accelerometer Data
Figure B9. AMS_X Accelerometer Data
Figure B10. AMTEC_X Accelerometer Data
Figure B11. AMTEC_Y Accelerometer Data
Figure B12. AMTEC_Z Accelerometer Data

40
Figure B13. AMTTL_X Accelerometer Data
Figure B14. AMTTL_Z Accelerometer Data
Figure B15. AMTTR_X Accelerometer Data
Figure B16. AMUC_X Accelerometer Data
Figure B17. AMUC_Y Accelerometer Data
Figure B18. AMUC_Z Accelerometer Data
41
Figure B19. AMUCL_X Accelerometer Data
Figure B20. AMUCL_Z Accelerometer Data
Figure B21. AMUCR_X Accelerometer Data
Figure B22. AMUCR_Z Accelerometer Data
Figure B23. ASCL_X Accelerometer Data
Figure B24. ASCR_X Accelerometer Data

42
Figure B25. ASLE_X Accelerometer Data
Figure B26. ASLE_Y Accelerometer Data
Figure B27. ASLE_Z Accelerometer Data
Figure B28. ASLTL_X Accelerometer Data
Figure B29. ASLTL_Z Accelerometer Data
Figure B30. ASLTR_X Accelerometer Data

43
Figure B31. ASTEC_X Accelerometer Data
Figure B32. ASTEC_Y Accelerometer Data
Figure B33. ASTEC_Z Accelerometer Data
Figure B34. ASTTL_X Accelerometer Data
Figure B35. ASTTL_Z Accelerometer Data
Figure B36. ASTTR_X Accelerometer Data

44
Figure B37. ASUC_X Accelerometer Data
Figure B38. ASUC_Y Accelerometer Data
Figure B39. ASUC_Z Accelerometer Data
Figure B40. ASUCL_X Accelerometer Data
Figure B41. AMUCL_Z Accelerometer Data
Figure B42. ASUCR_X Accelerometer Data

45
Figure B43. ASUCR_Z Accelerometer Data
Figure B44. DMCL_X Displacement Data
Figure B45. DMCR_X Displacement Data
Figure B46. DMSL_X Displacement Data
Figure B47. DMSR_X Displacement Data
Figure B48. DMUL_X Displacement Data

46
Figure B49. DMUR_X Displacement Data
Figure B50. DMLTR_Z Displacement Data
Figure B51. DMLTL_Z Displacement Data
Figure B52. DMTTR_Z Displacement Data
Figure B53. DMTTL_Z Displacement Data
Figure B54. DMACR_X Displacement Data
47
Figure B55. DMACL_X Displacement Data
Figure B56. DMACTR_X Displacement Data
Figure B57. DMACTL_X Displacement Data
Figure B58. DSCL_X Displacement Data
Figure B59. DSCR_X Displacement Data
Figure B60. DSUL_X Displacement Data

48
Figure B61. DSUR_X Displacement Data
Figure B62. DSLTR_Z Displacement Data
Figure B63. DSLTL_Z Displacement Data
Figure B64. DSTTR_Z Displacement Data
Figure B65. DSLTL_Z Displacement Data