Embed Size (px)
Citation preview
Convective Modes for Significant Severe Thunderstorms in the Contiguous United States.Part III: Tropical Cyclone Tornadoes
ROGER EDWARDS, ANDREW R. DEAN, RICHARD L. THOMPSON, AND BRYAN T. SMITH
NWS Storm Prediction Center, Norman, Oklahoma
(Manuscript received 23 September 2011, in final form 20 June 2012)
ABSTRACT
A gridded, hourly, three-dimensional environmental mesoanalysis database at the Storm Prediction Center
(SPC), based on objectively analyzed surface observations blended with the Rapid Update Cycle (RUC)
model-analysis fields and described in Parts I and II of this series, is applied to a 2003–11 subset of the SPC
tropical cyclone (TC) tornado records. Distributions of environmental convective parameters, derived from
SPC hourly mesoanalysis fields that have been related to supercells and tornadoes in the midlatitudes, are
evaluated for their pertinence to TC tornado occurrence. The main factor differentiating TC from non-TC
tornado environments is much greater deep-troposphericmoisture, associatedwith reduced lapse rates, lower
CAPE, and smaller andmore compressed distributions of parameters derived fromCAPE and vertical shear.
For weak and strong TC tornado categories (EF0–EF1 and EF2–EF3 on the enhanced Fujita scale, re-
spectively), little distinction is evident across most parameters. Radar reflectivity and velocity data also are
examined for the same subset of TC tornadoes, in order to determine parent convective modes (e.g., dis-
crete, linear, clustered, supercellular vs nonsupercellular), and the association of those modes with several
mesoanalysis parameters. Supercellular TC tornadoes are accompanied by somewhat greater vertical shear
than those occurring from other modes. Tornadoes accompanying nonsupercellular radar echoes tend to
occur closer to the TC center, where CAPE and shear tend to weaken relative to the outer TC envelope,
though there is considerable overlap of their respective radial distributions and environmental parameter
spaces.
1. Introduction and background
A rather broad body of literature has accumulated in
the realm of tropical cyclone (TC) tornado research over
the past several decades, dealing primarily with clima-
tology and distribution (e.g., Novlan and Gray 1974;
Schultz and Cecil 2009), but also covering notable in-
dividual cases (e.g., Orton 1970; McCaul 1987) and
sounding-based observational assessments (e.g., McCaul
1991; Curtis 2004). More recently, applied research has
expanded the TC tornado knowledge base into realms
such as numerical modeling (e.g., McCaul andWeisman
1996; Morin et al. 2010) and Doppler radar examina-
tions of tornadic storms (e.g., Spratt et al. 1997; McCaul
et al. 2004; Rao et al. 2005). Agee and Hendricks (2011)
associated the presence of Doppler radar with a large
increase in TC tornado reports specific to Florida (i.e.,
pre-Doppler era tornadoes were ‘‘severely under-
estimated’’ in that state). For an expansive review of the
evolution of TC tornado-related research and fore-
casting, see Edwards (2012).
The fundamental conceptual and physical tenets of
midlatitude supercell forecasting, in an ingredients-
based framework (e.g., McNulty 1978; McNulty 1985;
Doswell 1987), are valid for TC supercells; however,
systematic differences in the relative magnitudes of
moisture, instability, lift, and shear in TCs (e.g., McCaul
1991) contribute strongly to the challenge of forecasting
tornadoes in that setting. Such differences may be related
to meso- and smaller-scale boundaries within the TC
envelope—whether antecedent or developing in situ—
that can influence convective character and tornado po-
tential (e.g., Fig. 3 in McCaul et al. 2004; Edwards and
Pietrycha 2006). There also is a growing realization that
some TC tornadoes are not necessarily supercellular in
origin, as shown in our results below. The challenge of TC
tornado prediction remains hampered by incomplete in-
sight into supportive environmental influences from the
Corresponding author address: Roger Edwards, NWS Storm
Prediction Center, Ste. 2300, 120 Boren Blvd., Norman, OK 73072.
E-mail: [email protected]
DECEMBER 2012 EDWARDS ET AL . 1507
DOI: 10.1175/WAF-D-11-00117.1
cyclone (meso a to meso b) and convective (at 10s
of km and smaller) scales.
Hypothetically, the separation of tornadic convec-
tive elements (supercellular or not) from surrounding
convection—in other words, discrete storms versus those
embedded in clusters or bands—favors the potential for
more numerous and/or more damaging tornadoes.
Testing this idea was one of the motivators for the de-
termination of convective modes herein. Idealized nu-
merical simulations (McCaul and Weisman 1996) have
indicated that, because of the largemoisture content and
related lack of robust evaporative cooling in low levels,
discrete supercells in TCs should have weak cold pools.
Although McCaul and Weisman suggested this as a po-
tential factor in the weakness of TC tornadoes in gen-
eral, compared to their counterparts in midlatitude
systems, those simulations did not account for either
kinematic or baroclinic inhomogeneities, such as those
accompanying spiral convergence bands or zones of
differential diabatic heating. Observationally, storm-
scale baroclinicity has been measured within TCs, such
as equivalent potential temperature (ue) deficits of up to
12 K beneath spiral bands over water documented by
Barnes et al. (1983). Furthermore, from an analysis of
buoy data, Cione et al. (2000) showed thermal deficits
accompanying vigorous convective bands, as well as a
decrease in air–sea thermal deficit inwardwith respect to
the dense precipitation of the inner region of hurricanes.
The latter is consistent with the inward weakening of
buoyancy climatologically documented by McCaul
(1991).
Given the relative coarseness of surface observations
over water, and over some land areas, such meso-b to
convective-scale processes may not be readily apparent
to the operational forecaster and, instead, may be in-
ferred by indirect evidence such as convective mode and
persistence. Those, in turn, can be influenced bymerging
and clustering of storms and precipitation areas com-
mon to the dense precipitation regimes of TCs. Barnes
et al. (1983) also documented a lack of discrete storms
with inward extent toward the TC center, which may be
related to themerging regime and/or the relatively weak
CAPE in the TC core region. The presence of an ob-
jectively analyzed environmental dataset at SPC
(Schneider and Dean 2008) that included numerous
landfalling TC situations, and the ability to classify
storm modes, permits these issues to be investigated
holistically in the TC setting.
As with midlatitude convective phenomena of similar
spatial scales, there remain caveats about the utility of
the automated analyses in the TC setting. The accuracy
of the analyses is uncertain at scales ,40 km, which
covers TC supercells, most nonsupercellular tornadic
echoes found in this study, and the short axes of spiral
bands. Further, the Rapid Update Cycle (RUC) model
basis1 for the analyses was not constructed to resolve
either hurricane winds or related extreme pressure
gradients, nor the wind transitions from ocean to land in
a hurricane. These factors become less important away
from extreme gradients—in the outer parts of hurri-
canes where most of their tornadoes occur—and in TCs
weaker than hurricane intensity at tornado time, which
account for most events herein.
Companion studies determine radar-based convective
modes with nontropical severe thunderstorms pro-
ducing damaging thunderstorm winds, large hail, and
tornadoes (Smith et al. 2012, hereafter Part I), then fo-
cus on the near-storm environments of tornadic mid-
latitude supercells and tornadic quasi-linear convective
systems (Thompson et al. 2012, hereafter Part II). This
third part of this study similarly presents some findings
for the storm modes and near-convective environments,
as applied specifically to TC tornado events that oc-
curred during the period 2003–11. For clarity, ‘‘storm’’
hereafter will refer to those convective elements, on
horizontal scales of 100–101 km, specifically responsible
for tornadoes. This term is used instead of ‘‘cell’’ since
(as shown herein) some tornadic storm modes are not
unambiguously or discretely cellular. The acronym
‘‘TC’’ will be used to refer to the tropical cyclone as
a whole.
2. Data and methods
TC tornado data come from the 1995–2011 ‘‘TCTOR’’
database (Edwards 2010) at SPC. The three most prolific
TC tornado seasons in the TCTOR dataset—2004, 2005,
and 2008—fall within the subset analyzed in this study,
except for the missing effective-layer-based 2004 envi-
ronmental data, as detailed in section 3d.
The number of tornado events examined here (730) is
different than the number of actual tornadoes contained
in the 2003–11 temporal subset of TCTOR (826), for the
following reasons: 1) segmenting by county of the tor-
nado data in Parts I–III, whereas TCTOR is whole-
tornado data, and 2) the spatiotemporal gridding and
filtering technique detailed in Part I, which distills
proximal tornado reports to single grid events. For this
purpose, a tornado event (hereafter ‘‘tornado’’) consti-
tutes the county segment of a tornado report that was
1 The Rapid Refresh model (Benjamin et al. 2007) operationally
replaced the RUC on 1 May 2012. Its efficacy in the TC environ-
ment, both on its own and as an influence in SPC mesoanalyses, is
yet to be determined.
1508 WEATHER AND FORECAST ING VOLUME 27
assigned themaximum rating on the enhanced Fujita (EF)
scale2 rating in each 40-km grid square, for the analysis
hour containing the report (e.g., a 2055 UTC tornado is
assigned a 2000 UTC environment). These spatial and
temporal bounds were chosen for comparison and anal-
yses of environmental parameters with convective modes
associated specifically with TC tornadoes, similar to
analyses performed for a larger, non-TC dataset of tor-
nadic and nontornadic significant severe storm environ-
ments in Part II. Figures 1 and 2 depict the geographic
distribution and spatial density of the filtered tornadoes
involved herein.
The environmental-analysis time frame began in 2003,
using the same database as described by Schneider and
Dean (2008). To summarize, an objectively analyzed
field of surface observations, using the hourly RUC
(after Benjamin et al. 2004) analysis as a first guess, is
combined with 40-km gridded RUC model data aloft in
an identical manner to that used in creating the SPC
hourly mesoscale analyses (Bothwell et al. 2002). This
provides hourly, three-dimensional fields from which
numerous parameters can be derived that are commonly
used for sounding analysis of the moist-convective en-
vironment.
Volumetric radar data for this era were interrogated
as described in Part I, in order to assign a convective
mode to each tornadic event. Mode designation was
necessarily subjective, but followed specific guidelines.
Ten tornadic storm modes appeared in TCs, assigned
according to the same archetypical guidelines established
in Part I. Radar-based classifications are summarized
herewith the name and sample size of each event in italics
(percentages sum to 101 because of rounding):
d discrete right-moving supercell (RM)—storms accom-
panied by deep, persistent mesocyclones3 generally
characterized by$20 kt (10 m s21) rotational velocity
at most ranges, and distinct from surrounding echoes
at $35 dBZ; 249 events (34%);4
d quasi-linear convective system (QLCS)—contains con-
tiguous reflectivities .35 dBZ for a length $100 km
at $3/1 aspect ratio; nonsupercellular; includes storms
embedded in lines; 21 events (3%);d cluster—as with QLCS, but with an aspect ratio ,3/1;
nonsupercellular; included disorganized and/or amor-
phous reflectivity patterns; 25 events (3%);d supercell in line—meets velocity and continuity guide-
lines for supercells but is embedded in a QLCS; 70
events (10%);d supercell in cluster—meets velocity and continuity
guidelines for supercells but is embedded in a cluster;
257 events (35%);5
d discrete nonsupercell—lacks horizontal rotation, or
rotational characteristics are too weak and transient
to classify even as ‘‘marginal’’ (below); 13 events (2%);
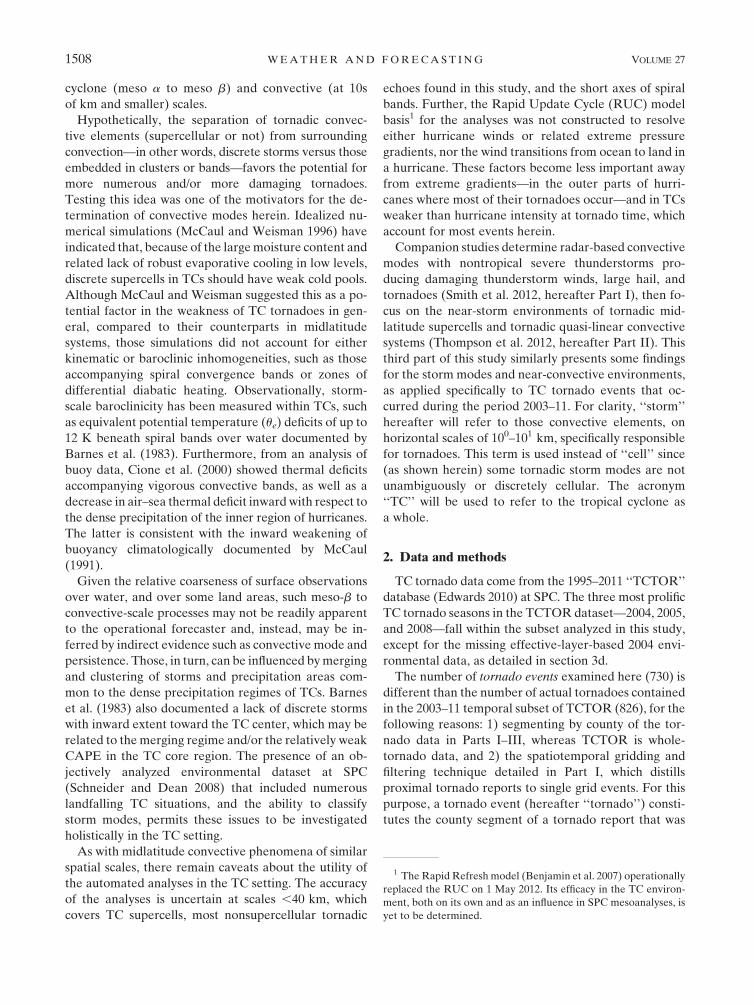
FIG. 1. Kernel density estimate on a 40 km 3 40 km grid of filtered, continental U.S. tornado events in right-
moving (RM) supercell modes: (a) non-TC in origin and (b) from TCs only. Sample sizes are given for each. Min-
imum contour is 0.5 events per 10 yr estimate based on 2003–11 data. Labeled contours begin at 1 event per 10 yr.
Black dots represent events that formed the basis of the kernel density estimate, and the progressively darker gray fill
represents a higher event estimate.
2 The term ‘‘EF’’ is used for the damage ratings of all tornadoes
herein, including those rated prior to the enhanced Fujita scale’s
implementation in February 2007, because of the correspondence
in F- and EF-scale ratings intrinsic to the development of the latter
(WSEC 2006).
3 Left-moving (anticyclonic) supercells, a category used for
midlatitude events in Part I and Part II, did not appear in our TC
examinations.4 Due to data outage, one event from this subset had no envi-
ronment data except STP.5 Due to a data outage, one event from this subset had no en-
vironment data except STP; two others lacked all but SCP and STP.
DECEMBER 2012 EDWARDS ET AL . 1509

d marginal discrete supercell—shows at least brief, weak
rotational characteristics but not fulfilling supercellu-
lar guidelines; 19 events (3%);6
d marginal supercell in cluster; 37 events (5%);d marginal supercell in line; 7 events (1%);d cell in cluster, nonsupercellular; 26 events (4%); andd unclassified—radar data missing or event out of range;
6 events (1%).
The three unambiguously supercellular categories
(discrete, in line, in cluster) were analyzed separately
and as a subgroup for this study. Within these super-
cellular categories, mesocyclones further were classified
as weak, moderate, or strong, following a subjective
three-bin ranking of range-dependent horizontal rota-
tional velocity guidelines offered by Stumpf et al. (1998)
and related nomograms (e.g., Andra 1997). A radar
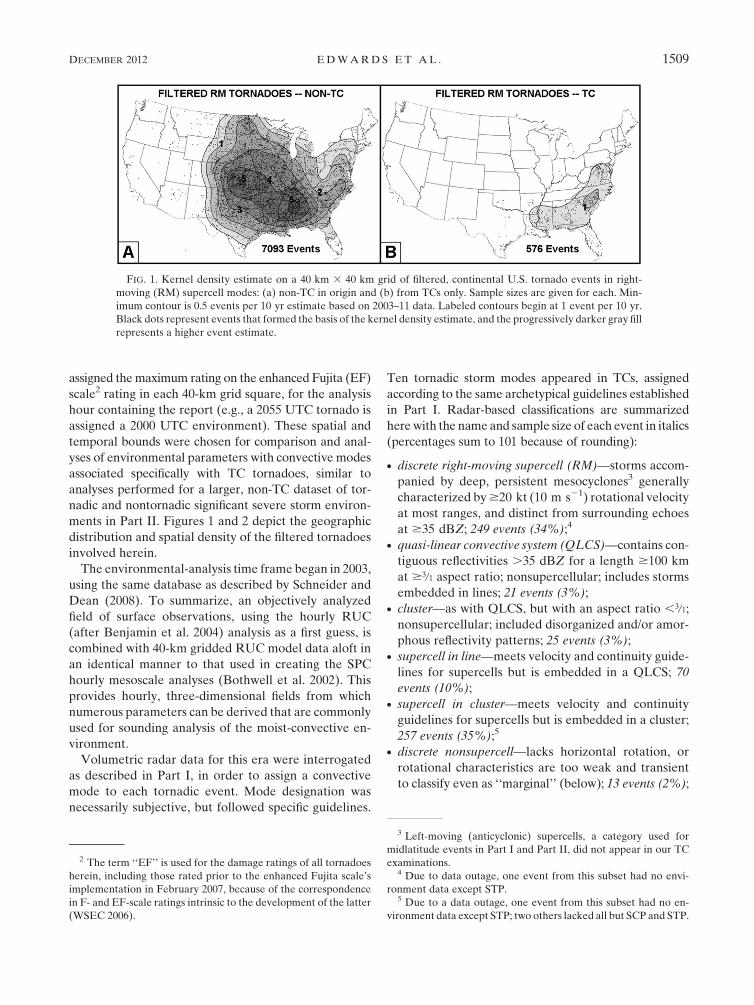
example of the discrete, tornadic TC supercell category
is shown in Fig. 3. Partial or whole eyewalls associated
with tornado reports7 were classified as clusters.
Nonsupercell TC (NSTC) tornadoes likewise were
examined in terms of their classified modes (e.g., clus-
tered, linear, marginal supercell), distance from TC
center (details in section 3), and as a second subgroup.
Nonsupercell tornadoes have been studied formally for
over two decades (e.g., Wakimoto andWilson 1989), but
not including those within TCs. Continuous spiral bands
or segments of bands are treated as QLCSs if they meet
the aforementioned mode criteria. Although tornadic
bow echoes were a mode investigated in Part I, and have
not been commonly documented in TCs that occurred
during years prior to this study [e.g., the Florida ‘‘Iron
Bend’’ storm described by Spratt et al. (1997)], no bow
echoes were identified in association with TC tornadoes
in the 2003–11 sample. It is unclear whether this is
a function of limitations imposed on bulk sampling by
the highly specialized nature of the environment stud-
ied, compared to the broader Part I sample that included
midlatitude bow echoes, or of any actual physical ten-
dency for TCs to produce a relative paucity of tornadic
bows.
3. Analyses and findings
a. Error sources in tornado data
As with the national tornado database, close exami-
nation of TC tornado reports revealed a small number of
apparent errors in time and/or location. By far, the pri-
mary source of such errors was the time of reports
compared to radar signatures (or lack thereof). Where
the location appeared accurate, but the apparently re-
sponsible echo (e.g., storm or mesocyclone) passed over
the location earlier or later than the tornado report time,
the time was adjusted to match the echo passage, as in
Part I. This was done in 51 TC cases (7% of 730 total TC
events), with an average absolute error of 44 min, and
extremes of 2 and 210 min, not including one event that
was124 h off (wrong date entered in Storm Data). The
most common time-error integer was 60 min, occurring
in 16 cases; in other words, 31% of all documented time
errors were displaced by precisely 1 h. Five of the 1-h
absolute errors occurred in a county warning area
straddling two time zones, indicating incorrect input of
time zone; otherwise, the 1-h errors are suspected to
arise from erroneous transposition of daylight with
standard time in the process of local report logging.
Sixteen of 51 (31%) of the Storm Data time errors were
negative (i.e., the report occurred before the corre-
sponding radar echo), including five of the 1-h errors.
The average negative error was 263 min with extremes
of215 and2210. The average positive error (i.e., report
lagged the radar echo) was 38 min with extremes of 2
and 107 min.
In a few instances, it was not immediately obvious
which storm or echo, among multiple possibilities, was
responsible for the report, and a guess had to be made
based on echo timing and continuity. Three cases
FIG. 2. As in Fig. 1b, but for all convective modes. Minimum
contour is 0.25 events per 10 yr, based on 2003–11 data. Labeled
contour intervals are 0.25 events per 10 yr. Map is cropped to af-
fected areas of the United States.
6 Because of a data outage, one event from this subset had no
environmental information. Cases with most or partial missing
environment data account for the presence of more total mode
events than in the corresponding environmental analyses in section
3d and Fig. 7.7 See Edwards (2012) for further discussion on the uncertainties
involving eyewall-tornado reports in general.
1510 WEATHER AND FORECAST ING VOLUME 27
required a change in a listing for report location (county
and/or latitude–longitude entry) and two for date (both
being time corrections across 0000 UTC). A few other
cases had radar presentations so nebulous or otherwise
uncertain that a time or place adjustment could not be
made. Those time and/or location errors that were obvi-
ous and could be adjusted with confidence will be sub-
mitted for revision jointly in the nationwide SPC
‘‘ONETOR’’ and TCTOR databases (see Edwards 2010
for more details on that process). Other possible but not
quantifiable sources for counting errors in TC situations
include
d reports of tornadoes that actually were other phenom-
ena, for example, gusts in gradient flow, wet micro-
bursts, or damaging horizontal-shear vortices in the
eyewall’s inner rim (e.g., Fujita 1993) occurring with-
out documented vertical continuity into its convective
plume;d tornadoes that were sufficiently weak and/or brief as
to go unreported amid concurrent or subsequent hurri-
cane conditions; andd tornadoes that occurred in areas too remote to be
witnessed or to cause noticeable damage and, as such,
would go unreported.
The tornado ratings themselves also are subject to er-
rors and uncertainties arising both from 1) the subjectivity
and inconsistency inherent to the rating process
(Doswell and Burgess 1988; Edwards 2003) and 2) dam-
age obscuration by other TC effects. Hurricane-force
winds in the inner portion of some TCs may augment or
mask damage from tornadoes occurring in the same
area, whether before, during, or after the passage of the
TC core. Hydraulic damage (i.e., from storm surge, wave
battering, or freshwater flooding) also may alter the ef-
fects of tornadoes. There is no known way to account
consistently for these complications, other than to sub-
jectively judge whatever damage-indicator documenta-
tion may be offered in text accompanying Storm Data
event entries. No such information, in sufficient detail to
cast doubt on an assigned rating, was available for events
herein.
b. General results
Compared with non-TC tornadoes extracted from the
Part I database, TCs heavily influenced the nationwide
totals of tornadic supercells during the peak months
of the North Atlantic hurricane season: August and
September, with lesser relative contributions along the
fringes in July and October (Fig. 4). Tornadic supercells
FIG. 3. Radar imagery at 0.58 beam tilt from Eglin Air Force Base (KEVX)WSR-88D at 0352 UTC 15 Sep 2004 of
a discrete, tornadic supercell in southeastern Bay County, FL: (a) reflectivity, scale at bottom in dBZ and (b) storm-
relativemotion, scale at bottom in kt. Two associated, F1-rated tornadoes, 3 min apart, killed two people and injured
eight others. North is up; mesocyclone was located ’65 km southeast of KEVX (located in northwest quadrant of
panels) at sampling time. This was storm A mapped in Fig. 1 of Baker et al. (2009).
DECEMBER 2012 EDWARDS ET AL . 1511
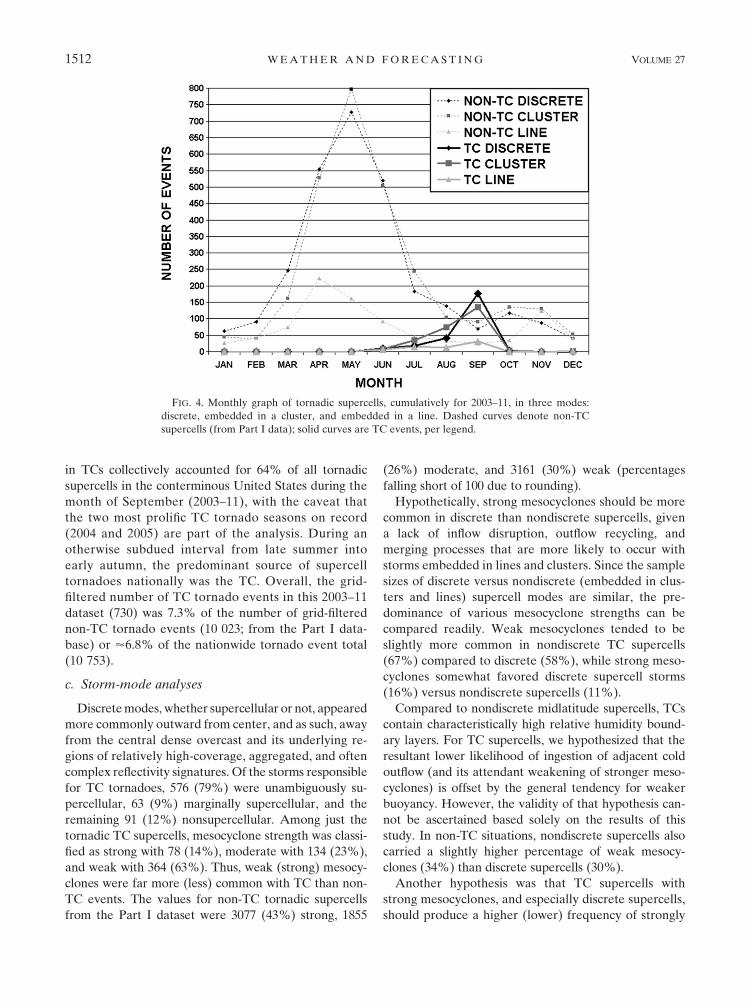
in TCs collectively accounted for 64% of all tornadic
supercells in the conterminous United States during the
month of September (2003–11), with the caveat that
the two most prolific TC tornado seasons on record
(2004 and 2005) are part of the analysis. During an
otherwise subdued interval from late summer into
early autumn, the predominant source of supercell
tornadoes nationally was the TC. Overall, the grid-
filtered number of TC tornado events in this 2003–11
dataset (730) was 7.3% of the number of grid-filtered
non-TC tornado events (10 023; from the Part I data-
base) or ’6.8% of the nationwide tornado event total
(10 753).
c. Storm-mode analyses
Discretemodes, whether supercellular or not, appeared
more commonly outward from center, and as such, away
from the central dense overcast and its underlying re-
gions of relatively high-coverage, aggregated, and often
complex reflectivity signatures. Of the storms responsible
for TC tornadoes, 576 (79%) were unambiguously su-
percellular, 63 (9%) marginally supercellular, and the
remaining 91 (12%) nonsupercellular. Among just the
tornadic TC supercells, mesocyclone strength was classi-
fied as strong with 78 (14%), moderate with 134 (23%),
and weak with 364 (63%). Thus, weak (strong) mesocy-
clones were far more (less) common with TC than non-
TC events. The values for non-TC tornadic supercells
from the Part I dataset were 3077 (43%) strong, 1855
(26%) moderate, and 3161 (30%) weak (percentages
falling short of 100 due to rounding).
Hypothetically, strong mesocyclones should be more
common in discrete than nondiscrete supercells, given
a lack of inflow disruption, outflow recycling, and
merging processes that are more likely to occur with
storms embedded in lines and clusters. Since the sample
sizes of discrete versus nondiscrete (embedded in clus-
ters and lines) supercell modes are similar, the pre-
dominance of various mesocyclone strengths can be
compared readily. Weak mesocyclones tended to be
slightly more common in nondiscrete TC supercells
(67%) compared to discrete (58%), while strong meso-
cyclones somewhat favored discrete supercell storms
(16%) versus nondiscrete supercells (11%).
Compared to nondiscrete midlatitude supercells, TCs
contain characteristically high relative humidity bound-
ary layers. For TC supercells, we hypothesized that the
resultant lower likelihood of ingestion of adjacent cold
outflow (and its attendant weakening of stronger meso-
cyclones) is offset by the general tendency for weaker
buoyancy. However, the validity of that hypothesis can-
not be ascertained based solely on the results of this
study. In non-TC situations, nondiscrete supercells also
carried a slightly higher percentage of weak mesocy-
clones (34%) than discrete supercells (30%).
Another hypothesis was that TC supercells with
strong mesocyclones, and especially discrete supercells,
should produce a higher (lower) frequency of strongly
FIG. 4. Monthly graph of tornadic supercells, cumulatively for 2003–11, in three modes:
discrete, embedded in a cluster, and embedded in a line. Dashed curves denote non-TC
supercells (from Part I data); solid curves are TC events, per legend.
1512 WEATHER AND FORECAST ING VOLUME 27

(weakly) rated tornadoes.8 Only 54 (7%) of all TC tor-
nado events overall were rated strong (EF2 or EF3).
Strong tornadoes were far more commonwith supercells
than with marginal or nonsupercells (Fig. 5), and con-
stituted a slightly higher share of tornadoes with discrete
versus nondiscrete supercells. No NSTC tornadoes ex-
ceeded an EF1 rating. Comparisons of damage ratings
with midlatitude, nontropical tornadic supercells (Table
1) indicate that significant ($EF2) tornadoes are
somewhat more common with non-TC supercells, but
not as much as the aforementioned difference in meso-
cyclone strength suggests. This indicates possible in-
fluences from the inability of the Weather Surveillance
Radar-1988 Doppler (WSR-88D) to resolve meso-
cyclonic features of the characteristically smaller-scale
TC supercells. Sample sizes for damage-rating classes
within each of the smaller-mode bins (e.g., each form of
marginal supercell or of strict nonsupercell) were too
small to draw meaningful conclusions.
NSTC tornadoes tended not only to yield weaker
ratings than their supercellular counterparts, but also to
occur closer to TC centers. TCTOR also contains Na-
tional Hurricane Center ‘‘best track’’ data interpolated
to the recorded time of each tornadogenesis, followed
by derived azimuth and range information (Edwards
2010). Accordingly, 2003–11 TCTOR data were mined
for thosewhole-tornado entries corresponding to strictly
nonsupercellular and supercellular modal-event seg-
ments herein, yielding polar plots of their distributions
with respect to both true north and the estimated TC
center at tornado time (Fig. 6). Any entries whose times
and locations were corrected for this study, based on
radar interrogations, likewise were adjusted in our
analysis version of TCTOR prior to computing azimuth
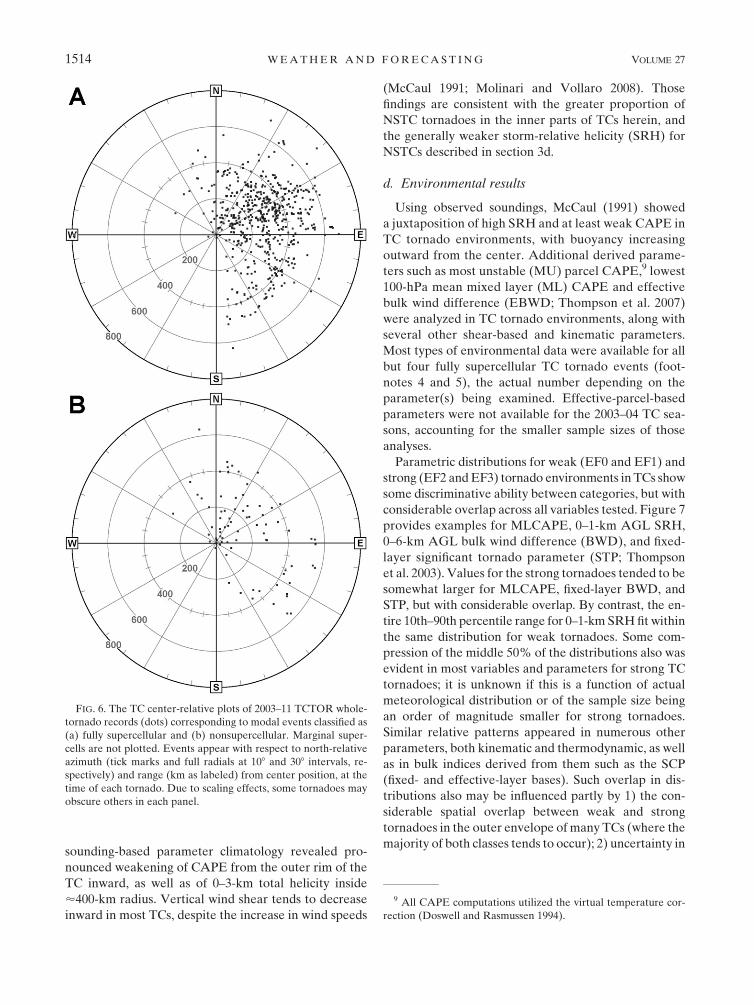
and range for Fig. 6. The mean and median radii of
NSTC tornadoes from center were 302 and 287 km, re-
spectively, contrasted to the mean and median ranges
for supercellular tornadoes of 341 and 342 km. The su-
percell TC tornado distribution also stretched farther
southward, largely because of both discrete and em-
bedded supercells aligned with outer, trailing spiral
bands. In general, echo modes with TCs examined for
this study tended to show the following characteristics
more often with inward extent: ambiguity, unbroken
banding (classified here as QLCS), eyewalls or their
remnants, and nonconvective to weakly convective rain
shields. This accounts for the relative outer distribu-
tion of supercellular TC tornadoes. McCaul’s (1991)
FIG. 5. Percentages of weak and strong tornadoes per mode bin,
as labeled: D is discrete supercell, E is embedded supercell (col-
lectively, all supercells in lines plus supercells in clusters), M is
marginal (subcriteria) supercell, N is nonsupercell, and M1N
combines all modes not meeting supercell criteria. Percentages of
weak tornadoes are given in black integers, on bars. Sample size for
each mode is given above each bar.
TABLE 1. Fraction of 2003–11 tornado damage rating occurrence
for TCs and non-TC supercells. Numbers may not precisely add to
unity due to rounding.
Damage (F/EF category) TC Non-TC
$4 0.00 0.01
3 0.01 0.05
2 0.08 0.12
1 0.33 0.30
0 0.58 0.53
8 Damage ratings, especially in the F-scale era, were not neces-
sarily direct functions of actual tornado intensity (Doswell and
Burgess 1988), but instead, mere indicators, and even then, only if
a suitably robust target was hit to represent maximum tornado
winds. Given the small, brief nature of TC tornadoes in general,
and their occasional spatial juxtaposition with hurricane damage,
undersampling issues raised by Doswell and Burgess may apply
here. No violent (EF4 and EF5) tornadoes were found in the da-
taset. Further, sincemaximumEF-scale rating was used as the grid-
box filter, the actual ratio of weak (EF0 and EF1) tornadoes to all
tornadoes is higher than in the events presented here.
DECEMBER 2012 EDWARDS ET AL . 1513
sounding-based parameter climatology revealed pro-
nounced weakening of CAPE from the outer rim of the
TC inward, as well as of 0–3-km total helicity inside
’400-km radius. Vertical wind shear tends to decrease
inward in most TCs, despite the increase in wind speeds
(McCaul 1991; Molinari and Vollaro 2008). Those
findings are consistent with the greater proportion of
NSTC tornadoes in the inner parts of TCs herein, and
the generally weaker storm-relative helicity (SRH) for
NSTCs described in section 3d.
d. Environmental results
Using observed soundings, McCaul (1991) showed
a juxtaposition of high SRH and at least weak CAPE in
TC tornado environments, with buoyancy increasing
outward from the center. Additional derived parame-
ters such as most unstable (MU) parcel CAPE,9 lowest
100-hPa mean mixed layer (ML) CAPE and effective
bulk wind difference (EBWD; Thompson et al. 2007)
were analyzed in TC tornado environments, along with
several other shear-based and kinematic parameters.
Most types of environmental data were available for all
but four fully supercellular TC tornado events (foot-
notes 4 and 5), the actual number depending on the
parameter(s) being examined. Effective-parcel-based
parameters were not available for the 2003–04 TC sea-
sons, accounting for the smaller sample sizes of those
analyses.
Parametric distributions for weak (EF0 and EF1) and
strong (EF2 andEF3) tornado environments in TCs show
some discriminative ability between categories, but with
considerable overlap across all variables tested. Figure 7
provides examples for MLCAPE, 0–1-km AGL SRH,
0–6-km AGL bulk wind difference (BWD), and fixed-
layer significant tornado parameter (STP; Thompson
et al. 2003). Values for the strong tornadoes tended to be
somewhat larger for MLCAPE, fixed-layer BWD, and
STP, but with considerable overlap. By contrast, the en-
tire 10th–90th percentile range for 0–1-km SRHfit within
the same distribution for weak tornadoes. Some com-
pression of the middle 50% of the distributions also was
evident in most variables and parameters for strong TC
tornadoes; it is unknown if this is a function of actual
meteorological distribution or of the sample size being
an order of magnitude smaller for strong tornadoes.
Similar relative patterns appeared in numerous other
parameters, both kinematic and thermodynamic, as well
as in bulk indices derived from them such as the SCP
(fixed- and effective-layer bases). Such overlap in dis-
tributions also may be influenced partly by 1) the con-
siderable spatial overlap between weak and strong
tornadoes in the outer envelope of many TCs (where the
majority of both classes tends to occur); 2) uncertainty in
FIG. 6. The TC center-relative plots of 2003–11 TCTOR whole-
tornado records (dots) corresponding to modal events classified as
(a) fully supercellular and (b) nonsupercellular. Marginal super-
cells are not plotted. Events appear with respect to north-relative
azimuth (tick marks and full radials at 108 and 308 intervals, re-spectively) and range (km as labeled) from center position, at the
time of each tornado. Due to scaling effects, some tornadoes may
obscure others in each panel.
9 All CAPE computations utilized the virtual temperature cor-
rection (Doswell and Rasmussen 1994).
1514 WEATHER AND FORECAST ING VOLUME 27

damage ratings of 61 (e.g., Doswell and Burgess 1988);
3) the lack of routinely available observational input
above ground level, contributing to the general smooth-
ness of planar fields; and 4) the relatively coarse 40-km
grid length of the mesoscale analysis, which should not
resolve some kinds of key smaller-scale differences or
structures within a TC (e.g., narrow slots of clearing
between bands, or baroclinicity related to downdraft-
produced ue deficits) that can support more robust su-
percells and tornadoes.
Environmental parameters previously examined for
midlatitude, supercellular tornado environments were
analyzed for the TC cases, and compared with up to 6897
(depending on environmental data availability) non-TC
tornado events from the dataset in Part II that were
associated with right-moving supercells. Several of these
results are shown in Fig. 8. Similarly to the intensity-
category analyses, the smaller sample sizes of the TC
subset is associated with compression in the quartile
distributions. In general, thermodynamic variables (e.g.,
Fig. 8a) differentiated the tropical and nontropical tor-
nado environments better than the kinematic ones.
Shear-based parameters for TC events did show slightly
tighter distributions on the margins (exemplified by
0–1-km SRH in Fig. 3b), but otherwise were similar to
their non-TC counterparts. The primary difference be-
tween midlatitude and TC tornado situations in this
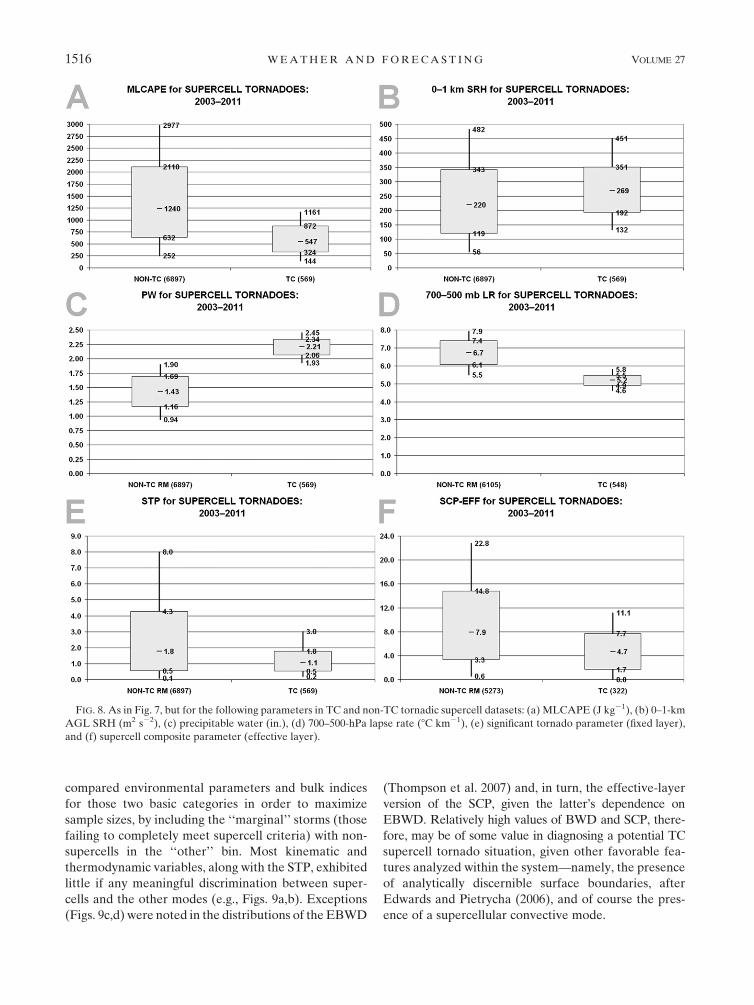
study centers on moisture, as indicated by total pre-
cipitable water (PW; Fig. 8c). The 10th percentile of the
PW distribution for TCs exceeded the 90th percentile
for nontropical tornadoes, with the middle 50% being
well separated. This reflects the characteristic thermo-
dynamic environment of TCs, which are very rich in
deep-tropospheric moisture. As such, TC supercell en-
vironments were decidedly weaker in middle-level lapse
rates (e.g., Fig. 8d), which contributed to smaller overall
CAPE and a more compressed distribution of the latter
(e.g., Fig. 8a). This extended to composite parameters
such as SCP and STP (Figs. 8e,f) that substantially in-
corporate CAPE as part of their formulation.
As in midlatitudes, TC tornadic supercell environ-
ments should feature more favorable values of various
shearmeasures than in nonsupercell tornadic convective
modes, but with lower values of CAPE (Part II). We
FIG. 7. Box-and-whiskers diagrams, where percentile extents and corresponding values represent 25th–75th for boxes, 10th–90th for
whiskers, and 50th at the inbox bar, for (a) MLCAPE (J kg21), (b) 0–1-km AGL SRH (m2 s22), (c) 0–6-km AGL EBWD (kt), and
(d) significant tornado parameter (fixed layer). Abscissa labels include sample size in parentheses; ordinate represents parametermagnitude.
DECEMBER 2012 EDWARDS ET AL . 1515
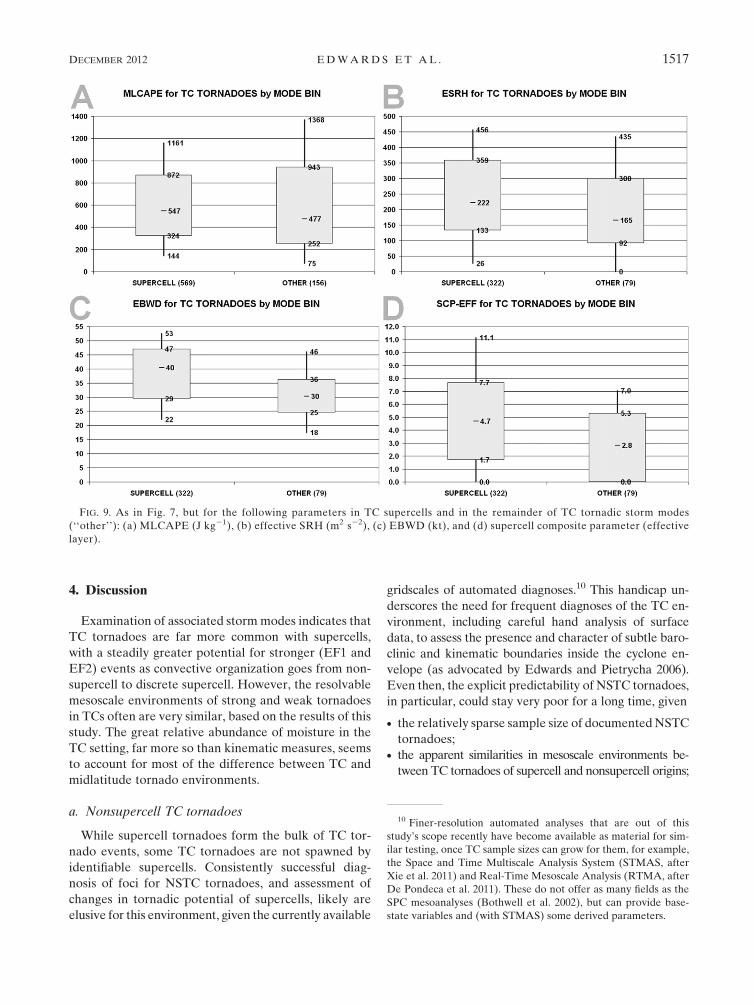
compared environmental parameters and bulk indices
for those two basic categories in order to maximize
sample sizes, by including the ‘‘marginal’’ storms (those
failing to completely meet supercell criteria) with non-
supercells in the ‘‘other’’ bin. Most kinematic and
thermodynamic variables, along with the STP, exhibited
little if any meaningful discrimination between super-
cells and the other modes (e.g., Figs. 9a,b). Exceptions
(Figs. 9c,d) were noted in the distributions of the EBWD
(Thompson et al. 2007) and, in turn, the effective-layer
version of the SCP, given the latter’s dependence on
EBWD. Relatively high values of BWD and SCP, there-
fore, may be of some value in diagnosing a potential TC
supercell tornado situation, given other favorable fea-
tures analyzed within the system—namely, the presence
of analytically discernible surface boundaries, after
Edwards and Pietrycha (2006), and of course the pres-
ence of a supercellular convective mode.
FIG. 8. As in Fig. 7, but for the following parameters in TC and non-TC tornadic supercell datasets: (a) MLCAPE (J kg21), (b) 0–1-km
AGL SRH (m2 s22), (c) precipitable water (in.), (d) 700–500-hPa lapse rate (8C km21), (e) significant tornado parameter (fixed layer),
and (f) supercell composite parameter (effective layer).
1516 WEATHER AND FORECAST ING VOLUME 27
4. Discussion
Examination of associated stormmodes indicates that
TC tornadoes are far more common with supercells,
with a steadily greater potential for stronger (EF1 and
EF2) events as convective organization goes from non-
supercell to discrete supercell. However, the resolvable
mesoscale environments of strong and weak tornadoes
in TCs often are very similar, based on the results of this
study. The great relative abundance of moisture in the
TC setting, far more so than kinematic measures, seems
to account for most of the difference between TC and
midlatitude tornado environments.
a. Nonsupercell TC tornadoes
While supercell tornadoes form the bulk of TC tor-
nado events, some TC tornadoes are not spawned by
identifiable supercells. Consistently successful diag-
nosis of foci for NSTC tornadoes, and assessment of
changes in tornadic potential of supercells, likely are
elusive for this environment, given the currently available
gridscales of automated diagnoses.10 This handicap un-
derscores the need for frequent diagnoses of the TC en-
vironment, including careful hand analysis of surface
data, to assess the presence and character of subtle baro-
clinic and kinematic boundaries inside the cyclone en-
velope (as advocated by Edwards and Pietrycha 2006).
Even then, the explicit predictability of NSTC tornadoes,
in particular, could stay very poor for a long time, given
d the relatively sparse sample size of documentedNSTC
tornadoes;d the apparent similarities in mesoscale environments be-
tween TC tornadoes of supercell and nonsupercell origins;
FIG. 9. As in Fig. 7, but for the following parameters in TC supercells and in the remainder of TC tornadic storm modes
(‘‘other’’): (a) MLCAPE (J kg21), (b) effective SRH (m2 s22), (c) EBWD (kt), and (d) supercell composite parameter (effective
layer).
10 Finer-resolution automated analyses that are out of this
study’s scope recently have become available as material for sim-
ilar testing, once TC sample sizes can grow for them, for example,
the Space and Time Multiscale Analysis System (STMAS, after
Xie et al. 2011) and Real-Time Mesoscale Analysis (RTMA, after
De Pondeca et al. 2011). These do not offer as many fields as the
SPC mesoanalyses (Bothwell et al. 2002), but can provide base-
state variables and (with STMAS) some derived parameters.
DECEMBER 2012 EDWARDS ET AL . 1517
d their typically weak and short-lived nature;d virtually nonexistent direct documentation (i.e., photos,
video, mobile radar sampling) of NSTC tornadoes,
including supposed eyewall tornadoes, rendering their
true frequency highly uncertain;d lack of high-resolution and proximal radar interroga-
tion in real time to ascertain smaller-scale circulations
even than the relatively small TC supercellular meso-
cyclones; andd the lack of real-time, finescale observational data that
can help forecasters to diagnose, with suitable precision,
any small-scale (i.e., 108–101 km and min in space and
time, respectively) patterns of convergence, instabil-
ity, and vorticity.
At this time, the extent is unknown towhich nonsupercell
environments are similar to those of midlatitude non-
supercell tornadoes, such as in concentrations of vertical
vorticity and convergence (e.g., Caruso andDavies 2005),
or if other, altogether different processes are involved.
b. Tornadic and nontornadic environments
In looking at a relatively small sampling of specific
events, using observed soundings, Baker et al. (2009)
showed that SCP and STP could be used to distinguish
tornadic from nontornadic environments in one partic-
ular TC, Ivan of 2004. By contrast, null events were
outside the scope of this study; therefore, we did not
collect nontornadic supercell events that could be used
to test their null-event results on gridded analyses, and
in TCs other than Ivan. The comparison of nontornadic
supercell environments with those of tornadic storms,
across multiple TCs, is an area that may be worth further
exploration, especially if null and tornadic supercells, in
particular, do not exhibit much spatial overlap at these
environmental-analysis grid scales.
As noted in section 1, prior studies have found im-
portant influences of poorly resolved, small-scale pro-
cesses on TC tornado potential. Clearly, considerable
further study is needed for better documentation of the
near-storm tornado environment in TCs, both super-
cellular and nonsupercellular, for better differentiation
of tornadic versus nontornadic regimes by the forecaster.
Given the gridscales employed herein, near-storm-scale
processes, such as in situ cold pool generation, likely will
not be known in an operational setting—one possible,
eventual exception being dropsonde deployments (as
studied by Bogner et al. 2000 and Baker et al. 2009) into
such regimes that, in turn, reach the forecaster in near–
real time. Careful diagnosis and conceptual modeling of
the TC tornado environment remains necessary for
forecasters—for example, evaluating the relative position
of an embedded storm to that of its broader band or
cluster, for assessing its potential interaction with small-
scale baroclinic boundaries generated from within the
cluster or band. One such area of acute, diagnostic scru-
tiny in the operational setting may be along the inner rim
of a spiral band, where Powell (1990) noted relative
maxima in cyclonic vorticity and convergence.
Within the framework of numerical guidance and re-
search, some of these issues may be investigated through
higher-resolution TC modeling. Future plans for the
Hurricane Weather Research and Forecasting model
(HWRF) include 3-km and/or 1-km moving inner nests
(Zhang et al. 2010), which conceivably could resolve
some tornadic storms and their immediate environ-
ments within the TC envelope. With such modeling on
the way, assessment of its capabilities to diagnose both
supercell and nonsupercell tornado regimes in TCs
should be performed.
Acknowledgments. The SPC Science Support Branch
made various forms of data available. Greg Carbin
(SPC) provided the base tornado data used to construct
TCTOR. Steve Weiss (SPC) offered very helpful in-
ternal review and suggestions. GRLevelX software was
used to interrogate archived level-2 and -3 radar data for
convective-mode analyses.
REFERENCES
Agee, E. M., and A. Hendricks, 2011: An assessment of the cli-
matology of Florida hurricane-induced tornadoes (HITs):
Technology versus meteorology. J. Climate, 24, 5218–5222.Andra, D. L., Jr., 1997: The origin and evolution of the WSR-88D
mesocyclone recognition nomogram. Preprints, 28th Conf. on
RadarMeteorology,Austin, TX,Amer.Meteor. Soc., 364–365.
Baker, A. K.,M.D. Parker, andM.D. Eastin, 2009: Environmental
ingredients for supercells and tornadoes within Hurricane
Ivan. Wea. Forecasting, 24, 223–243.
Barnes, G. M., E. J. Zipser, D. Jorgensen, and F. Marks Jr., 1983:
Mesoscale and convective structure of a hurricane rainband.
J. Atmos. Sci., 40, 2125–2137.
Benjamin, S. G., and Coauthors, 2004: An hourly assimilation–
forecast cycle: The RUC. Mon. Wea. Rev., 132, 495–518.——, and Coauthors, 2007: From radar-enhanced RUC to the
WRF-basedRapid Refresh. Preprints, 18thConf. onNumerical
Weather Prediction, Park City, UT, Amer. Meteor. Soc., J3.4.
[Available online at http://ams.confex.com/ams/pdfpapers/
124827.pdf.]
Bogner, P. B., G. M. Barnes, and J. L. Franklin, 2000: Conditional
instability and shear for six hurricanes over the Atlantic
Ocean. Wea. Forecasting, 15, 192–207.Bothwell, P. D., J. A. Hart, and R. L. Thompson, 2002: An in-
tegrated three-dimensional objective analysis scheme in use at
the Storm Prediction Center. Preprints, 21st Conf. on Severe
Local Storms, San Antonio, TX, Amer. Meteor. Soc., JP3.1.
[Availableonline at https://ams.confex.com/ams/SLS_WAF_NWP/
techprogram/paper_47482.htm.]
1518 WEATHER AND FORECAST ING VOLUME 27

Caruso, J. M., and J. M. Davies, 2005: Tornadoes in non-
mesocyclone environments with pre-existing vertical vorticity
along convergence boundaries. Electron. J. Oper. Meteor.,
6 (4), 1–36. [Available online at http://www.nwas.org/ej/pdf/
2005-EJ4.pdf.]
Cione, J. J., P. G. Black, and S. H. Houston, 2000: Surface obser-
vations in the hurricane environment. Mon. Wea. Rev., 128,
1550–1561.
Curtis, L., 2004: Midlevel dry intrusions as a factor in tornado
outbreaks associated with landfalling tropical cyclones from
theAtlantic andGulf ofMexico.Wea. Forecasting, 19, 411–427.
De Pondeca, M. S. F. V., and Coauthors, 2011: The real-time
mesoscale analysis at NOAA’s National Centers for Envi-
ronmental Prediction: Current status and development. Wea.
Forecasting, 26, 593–612.Doswell, C. A., III, 1987: The distinction between large-scale and
mesoscale contribution to severe convection: A case study
example. Wea. Forecasting, 2, 3–16.
——, and D. W. Burgess, 1988: On some issues of United States
tornado climatology. Mon. Wea. Rev., 116, 495–501.
——, and E. N. Rasmussen, 1994: The effect of neglecting the
virtual temperature correction on CAPE calculations. Wea.
Forecasting, 9, 625–629.Edwards, R., 2003: Rating tornado damage: An exercise in sub-
jectivity. Preprints, First Symp. on F-Scale and Severe-Weather
Damage Assessment, Long Beach, CA, Amer. Meteor. Soc.,
P1.2. [Available online at https://ams.confex.com/ams/annual2003/
techprogram/paper_55307.htm.]
——, 2010: Tropical cyclone tornado records for the modernized
NWS era. Preprints, 25th Conf. on Severe Local Storms,
Denver, CO, Amer. Meteor. Soc., P3.1. [Available online at
http://ams.confex.com/ams/pdfpapers/175269.htm.]
——, 2012: Tropical cyclone tornadoes: A review of knowledge in
research and prediction. Electron. J. Severe Storms Meteor., 7(6), 1–61. [Available online at http://www.ejssm.org/ojs/index.
php/ejssm/article/view/97/84.]
——, and A. E. Pietrycha, 2006: Archetypes for surface baroclinic
boundaries influencing tropical cyclone tornado occurrence.
Preprints, 23rd Conf. on Severe Local Storms, Saint Louis, MO,
Amer. Meteor. Soc., P8.2. [Available online at http://ams.
confex.com/ams/pdfpapers/114992.pdf.]
Fujita, T. T., 1993: Damage survey of Hurricane Andrew in south
Florida. Storm Data, Vol. 34, No. 8, 25–29. [Available from
National Climatic Data Center, Asheville, NC 28801.]
McCaul, E. W., Jr., 1987: Observations of the Hurricane ‘‘Danny’’
tornado outbreak of 16 August 1985. Mon. Wea. Rev., 115,
1206–1223.
——, 1991: Buoyancy and shear characteristics of hurricane–
tornado environments. Mon. Wea. Rev., 119, 1954–1978.——, and M. L. Weisman, 1996: Simulations of shallow supercell
storms in landfalling hurricane environments.Mon.Wea. Rev.,
124, 408–429.——, D. E. Buechler, S. J. Goodman, and M. Cammarta, 2004:
Doppler radar and lightning network observations of a severe
outbreak of tropical cyclone tornadoes. Mon. Wea. Rev., 132,
1747–1763.
McNulty, R. P., 1978:On upper tropospheric kinematics and severe
weather occurrence. Mon. Wea. Rev., 106, 662–672.
——, 1985: A conceptual approach to thunderstorm forecasting.
Natl. Wea. Dig., 10 (2), 26–30.
Molinari, J., and D. Vollaro, 2008: Extreme helicity and intense
convective towers in Hurricane Bonnie.Mon. Wea. Rev., 136,
4355–4372.
Morin, M. J., M. D. Parker, K. A. Hill, and G. M. Lackmann, 2010:
A numerical investigation of supercells in landfalling tropical
cyclones. Preprints, 25th Conf. on Severe Local Storms, Den-
ver, CO, Amer. Meteor. Soc., P3.3. [Available online at http://
ams.confex.com/ams/pdfpapers/175965.pdf.]
Novlan, D. J., and W. M. Gray, 1974: Hurricane-spawned torna-
does. Mon. Wea. Rev., 102, 476–488.
Orton, R., 1970: Tornadoes associated with Hurricane Beulah on
September 19–23, 1967. Mon. Wea. Rev., 98, 541–547.
Powell, M. D., 1990: Boundary layer structure and dynamics in
outer hurricane rainbands. Part I: Mesoscale rainfall and ki-
nematic structure. Mon. Wea. Rev., 118, 891–917.Rao, G. V., J. W. Scheck, R. Edwards, and J. T. Schaefer, 2005:
Structures of mesocirculations producing tornadoes associ-
ated with Tropical Cyclone Frances (1998). Pure Appl. Geo-
phys., 162, 1627–1641.
Schneider, R. S., and A. R. Dean, 2008: A comprehensive 5-year
severe storm environment climatology for the continental
United States. Preprints, 24th Conf. on Severe Local Storms,
Savannah, GA, Amer. Meteor. Soc., 16A.4. [Available online
at http://ams.confex.com/ams/pdfpapers/141748.pdf.]
Schultz, L. A., and D. J. Cecil, 2009: Tropical cyclone tornadoes,
1950–2007. Mon. Wea. Rev., 137, 3471–3484.Smith, B. T., R. L. Thompson, J. S. Grams, C. Broyles, and H. E.
Brooks, 2012: Convective modes for significant severe thun-
derstorms in the contiguous United States. Part I: Storm clas-
sification and climatology. Wea. Forecasting, 27, 1114–1135.
Spratt, S. M., D.W. Sharp, P.Welsh, A. Sandrik, F. Alsheimer, and
C. Paxton, 1997: A WSR-88D assessment of tropical cyclone
outer rainband tornadoes. Wea. Forecasting, 12, 479–501.Stumpf, G. J., A.Witt, E. D.Mitchell, P. L. Spencer, J. T. Johnson,
M. D. Eilts, K. W. Thomas, and D. W. Burgess, 1998: The
National Severe Storms Laboratory mesocyclone de-
tection algorithm for the WSR-88D. Wea. Forecasting, 13,304–326.
Thompson, R. L., R. Edwards, J. A. Hart, K. L. Elmore, and
P. Markowski, 2003: Close proximity soundings within su-
percell environments obtained from the Rapid Update Cycle.
Wea. Forecasting, 18, 1243–1261.
——, C. M. Mead, and R. Edwards, 2007: Effective storm-relative
helicity and bulk shear in supercell thunderstorm environ-
ments. Wea. Forecasting, 22, 102–115.
——, B. T. Smith, J. S. Grams, A. R. Dean, and C. Broyles, 2012:
Convective modes for significant severe thunderstorms in the
contiguous United States. Part II: Supercell and QLCS tor-
nado environments. Wea. Forecasting, 27, 1136–1154.
Wakimoto, R. M., and J. W. Wilson, 1989: Non-supercell torna-
does. Mon. Wea. Rev., 117, 1113–1140.
WSEC, 2006:A recommendation for an enhancedFujita scale (EF-
scale). Wind Science and Engineering Center, Texas Tech
University, 95 pp. [Available online at http://www.spc.noaa.
gov/faq/tornado/ef-ttu.pdf.]
Xie, Y., S. Koch, J. McGinley, S. Albers, P. E. Bieringer,
M. Wolfson, and M. Chan, 2011: A space–time multiscale
analysis system: A sequential variational analysis approach.
Mon. Wea. Rev., 139, 1224–1240.Zhang, Z., S. G. Gopalakrishnan, K. Yeh, R. F. Rogers, S. D.
Aberson, F. D. Marks, and T. Quirino, 2010: The HWRFx
modeling system: The high resolution hurricane forecast
test. Preprints, 29th Conf. on Hurricanes and Tropical
Meteorology, Tucson, AZ, Amer. Meteor. Soc., 3C.3. [Avail-
able online at http://ams.confex.com/ams/pdfpapers/168948.
pdf.]
DECEMBER 2012 EDWARDS ET AL . 1519