Embed Size (px)
Citation preview

Effect of air humidity on the convective mass transfer coefficient in a rectangular duct
Conrad R. Iskra, Carey J. Simonson
Department of Mechanical Engineering, University of Saskatchewan,
57 Campus Drive, Saskatoon, SK, Canada S7N 5A9
April 3, 2006
Abstract
In this paper, the convective mass transfer coefficient is measured between a forced convection
airflow and a free water surface using the transient moisture transfer (TMT) facility at the University of
Saskatchewan. A pan of water is situated in the test section and forms the lower panel of the rectangular
duct, where a hydrodynamically fully developed laminar or turbulent airflow is passed over the surface of
the water. As the air passes through the test section, it loses heat and gains moisture to/from the water. As
a result, the thermal and concentrations boundary layers are developing through the short test section. The
experimental data shows that the convective mass transfer coefficient is a function of the Reynolds
number (570 < ReD < 8,100 investigated) and the relative humidity of the air stream (15% to 80% RH
investigated). The air humidity, which can be equated to a Rayleigh number, can change the mass transfer
coefficient by as much as 35%. For example with ReD = 1500, the measured Sherwood number is 5.1 and
6.9 (hm = 0.0031 and 0.0042 m/s, β = 2.3 x 10⁻⁸ and 3.1 x 10⁻⁸ s/m) when the air humidity is 80% RH and
18% RH respectively.
1. Introduction
The aim of this paper is to determine the convective mass transfer coefficient in a rectangular
duct at varying Rayleigh (RaD) and Reynolds numbers (ReD). The convective mass transfer coefficient is
an important parameter, since it is a measure of the resistance to mass transfer between the fluid flowing
in a duct and the surface of the duct. The convective coefficient depends on the hydrodynamic, thermal
and concentration boundary layers and is an important parameter when studying moisture transfer
between flowing air and porous media. Despite its importance, there are few experimental data available
in the literature on convective mass transfer coefficients for ducts. In most cases, convective heat transfer
coefficients have been measured and the analogy between heat and mass transfer is used to determine the
convective mass transfer coefficient.
A literature review suggests that convective mass transfer coefficients have been experimentally
measured and correlated for turbulent flow through ducts, but not for laminar flow through ducts. In
addition, the dependence of the convective mass transfer coefficient on RaD when the temperature of the
bottom surface of the duct is below that of the airflow has not been reported. Since little information is
available at low air speeds, experiments in this paper are predominantly conducted throughout the laminar

2
flow regime. Laminar flow results are compared to the work of Lin et al. [1] to gain an understanding of
the effect of bottom wall temperature on the convective mass transfer coefficient. The heat transfer results
of Lyczkowski et al. [2] and the analogy between heat and mass transfer are used to further verify the
present experimental results. Turbulent flow is also investigated up to a ReD of 8,100, so a direct
comparison to the work of Chuck [3] can be made. In the experiments, the temperature and the relative
humidity of the air are varied so the effect of RaD due to the temperature and vapour density differences
between the surface of the water and the air stream on the convective mass transfer coefficient can be
quantified.
2. Experimental Purpose
The purpose of the experiment is to measure the convective mass transfer coefficient between air
flowing in a rectangular duct and a pan of water that forms the bottom surface of the duct. The duct is part
of a transient moisture transfer (TMT) facility at the University of Saskatchewan, which is designed to
study heat and moisture transfer between air and porous building materials [4-6]. The convective mass
transfer coefficient is an important parameter since it represents the resistance to mass transfer for a
particular geometry and is needed for different airflow rates and air relative humidity conditions. There is
no correlation in the literature that exactly applies to this facility since free convection effects are present
and the airflow is laminar, hydrodynamically fully developed and has thermal and concentration boundary
layers that are developing. In this paper, a correlation is developed specifically for the TMT, but it also
will allow other researchers to more accurately quantify the mass transfer coefficients for their test
facilities that have similar airflow conditions and duct geometry.
3. Experimental Apparatus
The transient moisture transport (TMT) facility is an experimental apparatus that determines the
transient heat and moisture transport properties of porous materials. The test section within the TMT is a
horizontal rectangular duct, where heat and mass transfer occurs at the bottom wall surface. The facility
passes air at varying velocities, temperatures and relative humidity’s above the surface of materials and
measures the change in mass, relative humidity, and temperature in the material as a function of time. To
fully document experimental results for the TMT, the convective mass transfer coefficient of this facility
is required
Mass transfer coefficients are usually determined from experiments based on the adiabatic
evaporation of a liquid [7] and this method is applied in this paper. Since water vapour transfer is the only
form of mass transfer in the TMT facility when experimenting on porous materials, distilled water is used
as the evaporating liquid to ensure that the same Schmidt number (Sc) is present in both experiments. The
convective mass transfer coefficient is determined for the horizontal rectangular duct by measuring the
evaporation rate from a rectangular tray of water that is located in the lower panel of the duct. The vapour

3
density difference between the bulk air stream and the surface of the water is also measured in order to
determine the concentration difference at the surface of the duct.
A side-view and an expanded top-view schematic of the ducting upstream and downstream of the
rectangular test section are shown in Fig. 1(a and b). All of the rectangular ducting shown have a width
(W) of 298 mm. A variable speed vacuum pump supplies a hydrodynamically developed airflow at the
entrance of the test section by means of a developing section upstream of the test section (Fig. 1(a)). First,
the air flows through a 1100 mm long duct that has a constant cross sectional area, which has several
screens installed inside of it to aid in the straightening of the airflow. The air then passes through a 995
mm long converging section that has a convergence angle of 5° to minimize the dynamic losses in the
duct and aid in the development of the flow. Following the converging section, the air enters a 500 mm
long (13.0 Dh) straight duct that delivers the air to the test section. The air then passes through the 765
mm (19.9 Dh) test section (close-up view shown in Fig. 1(c)) and then through a 890 mm (23.2 Dh)
downstream section. The ducts immediately upstream and downstream of the test section have the same
hydraulic diameter as the test section when the evaporation pan is full of water (i.e., h = 0 in Fig. 1(d)).
The side and top views of the test section within the TMT facility are also shown in Fig. 1. A tray
with a water surface width (w) of 280 mm and a length (L) of 600 mm forms the lower panel of the duct
(height (H) = 20.5 mm) in the test section. The air is delivered to the test section from an environmental
chamber that controls the temperature and relative humidity of the air upstream of the test section within
± 0.1°C and ± 2% RH respectively. The temperature and relative humidity of the air is measured
upstream and downstream of the test section with humidity/temperature transmitters. The transmitter’s
temperature is calibrated using a temperature calibrator and have a bias uncertainty of C10. °± .
Calibration of the relative humidity is performed using a humidity generator and a chilled mirror as a
transfer standard, which has a post calibration bias uncertainty of ± 1.0% RH. Since the air is mixed
within the environmental chamber and passes through over 2 m of impermeable and adiabatic ducting
before it reaches the upstream sensor, the humidity and temperature profile at the upstream sensor (and
entering the test section) can be assumed to be uniform. Thus the upstream sensor measures the bulk
mean relative humidity and temperature of the air entering the test section. On the other hand, the
temperature and humidity profiles downstream of the test section will not be uniform and the air must be
mixed to obtain the bulk mean properties. Mixing is especially important when there are significant
temperature and humidity differences between the air entering the test section and the air in contact with
the surface of the water. Mixing is accomplished with the use of a converging duct that is located within
the downstream section. The air is mixed by converging the air from the original duct width of 298 mm
and height of 20.5 mm into a width of approximately 25 mm and height of 15 mm.

4
The temperature of the water is measured with 8 T-Type thermocouples that are located
approximately 2 mm below the surface of the water. The pan is divided into 8 imaginary, equally-sized
square sections and each thermocouple is placed into the center of each section (Fig. 1(b)). The
temperature readings of the thermocouples are within ± 0.1°C of one another and are averaged to
determine the mean surface water temperature. The temperature of the surface of the water is used to
determine the average saturated vapour density above the surface of the water [8]. These thermocouples
are also calibrated and have a bias uncertainty of ± 0.1°C.
500 mm765 mm890 mm 995 mm 1100 mm
Upstream Developing Section
Downstream Section
Water Tray
Fig. 1(a) Side view schematic of the test facility
Fig. 1(b) Top view schematic of the ducting network
Fig. 1(c) Side view schematic of the test section

5
Fig. 1(d) Cross-sectional view schematic of the test section duct
Gravimetric load sensors are used to measure the mass of water that evaporates from the water
during the experiment. Four load sensors located at each corner of the tray give a total load capacity of 8
kg with a bias uncertainty of ± 2 g. This uncertainty is determined by in-situ calibration with calibration
masses.
The test section and the ducting connected to it are insulated to minimize any heat transfer with
the ambient environment. The top cover above the water pan, which creates the top surface of the test
section, is made from 5.08 cm thick polystyrene foam insulation. It is sealed with aluminum foil tape
along its edges to ensure there is no leakage of ambient air into or out of the test section during testing.
The top cover is also lined with aluminum foil tape to prevent absorption of water vapour, and to reduce
the radiative heat transfer between the top cover and the surface of the water. All the ductwork between
the upstream and downstream humidity sensors is lined on the inside with foil tape to prevent the
absorption of water vapour. Therefore any change in humidity and temperature between the upstream and
downstream sensors will be due to moisture and heat transfer between the free water surface and the air
stream.
Located further downstream of the test section is a rectangular to circular transition section that
has a circular duct (D = 72.5 mm) connected to it (not shown in schematics). The circular duct contains a
tapered orifice plate that is located 32D downstream of the transition section, and is used to measure the
mass flowrate of air within the duct. 15 mm and 30 mm tapered orifice plates are used for the laminar and
turbulent flow regimes respectively. The pressure differential across the orifice plate is measured with an
electronic pressure transducer with a full-scale reading of 5 inH2O (1244 Pa) that has a bias uncertainty of
± 0.05 inH2O (12 Pa).
When performing the main experiment to measure the convective mass transfer coefficient, a
range of test conditions are used, but each experimental trial is carried out with constant upstream air
properties: temperature, relative humidity and mass flowrate. The temperature of the air upstream of the
test section is typically 23°C, but three tests are performed with an air temperature of 37°C. The tests
cover a range of air relative humidities from 15% to 80%, and ReD through the test section from 570 to
8,100. Measurements of all temperature, relative humidity and pressure readings are recorded every 5
6
minutes and the mass change of water in the pan is recorded every 20 minutes by a computer controlled
data acquisition system. All measurement data are an average of 100 measurements taken over 0.1 s
intervals at the measured time.
4. Data Reduction and Uncertainty
The main objective of the data reduction is to calculate the independent parameters, Reynolds and
Rayleigh numbers and a non-dimensional development length as well as the dependent parameter,
Sherwood number (ShD), from the experimental data. The 95% confidence intervals for the calculated
independent and dependent parameters are determined according to [9], which include both bias and
precision uncertainty.
4.1 Reynolds Number
The Reynolds number for the experiment is based on the hydraulic diameter of the test section.
The cross-section of the test section is shown in Fig. 1(d). The Reynolds number is given as
P�m4
Ref
D
�= , (1)
where P is the perimeter of the test section duct,
)hH2(WP ++= , (2)
and m� is the mass flowrate of air. µf is the viscosity of dry air because humidity has a small effect (less
than 0.3%) for the conditions in this paper [10]. µf is determined with the Power Law [11] at film
temperature (Tf)
22
TTT
T
21s
f
++
= . (3)
The duct perimeter will vary depending on the average change in height (h) between the top of the pan
and the surface of the water during an experimental trial. During most trials, the average change in the
water height from the full state is 0.5 mm. This change in height results in a 0.2% increase in the
perimeter compared to the full state, which has negligible effect on ReD during an experimental trial, but
is included for completeness. The uncertainty in ReD for the air flow in the experiment is ± 4%, which is
mainly due to the uncertainty in the mass flow rate of the air.
4.2 Rayleigh Number
Temperature and concentration differences exist between the surface of the water and the bulk
airflow. The evaporation process causes the vapour concentration to be highest and the temperature to be
lowest at the surface of the water. The resulting density difference between the air-water vapour mixture
at the surface of the water and in the bulk air stream results in natural convection, which can be quantified
with a Rayleigh number (RaD) defined as

7
Sc�
)D([gRa
2f
3h,sg,g
D��
�
�
��
�
� −= ∞gρρρ
, (4)
where Dh is the average hydraulic diameter of the test section during the test, which varies depending on
the average change in height (h) of water during an experimental trail:
)hHW(2)whWH(4
Dh +++= . (5)
The uncertainty in Dh for this experiment is ± 2%. It should be noted that the change in height (h = 0.5
mm) accounts for a 2% increase in the hydraulic diameter compared to that of the full state. The density
of moist air at the surface of the water ( sg ,ρ ) is based on the sum of the partial densities of water vapour
and dry air at the surface of the water
sasvsg ,,, ρρρ += . (6)
The partial pressure of water vapour at the surface of the water ( sv,p ) is calculated using psychrometrics
[8], where
)(Tpp ssatsv, = . (7)
The partial pressure of air at the surface of the water ( sa,p ) is calculated assuming that the total pressure
(pg) is constant,
sv,gsa, ppp −= . (8)
The total pressure is measured in the laboratory with a mercury barometer during each experimental trial.
The ideal gas law is used to determine sv,ρ and sa,ρ at Ts. The density of moist air in the ambient ( ∞,gρ )
is a measure of the average of the inlet and outlet densities,
2g,21,
,
ρρρ
+=∞
gg . (9)
With the use of the ideal gas law and the measurements of the relative humidity and dry bulb
temperatures upstream and downstream of the test section, the water vapour and dry air densities are
determined at these two locations. The partial pressure of water vapour is determined by:
)(Tpp isatiiv, φ= , (10)
iv,gia, ppp −= , (11)
where i = 1 at the inlet and i = 2 at the outlet of the test section. The mean mixture density of air in the
boundary layer ( gρ ) is
2,, ∞+
= gsgg
ρρρ . (12)

8
The bias uncertainty in RaD is ± 8%, which is mainly due to the uncertainty in Dh.
4.3 Inverse Graetz Number
A dimensionless axial distance (X*) in the flow direction for the entrance region is typically specified as
the inverse of the Graetz number (Gz). For mass transfer,
Gz1
ScReDL
X*Dh
== . (13)
The concentration boundary layer is considered to be developing for X* < 0.05, and in this paper the
maximum value of X* is 0.04. The bias uncertainty in X* is ± 5%.
4.4 Sherwood Number
The Sherwood number (ShD) is based on the hydraulic diameter of the test section (Eq. (5)) and is
determined from the measured data.
AB
hmD D
DhSh = , (14)
where the convective mass transfer coefficient (hm) depends on the measured evaporation rate of water
( evapm� ), the surface area of the pan (As = wL), and the log mean vapour density difference ( vρ∆ ) between
the bulk air and the surface of the water.
vρ∆=
s
evapm A
mh
�
(15)
)]/()ln[(
)()(
1,,2,,
1,,2,,
vsvvsv
vsvvsvv ρρρρ
ρρρρρ
−−−−−
=∆ (16)
The binary diffusion coefficient (DAB) for water vapour in air depends on Tf and pg and is calculated from
[8]. The 95% confidence intervals for ShD are strongly dependent on the log mean density difference
between the air and the water ( vρ∆ ), and the evaporation rate ( evapm� ). For the range of test conditions in
this paper, evapm� and vρ∆ have bias uncertainties in the range of ± 1% to ± 5% and ± 2% to ± 8%
respectively, resulting in bias uncertainties in ShD of ± 3% to ± 9%.
4.5 Mass and Energy Balances across the Test Section
In any experiment, it is important to verify that mass and energy are conserved. Applying the
basic principles of conservation of mass and energy over a control volume can help determine how well
the experiment is setup to measure heat and mass transfer, and identify bias errors in the experiment. It is
important that mass and energy balances are satisfied within experimental uncertainties. If the mass and
energy balances are not satisfied within the experimental uncertainties, systematic errors exists within the

9
experiment, such as heat and mass transfer with the ambient environment or improper setup of the
experiment and instruments, or the measurement uncertainties have been underestimated.
As noted previously, it is essential to mix the air leaving the test section to accurately measure the
bulk relative humidity and temperature. In the experiment, the evaporation of water from the tray is
measured using load sensors and the change in humidity of the air stream is measured with humidity
sensors. By comparing the evaporation measured with the load sensors to the moisture gained by the air
as it travels through the test section, as measured by the humidity sensors, the adequacy of the mixing
section downstream of the test section (Fig. 1(b)) can be determined. The mass balance is satisfied within
the experimental uncertainties for all tests when the mixing section is used and when the humidity of the
air entering the test section (φ1) exceeds 80% RH regardless of whether the mixing section is used or not.
When φ1>80% RH, the water vapour density difference between the surface of the water and the airstream
entering the test section is small and the downstream mixing section has a small effect on the results
because the vapour density is quite uniform in the boundary layer. On the other hand, the mass balance is
not satisfied within the experimental uncertainty when the mixing section is not used and φ1<80% RH.
The bias uncertainty in the evaporation rate determined using load sensors (1 to 5%) is as much as 10
times lower than the bias uncertainty in the evaporation rate determined using the measured humidity and
temperature difference between the inlet and outlet air streams. Therefore, the outlet conditions can be
accurately calculated by applying mass and energy balances across the test section using the evaporation
rate measured by the load sensors. If the outlet temperature and relative humidity conditions of the
airstream are calculated in this way, ShD changes by less than ± 4% compared to the case where ShD is
determined using the outlet conditions measured downstream of the mixing section. This is within the
experimental uncertainty and verifies the energy and mass balances in the experiment. A similar good
agreement exists for the tests when φ1>80% RH with or without the mixing section. In the tests where the
mixing section is not used, ShD is as much as ± 16% different when using the calculated and measured
outlet air temperature and humidities. As this is outside the 95% confidence limits for this experiment, it
indicates a systematic error when a mixing section is not used.
About half of the tests were performed without the mixing section and with φ1<80% RH,
resulting in mass balances outside the experimental uncertainty. Instead of rejecting these data, a ShD
based on the calculated outlet air conditions is used for these experiments. The bias uncertainty associated
with this calculation increases the uncertainty in ShD by 1 to 6% (depending on the vapour density
difference between the air and the water surface) and is included in the reported uncertainty values.
A measure of the importance of the energy transport through mass diffusion relative to that
through thermal diffusion is represented by S* [1,12], where

10
Tk
WhDS*
g
fgABg
∆∆ρ
= . (17)
S* is a result of simultaneous heat and mass transfer due to the evaporation process, which varies
throughout the experiment depending on the conditions of the air entering the test section. This
dimensionless parameter is similar to the dimensionless operating condition factor [13,14]
�T�W
2500H* = , (18)
where
1s WW�W −= (19)
1s TT�T −= , (20)
and the coefficient (2500) has units of kgK/kg. H* accounts for the coupling between heat and moisture
transfer and varies between -3.6 and -1.4 for the experimental conditions in this paper. The differences
between H* calculated with Eq. (18) and S* calculated with Eq. (17) are less than ± 0.3, and the small
differences are mainly due to the constant properties used in calculating the coefficient of 2500 kgK/kg in
Eq. (18). Since H* is an important parameter when correlating the effectiveness of air-to-air energy
exchangers [13,15], it will be used in this paper as well to correlate ShD and show the effect of operating
conditions on the convective mass transfer coefficient.
5. Results and Discussion
The effects of the relative humidity of the airflow on the convective mass transfer coefficients (hm
and β) are shown. A summary of the ShD data obtained for a range of test conditions as well as the
correlations developed from this data are provided. Comparison to data in the literature are also provided.
5.1 Laminar Flow
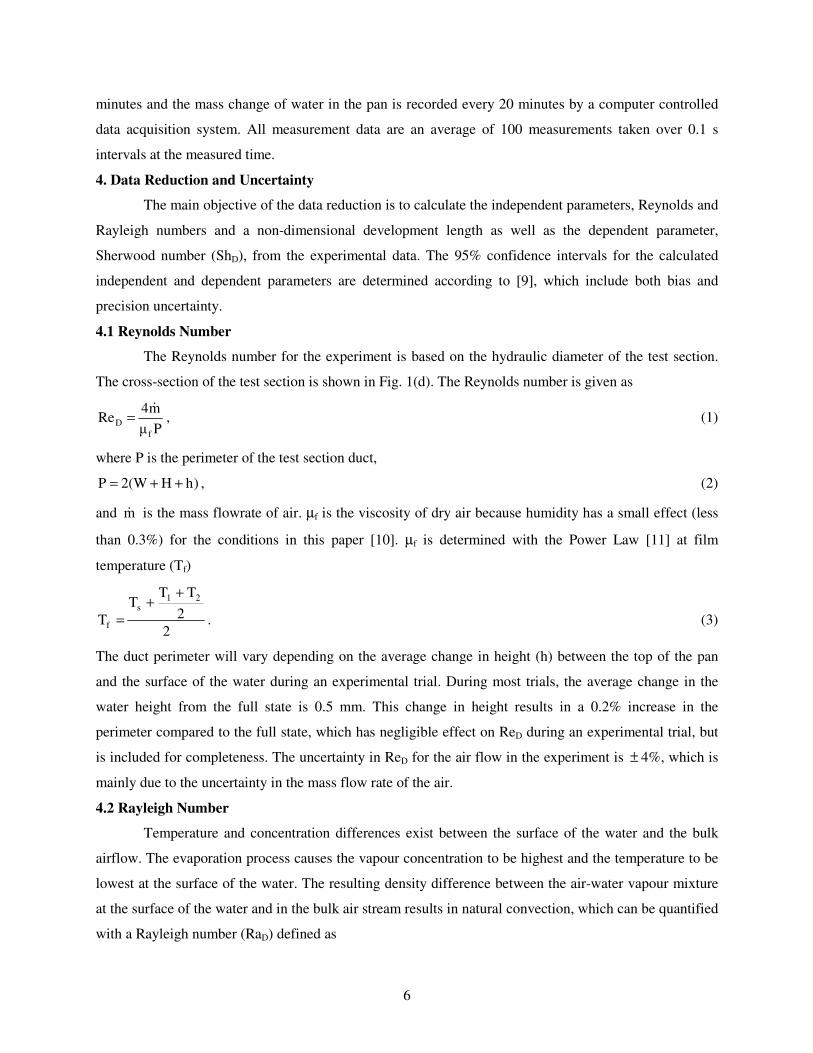
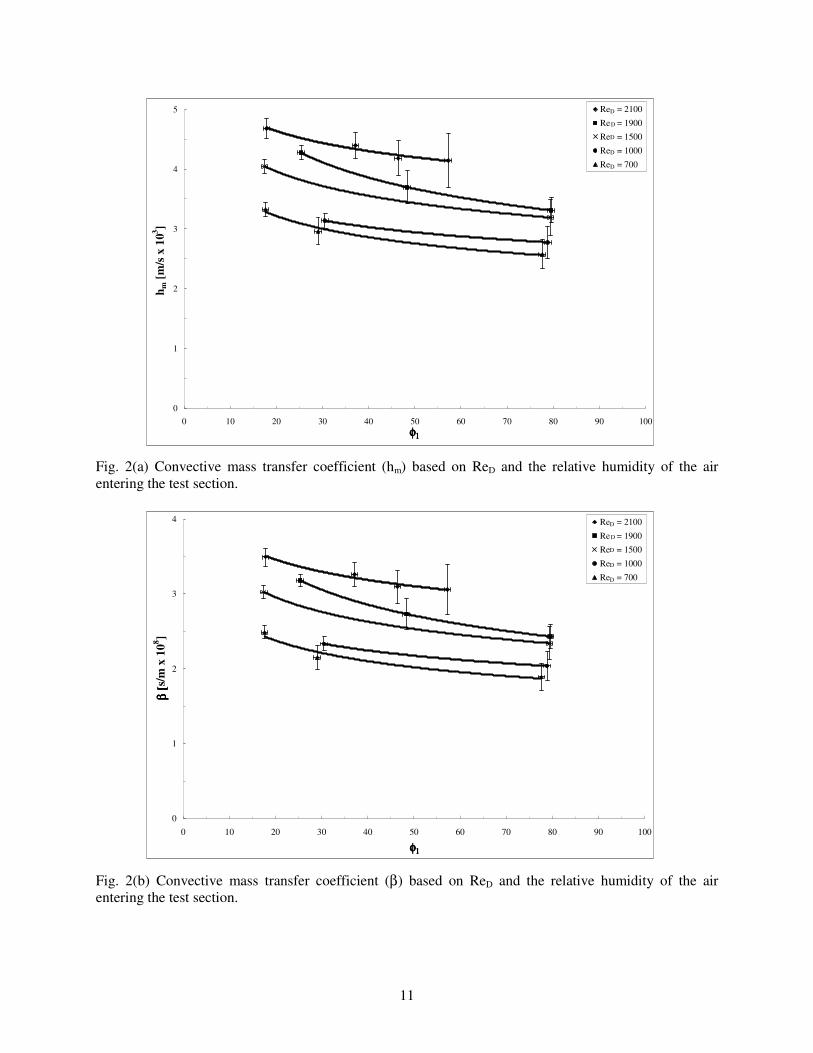
Figure 2(a and b) present the convective mass transfer coefficients, hm (m/s) and β (s/m) for a
range of ReD and air relative humidity. The convective mass transfer coefficients decrease when the
relative humidity of the air entering the test section is increased. The convective mass transfer coefficients
can change as much as 35% when the air relative humidity varies from 18 to 80% RH. To fully capture
the effects of the relative humidity on the convective mass transfer coefficient, RaD (Eq. (4)) and H* (Eq.
(18)) are used, which take into account the temperature and relative humidity of the air at the surface of
the water and in the bulk airflow. The convective mass transfer coefficient (hm) is non-dimensionalized
with the use of ShD, and this data is presented in Fig. 1(c).
11
0
1
2
3
4
5
0 10 20 30 40 50 60 70 80 90 100
h m [m
/s x
103 ]
Re = 2100
Re = 1900
Re = 1500
Re = 1000
Re = 700
D
D
D
D
D
φφφφ1111
Fig. 2(a) Convective mass transfer coefficient (hm) based on ReD and the relative humidity of the air entering the test section.
0
1
2
3
4
0 10 20 30 40 50 60 70 80 90 100
φφφφ1111
β [
β [
β [
β [s
/m x
108 ]
Re = 2100
Re = 1900
Re = 1500
Re = 1000
Re = 700
D
D
D
D
D
Fig. 2(b) Convective mass transfer coefficient (β) based on ReD and the relative humidity of the air entering the test section.

12
0
1
2
3
4
5
6
7
8
9
0 10 20 30 40 50 60 70 80 90 100φφφφ1111
ShD
Re = 2100
Re = 1900
Re = 1500
Re = 1000
Re = 700
D
D
D
D
D
Fig. 2(c) Sherwood number based on ReD and the relative humidity of the air entering the test section.
The ShD is determined for laminar flow between a ReD of 570 and 2,100, which corresponds to a
X* between 0.011 and 0.037, and a RaD of 6,300 and 83,000 (0.003 < Grm/ReD2 < 0.2), and is presented in
Figs. 3 and 4. Figure 3 shows a general trend of increasing ShD as ReD increases (X* decreases), which is
expected [16] since the length of the test section is not long enough for the temperature and concentration
boundary layers to become fully developed. As ReD increases, the thermal and concentration boundary
layers become thinner and less developed over the surface of the water. A thinner boundary layer results
in a larger concentration gradient at the surface of the water, which contributes to an increase in forced
convection mass transfer at the surface of the water.

13
0
1
2
3
4
5
6
7
8
9
0.01 0.1X*
ShD
Fig. 3 Laminar flow results of Sherwood number for a range of X* and Rayleigh numbers (RaD) for all the experimental tests
Figure 3 also shows that there is a large variation in ShD and the uncertainty in ShD for a given
X*. The values of ShD range from 4 to 8 and the total uncertainties in ShD range from ± 3% to ± 13%
with only 6 (out of 35) values exceeding ± 10%. This scatter is a result of each data point having a unique
RaD associated with it. Since the temperature of the water is not controlled during the experiments, but is
dependent on the phase change rate, RaD cannot be precisely controlled from one experimental trial to the
other. To determine if ShD is dependent on RaD, Fig. 4 shows four curve fits to data points over a small
range of RaD. The data points for a range of RaD are within ± 10% of the average RaD for that range.

14
0
1
2
3
4
5
6
7
8
9
0.01 0.1X*
ShD
58,500 < Ra < 62,700
52,200 < Ra < 55,700
16,600 < Ra < 17,400
6,300 < Ra < 7,300
D
D
D
D
Fig. 4 Laminar flow results of Sherwood number for a range X* and Rayleigh numbers (RaD) for specific ranges of RaD, where the variation in RaD is less than ± 10% in each group.
The data in Fig. 4 shows that as RaD increases, ShD increases and the uncertainty in ShD
decreases. RaD increases as the moist air (air-water vapour mixture) density difference between the bulk
airflow and that at the surface of the water increases (Eq. (4)). In this experiment, the density of the moist
air at the surface of the water is always larger than that of the bulk airflow, since the water temperature is
always less than the bulk airflow temperature, which causes a buoyancy-driven downflow from the air
towards the surface of the water [17]. Sparrow et al. [17] found that this type of downward airflow
dominated the evaporation of water from circular pans when the water temperature was less than the
ambient air temperature. As the relative humidity of the air delivered to the test section decreases for a
constant X*, the temperature at the surface of the water also decreases, and RaD increases. For the tests in
this paper, the water temperature is 1-14°C colder than the bulk air temperature, depending on the relative
humidity, temperature and ReD of the airflow. This effect on RaD suggests that evaporation is greater with
dry air than with humid air [12,18]. The combined effects of natural convection and the effectiveness of
the relative humidity of the airflow on the evaporation process influences the convective mass transfer
coefficient and these effects are represented well by RaD.
From the experimental data, it is found that ShD has a dependence on X* and RaD. A curve fit to
the data shown in Fig. 3 results in

15
0.334
0.124D
D*X
Ra0.417Sh = , (21)
where r2 = 0.90 and 95% of the experimental data falls within ± 10.0% of the correlated line.
As noted previously, the temperature and humidity of the air entering the test section influences
RaD as well as S* (Eq. (17)) and H* (Eq (18)). Therefore, the temperature and humidity of the airflow
cannot be neglected for simultaneous heat and moisture transfer. In fact, it is equally possible to correlate
ShD with H* (or S*). The correlation that results is
0.3710.308D *H*X2.11
Sh = , (22)
which is valid over a range of -3.6 < H* < -1.4. Equation (22) fits the experimental data with an r2 of 0.89
and 95% of the experimental data falls within ± 9.4%.
In order to increase confidence in the experimental data (Fig. 3) and correlation Eq. (21), they are
compared with data in the literature in Figs. 5 and 6. Figure 5 shows a reasonable agreement between the
numerical results of Lin et al. [1] and the present work. However, ShD calculated by Lin et al. [1] is
slightly larger than ShD measured in this paper for the same value of RaD. The reason for the higher ShD in
[1] is that the numerical results were determined for evaporation from heated water rather than cooled
water as in the current experiment. The heated water creates an upward natural convection airflow which
results in a greater convective transfer coefficient. This is well known for free convection heat transfer
from the top surface of a heated plate [16] and therefore Fig. 5 helps confirm the validity of the
correlation developed in this paper (Eq. (21)).

16
0
1
2
3
4
5
6
7
8
9
0.01 0.1X*
ShD
Lin [1]Eq. (21)Uncertainty in Eq. (21)
Fig. 5 Comparision of the ShD determined in this paper with Lin et al. [1] when RaD = 35,300
Another useful comparison is to compare the measured mass transfer coefficients with heat
transfer coefficients from the literature using the analogy between heat and mass transfer with
1/3
DD PrSc
NuSh ��
�
�= . (23)
The study in the literature that most closely represents the current experiment is a numerical study of
laminar flow forced convection heat transfer within a heated rectangular duct [2]. The flow is
hydrodynamically developed and thermally developing, but natural convection is neglected. To compare
the results for one heated wall based on the ½ height of the duct, the Nusselt number in [2] must be
converted to a Nusselt number based on the hydraulic diameter by multiplying the former by )�/11/(4 + .
A comparison between the predicted mass transfer results of [2] and the present study are given in
Fig. 6. It is shown that the results of [2] are within the range of measured Sherwood numbers, and
compare well at the upper range of Rayleigh numbers. This comparison shows that the work of [2] does
predict ShD within the range of experiment results, but the effects of RaD are not accounted for. By
neglecting the effects of RaD, the error in ShD can be up to 30%.

17
0
1
2
3
4
5
6
7
8
9
0.01 0.1X*
ShD
58,500 < Ra < 62,700
52,200 < Ra < 55,700
16,600 < Ra < 17,400
6,300 < Ra < 7,300
Lyczkowski [2]
D
D
D
D
Fig. 6 Comparision of the ShD determined in this paper with Lyczkowski et al. [2]
5.2 Turbulent Flow
Turbulent flow experiments are performed in order to develop a relationship for ShD that includes
both developing flow (X*) and buoyancy forces (RaD), and also to further verify the experiments by
comparing to an experiment in the literature [3], which is for turbulent flow. The turbulent flow data of
the present work covers a range of ReD between 3,100 and 8,100, and RaD between 20,900 and 46,000.
The various RaD are created by the air relative humidity between 15% RH and 60% RH at a constant air
temperature of 23°C. The results in Fig. 7 show that as RaD increases, ShD increases. The contribution of
natural convection compared to that of forced convection is measured by Grm/ReD2. It is found that this
ratio is approximately 20 times less than that for the laminar flow experiments, which suggests that the
contribution of natural convection evaporation is smaller in the presence of forced convection turbulent
flow than in laminar flow. Nevertheless, the effects of RaD exists and the experimental data in the
turbulent region are correlated with X* and RaD, which results in
0.725
0.311D
D*X
Ra0.012Sh = , (24)
where r2 = 0.98, and 95% of the data falls within ± 7.1% of the correlated line.
If H* is correlated with the experimental results,

18
0.4940.719D *H*X0.382
Sh = , (25)
which is valid over a range of -2.1 < H* < -1.4. Equation (25) fits the experimental data with an r2 of 0.99,
and 95% of the experimental data falls within ± 3.5%. The curve fit of Eq. (25) has better agreement than
Eq. (24), which suggests that for turbulent flow, the operating condition factor (H*) may be a better fitting
parameter than RaD.
Experimental data of [3] is shown in Fig. 7 for test section lengths of 12.5 cm and 27.9 cm at a
ReD of 7,200 and 10,700. Since the data of [3] are for step heights (h) ranging from 3.8 mm to 15.2 mm,
the experimental results of [3] are extrapolated to h = 0 mm for comparison to the present work. Even
though the average h in the present work is 0.5 mm, there is no seen effect on ShD when neglecting this
small height drop in the pan of water. A linear decreasing ShD with increasing X* for both studies
confirms that the concentration boundary layers within the ducts are not fully developed. A curve fit of
the data in [3] fits well with the present work, especially for the larger range of RaD (35,000 - 46,000).
The testing conditions for the larger range of RaD occurs when 15% < φ1 < 30%, and the testing
conditions of [3] are within this range.
0
5
10
15
20
25
30
35
40
45
50
0.0001 0.001 0.01X*
ShD
Chuck [3]35,000 < Ra < 46,00020,900 < Ra < 30,800Log. (Chuck [3])
D
D
Fig. 7 Comparision of the ShD determined in this paper with Chuck [3].

19
6. Conclusions
Combined forced and natural convection evaporation from a filled pan situated in the lower panel
of a rectangular duct is investigated experimentally. Mass transfer measurements are made for a
hydrodynamically developed airflow with developing concentration and thermal boundary layers. The
effects of forced convection evaporation is investigated by varying the velocity of the air passing through
the duct in the laminar and turbulent flow regimes between a ReD of 570 and 8,100. The effect of the
density difference between the bulk flow and the air at the surface of the water is determined for RaD
between 6,300 and 83,000. The convective mass transfer coefficient is dependent on the strength of
natural convection, as well the temperature and humidity of the bulk airflow. The effect of the
temperature and humidity of the air stream can be accounted for using the operating condition factor H*
or S*, which are a ratio of the heat and moisture transfer potentials in the experiment. A correlation for
ShD as a function of X* and RaD is developed to account for the effects of forced and natural convection
as well as entrance region effects on the evaporation process for laminar and turbulent airflow. The
correlation in the laminar flow region is 334.00.124DD */X0.417RaSh = with a 95% confidence limit of
± 10.0%, and the correlation in the turbulent flow regime is 0.7250.311DD */X0.012RaSh = , with a 95%
confidence limit of ± 7.1%.
The experimental data in this paper compares favourably to numerical and experimental data in
the literature. These comparisons show that the magnitude and direction of heat and mass transfer affect
ShD. ShD is always larger when the surface of the duct is heated above that of the air, than when it is
cooled below the temperature of the air. Therefore, this paper extends the literature for the case of a
cooled water surface. The comparisons also show that it is possible to use NuD data from the literature
together with the analogy between heat and mass transfer to estimate ShD. However, such an estimate can
have errors as large as 30% if the effects of the temperature and humidity conditions of the air and
resulting RaD are not accounted for. The turbulent flow experiments presented in this paper compare well
with a similar experiment in the literature [3]. The experimental data in this paper extends the data for
different operating conditions, RaD as well as larger values of X*.
Acknowledgment
The authors gratefully acknowledge the University of Saskatchewan, CFI and NSERC SRO for the
financial support of the present study.
References
[1] J.N. Lin, P.Y. Tzeng, F.C. Chou, W.M. Yan, Convective instability of heat and mass transfer for
laminar forced convection in the thermal entrance region of horizontal rectangular channels, Int. J.
Heat and Fluid Flow 13 (3) (1992) 250-258.

20
[2] R.W. Lyczkowski, C.W. Solbrig, D. Gidaspow, Forced convection heat transfer in rectangular ducts
– General case of wall resistance and peripheral conduction for ventilation cooling of nuclear waste
repositories, Nuclear Engineering and Design 67 (3) (1981) 357-378.
[3] W. Chuck, Evaporation of water from a recessed surface to a parallel forced convection airflow,
Ph.D. thesis, Department of Mechanical Engineering, University of Minnesota, Minneapolis, MN,
1985.
[4] S.O. Olutimayin, C.J. Simonson, Measuring and modeling vapor boundary layer growth during
transient diffusion heat and moisture transfer in cellulose insulation, Int. J. Heat Mass Transfer 48
(2005) 3319-3330.
[5] F.O. Osanyintola, Transient moisture characteristics of spruce plywood, M.Sc. thesis, Department of
Mechanical Engineering, University of Saskatchewan, Saskatoon, SK, Canada, 2005,
(http://library.usask.ca/theses/available/etd-12222005-082100).
[6] S.O. Olutimayin, Vapor boundary layer growth during transient heat and moisture transfer in
cellulose insulation, M.Sc. thesis, Department of Mechanical Engineering, University of
Saskatchewan, Saskatoon, SK, Canada, 2004.
[7] A. Kondjoyan, J.D. Daudin, Determination of transfer coefficients by psychrometry, Int. J. Heat
Mass Transfer 36 (7) (1993) 1807-1818.
[8] ASHRAE, Fundamentals Handbook 2005, ASHRAE, Atlanta.
[9] ANSI/ASME PTC 19.1 – 1998, Test Uncertainty, ASME, New York.
[10] A. Wexler, W.A. Wildhack, Humidity and Moisture: Measurement and Control in Science and
Industry, Vol. 3, Reinhold, New York, 1965, pp. 257-272.
[11] F.M. White, Fluid Mechanics, fourth ed., McGraw-Hill, Boston, 1999, pp. 771.
[12] J.H. Jang, W.M. Yan, C.C. Huang, Mixed convection heat transfer enhancement through film
evaporation in inclined square ducts, Int. J. Heat Mass Transfer 48 (2005) 2117-2125.
[13] C.J. Simonson, R.W. Besant, Energy wheel effectiveness: Part I - Development of dimensionless
groups, Int. J. Heat Mass Transfer 42 (12) (1999) 2161-2170.
[14] L.Z. Zhang, J.L. Niu, Effectiveness correlations for heat and moisture transfer processes in an
enthalpy exchanger with membrane cores, J. Heat Transfer-Trans. ASME 124 (5) (2002) 922–929.
[15] C.J. Simonson, R.W. Besant., Energy wheel effectiveness: Part II − Correlations, Int. J. Heat Mass
Transfer, 42 (12) (1999) 2171-2185.
[16] F.P. Incropera, D.P. Dewitt, Fundamentals of Heat and Mass Transfer, fifth ed., John Wiley & Sons,
New York, 2002, pp. 465-531.
[17] E.M. Sparrow, G.K. Kratz, M.J. Schuerger, Evaporation of water from a horizontal surface by
natural convection, J. Heat Transfer, Transactions ASME 105 (3) (1983) 469-475.

21
[18] C.C. Huang, W.M. Yan, J.H. Jang, Laminar mixed convection heat and mass transfer in vertical
rectangular ducts with film evaporation and condensation, Int. J. Heat Mass Transfer 48 (2005)
1772-1784.
Nomenclature
As area of evaporating surface [m2]
D inside diameter of circular duct [m]
DAB binary mass diffusion coefficient [m2/s]
Dh hydraulic diameter of rectangular duct [m]
g gravitational acceleration [m2/s]
Grm mass transfer Grashof number [RaD/Sc]
Gz Graetz number
H height of rectangular duct [m]
H* dimensionless operating condition factor that represents the ratio of latent to sensible energy
differences between the air stream and the air in equilibrium with the water surface
hfg enthalpy of vaporization [J/kg]
h average distance between the water surface and top of pan [m]
hm convective mass transfer coefficient [m/s]
k thermal conductivity [W/mK]
L length of water pan [m]
evapm� evaporation rate of water [kg/s]
m� mass flowrate of air [kg/s]
NuD Nusselt number (based on the hydraulic diameter of the duct)
P duct perimeter [m]
p pressure [Pa]
Pr Prandtl number
psat saturated water vapour pressure [Pa]
r2 correlation coefficient
RaD Rayleigh number (based on the hydraulic diameter of the duct)
ReD Reynolds number (based on the hydraulic diameter of the test section duct)
RH relative humidity
S* dimensionless parameter that represents the ratio between mass and heat transfer, (Eq. (19))
Sc Schmidt number
ShD Sherwood number (based on the hydraulic diameter of the test section duct)

22
T temperature [K]
∆T temperature difference between the surface of the water and the air entering the test section [K]
W width of duct [m]
∆W humidity ratio difference between the surface of the water and the air entering the test section
(Ws-W1) [kg/kg]
w width of water pan [m]
X* a dimensionless coordinate parallel to flow equivalent to Gz-1
Greek symbols
� aspect ratio = W/H
β convective mass transfer coefficient [s/m]
ρ density [kg/m3]
µ dynamic viscosity [Ns/m2]
vρ∆ log-mean water vapour density difference [kg/m3]
ρ mean mixture density of air [kg/m3]
φ relative humidity of the ambient air
Subscripts
1 bulk properties of air entering the test section
2 bulk properties of air leaving the test section
a dry air properties
f average properties in the boundary layer
g moist air property including dry air and water vapour
i is an index where i = 1 at the inlet and i = 2 at the outlet of the test section
∞ average properties across the test section
s properties at the surface of the water
v water vapour


