Embed Size (px)
Citation preview

ControLyo™ Technology and TDLAS in Commercial Manufacturing as a QBD tool supporting scale upApplication of scalable tools to aid process development in scale up, and batch
recovery by scale down
PDA Europe
Event
City/Country, Day Month Year
Ian Whitehall
CMO
SP Scientific

ICH Q11 - Development and
Manufacture of Drug Substances
Summary Statement of ICH Q11 guidance:
Identifying potential CQAs associated with the drug substance so that those characteristics having an impact on drug product quality can be studied and controlled
Defining an appropriate manufacturing process
Defining a control strategy to ensure process performance and drug substance quality

Importance of PAT
Enhance understanding of critical product attributes which can impact over final quality
Characterize product temperature profile and product resistance during development and scale up
Rationalize information in product life cycle management and quality decision
Regulatory expectation - PAT – A Framework for Innovative Pharmaceutical Development, Manufacturing and Quality Assurance (FDA Guidance for Industry)
4
ControLyo is Quality by Design

ControLyo™ Technology
Manufacturing Adoption
40 SP LyoStar3 R&D freeze dryers with ControLyo™ technology in use world wide
Commercial Units:
Evaluation of production batch for stability study in human injectable products
Use in commercial manufacturing for animal health products
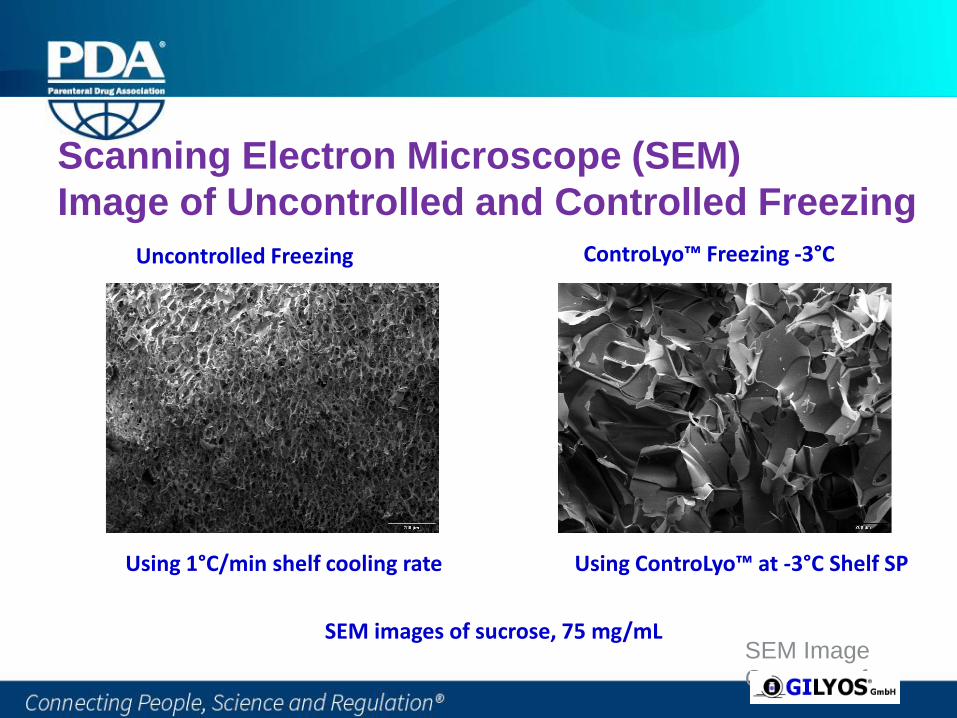
Scanning Electron Microscope (SEM)
Image of Uncontrolled and Controlled Freezing
Using 1°C/min shelf cooling rate
Uncontrolled Freezing
Using ControLyo™ at -3°C Shelf SP
ControLyo™ Freezing -3°C
SEM images of sucrose, 75 mg/mLSEM Image
Courtesy of

ControLyo™ in a Manufacturing Environment
Scalability in freeze dryers of any size
Increases product consistency and uniformity
Less vial damage
Reduces cycle times and improves product yield
Technology Differentiator – added capabilities
Robust, non-invasive, and easily implemented/maintained
Conforms to regulatory expectation

Recent Work Using ControLyo™
“Application of controlled nucleation during lyophilization to improve cake appearance and product quality” – SP Webinar by Dr. Stuart Wang, (formerly of Biogen IDEC)
“Impact of controlled ice nucleation on process performance and quality attributes of a lyophilized monoclonal antibody”, FDA, Awotwe-Otoo, D., Agarabi, C., Read, E., Lute, S., & Borson, K. (2013), International Journal of Pharmaceutics, 450(1-2), 70–78.
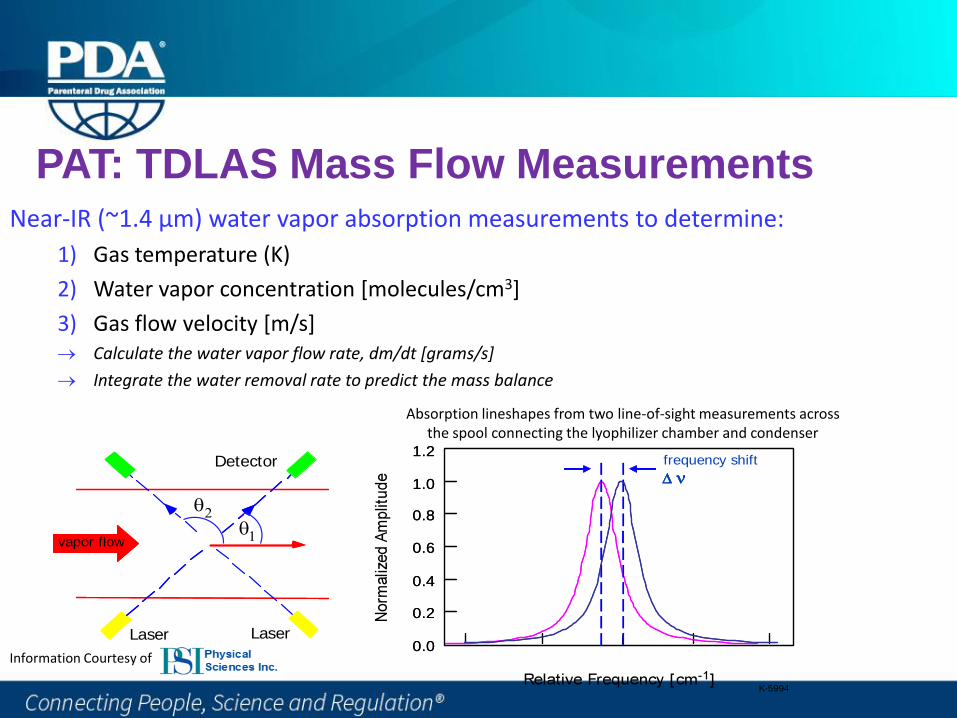
PAT: TDLAS Mass Flow MeasurementsNear-IR (~1.4 µm) water vapor absorption measurements to determine:
1) Gas temperature (K)
2) Water vapor concentration [molecules/cm3]
3) Gas flow velocity [m/s] Calculate the water vapor flow rate, dm/dt [grams/s]
Integrate the water removal rate to predict the mass balance
vapor flow
1.2
1.0
0.8
0.6
0.4
0.2
0.0-0.4 0.4-0.2 0.20.0
vapor flow
Laser
Detector1.2
1.0
0.8
0.6
0.4
0.2
0.0-0.4 0.4-0.2 0.20.0
frequency shift
Laser
K-5994
Absorption lineshapes from two line-of-sight measurements across the spool connecting the lyophilizer chamber and condenser
Information Courtesy of
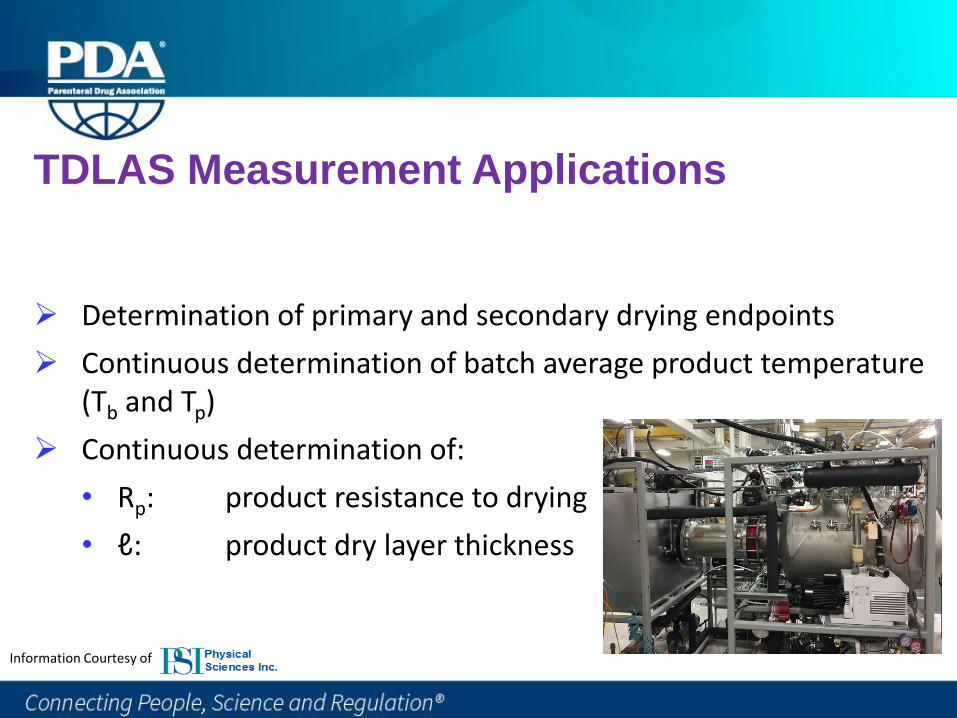
TDLAS Measurement Applications
Determination of primary and secondary drying endpoints
Continuous determination of batch average product temperature (Tb and Tp)
Continuous determination of:
• Rp: product resistance to drying
• ℓ: product dry layer thickness
Information Courtesy of

Determination of Primary and Secondary
Drying Endpoints
0.0E+00
5.0E+14
1.0E+15
1.5E+15
2.0E+15
2.5E+15
3.0E+15
2/3/2017
15:00
2/4/2017
3:00
2/4/2017
15:00
2/5/2017
3:00
2/5/2017
15:00Date/Time
[H2O
] (m
olec
ules
/cm
3)
0.0E+00
5.0E-04
1.0E-03
1.5E-03
2.0E-03
2.5E-03
3.0E-03
3.5E-03
4.0E-03
4.5E-03
5.0E-03
Mas
s Fl
ow (g
/s)
Primary Drying Secondary Drying
0.0E+00
5.0E+14
1.0E+15
1.5E+15
2.0E+15
2.5E+15
3.0E+15
2/3/2017 15:00 2/4/2017 3:00 2/4/2017 15:00 2/5/2017 3:00 2/5/2017 15:00
Date/Time
[H2
O] (
mo
lecu
les/
cm3
)
0
50
100
150
200
250
300
350
Inte
gra
ted
H2
O R
em
ove
d (
g)
[H2O] Integrated H2O Removed
[H2O] & Integrated H2O Removed
SMART FD Cycle
5% sucrose formulation
3 mL fill
20 mL vials
112 vials
Data spikes: TDLAS data recorded during MTM-based SMART experiment
Information Courtesy of

Pilot Scale FD Batch Product Temperature
Average
Weighted average thermocouple temperature (for edge and center vials) was calculated for comparison with TDLAS Tb. EV: Edge vials; CV: Center vials; TC: Thermocouple. Kv 2.90 x 10⁻⁴ cal/sec.cm2.K, N= 1620, Av: 7.17 cm2, ΔHs: 660 cal/sec.
Kv scaled from lab FD measurements: emissivity & edge vial ratioInformation Courtesy of

Continuous Determination of Product
Resistance and Ice Thickness
0.0
0.1
0.2
0.3
0.4
0.5
0.6
0.7
0.8
0.9
1.0
0
5
10
15
20
25
30
0 5 10 15 20 25 30 35
Ice
Thic
knes
s (cm
)
Prod
uct R
esis
tanc
e, R
p (c
m-2
-Tor
r-h-
g-1)
Process Time (hrs)
Rp L-ice
-50
-45
-40
-35
-30
-25
-20
0.0E+00
5.0E+14
1.0E+15
1.5E+15
2.0E+15
2.5E+15
3.0E+15
3.5E+15
0 5 10 15 20 25 30 35
Prod
uct T
empe
ratu
re, T
p (C
)
Wat
er C
once
ntra
tion,
[H2O
] (m
olec
ules
cm
-3)
Process Time (hrs)
[H2O] Tp
[H2O] & Product Temperature
Information Courtesy of
TDLAS Application in QbD
PAT tool providing key data for QbD based drying cycle development by determination:
– Vial heat transfer coefficient (Kv)
– Product dry layer resistance (Rp)
– FD capability limits: Onset of choked flow
Assessment of drying heterogeneity: prediction of # of vials completing 1o drying
Applicable to all freeze dryer sizes enabling scale up experiments and technology transfer
Information Courtesy of

Construction of Design Space
TDLAS Determination of:• Kv: vial heat transfer coefficient• Rp: product resistance to drying• FD equipment limit: choked flowInformation
Courtesy of

Kv Determination With Changing Chamber
Pressure
Kuu,W.Y., Nail, S.L., Sacha, G., Rapid Determination of Vial Heat Transfer Parameters Using Tunable Diode Lase Absorption Spectroscopy (TDLAS) in Response to Step-Changes in Pressure Set-Point During Freeze –Drying, J Pharm Sci, 98(3) 2009.
Information Courtesy of

Sample Kv Data Using TDLAS Measurement
Use of TDLAS enables generation of this table in one experiment
Gravimetric approach requires one experiment per pressure level (12 experiments)
Information Courtesy of

Scale up to Production Freeze Dyer
Opportunity for use of TDLAS
Lab scale QbD-based cycle development: knowledge & design space
– Determination of vial heat transfer coefficient, Kv
– Determination of product resistance to drying, Rp
– Establishment of FD equipment limitation: choked flow measurements
Production Scale QbD Based Cycle Modifications
Commercial scale QbD-based cycle development: knowledge & design space– Evaluate freeze dryer limitation: choked flow measurements
– Adjust lab scale dryer Kv for production dryer
Scale by differences in ratio of center/edge vials and shelf & wall emissivities
– Re-evaluate design space using adjusted Kv and lab scale Rp
– Freeze dry demonstration batch using modified cycle design with data from batch (Rp)
Verify design space with measured values: dm/dt & Tp
Confirm new cycle design with second demonstration batch


22
144FXS chamber
Clean Room Wall
Isolator
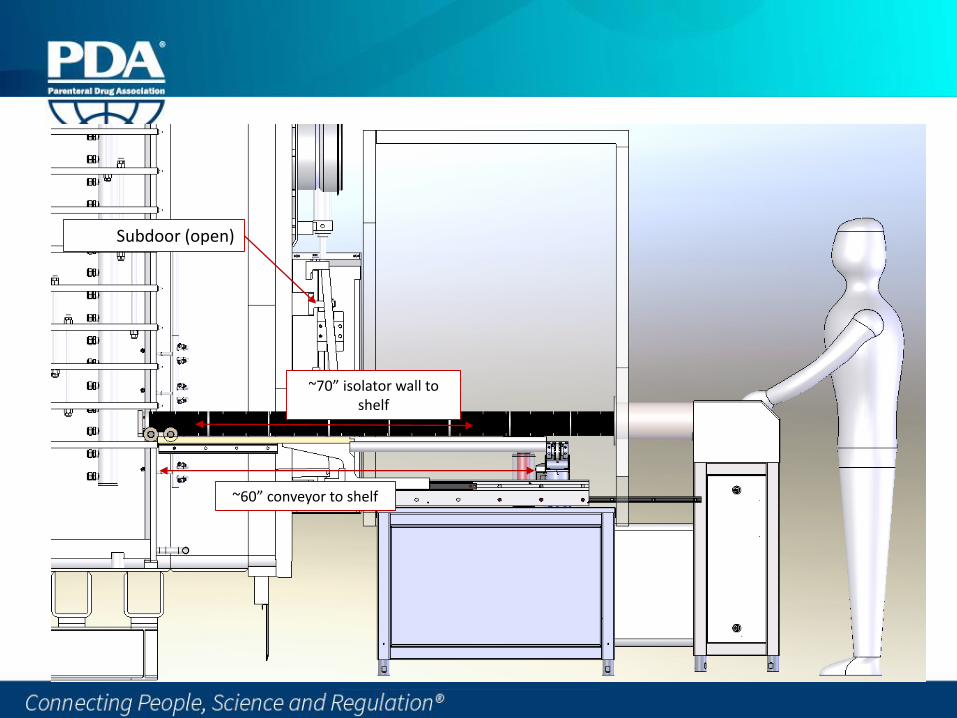
~70” isolator wall to shelf
Subdoor (open)
~60” conveyor to shelf
In Summary
Process control and PAT tools facilitate the QbD approach and conforms to regulatory expectations
ControLyo™ technology is gaining more commercial manufacturing adoption in the industry
Controlled nucleation minimizes variabilities in product quality
Use of TDLAS can provide product information which can impact quality attributes

25
Line of Sight across the SP Range

References
• ICH Q8 (R2)Guidance for Industry – Pharmaceutical Development
• ICH Q11 - Development and Manufacture of Drug Substance (Chemical Entities and Biotechnological/Biological Entities)
• FDA Draft Guidance - Advancement of Emerging Technology Applications to Modernize the Pharmaceutical Manufacturing Base Guidance for Industry
• FDA Guidance - PAT — A Framework for Innovative Pharmaceutical Development, Manufacturing, and Quality Assurance
• FDA – Guide to Inspection of Lyophilization of Parenterals

Ian WhitehallChief Marketing Officer