Embed Size (px)
Citation preview

SLAC-PUB-9993 June 2003
Controlled Synthesis and Assembly of FePt Nanoparticles
Shouheng Sun et al.
Submitted to Journal of Applied Physics
Stanford Linear Accelerator Center, Stanford University, Stanford, CA 94309
Work supported by Department of Energy contract DE-AC03-76SF005 15.

Controlled Synthesis and Assembly of FePt
Nanoparticles
Shouheng SU~,*~ Simone Anders,* Thomas Thomson,$ J. E. E. Baglin, $ Mike F. Toney, x Hendrik F.
Hamann,f C. B. Murray,f Bruce D. Tervis J’
IBM T. J. Watson Research Center, Yorktown Heights, New York 10598 and IBM Almaden Research
Center, 650 Harry Road, San Jose, California 95120.
Abstract: Monodisperse 4 nm FePt magnetic nanoparticles were synthesized by superhydride reduction
of FeC12 and Pt(acac)z at high temperature, and thin assemblies of FePt nanoparticles with controlled
thickness were formed through polymer mediated self-assembly. Adding superhydride (LiBEt3H) to the
organic solution of FeClz and Pt(acac)z in the presence of oleic acid, oleylamine and 1,2-hexadecanediol
at 2OO”C, followed by refluxing at 263°C led to monodisperse 4 nm FePt nanoparticles. The initial
molar ratio of the metal precursors was retained during the synthesis; and the final FePt composition of
the particles was readily tuned. Alternatively absorbing a layer of polyethylenimine (PEI) and the FePt
nanoparticles onto a solid substrate resulted in nanoparticle assemblies with tunable thickness. Chemical
analysis of the assemblies revealed that more iron oxide was present in the thinner assemblies annealed
at lower temperature or for shorter time. Thermal annealing induced the internal particle structure
change from chemically disordered fee to chemically ordered fct and transformed the thin assembly
* To whom correspondence should be addressed. E-mail: [email protected].
+ IBM T. J. Watson Research Center.
$ IBM Almaden Research Center.
from superparamagnetic to ferromagnetic. This controlled synthesis and assembly can be used to
fabricate FePt nanoparticle-based functional devices for future nanomagnetic applications.
Introduction
Controlled synthesis and assembly of small hard magnetic particles has attracted great interest
due to their potential applications in ultrahigh density magnetic recording,‘*” highly sensitive magnetic
sensors3*4 and advanced nanocomposite permanent magnets.5 The hard magnetic FePt materials are
excellent candidates for these particle-based applications. They are more chemically stable than other
well-known hard magnetic materials such as CoSm, NdFeB, and have very high magnetocrystalline
anisotropy, KU. In an ordered intermetallic phase, their KU can reach values as high as lo8 erglcm3,”
indicating that the magnetic anisotropy energy K,V of a single magnetic grain (V is the magnetic grain
volume) is much larger than the thermal fluctuation energy knT (kn is the Boltzman’s constant, and T is
the temperature) at ambient condition, and an FePt particle with a diameter as small as 3 nm is still
thermally stable and ferromagnetic. Recent advance in magnetic recording technology has indicated that
if self-assembled in a tightly packed, exchange-decoupled array with control of magnetic easy axis
direction, these FePt nanoparticles could support high-density magnetization reversal transitions and
would be ideal candidate for future ultra-high density data storage media, with potentially one bit per
particle.297
To use self-organized FePt nanoparticles for magnetic recording applications, a practical route to
monodisperse ferromagnetic FePt nanoparticles and nanoparticle assemblies with controlled assembly
thickness and surface roughness is needed. Solution phase-based high temperature decomposition of
Fe(C0)5, and reduction of platinum acetylacetonate, Pt(acac)z, was recently developed to make
monodisperse FePt nanoparticles,8‘1 ’ and has been demonstrated to be a general approach to other multi-
component nanoparticles, including binary FeMo,12 and tertiary CoFePt13 and AgFePt14 nanoparticles.
However, for future practical applications, several issues regarding this decomposition/reduction process
2
need to be addressed. The Fe(CO)S is volatile, and is thermally unstable, gradually releasing CO and Fe
at ambient temperature, rendering Fe(CO)S a well-known toxic chemical. The high temperature nature of
the synthesis needs excess of Fe(CO)s in the synthesis. A correlation between the molar ratio of
Fe(CO)5/Pt(acac)z and FePt composition always needs to be established in order to determine the final
composition of the particles.” Furthermore, for nanoparticles to store magnetic information, they have to
be arranged in a smooth thin assembly with a thickness of -10 nm for over 100 Gbit/ir? recording.15 It is
therefore desired that the synthesis use a less toxic metal precursors; the initial molar ratio of metal
precursors be carried over to the final product; and the nanoparticles be assembled with control on
assembly thickness.
We report a simple chemical process of synthesizing FePt nanoparticles by reduction of FeC12
and Pt(acac)z at 2OO”C, followed by refluxing at 263°C. The particle growth is self-limited and 4 nm
FePt nanoparticles are readily separated. The initial molar ratio of the metal precursors is carried over to
the final product, and the FePt composition is easily tuned. We further demonstrate that alternate
adsorption of polyethylenimine (PEI) and FePt nanoparticles on a HO-terminated surface via surface
ligand exchange leads to 4 nm FePt nanoparticle assemblies with controlled thickness. Thermal
annealing is applied to control structural and magnetic properties of the assemblies. This controlled
synthesis and assembly of FePt nanoparticles offers a convenient route to future fabrication of FePt
nanoparticle-based devices.
Experimental Section
The synthesis was carried out using standard airless procedures and commercially available
reagents. Absolute ethanol, hexane, and chloroform were used as received. Tetrahydrofuran (THF)
solution of superhydride (LiBEtsH) (lM), phenyl ether (99%), 1,2-hexadecanediol (97%), oleic acid
(900/o), and iron (II) chloride tetrahydrate (FeC12*4H20) were purchased from Aldrich Chemical
3

Company. Oleylamine was from Fluka; and platinum acetylacetonate, Pt(acac)z, was from Strem
Chemicals, Inc.
Synthesis of FessPt42 nanoparticles. In a flask equipped with N2 in/outlet, septa rubber,
thermal probe were added Pt(acac)z (197 mg, 0.5 mmol), FeC12.4H20 (139mg, 0.70 nmmol), 1,2-
hexadecanediol (520 mg, 2 mmol) and phenyl ether (25 mL) under nitrogen atmosphere. The mixture
was heated to 100°C for 10 min. Oleic acid (0.16 mL, 0.5 mmol) and oleylamine (0.17 mL, 0.5 mmol)
were added; and the mixture was continuously heated to 200°C for 20 minutes. LiBEt3H (1 M THF
solution, 2.5 mL) was slowly dropped into the mixture in a duration of -2 minutes. The black
dispersion was stirred at 200°C for 5 minutes under NZ to remove low boiling solvent, and under a
blanket of N2 was heated to reflux at 263°C for 20 minutes. The heating source was removed and the
black reaction mixture was cooled to room temperature. Ethanol (40 mL) was then added under ambient
condition. The black product was precipitated and separated by centrifugation (6000rpm, 10 minutes).
The yellow-brown supernatant was discarded and the black product was dispersed in hexane (-20 mL)
in the presence of oleic acid (-0.05 mL) and oleylamine (-0.02 mL). Any unsolved precipitation was
removed by centrifugation (6000 r-pm, 10 minutes). The product was then precipitated out by adding
ethanol (-20 mL) and separated with centrifugation (6000rpm, 10 minutes). It was once again dispersed
in hexane in the presence of oleic acid and oleylamine, precipitated out by adding ethanol and separated
with centrimgation. The product, FessPb2 nanoparticles, was re-dispersed in hexane solvent for further
use.
Similarly, 0.61 mmol of FeCl2 and 0.5 mm01 Pt(acac)z led to FessPt45 nanoparticles; and 0.5
mmol of FeC12 and 0.5 mmole Pt(acac)z to FesoPtso nanoparticles.
Nanoparticle assembly. A naturally oxidized silicon substrate was cleaned using ethanol and
dried under a flow of N2. The substrate was then immersed into the chloroform solution of PEI (-20
mg/mL) for about 30 seconds, withdrawn from the solution and dipped into ethanol solvent to wash off
extra PEI on the substrate surface and dried. The PEI functionalized substrate was immersed into the
4
hexane dispersion of FePt nanoparticles for 30 seconds, withdrawn from the dispersion, rinsed with
fresh hexane and dried. This yielded one layer of PEI/FePt assembly. By repeating the coating of PEI
and FePt, the multilayer of 4 nm FePt nanoparticle assembly was easily made.
Thermal annealing of the FePt nanoparticle assemblies. The PEI/FePt assemblies were thermally
annealed for further characterization. The annealing transforms the particle structure from the
chemically disordered fee phase to the chemically ordered fct phase, rendering FePt nanoparticles with
desirable high magnetocrystalline anisotropy and ferromagnetism at room temperature.” Further, the
annealing also results in the decomposition of the PEI and oleic acidoleylamine left around FePt
particles into carbonaceous matrix, yielding smooth FePt nanoparticle assemblies. The annealing was
performed in an inert atmosphere (N2 or He), or under Ar + H2(5%) in a quartz tube at temperatures
ranging from 400°C to 800°C and durations between 2 min and 2h.
Nanoparticle characterization. Fe and Pt elemental analyses of the as-synthesized FePt
nanoparticle powders were performed on inductively coupled plasma - optic emission spectrometry
(ICP-OES) at Galbreith Lab, Tennessee. The particles were precipitated from their hexane dispersion by
ethanol, washed with ethanol and dried. Composition and thickness of the FePt nanoparticle assembly
were determined by Rutherford backscattering spectrometry (RBS).
Samples for transmission electron microscopy (TEM) analysis were prepared by drying a hexane
dispersion of FePt particles on amorphous carbon coated copper grids. Particle size was determined
using a Philips CM 12 TEM (120 KV). The thin-layered PEVFePt assembly was imaged using CM 12
TEM with the assembly on silicon oxide coated copper grids. The layered structure on thermally
oxidized silicon (100) substrate was characterized by X-ray reflectivity (XRF) measurements of the
films. The measurements were conducted using CuGl radiation from an 18 kW X-ray generator,
monochromatized with flat Ge(ll1) crystal. The background (diffuse) scattering was subtracted from
the raw data to yield the true specular reflectivity. Digital Nanoscope IIIa in multimedia mode was used
for Atomic force microscopy @FM) analysis of the surface morphology of the layered assembly.
5

The chemical nature of the films was studied using Near Edge X-ray Absorption Fine Structure
(NEXAFS) spectroscopy. The experiments were performed at the Advanced Light Source at beamline
7.3.1.1. that is equipped with a spherical grating monochromator and has an energy resolution of
E/AE=I800. X-ray diffraction (XRD) measurements were performed in grazing incidence geometry at
the National Synchrotron Light Source using beamline X2OC. The diffracted beam was analyzed with 1
milliradian Soller slits, which provided a resolution much smaller than any of the diffraction peak
widths.
Magnetic studies were carried out using a MPMS2 Quantum Design SQUID magnetometer with
fields up to 5 T and temperatures from 5°K to 350°K, and Vibrating sample magnetometer with field up
to 9 T at room temperature. Measurements were done on variously layered FePt nanoparticle assemblies
on thermally oxidized p-type silicon (100) substrates.
Results and Discussion
Synthetic issues. As illustrated in Figure 1, the reduction of FeC12 and Pt(acac)z mixture by
superhydride in the presence of oleic acid, oleylamine and 1,2-hexadecanediol at 2OO”C, followed by
refluxing at 263”C, led to monodisperse 4 nm FePt nanoparticles. Although the reduction was usually
performed at 2OO”C, experimental results show that superhydride could be added at any temperature in
the range between 200°C and 263°C. Adding the reducing agent at lower temperature (<2Oo”C) did not
yield high quality FePt nanoparticle materials.
Two metal precursors, FeCl2 and Pt(acac)z, were specifically chosen for this reduction process as
they formed clear phenyl ether solution when mixed. Presumably, the mixing of FeC12 and Pt(acac)l
resulted in an FeClz-Pt(acac)z intermediate that facilitated the formation of FePt nanoparticles under the
current reaction condition. Other combination of Fe salt, such as FeC13, Fe(acac)x, and Pt salt, such as
PtC12, KzPtCld, did not yield good quality FePt nanoparticles. The FeC12 used in the reaction can be in
either anhydrous state or hydrated state. If FeC12.4H20 was used, the mixture was usually stirred at
6

200°C under nitrogen for about 20 minutes before reducing agent, superhydride, was added to the
mixture.
Several different reducing agents have been tested for the reduction process. Metal naphthalides
are very powerful reducing agents but are also difficult to store due to their extremely air- and moisture-
sensitive nature. Polyalcohol, such as ethylene glycol and 1,2-hexanedecanediol, or the other long chain
alkyl alcohols, are not a strong reducing agent for the FeClz-Pt(acac)z reduction. But the alkyl alcohol
can act like a co-surfactant, and help to generate FePt nanoparticles with better quality. Metal
borohydrides are a class of well-known reducing agents for the reduction of various metal salts to metal
nanoparticles.‘hA’5 Specifically, derivative borohydride, such as superhydride, LiBEt3H, is easily
dissolved in organic ether solvent, facilitating homogenous reduction of metal salt and formation of
metal nanoparticles.““‘23 The advantage of choosing LiBEtJH over other metal borohydrides is as
follows: (i) Li+ cation fi-om the superhydride can combine with Cl- or acac- from FeC12 and Pt(acac)z to
form Li salt that is easily washed off from the product with alcohol; (ii) after reduction, BEt3 is released
as a whole molecule: it may be removed from the system under nitrogen, or it can combine with other
organic ether/amine/alcohol species in the mixture, to form organic adducts, leading to pure FePt
nanoparticles.
The binary FePt nanoparticles are stabilized by oleic acid and oleylamine as in the previous
decomposition/reduction process. If the final product is Fe-rich, then a combination of oleic
acid/oleylamine with the ratio of > 1 is needed for particle stabilization during the purification process.
If the final product is Pt-rich, then a combination of oleic acid/oleylamine with the ratio of < 1 is
required for the stabilization. This indicates that the excess fraction of Fe or Pt atoms is located at
surface positions of the FePt particles.
Under the current reaction condition, the particle growth is self-limited. The size of the particles
is independent of the amount of stabilizers present, the addition rate of reducing agent, reduction
temperature (from 200°C to 263”C), and refluxing time (from 30 minutes to 2h). 4 nm FePt particles
7

were always separated. Refluxing may not be necessary, but it did help to yield FePt nanoparticles with
better shape. Figure 2 is the TEM image of 4 nm FePt nanoparticles deposited on an amorphous carbon
copper grid from their hexane dispersion. It can be seen that FePt nanoparticles are uniform with narrow
size distribution.
Elemental analysis. Fe, Pt elemental analysis of the FePt powder sample show that the mixture of
0.75 mmol of FeC12 and 0.5 mmol Pt(acac)z yielded FehoPtdo. Similarly, 0.70 mmol of FeC12 and 0.5
mmol Pt(acac)z led to FessPt42, and 0.5 mm01 of FeC12 and 0.5 mmole Pt(acac):! to FesoPtso. Within ICP
detection limit, these FePt composition data match exactly with those from the calculated ones
according to the molar ratio of two metal precursors. RBS on self-assembled FePt thin films also
confirmed that each kind of FePt nanoparticles has the composition close to the calculated one. For
example, RBS analyses on different assemblies of FehoPt40 nanoparticles would usually result in ratios
of Fe(59-6t)Ptc41-39). These compositional analyses on FePt nanoparticles indicate that in this reduction
method, the initial metal molar ratio is carried over to the final product, and the FePt composition is
easily controlled.
Polymer mediated FePt nanoparticle assembly. The oleic acidoleylamine coated FePt
nanoparticles can be readily dispersed into hexane or chloroform solvent, facilitating surface ligand
exchange and controlled nanoparticle assembly. The ligand exchange experiments show that various
functional polymers can replace oleic acid/oleylamine around these nanoparticles to give polymer
nanoparticle composites. For example, mixing chloroform solution of polyethylenimine (PEI) with
hexane dispersion of FePt led to PEI-FePt nanocomposite that is not soluble in hexane. By exchanging
the stabilizers bound to the particles with multifunctional polymers that attach to a substrate, the
polymer and FePt nanoparticles can be alternatively adsorbed onto substrate, and an FePt assembly with
controlled thickness can be made, This polymeric molecule-assisted nanoparticle assembly is a well-
known technique to polymer nanoparticle nanocomposites.2J-3’ Densely packed self-assembled
polymeric monolayer is usually obtained by spontaneous adsorption of surfactant molecules from
8
organic solution onto a solid substrate via hydrogen bonding, ionic bonding or covalent bonding. PEI
has been found to be adsorbed on HO-terminated substrate, and used for gold nanoparticle assembly on
mica, silicone oxide and glass surface.“” The assembly of FePt nanoparticles into a macroscopic two-
dimensional array on a PEI-functionalized substrate is depicted in Figure 3A.“3 The assembly process
includes: (1) surface functionalization with a layer of PEI coating; and (2) replacement of the particle
stabilizers with a pedant functional -NH- group of the PEI. The pendant functional group -NH- extends
out in the solution. By dipping the PEI-derivative substrate into the particle dispersion, ligand exchange
at the PEI surface occurs and a monolayer FePt particle assembly is formed. Figure 3B shows a TEM
image of one layer of 4 nm FessPt42. By repeating this simple two-step process in a cyclic fashion, a
PEVFePt multilayer assembly can be obtained. Figure 3C shows a TEM image of 3 layers of 4 nm
FessPt42 nanoparticles self-assembled on a PEI-modified silicon oxide surface. Further experiments
show this PEI-mediated assembly can be made on virtually any size and shaped HO-terminated
substrates.
General analysis of the assemblies. For a series of 2-, 3-, 5-layered FePt nanoparticle assemblies, the
depth profiling of both Fe and Pt obtained from RBS measurements is consistent with that predicted
from the actual number of layers of FePt nanoparticles. The sample contains Fe, Pt and other C, 0, N
components. The overall coating thickness for a 3-layer 4 nm FePt assembly is estimated to be in the
region of 10 - 15 nm, depending on the density and H content (not determined). The layered structure is
further analyzed by X-ray reflectivity analysis of nanoparticle assemblies. In X-ray reflectivity the
reflected X-ray intensity is measured as a function of incidence angle and the data are analyzed using a
multilayer model that incorporates several parameters which are varied to produce the best fit to the
data.“’ X-ray reflectivity measures the electron density of the nanoparticle assembly, which can be
converted into mass density. The result of this analysis for a 3-layer assembly is shown in Figure 4,
which plots mass density as a function of position from the silicon substrate surface. The three layers are
readily evident as regions of larger mass density than the PEI between the nanoparticle layers. The
spacings between the first-second and second-third layers are both 6.5 nm. These data demonstrate the 9

layering associated with the nanoparticle assembly. Atomic force microscopy (AFM) analyses of various
3-layer thin assemblies indicate smooth assembly surface. Figure 5 is the AFM image of a 3-layer
FessPt42 assembly annealed at 550°C for 30 min on a microslide substrate. The root mean square @MS)
variation in height over areas of 9.4 x 9.4 pm is at 3.1 nm.
Chemical analysis of the assemblies. The chemical nature of the annealed films was studied using
near edge X-ray absorption fine structure (NEXAFS) spectroscopy.“” Tunable photons from a
synchrotron radiation beamline can be used to study the X-ray absorption of a material as a function of
photon energy. The X-ray absorption spectrum is element specific and fine structure of the absorption
edges reflects the bonding environment of the element in the compound.35 NEXAFS data of Fe
absorption on the annealed thin FePt nanoparticle assemblies indicate that all assemblies contain both
metallic iron and iron oxide.36 The iron/iron oxide fraction varies for different assemblies and depends
on the FePt particle assembly thickness and annealing history of the assembly. More metallic Fe exists
in a thicker assembly. For the assemblies with the same thickness, more metallic Fe is found in the
assembly annealed at higher temperature or for longer time. Figure 6 shows NEXAFS spectra of the Fe
L3 and L2 absorption edges of the 3-layers assemblies annealed at 725°C in He atmosphere for various
durations together with reference spectra of metallic Fe and Fe 0 3 4. It shows that with increasing
annealing duration (Fig. 6A-C), the peaks corresponding to metallic Fe are increased while those to iron
oxide are decreased, indicating more metallic iron is present in the assembly. Simulation based on the
superposition of Fe and Fe304 (Fig. 6D,E) can fit well to the observed spectra. For example, the
observed spectrum for the 120 min annealed assembly (Fig. 6C) corresponds to a superposition of
75%Fe/25%Fe304.j7 Assuming the particle consists of a FePt core and an oxide shell and using typical
literature values for the electron escape depth for carbon (10 run), metal (1.5 nm), and metal oxides (5
nm),3s.38 we can estimate that the relative 75%Fe/25%Fe304 contribution to the spectrum comes from a
particle with and average 0.1 nm thick oxide shell and a 3.8 m-n metallic particle core. Although the
accurate electron escape depths in our sample is not available, preventing us from getting the exact
10

number of iron/iron oxide fraction, the estimate shows that a very thin oxide shell is indeed present in
the assemblies. The chemical origin of the iron oxide is easily understood considering the fact that both
the decomposition of the iron oleate on a FePt particle surface during the annealing and air oxidation of
the surface iron atom of an annealed FePt particle will all lead to iron oxide.
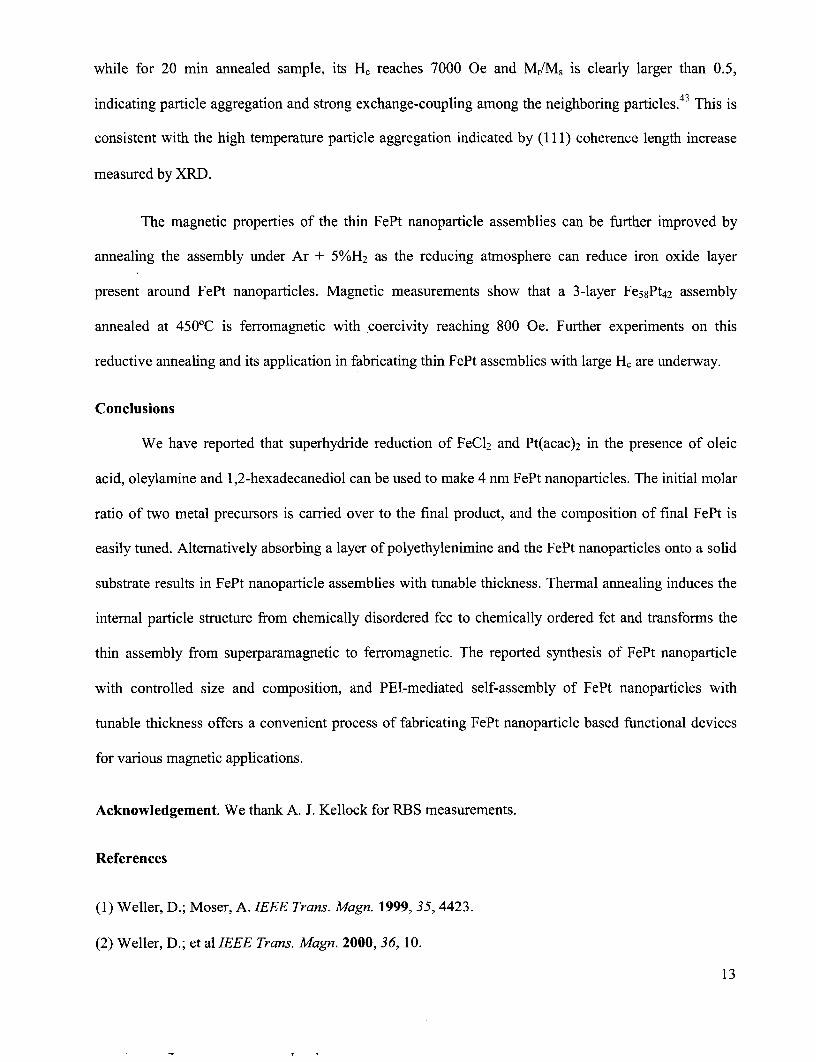
Structural analysis of the assemblies. The crystal structure of the FePt nanoparticles in a thin
assembly was determined by the X-ray diffraction (XRD). The XRD of the as-synthesized FePt particles
reveals a typical chemically disordered fee structure,’ in which Fe atoms are substituted into Pt positions
and vice versa. Annealing induces the Fe and Pt atoms to rearrange into the long range chemically
ordered fct structure, which can be viewed as a natural superlattice of alternating Fe and Pt atomic
planes. The change of the internal particle structure upon annealing depends on annealing temperature
and duration, as well as the Fe/Pt ratio. The onset of this phase change occurs at about 5OO”C, which is
consistent with previous observation on FePt nanoparticles prepared from the decomposition/reduction
process.“>‘““” Figure 7 shows in-plane X-ray diffraction scans for the as-synthesized 3-layer FessPt42
assembly (Fig. 7A) and for the one annealed for 2 minutes in He atmosphere at 725°C in He atmosphere
(Fig. 7B). Figure 7B shows the typical superlattice peaks of (001) and (110) that are characteristic of the
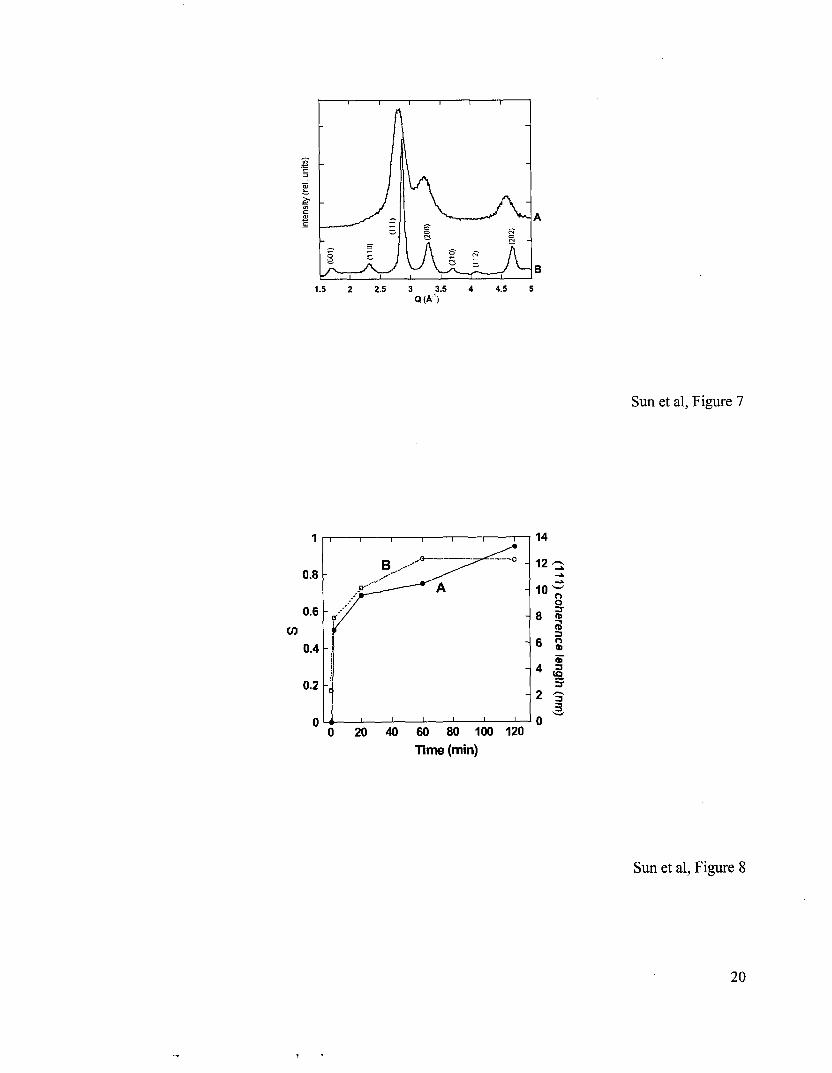
ordered FePt (Llo) compound phase.6 The one-dimensional chemical ordering parameters S can be
obtained from the ratio of the peak intensity of the superlattice peaks to the fundamental peaks.“’ S is
unity for perfectly ordered films, and is zero for a chemically disordered film. This order parameter
depends on the annealing history of the sample. Figure 8A illustrates the increase of the S with
annealing time at 725°C. It shows that for the as synthesized assembly the order parameter is zero and is
increased up to almost 1 for the sample annealed for 2 h duration. The order parameter also varies with
annealing temperature at the same annealing time. It increases with temperature from 0.6 at 500°C for 5
min to 0.8 at 800°C for 5 min.
Annealing induced particle aggregation. High temperature annealing also leads to particle
aggregation. Previous in-situ TEM experiments have shown clear coalescence of FePt particles annealed
11

at 600°C under high vacuum for 1 h.40 From the line width of the (111) peak it is also possible to
estimate the (111) coherence length that is related to the particle diameter.j2 Figure 8B shows the (111)
coherence length vs. annealing time at annealing temperature 725°C. For the 2 min annealed assembly
the coherence length has increased from 2.8 nm for the as synthesized assembly to 8 run, and it increases
further with annealing duration. The average particle size increases also with annealing temperature. The
particle size estimated from XRD line width for 3 layer assemblies annealed at 580°C for 30 min is 5
nm but rises to 17 nm for a 8OO”C/5 min. annealed sample. To prevent agglomeration of the FePt
nanoparticles, ion beam irradiation of the as-synthesized FePt nanoparticle assemblies, followed by
thermally annealing, was applied to treat the thin assembly. Preliminary experiments showed that this
treatment improved particles’ ability against aggregation during annealing process.
Magnetic properties of the assemblies. Along with the structural change, the magnetic
properties of the assemblies can be easily tuned. The as-synthesized FePt nanoparticles have chemically
disordered fee structure, and the related thin assemblies are superparamagnetic at room temperature with
H, = 0. The thermal annealing transforms the chemically disordered fee structure to the chemically
ordered fct structure, rendering ferromagnetic thing FePt nanoparticle assemblies. The coercivity of the
annealed thin films increases with annealing time and temperature, and a minimum annealing
temperature of about 500°C under an inert atmosphere is required to form ferromagnetic thin films. This
corresponds to the structure transformation from fee to fct phase at this temperature. On the other hand,
the coercivity of the annealed thin films is also dependent on assembly thickness. The thinnest layers
that showed coercivity of - 300 Oe were 2 layer films for the 4 nm FessPt42 particles. This is likely due
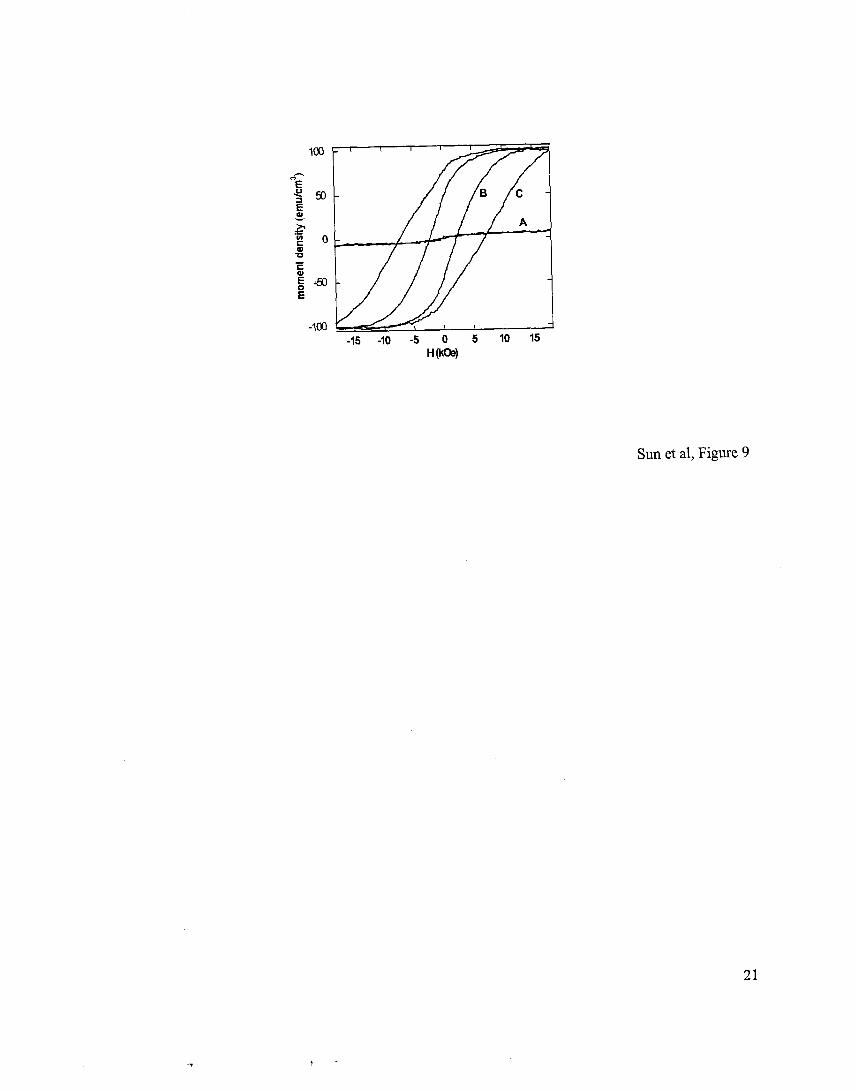
to the iron/iron oxide ratio variation with the assembly thickness, as observed using NEXAFS. Figure 9
shows the room temperature hysteresis loops of three different 3-layer 4 mn FessPt42 nanoparticle
assemblies, with Fig. 9A being from as-synthesized assembly and Fig. 8B,C being from the annealed
assemblies in He at 725°C for 2 min and 20 min respectively. For 2 min annealed sample, its coercivity
is 2000 Oe and remanent magnetization M, close to 0.5 MS, where M, is the saturation magnetization,
12
while for 20 min annealed sample, its H, reaches 7000 Oe and M,/M, is clearly larger than 0.5,
indicating particle aggregation and strong exchange-coupling among the neighboring particles.43 This is
consistent with the high temperature particle aggregation indicated by (111) coherence length increase
measured by XRD.
The magnetic properties of the thin FePt nanoparticle assemblies can be further improved by
annealing the assembly under Ar + 5%H2 as the reducing atmosphere can reduce iron oxide layer
present around FePt nanoparticles. Magnetic measurements show that a 3-layer FessPt42 assembly
annealed at 450°C is ferromagnetic with coercivity reaching 800 Oe. Further experiments on this
reductive annealing and its application in fabricating thin FePt assemblies with large H, are underway.
Conclusions
We have reported that superhydride reduction of FeC12 and Pt(acac);! in the presence of oleic
acid, oleylamine and 1,2-hexadecanediol can be used to make 4 nm FePt nanoparticles. The initial molar
ratio of two metal precursors is carried over to the final product, and the composition of final FePt is
easily tuned. Alternatively absorbing a layer of polyethylenimine and the FePt nanoparticles onto a solid
substrate results in FePt nanoparticle assemblies with tunable thickness. Thermal annealing induces the
internal particle structure from chemically disordered fee to chemically ordered fct and transforms the
thin assembly from superparamagnetic to ferromagnetic. The reported synthesis of FePt nanoparticle
with controlled size and composition, and PEI-mediated self-assembly of FePt nanoparticles with
tunable thickness offers a convenient process of fabricating FePt nanoparticle based functional devices
for various magnetic applications.
Acknowledgement. We thank A. J. Kellock for RBS measurements.
References
(1) Weller, D.; Moser, A. IEEE Trans. Magn. 1999,35,4423.
(2) Weller, D.; et al IEEE Trans. Magn. 2000, 36, 10.
13

(3) Liu, S. H. IEEE Trans. Msg. 1999,35,3989.
(4) Sqalli, Q.; Brenal, M. P.; Hoffmann, P.; Marquis-Weible, F. Appl. Phys. Lett. 2000, 76,2134.
(5) Kneller, E. F.; Hawig, R. IEEE Trans. Magn. 1991,27,3588.
(6) Far-row, R. F. C.; et al J. Appl. Phys. 1996, 79,5967.
(7) Moser, A.; et al J. Phys. D: Appl. Phys. 2002,35, R157.
(8) Sun, S.; Murray, C. B.; Weller, D.; Folks, L.; Moser, A. Science 2000,287, 1989.
(9) Sun, S.; Fullerton, E. E.; Weller, D.; Murray, C. B. IEEE Trans. Magn. 2001,37, 1239.
(10) Harrell, J. W.; Wang, S.; Nikles, D. E.; Chen, M. Appl. Phys. Lett. 2001, 79,4393.
(10) Stahl, B.; et al. Adv. Mater. 2002,14,24.
(12) Li, Y.; Liu, J.; Wang, Y.; Wang, Z. L. Chem. Mater. 2001,13, 1008.
(13) Chen, M.; Nikles, D. E. Nanolett. 2002,2, 211.
(14) Kang, S.; Harrell, J. W.; Nikles, D. E. Nanolett., 2002, in press.
(15) Wood, R. IEEE Trans. Magn. 2000,36,36.
(16) Schlesinger, H. I.; et al J. Am. Chem. Soc.1953,84, 1493.
(17) Yiping, L.; Hadjipanayis, G. C.; Sorensen, C. M.; Klabunde, K. J. J. Magn Mag Mater. 1989, 79,
321.
(18) Glavee, G. N.; Klabunde, K. J.; Sorensen, C. M.; Hadjipanayis, G. C. Langmuir 1994,10,4726.
(19) Sun, Y.-P.; Rollins, H. W.; Guduru, R. Chem. Mater. 1999, II, 7.
(20) Bomremann, H.; Brijoux, W.; Joussen, T. Angew. Chem. Int. Ed. Engl. 1990,29,273.
(21) Bonnemann, H.; Brinkmann, R.; Koppler, R.; Neiteler, P.; Richter, J. Adv. Mater.1992,4, 804.
(22) Sun, S.; Murray, C. B. J. Appl. Phys. 1999,85,4325.
(23) Sun, S.; Murray, C. B.; Doyle, H. Mat. Res. Sot. Symp. Proc. 1999,577, 385.
(24) Fendler, J. H. Chem. Mater. 1996,8, 1616.
(25) Liu, Y.; Wang, A.; Claus, R. J. Phys. Chem. B 1997,101, 1385.
(26) Cassagneau, T.; Mallouk, T. E.; Fendler, J. H. J. Am. Chem. Sot. 1998,120, 7848.
14

(27) Aliev, F. G. et al. Adv. Mater. 1999, II, 1006
(28) Rogach, A. L.; Koktysh, D. S.; Harrison, M.; Kotov, N. A. Chem. Mater. 2000,12,1526.
(29) Halaoui, L. I. Langmuir 2001,17,7130.
(30) Kotov, N. A. MRS Bulletin 2001, 992.
(31) Hicks, J. F.; Seok-Shon, Y.; Murray, R. W. Langmuir 2002,18,2288.
(32) Schmitt, J.; Machtle, P.; Eck, D.; Miihwald, H.; Helm, C. A. Langmuir 1999,15,3256.
(33) Sun, S.; et al. J. Am. Chem. Sot. 2002,124,2884.
(34) Holy, V.; Pietsch, U.; Baumbach, T. in High-Resolution X-ray Scattering ji-om Thin Films and
Multilayers, Springer-Verlag, Berlin, 1998.
(35) St&r, J. NEXAFS Spectroscopy, Springer, Berlin 1992.
(36) Anders, S.; et al. Microelectronic Engineering 2002, 61/62, 569.
(37) Other forms of iron oxide, such as Fe203, may also exist in the assembly. Due to the surface
sensitivity of NEXAFS and the similarity of iron oxide spectra, exact nature of iron oxide in the
assembly is difficult to determine.
(38) Regan, T. J.; et al. Phys. Rev. B 2001, 64,214422.
(39) Weller, D.; Sun, S.; Murray, C. B.; Folks, L.; Moser, M. IEEE Trans. Magn. 2001,37,2185.
(40) Dai, Z. R.; Sun, S.; Wang, Z. L. Nanolett. 2001,1,443.
(41) Cebollada, A.; Farrow, R. F. C.; Toney, M. F. in Magnetic Nanostructures, Ed. H. S. Nalva,
American Scientific Publishers, 2002, pp93.
(42) Klug, H. P.; Alexander, L. E. X-Ray di@action Procedures for Polycrystalline and Amorphous
Materials, John Wiley & Sons: New York, 1962, ~~491-538.
(43) Zeng, H.; Sun, S.; Vedantam, T. S.; Liu, J. P.; Dai, Z. R.; Wang, Z. L. Appl. Phys. Lett. 2002, 80,
2583.
15

Figure Captions
Figure 1 Schematic illustration of FePt nanoparticle synthesis by superhydride reduction of FeC12 and
Pt(acac)z in the presence of oleic acid, oleylamine and 1,2-hexadecanediol.
Figure 2 Bright field TEM image of a 2-D array of 4 nm FePt nanoparticles. The assembly was obtained
with depositing FePt hexane dispersion on an amorphous carbon coated copper grid and evaporating
hexane at room temperature.
Figure 3 (A) Schematic illustration of polymer-mediated self-assembly of FePt nanoparticles by
alternatively absorbing a layer of polymer (PEI) and a layer of nanoparticles on a solid surface; and
TEM images of PEI-mediated assembly of 4 nm FesaP& nanoparticles on silicon oxide coated copper
grids: (B) one layer assembly and (C) three layer assembly.
Figure 4 Mass density of a 3-layer FePt assembly, deduced from the XRF measurement, as a function of
position from the silicon substrate (z). The silicon surface is arbitrarily defined as z=O.
Figure 5 AFM image (9.4 x 9.4 pm2) of a 3-layer 4 nm FesgPt42 nanoparticle assembly annealed at
530°C under Ar + Hz (5%) for 30 minutes.
Figure 6 NEXAFS spectra of the Fe L3 and L2 absorption edges of 3-layer FessPt42 assemblies annealed
in He for various durations: (A) 2 min., (B) 20 min, and (C) 120 min, and of the reference thin films of
(D) Fe304 and (E) metallic Fe.
Figure 7 XRD scans of 3-layer FessPt42 assemblies. (A) As-synthesized 3-layer assembly; and (B) 3-
layer assembly annealed at 725°C for 2 min in He atmosphere, in which the diffraction peaks are
indexed following the fct structure.
16

Figure 8 (A) Fe, Pt order parameter, S and (B) (111) coherence length of the FePt particles as a function
of annealing duration. The data were extracted from the XFW scans of the 3-layer Fe5aP& nanoparticle
assemblies annealed in He at 725°C.
Figure 9 In-plane hysteresis loops of 3-layer FesgPt42 nanoparticle assemblies measured by VSM at
room temperature: (A) as-synthesized, and annealed for (B) 2 min and (C) 20 min in He at 725°C.
+ Pt(acac);! + ROH + RCOOH
a 2oo”c a LiBEt,H
a 263’C
+ RNHz
Sun et al, Figure 1
Sun et al, Figure 2
17

Sun et al, Figure 3
i I- , . . . . . . . . , . . . . . . . . , . . . . . .~. . . . ._. . . . . . . . . . . . . . . . ._. . ._.. . . ._
‘..,
: .,
j : ;‘-’
.: ‘. ; i
;. L.,, ;’ :
-- c .
t’ .., ; :’
;: ,
,<’ ‘.
; ; .., ,,/ ‘.
5 j, ! ..I
:‘:i .. ,::
.;j ‘.,/
.
: ._
Sun et al, Figure 4
18
. .

Sun et al, Figure 5
700 705 710 715 720 725 730 energy(eV)
Sun et al, Figure 6
19
1.5 2 2.5 3 a (ky5
4 4.5 5
Sun et al, F igure 7
1
0.8
0.E
v) 0.4
0.2
120 60 80 100 Time (min)
Sun et al, F igure 8
20
-100 -15 -10 -5 0 5 10 15
H W4
Sun et al, Figure 9
21
f .