Embed Size (px)
Citation preview

Ronny KohaviPartner ArchitectApplication and Services Group
QCon, San Francisco
11/11/2013

Doctors take the Hippocratic Oath associatedwith “Do no harm,” yet David Wootton writes
For 2,400 years patients have believed that doctors were doing them good;for 2,300 years they were wrong
For centuries, an illness was thought to be a toxin
Opening a vein and letting the sickness run outwas the best solution –bloodletting
A British medical text recommended bloodletting foracne, asthma, cancer, cholera, coma, convulsions, diabetes, epilepsy, gangrene, gout, herpes, indigestion, insanity, jaundice, leprosy, ophthalmia, plague, pneumonia, scurvy, smallpox, stroke, tetanus, tuberculosis, and for some one hundred other diseases
Physicians often reported the simultaneous use of fifty or more leecheson a given patient
Through the 1830s the French imported about forty million leeches a year for medical purposes

President George Washington had a sore throat
Doctors extracted 82 ounces of blood over 10 hours (35% of his total blood), causing anemia and hypotension.
He died that night
Pierre Louis did an experiment in 1836
One of the first randomized controlled experiments (clinical trials).He treated people with pneumonia either with
early, aggressive bloodletting, or
less aggressive measures
At the end of the experiment, Dr. Louis counted the bodies; they were stacked higher over by the bloodletting sink
Lancet

Most software changes are believed to be positive to the user experience, but are often flat or negative!
Once you objectively evaluate changes, you’re often humbled

Controlled experiments and observational studies
Examples: you’re the decision maker
Running experiments at scale and best practices
The cultural challenge
Two key messages to remember
It is hard to assess the value of ideas.Get the data by experimenting because data trumps intuition
Make sure the org agrees what you are optimizing
5

Concept is trivial
Randomly split traffic betweentwo (or more) versions
A (Control)
B (Treatment)
Collect metrics of interest
Analyze
6
Must run statistical tests to confirm differences are not due to chance
Best scientific way to prove causality, i.e., the changes in metrics are caused by changes introduced in the treatment(s)

With data mining, we find patterns, but most are correlational, providing hypotheses for possible causes
Here is one a real example of two highly correlatedvariables
7

8
• Real Data for the city of Oldenburg,
Germany
• X-axis: stork population
• Y-axis: human population
• What your mother told you about babies
and storks when you were three is not
correct, despite the strong correlational
“evidence”
• Killing the storks won’t solve population
growth problems
Ornitholigische Monatsberichte 1936;44(2)

Actual personalized recommendations from Amazon.(I was director of data mining and personalization at Amazon back in 2003, so I can ridicule my work.)
Buy a 30” monitor becauseyou bought a DisplayPort cable
Buy Atonement movie DVD becauseyou bought a Maglite flashlight
Buy Organic Virgin Olive Oil becauseyou bought Toilet Paper
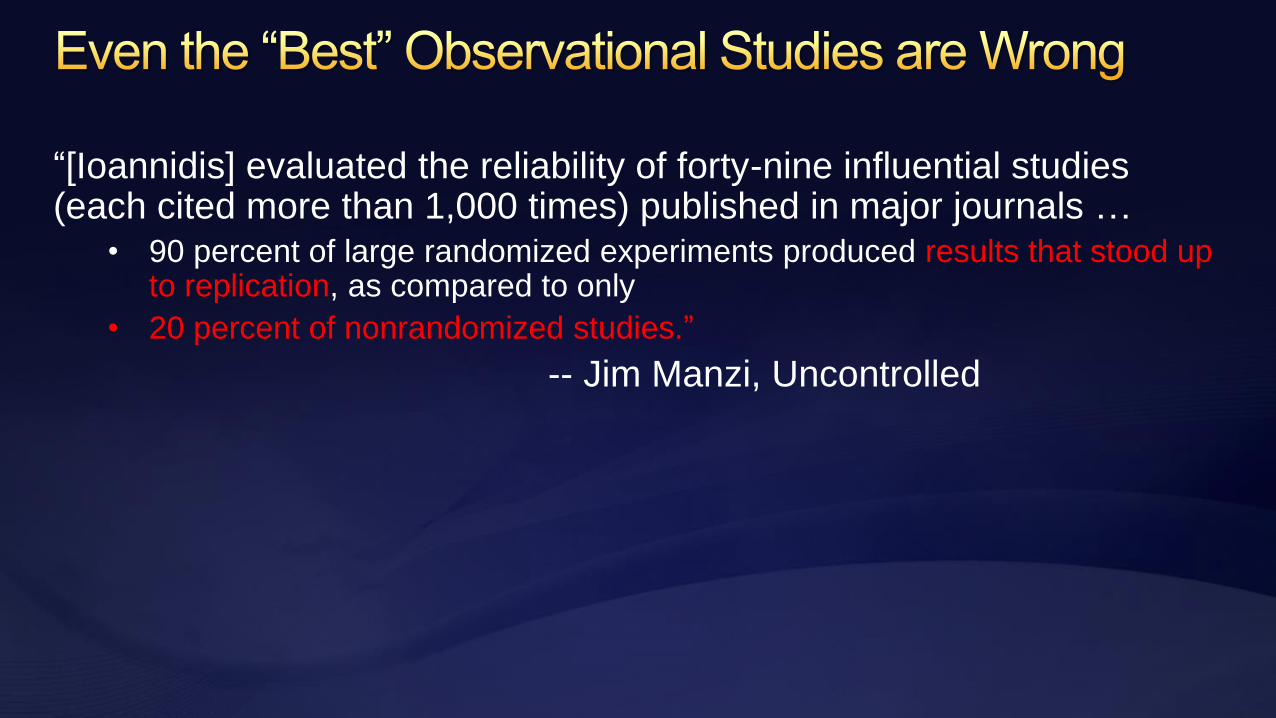
“[Ioannidis] evaluated the reliability of forty-nine influential studies (each cited more than 1,000 times) published in major journals …
• 90 percent of large randomized experiments produced results that stood up to replication, as compared to only
• 20 percent of nonrandomized studies.”
-- Jim Manzi, Uncontrolled
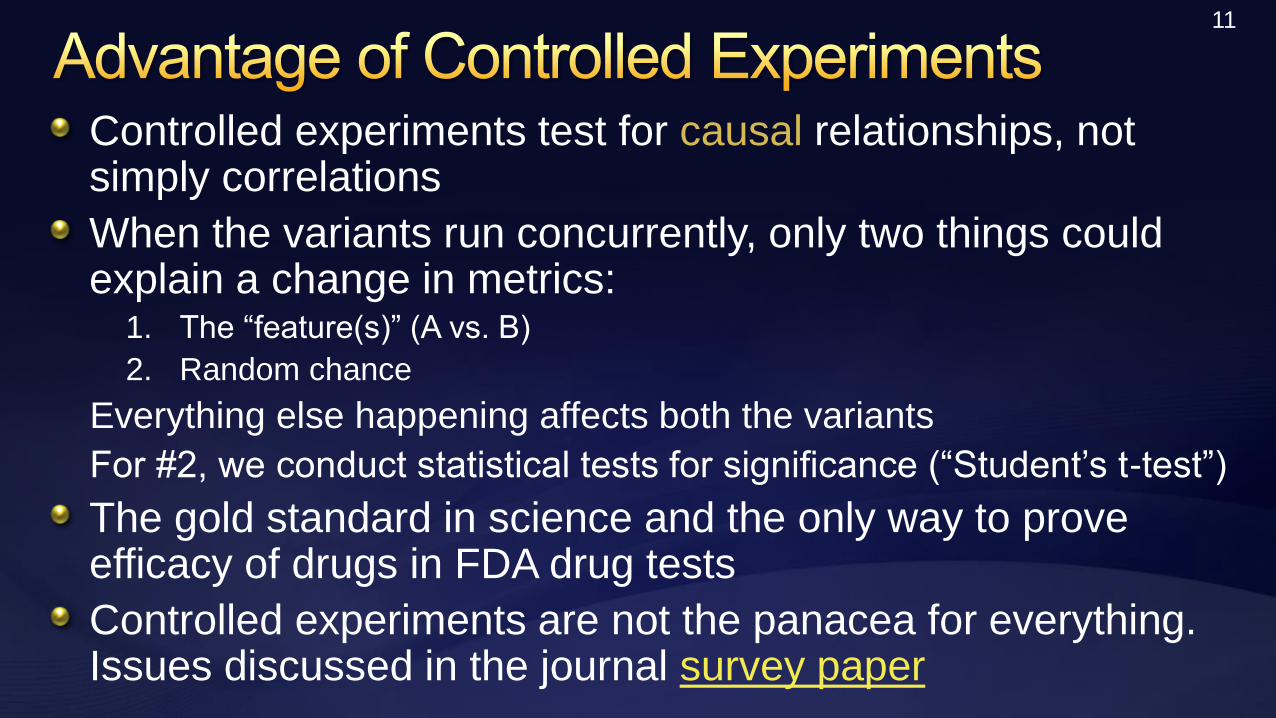
Controlled experiments test for causal relationships, not simply correlations
When the variants run concurrently, only two things could explain a change in metrics:
1. The “feature(s)” (A vs. B)
2. Random chance
Everything else happening affects both the variants
For #2, we conduct statistical tests for significance (“Student’s t-test”)
The gold standard in science and the only way to prove efficacy of drugs in FDA drug tests
Controlled experiments are not the panacea for everything. Issues discussed in the journal survey paper
11

Three experiments that ran at Microsoft
Each helps share interesting lessons
All had enough users for statistical validity
Game: see how many you get right
Everyone please stand up
Three choices are:A wins (the difference is statistically significant)
A and B are approximately the same (no stat sig diff, < 2% delta)
B wins
12

OEC: Clickthrough rate for Search box and popular searches
A
B
Differences: A has taller search box (overall size is the same), has magnifying glass icon,
“popular searches”
B has big search button
• Raise your left hand if you think A Wins
• Raise your right hand if you think B Wins
• Don’t raise your hand if they are the about the same

<deleted>
Insights
Stop debating, it’s easier to get the data
Most people are overly confident that their idea will work.How confident were you?Reality: most ideas fail to deliver (statistics in later slides)
To get insights try OFAT: One Factor At a Time.Don’t tweak too many things at once.(But be careful not to fall into Incrementalism)
14

15
A later test showed that changing the magnifying glass to an actionable word (search, go, explore) was highly beneficial.
This:
is better than
In line with Steve Krug’s great book: Don’t Make Me Think

Should Bing add “site links” to ads, which allow advertisers to offer several destinations on ads?
OEC: Revenue, ads constraint to same vertical pixels on avg
A B
Pro: richer ads, users better informed where they land
Cons: Constraint means on average 4 “A” ads vs. 3 “B” adsVariant B is 5msc slower (compute + higher page weight)
• Raise your Left hand if you think A Wins
• Raise your Right hand if you think B Wins
• Don’t raise your hand if you think they’re about the same

17
<deleted>

OEC: Clicks on revenue generating links (red below)
A B
• Raise your left hand if you think A Wins
• Raise your right hand if you think B Wins
• Don’t raise your hand if they are the about the same

<deleted>
What % of the audience is still standing? Humbling!
Remember: random guesses = 1/3^3 = 1/27
19

20
Any figure that looks interesting or different is usually wrong
If something is “amazing,” find the flaw!
Examples
If you have a mandatory birth date field and people think it’s unnecessary,
you’ll find lots of 11/11/11 or 01/01/01
If you have an optional drop down, do not default to the first alphabetical entry,
or you’ll have lots of: jobs = Astronaut
For most web sites, traffic will be lower 2AM-3AM March 9, 2014, relative to
the same hour a week prior. Why?
Previous Office Example
More at http://bitly.com/twymanLaw

Features are built because teams believe they are useful.But most experiments show that features fail to move the metrics they were designed to improve
We joke that our job is to tell clients that their new baby is ugly
In Uncontrolled, Jim Manzi writesGoogle ran …randomized experiments… with [only] about 10 percent of these leading to business changes.
In an Experimentation and Testing Primer by Avinash Kaushik, authors of Web Analytics: An Hour a Day, he wrote
80% of the time you/we are wrong about what a customer wants
21

Based on experiments at Microsoft (paper)
1/3 of ideas were positive ideas and statistically significant
1/3 of ideas were flat: no statistically significant difference
1/3 of ideas were negative and statistically significant
Our intuition is poor: 60-90% of ideas do not improve themetric(s) they were designed to improve (domain dependent).Humbling!
22

Avoid the temptation to try and build optimal features through extensive planning without early testing of ideas
Experiment often
To have a great idea, have a lot of them -- Thomas Edison
If you have to kiss a lot of frogs to find a prince, find more frogs and kiss them faster and faster -- Mike Moran, Do it Wrong Quickly
Try radical ideas. You may be surprised
Doubly true if it’s cheap to implement (e.g., shopping cart recommendations)
If you're not prepared to be wrong, you'll never come upwith anything original – Sir Ken Robinson, TED 2006 (#1 TED talk)

If you remember one thing from this talk, remember this point
OEC = Overall Evaluation Criterion
Agree early on what you are optimizing
Getting agreement on the OEC in the org is a huge step forward
Suggestion: optimize for customer lifetime value, not immediate short-term revenue
Criterion could be weighted sum of factors, such asTime on site (per time period, say week or month)
Visit frequency
Report many other metrics for diagnostics, i.e., to understand the why the OEC changed and raise new hypotheses
24

KDD 2012 paper (*)
Search engines (Bing, Google) are evaluated on query share (distinct queries) and revenue as long-term goals
Puzzle
A ranking bug in an experiment resulted in very poor search results
Distinct queries went up over 10%, and revenue went up over 30%
What metrics should be in the OEC for a search engine?
Degraded (algorithmic) search results cause users to search more to complete their task, and ads appear more relevant
(*) KDD 2012 paper with Alex Deng, Brian Frasca, Roger Longbotham, Toby Walker, Ya XU
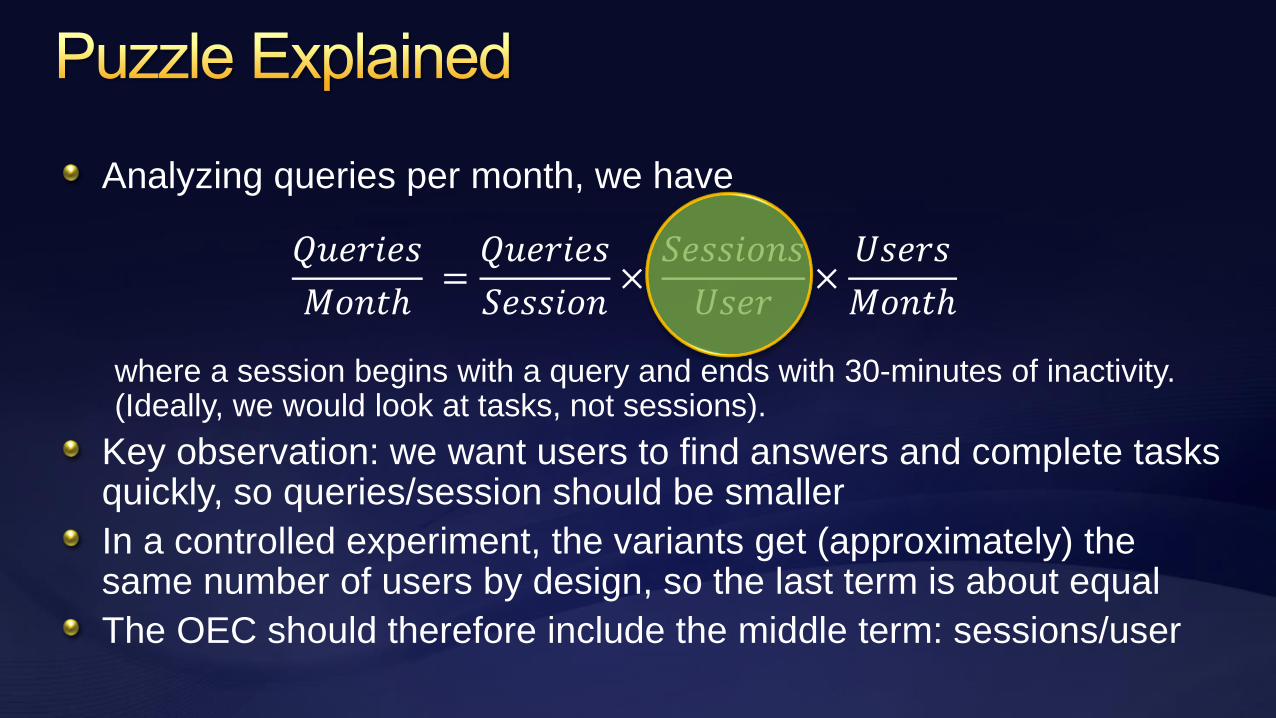
Analyzing queries per month, we have
𝑄𝑢𝑒𝑟𝑖𝑒𝑠
𝑀𝑜𝑛𝑡ℎ=𝑄𝑢𝑒𝑟𝑖𝑒𝑠
𝑆𝑒𝑠𝑠𝑖𝑜𝑛×𝑆𝑒𝑠𝑠𝑖𝑜𝑛𝑠
𝑈𝑠𝑒𝑟×𝑈𝑠𝑒𝑟𝑠
𝑀𝑜𝑛𝑡ℎ
where a session begins with a query and ends with 30-minutes of inactivity. (Ideally, we would look at tasks, not sessions).
Key observation: we want users to find answers and complete tasks quickly, so queries/session should be smaller
In a controlled experiment, the variants get (approximately) the same number of users by design, so the last term is about equal
The OEC should therefore include the middle term: sessions/user

Controlled Experiments
Examples: you’re the decision maker
Running Experiments at scale and best practices
The cultural challenge
27

KDD 2013 paper to appear: http://bit.ly/ExPScale
We now run over 250 concurrent experiments at Bing
We used to lockdown for Dec holidays. No more

It is usually a safe assumption that you only have oneversion of your software in production at a time
-- Jez Humble and David Farley from Continuous Delivery

In a visit, you’re in about 15 experiments
There is no single Bing. There are 30B variants (5^15)
90% of users are in experiments.10% are kept as holdout
Sensitivity: we need to detect small effects
0.1% change in the revenue/user metric > $1M/year
Not uncommon to see unintended revenue impact of +/-1% (>$10M)
Sessions/UU, a key component of our OEC, is hard to move, so we’re looking for small effects
Important experiments run on 10-20% of users
UI Ex
p 1
Ex
p 2
Ex
P 3
Exp
4
Exp
5
Ads Ex
P
1
Ex
P 2
Ex
P 3
ExP
4
Exp
5
Rele
vance
…
…
Feature
area

Challenges
QA. You can’t QA all combinations, of course. What are the equivalence classes? For UI change, no need to QA combinations of relevance exps
Alarming on anomalies is critical: notify experiment owners that there’s a big delta on metric M (100 metrics) for browser B
Interactions (optimistic experimentation): everyone experiments.Run statistical tests for pairwise interactions, and notify owners.
Carryover effects: reuse of “bucket of users” from one experiment to the next is problematic

Bing server time is under one second at the 95th percentile
Is it worth improving?
We ran slowdown experiments to see the impact: we introduce an artificial server delay
Performance matters a LOT. Here’s the summary:
An engineer that improves server performance by 10msec (that’s 1/30 of the speed that our eyes blink) more than pays for his fully-loaded annual costs
Every millisecond counts

We made small changes to font colors in August 2013
Can you see? Can you figure out which is better?
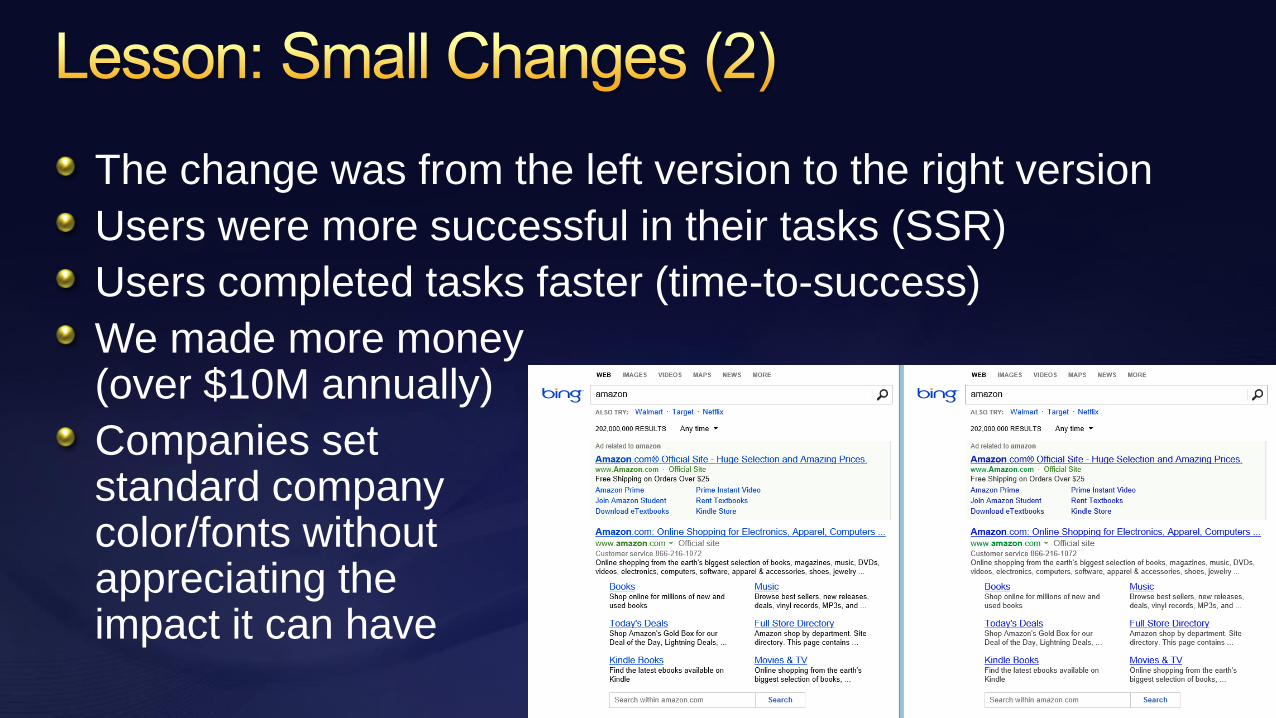
The change was from the left version to the right version
Users were more successful in their tasks (SSR)
Users completed tasks faster (time-to-success)
We made more money(over $10M annually)
Companies set standard company color/fonts without appreciating the impact it can have

Run A/A tests – simple, but highly effective
Run an experiment where the Treatment and Control variants are coded identically and validate the following:1. Are users split according to the planned percentages?
2. Is the data collected matching the system of record?
3. Are the results showing non-significant results 95% of the time?
This is a powerful technique for finding problems
Generating some numbers is easy
Getting correct numbers you trust is much harder!
Bots are lucrative business, but they skew the statistics
At Bing, >50% of traffic comes from botsActual picture I took

Ramp-upStart an experiment at 0.1%
Do some simple analyses to make sure no egregious problems can be detected
Ramp-up to a larger percentage, and repeat until 50%
Big differences are easy to detect because the min sample size is quadratic in the effect we want to detect
Detecting 10% difference requires a small sample and serious problems can be detected during ramp-up
Detecting 0.1% requires a population 100^2 = 10,000 times bigger
Abort the experiment if treatment is significantly worse on key metrics
37

Controlled Experiments
Examples: you’re the decision maker
Running Experiments at scale and best practices
The cultural challenge
38

Why people/orgs avoid controlled experiments
Some believe it threatens their job as decision makers
At Microsoft, program managers select the next set of features to develop. Proposing several alternatives and admitting you don’t know which is best is hard
Editors and designers get paid to select a great design
Failures of ideas may hurt image and professional standing.It’s easier to declare success when the feature launches
We’ve heard: “we know what to do. It’s in our DNA,” and“why don’t we just do the right thing?”
39
It is difficult to get a man to understand something when
his salary depends upon his not understanding it.
-- Upton Sinclair

The org goes through stages in its cultural evolution
Stage 1: we know what to do and we’re sure of it
True story from 1849
John Snow claimed that Cholera was caused by polluted water
A landlord dismissed his tenants’ complaints that their water stankEven when Cholera was frequent among the tenants
One day he drank a glass of his tenants’ water to show there was nothing wrong with it
He died three days later
That’s hubris. Even if we’re sure of our ideas, evaluate them
Controlled experiments are a powerful tool to evaluate ideas

Measurement
• Semmelweis worked at Vienna’s General Hospital, animportant teaching/research hospital, in the 1830s-40s
• In 19th-century Europe, childbed fever killed more than a million women
• Measurement: the mortality rate for women giving birth was
• 15% in his ward, staffed by doctors and students
• 2% in the ward at the hospital, attended by midwives

InsightControl
• He tries to control all differences
• Birthing positions, ventilation, diet, even the way laundry was done
• He was away for 4 months and death rate fell significantly when he was away. Could it be related to him?
• Insight:
• Doctors were performing autopsies each morning on cadavers
• Conjecture: particles (called germs today) were being transmitted to healthy patients on the hands of the physicians
He experiments with cleansing agents
• Chlorine and lime was effective: death rate fell from 18% to 1%

Success? No! Disbelief. Where/what are these particles?Semmelweis was dropped from his post at the hospital
He goes to Hungary and reduced mortality rate in obstetrics to 0.85%
His student published a paper about the success. The editor wrote
We believe that this chlorine-washing theory has long outlived its usefulness… It is time we are no longer to be deceived by this theory
In 1865, he suffered a nervous breakdown and was beaten at a mental hospital, where he died
Semmelweis Reflex is a reflex-like rejection of new knowledge because it contradicts entrenched norms, beliefs or paradigms
Only in 1800s? No! A 2005 study: inadequate hand washing is one of the prime contributors to the 2 million health-care-associated infections and 90,000 related deaths annually in the United States

In 1879, Louis Pasteur showed the presence of Streptococcus in the blood of women with child fever
2008, 143 years after he died, there is a 50 Euro coin commemorating Semmelweis

Without fundamental understanding, you make mistakes
Scurvy is a disease that results from vitamin C deficiency
It killed over 100,000 people in the 16th-18th centuries, mostly sailors
First known controlled experiment in 1747Dr. James Lind noticed lack of scurvy in Mediterranean ships
Gave some sailors limes (treatment), others ate regular diet (control)
Experiment was so successful, British sailors are still called limeys
But Lind didn’t understand the reasonAt the Royal Naval Hospital in England, he treated Scurvy patients with concentrated lemon juice called “rob.”
He concentrated the lemon juice by heating it, thus destroying the vitamin C
He lost faith in the remedy and became increasingly reliant on bloodletting
In 1793, a formal trial was done and lemon juice became part of the daily rations throughout the navy; Scurvy was quickly eliminated

HubrisMeasure and
Control
Accept Results avoid
Semmelweis Reflex
Fundamental Understanding
In many areas we’re in the 1800s in terms of our understanding, so controlled experiments can help
First in doing the right thing, even if we don’t understand the fundamentals
Then developing the underlying fundamental theories

1. Empower the HiPPO with data-driven decisionsHiPPO = Highest Paid-Person in Org, or Highest Paid-Person’s Opinion
Hippos kill more humans than any other (non-human) mammal (really)
OEC: make sure the org agrees what you are optimizing (long term lifetime value)
2. It is hard to assess the value of ideasListen to your customers – Get the data
Prepare to be humbled: data trumps intuition
3. Compute the statistics carefullyGetting a number is easy. Getting a number you should trust is harder
4. Experiment often to accelerate innovationTriple your experiment rate and you triple your success (and failure) rate.Fail fast & often in order to succeed
47
The less data, the stronger the opinions

This talk: http://bit.ly/expQCon
http://exp-platform.com has papers, talks including
Controlled Experiments on the Web: Survey and Practical Guide(Data Mining and Knowledge Discovery journal)
Online experiments at Microsoft(Third Workshop on Data Mining Case Studies and Practice Prize)
Trustworthy Online Controlled Experiments: Five Puzzling Outcomes Explained (KDD 2012)
Online Controlled Experiments at Large Scale (KDD 2013)
Nice Etsy talk: http://www.slideshare.net/danmckinley/design-for-continuous-experimentation