Embed Size (px)
Citation preview

Control Strategies for PAA Wastewater Disinfection at WWTPs
with Variable Effluent Quality
Philip Block1*
, Scott Morgan2, Kati Bell
3, Sarah Stewart
4
1PeroxyChem, Philadelphia, PA
2City of Memphis, TN
3CDM Smith, Nashville, TN
4CDM Smith, Houston, TX
ABSTRACT
The dose of peracetic acid that is required to control microbial concentration in wastewaters
will depend on a number of factors, including: target microorganism, the disinfection contact
time, and the characteristic quality of the wastewater effluent. Wastewater characteristics that
impact peracetic acid oxidant demand, and hence disinfection performance, may include natural
organic matter, reduced metals, biological oxygen demand, chemical oxygen demand and total
suspended solids. For most treated municipal wastewater effluent, the quality of the wastewater
is such that the peracetic initial oxidant demand is relatively low and stable over time. This
allows PAA dose to be controlled using simple flow-pacing, once the oxidant demand is
known. With recent advances in on-line, continuous PAA monitoring probes, feedback control
based on effluent PAA residual could also be combined with flow pacing to provide robust and
reliable PAA dose control.
However, there are situations where wastewater effluent quality is highly variable, due to any
number of factors, such as intermittent industrial discharges to the wastewater treatment plant.
Changing effluent conditions can result in variable PAA demand; thus, more active control on
PAA dosing may be required to optimize PAA performance in an effort to minimize
operational costs.
KEYWORDS: peracetic acid, disinfection, process control, water quality
INTRODUCTION
While chlorination is still the most commonly used disinfection technology for municipal
wastewater in the US, formation of chlorinated disinfection by-products (DBPs) has become a
concern, and is one of the major drivers for wastewater utilities to consider alternative
disinfection technologies. In recent years, peracetic acid (PAA) has gained momentum as an
alternative disinfection technology to chlorine1-3
due to its lack of DBP formation, its lower
aquatic toxicity profile, and its lower oxidant demand. Upon reaction with bacteria and viruses,

natural organic matter, reduced metals and suspended solids, PAA decomposes to oxygen,
water and acetic acid. As a result, chlorinated by-products are not formed. In addition, PAA
does not persist in the environment once discharged, so quenching, which would be the
analogous process to de-chlorination, is typically not required.
Peracetic acid is delivered as an equilibrium solution comprised of peracetic acid, hydrogen
peroxide, acetic acid (vinegar) and water, and has been used in a variety of industries, including
the medical and food safety markets, as a disinfectant and sterilizing agent. While its use as a
wastewater disinfectant is relatively new in the US municipal market, its effectiveness on
controlling bacterial microorganisms is well-known4.
The effective dose of peracetic acid will depend on a number of factors, including: the target
microorganism, disinfection contact time, and the quality of the wastewater effluent.
Wastewater characteristics that impact PAA oxidant demand, and hence performance, may
include natural organic matter, reduced metals, biological oxygen demand, chemical oxygen
demand and total suspended solids. For many wastewater treatment facilities, the quality of the
wastewater is such that the PAA oxidant demand is relatively low and stable over long periods,
and may only show seasonal variability. In addition, the demand on the PAA is generally very
rapid, occurring within the first few minutes of contact time. As a result, once the initial PAA
dose is determined through jar or pilot testing, meeting a specific microbial reduction
requirement becomes a matter of maintaining a constant PAA dose. This allows for PAA
dosing to be controlled using simple flow-pacing. With advances in on-line, continuous PAA
monitoring probes, feedback control based on effluent PAA residual can also be combined with
flow pacing.
However, there are treatment facilities where wastewater effluents have characteristics that are
highly variable, with water quality fluctuating weekly, sometimes even daily. This may be due
to any number of factors; one example is where wastewater is impacted by industrial discharges
that may have compositional changes arising from operational and production scheduling.
These changing influent conditions can result in a variable PAA demand. This variable demand
may result in either an under-dosing of the PAA, if the residual feedback control cannot keep
up with the fluctuating demand changes, or an over-dosing of PAA, if an initial PAA dose is set
to cover the worst-case oxidant demand of the wastewater. In such cases, more active control of
the PAA dosing is required to optimize PAA performance and achieve reliable microbial
control, while minimizing chemical consumption costs. An alternative control scheme is to use
influent water quality parameters as input variables to drive a feed-forward control algorithm.
This requires an understanding of how specific water quality parameters impact PAA demand
over the full range of temporal water quality; and it is important to obtain sufficient data to fit
an algebraic formula on which process control can be based.
BACKGROUND
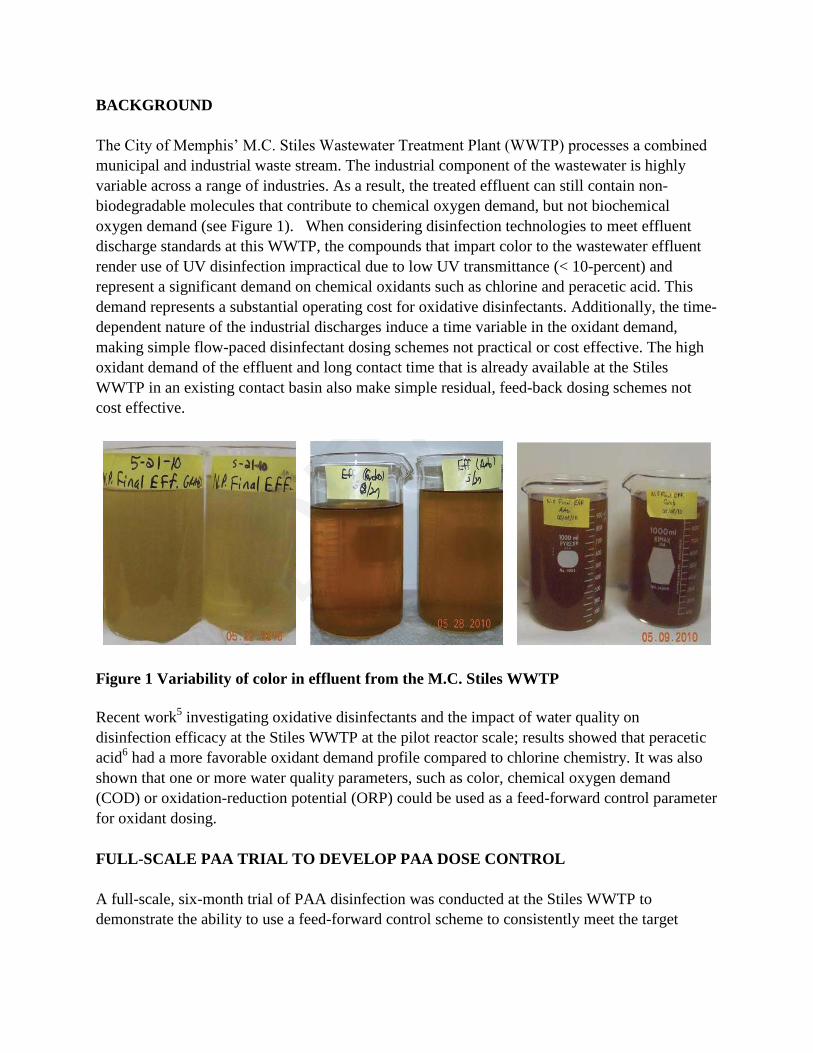
The City of Memphis’ M.C. Stiles Wastewater Treatment Plant (WWTP) processes a combined
municipal and industrial waste stream. The industrial component of the wastewater is highly
variable across a range of industries. As a result, the treated effluent can still contain non-
biodegradable molecules that contribute to chemical oxygen demand, but not biochemical
oxygen demand (see Figure 1). When considering disinfection technologies to meet effluent
discharge standards at this WWTP, the compounds that impart color to the wastewater effluent
render use of UV disinfection impractical due to low UV transmittance (< 10-percent) and
represent a significant demand on chemical oxidants such as chlorine and peracetic acid. This
demand represents a substantial operating cost for oxidative disinfectants. Additionally, the time-
dependent nature of the industrial discharges induce a time variable in the oxidant demand,
making simple flow-paced disinfectant dosing schemes not practical or cost effective. The high
oxidant demand of the effluent and long contact time that is already available at the Stiles
WWTP in an existing contact basin also make simple residual, feed-back dosing schemes not
cost effective.
Figure 1 Variability of color in effluent from the M.C. Stiles WWTP
Recent work5 investigating oxidative disinfectants and the impact of water quality on
disinfection efficacy at the Stiles WWTP at the pilot reactor scale; results showed that peracetic
acid6 had a more favorable oxidant demand profile compared to chlorine chemistry. It was also
shown that one or more water quality parameters, such as color, chemical oxygen demand
(COD) or oxidation-reduction potential (ORP) could be used as a feed-forward control parameter
for oxidant dosing.
FULL-SCALE PAA TRIAL TO DEVELOP PAA DOSE CONTROL
A full-scale, six-month trial of PAA disinfection was conducted at the Stiles WWTP to
demonstrate the ability to use a feed-forward control scheme to consistently meet the target
microbial reduction required by the WWTP’s National Pollutant Discharge Elimination NPDES
permit. The objectives of the trial included:
Characterization the impact of water quality on peracetic acid (PAA) demand over time,
Identification of key water quality parameters for use in feed-forward control of PAA
dosing,
Development of a PAA dose control algorithm,
Determination of the optimal PAA dose to achieve the required Escherichia coli (E. coli)
concentration for discharge under the NPDES permit, and
Demonstration and verification of continuous PAA control for disinfection compliance.
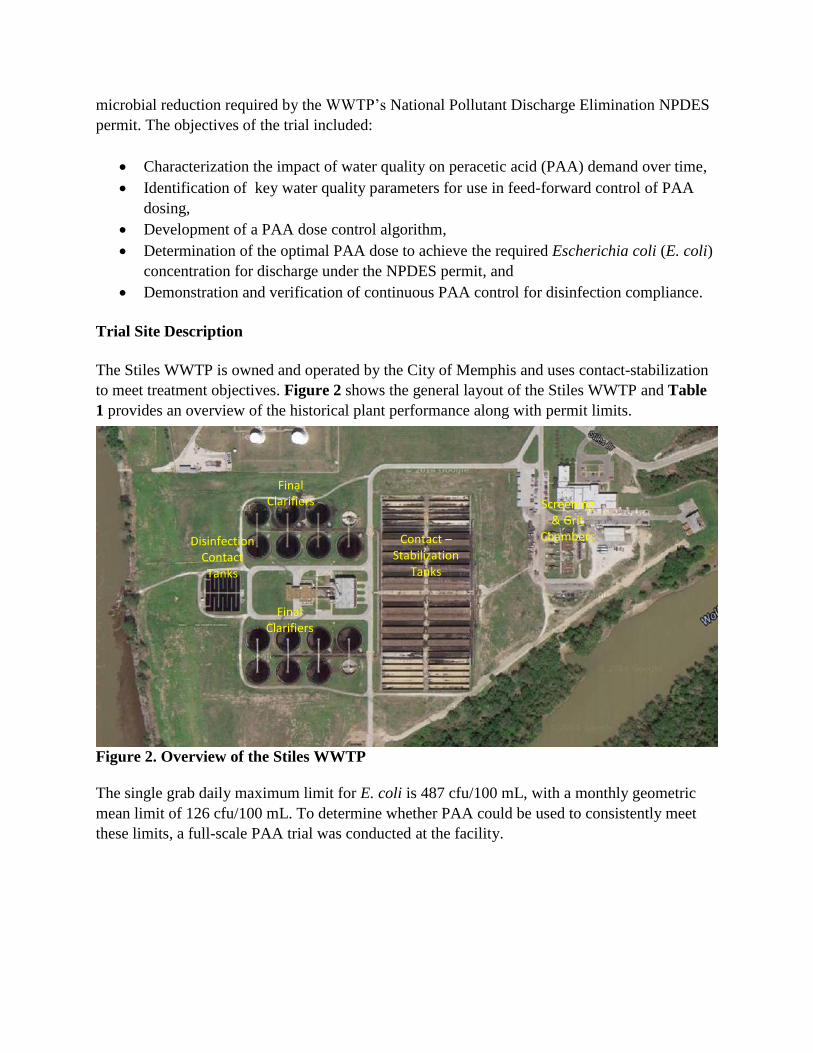
Trial Site Description
The Stiles WWTP is owned and operated by the City of Memphis and uses contact-stabilization
to meet treatment objectives. Figure 2 shows the general layout of the Stiles WWTP and Table
1 provides an overview of the historical plant performance along with permit limits.
The single grab daily maximum limit for E. coli is 487 cfu/100 mL, with a monthly geometric
mean limit of 126 cfu/100 mL. To determine whether PAA could be used to consistently meet
these limits, a full-scale PAA trial was conducted at the facility.
Figure 2. Overview of the Stiles WWTP
Disinfection Contact Tanks
Screening & Grit
Chambers
Final Clarifiers
Contact – Stabilization
Tanks
Final Clarifiers

Table 1. Historical effluent water quality characteristics at the Stiles WWTP.
Parameter
Daily Performance Data Draft NPDES Limit
Minimum observed
Average or mean
1
Maximum observed
Daily (minimum; maximum)
Weekly maximum
Monthly maximum
Daily Flow2 (MGD) 58 94 232 135 -- --
BOD3 (mg/L) 5 34 144 86.1 64.7 43.1
TSS3 (mg/L) 1 22 103 104 78 52
pH4 (s.u.) 6.5 7.2 8.1 6.0 – 9.0 -- --
E. coli5 (cfu/100mL) 1.3 x 10
4
6.0 x 10⁵
(4.4 x 10⁵ as
geomean) 1.1 x 10
7 487 ..
126 as geomean
Apparent color6
(PtCo units) 29 749 2084 -- -- --
True color6
(PtCo units) 24 619 2000 -- -- --
Apparent UVT6 (%) 0 9.3 36 -- -- --
Filtered UVT6 (%) 0.6 16 71.9 -- -- --
1arithmetic means were reported for all values except E. coli which is also reported as a geometric mean
2average daily influent flow values, period of record: 9/1/09 – 5/31/13
3daily values taken from composite effluent samples, period of record: 9/1/09 – 5/31/13
4daily values taken from grab effluent samples, period of record: 9/1/09 – 12/31/12
5daily values taken from grab effluent samples, period of record: 1/17/08- 7/11/13
6daily values taken from composite effluent samples, period of record: 8/11/11 – 5/21/13
The Stiles WWTP was originally constructed to provide chlorine disinfection; however, due to
concerns over disinfection by-products and their impact on aquatic organisms in the receiving
waterbody, the practice was never implemented. Thus, the WWTP has an existing contact
chamber (Figure 3); it is a typical two train serpentine configuration designed provide plug flow
for 15 minutes at the peak hour flow of 250 million gallons per day (MGD). Flows from the
north and south sides of the plant are combined in a mixing chamber at the head of the
disinfection contact tank; flow then splits into the north and south channels. It was assumed
throughout the PAA trial that flow was completely mixed with respect to flow, water quality and
E. coli concentrations in the mixing chamber prior to flow splitting into each of the two channels.
At the end of each channel, treated effluent flows over a weir, and combines in a common pipe
before being discharged to the Mississippi River.
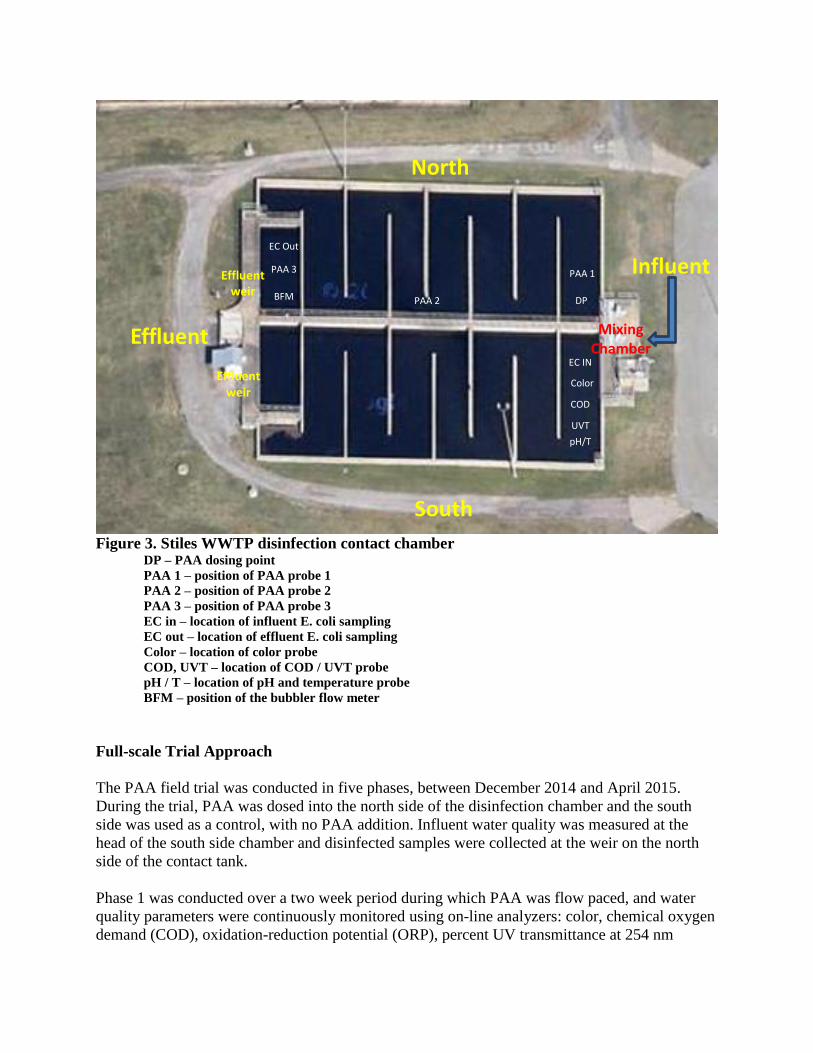
Figure 3. Stiles WWTP disinfection contact chamber DP – PAA dosing point
PAA 1 – position of PAA probe 1
PAA 2 – position of PAA probe 2
PAA 3 – position of PAA probe 3
EC in – location of influent E. coli sampling
EC out – location of effluent E. coli sampling
Color – location of color probe
COD, UVT – location of COD / UVT probe
pH / T – location of pH and temperature probe
BFM – position of the bubbler flow meter
Full-scale Trial Approach
The PAA field trial was conducted in five phases, between December 2014 and April 2015.
During the trial, PAA was dosed into the north side of the disinfection chamber and the south
side was used as a control, with no PAA addition. Influent water quality was measured at the
head of the south side chamber and disinfected samples were collected at the weir on the north
side of the contact tank.
Phase 1 was conducted over a two week period during which PAA was flow paced, and water
quality parameters were continuously monitored using on-line analyzers: color, chemical oxygen
demand (COD), oxidation-reduction potential (ORP), percent UV transmittance at 254 nm
North
Effluent weir
Influent
Mixing
Chamber Effluent
Effluent weir
South
DP
EC IN
EC Out
BFM
PAA 1
PAA 2
PAA 3
Color
COD
UVT
pH/T

(UVT), pH and temperature. Grab samples were collected to evaluate E. coli concentrations at
the influent and effluent of the disinfection contact tank. PAA residuals were measured at three
locations throughout the contact tank using online monitoring probes. The Phase 1 data were
analyzed, and correlations between each water quality parameter, PAA demand and E. coli
reduction were performed. The two ―best‖ parameters were selected based on the highest r2 value
from a least-squares fit of the data to PAA demand, and the greatest sensitivity of that parameter
to PAA demand (greatest slope in the change of the quality parameter versus change in the PAA
demand). Using the selected parameters, a feed-forward algorithm, coupled with flow pacing,
was developed to control PAA dose based on each parameter.
Phase 2 was conducted over a two week period, utilizing the dose algorithm developed from
Phase 1 data for color. Disinfection performance was evaluated over a wide range of effluent
color concentrations and flows. Phase 3 was conducted similarly to Phase 2, except the dose
algorithm was based on COD. After Phase 3, the algorithm providing the greatest performance
with respect to microbial reductions and PAA use rates was identified for additional testing.
Phase 4 was a month long assessment of disinfection performance using the PAA dose algorithm
based on color, selected after Phase 3. During this phase, adjustment of the algorithm and base
PAA dose was conducted to maximize disinfection performance while minimizing the dose
required. Final verification and qualification of the VigorOx WWTII control algorithm was
assessed during the final month-long Phase 5. The refined PAA dose algorithm, as determined
during Phase 4 was implemented and disinfection performance was monitored.
Instrumentation for Monitoring Water Quality
Peracetic acid was measured in situ via the Prominent Dulcotest CTE sensor. The sensor is a
membrane-capped amperometric, two electrode sensor for the measurement of PAA in aqueous
solution. It has a platinum working electrode and a silver halide coated counter or reference
electrode. PAA contained in the sample water diffuses through the membrane, causing a
potential difference between electrodes. Three PAA submersible probes were placed into the
disinfection contact tank (north side, PAA dosing): a 10 ppm PAA probe one quarter of the
distance down the contact tank (Probe 1, P1), a 10 ppm PAA probe one half the distance down
the contact tank (Probe 2, P2), and a 2 ppm PAA probe located at the effluent weir (Probe 3, P3)
(see Figure 3).
Wastewater color was measured on-line utilizing a ChemScan UV-3151 Series Analyzer with a
flow-through sensor. The analyzer draws a sample of wastewater from the untreated side of the
disinfection channel, representative of the influent wastewater, to the main unit, located in a
control house adjacent to the disinfection contact tank. Periodic grab samples were collected and
measured using a portable HANNA Instruments (HI96127) color meter. Calibration of the
ChemScan unit was performed if greater than a 10-percent difference was observed between
results from the two instruments. The color analyzer was stable through the course of the trial,
requiring minor daily cleaning of an internal filter as its maintenance profile.
Wastewater COD and UV transmittance (UVT at 254 nm) was measured online using a
submersible YSI CarboVis model 701. Periodic grab samples were collected and measured using
a benchtop HACH DRB200 COD analyzer and a bench scale HACH DR5000
spectrophotometer. Calibration of the YSI CarboVis was performed if greater than 10-percent

difference between COD or UVT was observed between the online and benchtop instruments.
The COD and UVT analyzers remained stable throughout the trial, with cleaning every two to
three days. Measurements were made in the control side of the disinfection contact tank.
ORP, pH and temperature were measured using a SensoLyt multi-probe. The probes required
little maintenance, except for occasional cleaning.
Two McCrometer SPI Mag™ Model 282L Single Point Insertion Electromagnetic Flow Meters
(IFM) were inserted, one each, into the north and south side wastewater conduit pipe prior to
entering the mixing chamber of the contact tank. The IFM proved to be significantly interfered
with by organic solid material within the wastewater. This introduced error into the measured
flow, and impacted the target PAA dose concentration via the flow-pacing algorithm. As a result,
the IFM were replaced for Phase 4 and 5 with a Teledyne ISCO Signature® bubbler-type flow
meter (BFM), which was inserted into the disinfection channel right before the outflow weir. The
BFM was shown to be highly stable and reproduced accurately the wastewater flow rate as
determined upstream by the plant. As the BFM only measures flow through the north side of the
disinfection channel, total plant flow was determined as twice the BFM measurement.
Disinfection Performance Sampling
Grab samples were collected Monday through Friday at the influent, effluent and midpoint of the
disinfection contact tank for E. coli (see Figure 3). In Phases 1, 2 and 3, samples were obtained
three times a day (at approximately 8 am, 10 am and 2 pm) at the three locations. During Phase
4, samples were collected three times a day, but only at the influent and effluent of the
disinfection contact tank. For Phase 5, samples were collected once a day, at 10 am, for both the
influent and effluent. Upon collection, the wastewater samples were stabilized using sodium
thiosulfate that was provided in the sample containers to quench PAA so that disinfection did not
continue during sample transport. E. coli analysis were performed by a third-party laboratory.
RESULTS AND DISCUSSION
Results of the full-scale trial are presented in the following sections by Phase, with key
observations from each Phase being noted.
Phase 1: Assessment of Influent Water Quality Parameters
The first phase was a ten day trial designed to assess undisinfected wastewater quality (color,
COD, UVT and ORP) and the impact on PAA demand. PAA dosing for Phase 1 was initially set
at 10 ppm; due to relatively low wastewater flow in later stages of Phase I, very low PAA dose
pump speeds caused PAA to be delivered in a discontinuous, pulse-like fashion. To overcome
this operational issue, the PAA dose was increased to 15 ppm.
Results of effluent color and COD collected during Phase 1 are provided in Figure 4; results of
UVT and color and ORP are provided in Figure 5. Wastewater color ranged from a maximum of
1950 to a minimum of 400 color units and COD ranged from 82 to 355 mg/L during this Phase.
The high color and COD data were correlated to periods when particularly industrial users were
discharging; when these users stopped production, wastewater color decreased substantially.

PAA residual at Probe 1 was observed to increase when color decreased; COD also decreased
and UV transmittance showed a general increase during this period.
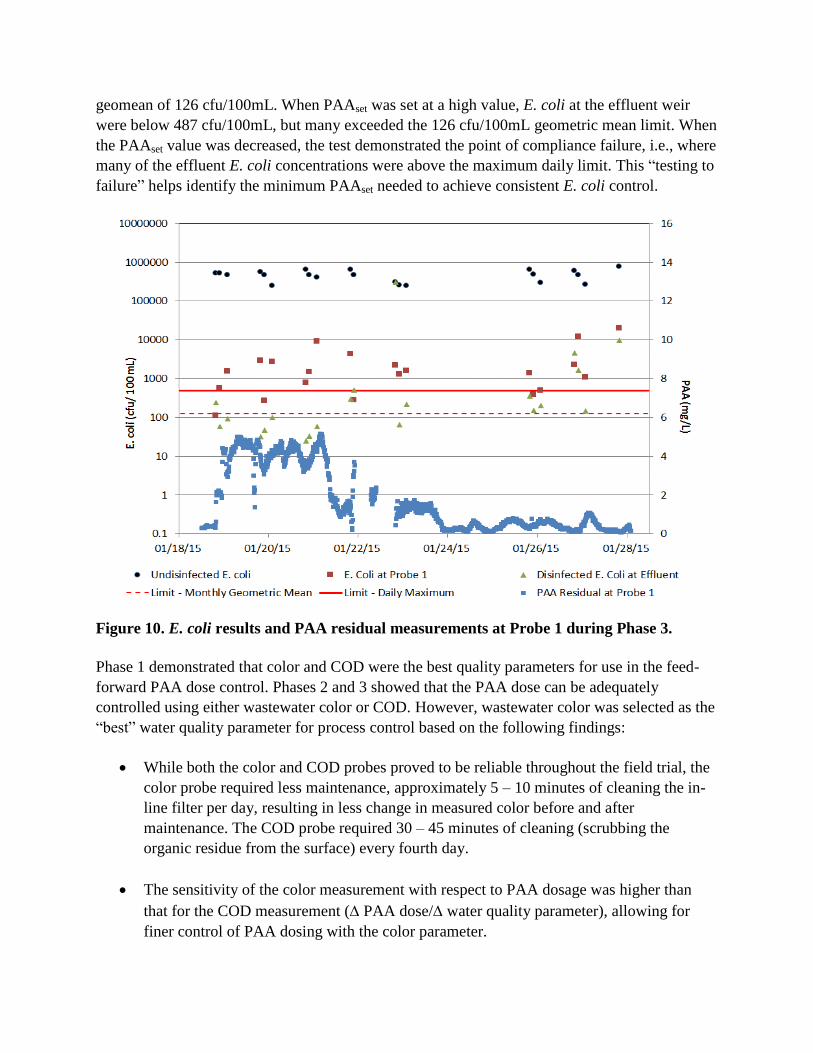
The PAA residuals at the midpoint (P2) and end of the contact tank (P3) at the effluent weir were
near the detection limit of the analyzer throughout the phase and are not shown; as a result, the
analysis of Phase 1 data is based on the residuals reported at the analyzer located nearest the
PAA application point (P1). PAA residuals at Probe 1 are shown in Figure 6 along with E. coli
results. As shown in Figure 6, when the PAA residual at Probe 1 is 4 ppm or higher, the
disinfected E. coli concentration was 126 cfu/100 mL or lower.
Figure 4. Color and COD measurements during Phase 1.
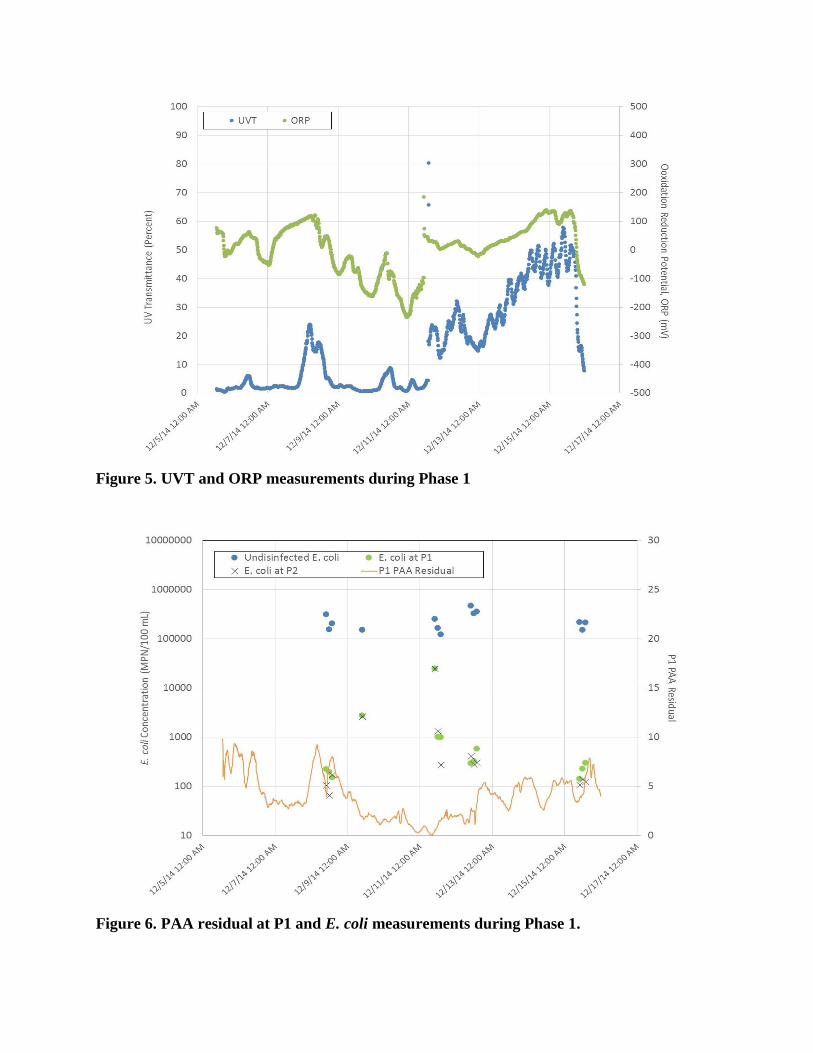
Figure 5. UVT and ORP measurements during Phase 1
Figure 6. PAA residual at P1 and E. coli measurements during Phase 1.

While successful PAA dosing can be achieved by a flow-pacing regime at many WWTPs, the
time-dependent water quality demand on PAA at the Stiles WWTP observed during Phase 1 of
this trial clearly demonstrates the need to implement feed-forward dosing scheme. This will
provide proper dosing of PAA needed to achieve the target microbial reduction in a proactive,
instead of reactive mode. The feed-forward dose control algorithm is based on Equation 1.
PAAdose = PAAset + PAAdemand Equation 1
PAAdose is then flow-paced to using a flow signal. The PAA residual at Probe 1 is thus dependent
on two factors: the PAAdemand associated with oxidation of non-target compounds in the effluent
and flow. Flow impacts the apparent PAA demand due to the time-dependent nature of the
demand kinetics and PAA auto-decomposition. Additionally, flow impacts the hydraulics of the
disinfection channel, resulting in non-ideal flow for some flow regimes. For each water quality
parameter, PAAdemand is assessed through statistical analysis of PAA residual as a function of the
wastewater quality parameter and flow.
Based on the statistical analyses, wastewater color (r2 = 0.70) and COD (r
2 = 0.66) were selected
for building dose control algorithms further testing. The UVT of the effluent was too low (< 5-
percent) to provide adequate sensitivity for dose control; ORP did not provide a sufficient fit
(low r2) to be selected as a parameter for control.
Phase 2: Effluent Color for Feed-forward Dose Control
During Phase 2, color was used as a feed-forward control parameter for PAA dosing. The first E.
coli sample point was moved to a position coincident with PAA Probe 1 because there was only
a very small difference between the E. coli concentrations halfway through the contact tank and
those at the end of the basin, collected at the effluent weir. PAAdemand was determined as a
function of wastewater color, based on Phase 1 data. Color was continuously monitored, and
PAA demand was calculated from the measured color value. During Phase 2, low and high
PAAset values were evaluated and PAAdose was paced using a signal from the flow meter.
Data for PAA dose were plotted along with effluent color, and PAA residual at Probe 1, and are
provided in Figure 7; during this phase ranged from 590 to 2000 PtCo units. Again, the PAA
residuals at P2 and P3 were near the detection limit of the analyzer throughout the phase and are
not shown; as a result, the analysis of data for the rest of the study is based on the residuals
reported at P1, which are shown in Figure 8 along with E. coli results.

Figure 7. Color and PAA residual measurements during Phase 2.
Figure 8. E. coli results and PAA residual measurements at Probe 1 during Phase 2.

It is of note that during Phase 2, the data logger stopped recording from January 8, 2015, 9:10 am
to January 9, 2015, 1:00 pm; while the cause of this was not determined, it does not alter the
conclusions drawn from Phase 2. Additionally, in Figure 2, an increase in PAA dose is noted on
January 12, 2015; this was the planned increase in PAA dose halfway through the study.
Results of E. coli testing showed that color was a good feed forward parameter for managing
disinfection process control. All E. coli samples were below the maximum daily limit of 487
cfu/100mL and, all but two samples were below the monthly geometric mean limit of 126
cfu/100 mL which would easily meet disinfection compliance requirements. The E. coli data at
Probe 1 shows that in most cases, the majority of the disinfection is accomplished in the first few
minutes of contact; however, it is necessary to provide additional contact time to achieve
disinfection to meet permit requirements.
In addition to the online color data collected on the undisinfected effluent, grab samples were
also collected at the influent (at the location of the water quality probes) and at the effluent of the
contact basin (near Probe 3) for laboratory measurements of apparent and true color. Apparent
color is the direct color reading of the sample, while true color represents the results of the
filtered sample. Data for these daily grab samples is summarized in Table 2. It is of note that on
average, throughout the treatment in Phase 2 of testing, that the PAA reduced the color of the
effluent by approximately 100 Platinum-Cobalt (PtCo) units. It was not anticipated that PAA
would have a significant impact on effluent color; this is a secondary benefit of PAA for
disinfection at the Stiles WWTP.
Table 2. Summary of daily apparent and true color data collected from grab samples
Date
Apparent Color (PtCo units) True (filtered) Color (PtCo units)
Untreated flow PAA treated flow Difference Untreated flow PAA treated flow Difference
01/08/15 467 394 -73 336 269 -67
01/09/15 908 844 -64 802 624 -178
01/10/15 1264 1124 -140 870 696 -174
01/11/15 1208 1148 -60 824 696 -128
01/12/15 960 760 -200 508 396 -112
01/13/15 1000 872 -128 520 460 -60
01/14/15 1252 1056 -196 770 624 -146
01/15/15 850 626 -224 354 255 -99
01/16/15 572 550 -22 1392 1220 -172
01/17/15 686 646 -40 151 133 -18
01/18/15 500 498 -2 149 112 -37
Average Color Reduction -104 -108
Phase 3: Effluent COD for Feed-forward Dose Control
Phase 3 was conducted over a ten day period using COD as the feed-forward control in the PAA
dosing algorithm. PAAdemand was determined as a function of wastewater COD based on Phase 1
data. COD was continuously monitored, and PAA demand was calculated from the measured
COD value. During Phase 3, a high and a low PAAset value was tested with PAAdose being paced

using a flow signal. Phase 3 data for PAA dose was plotted along with effluent COD, and PAA
residual measured at Probe 1 in Figure 9.
Figure 9. COD and PAA residual measurements during Phase 3.
In reviewing Phase 3 data, there were two disruptions in data collection. The first occurred from
January 22, 2015 at 8:20 am to 6:30 pm when the PLC control became inoperative due to a
spurious signal being sent to the control algorithm; this programming issue was corrected. The
second disruption occurred during a loss of power to the plant from January 22, 2015 at 9:40 pm
to January 23, 2015 at 7:30 am. The loss of plant power caused a fault in the PAA dosing pump,
which required a manual restart which did not occur until the morning of January 23rd. Both
disruptions caused a loss in monitoring data and a disruption of PAA addition to the disinfection
channel, however, this loss of data does not significantly impact the conclusions drawn from
Phase 3. Considering process implications from the trial, the design team will include both
process and power redundancy in the final design of the system to prevent loss of PAA addition
that would result in loss of microbial control.
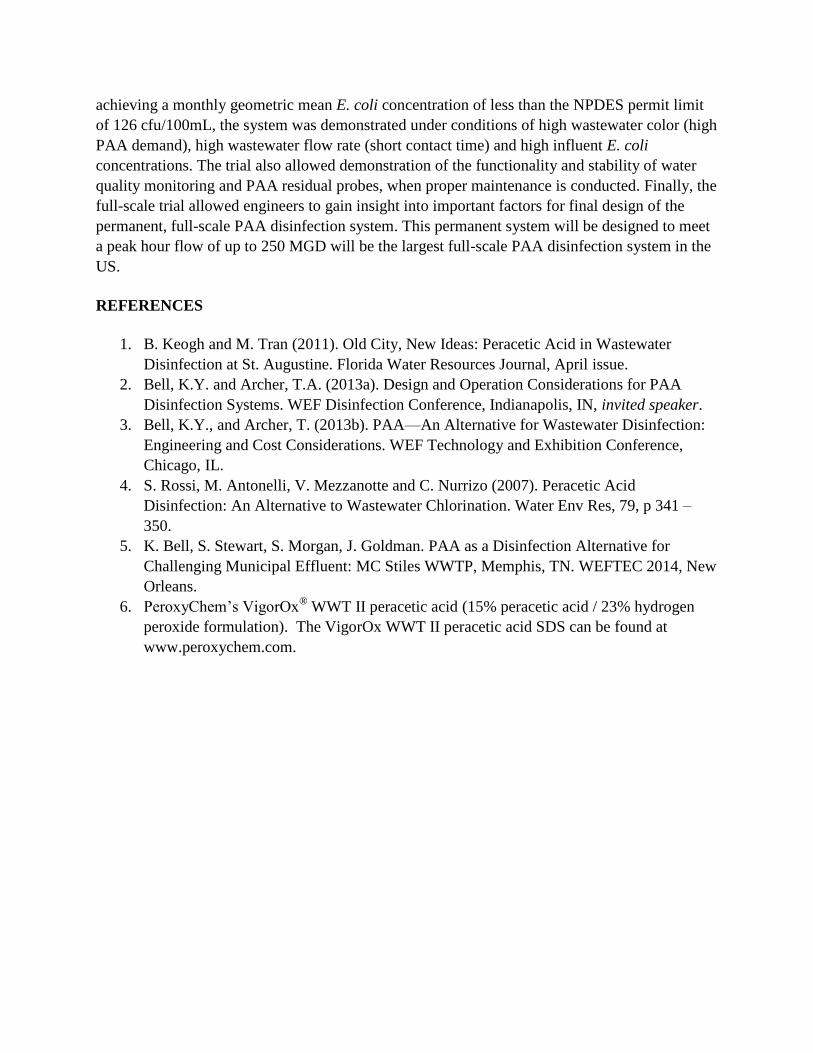
During Phase 3, effluent COD ranged from 128 to 413 mg/L, representing a range of wastewater
quality (Figure 9). Figure 10 shows undisinfected E. coli concentrations along with treated
samples at PAA Probe 1 and at the effluent weir at the contact tank. In Figure 10, the dashed red
line indicates the daily maximum of 487 cfu/100mL and the solid red line is the monthly
geomean of 126 cfu/100mL. When PAAset was set at a high value, E. coli at the effluent weir
were below 487 cfu/100mL, but many exceeded the 126 cfu/100mL geometric mean limit. When
the PAAset value was decreased, the test demonstrated the point of compliance failure, i.e., where
many of the effluent E. coli concentrations were above the maximum daily limit. This ―testing to
failure‖ helps identify the minimum PAAset needed to achieve consistent E. coli control.
Figure 10. E. coli results and PAA residual measurements at Probe 1 during Phase 3.
Phase 1 demonstrated that color and COD were the best quality parameters for use in the feed-
forward PAA dose control. Phases 2 and 3 showed that the PAA dose can be adequately
controlled using either wastewater color or COD. However, wastewater color was selected as the
―best‖ water quality parameter for process control based on the following findings:
While both the color and COD probes proved to be reliable throughout the field trial, the
color probe required less maintenance, approximately 5 – 10 minutes of cleaning the in-
line filter per day, resulting in less change in measured color before and after
maintenance. The COD probe required 30 – 45 minutes of cleaning (scrubbing the
organic residue from the surface) every fourth day.
The sensitivity of the color measurement with respect to PAA dosage was higher than
that for the COD measurement ( PAA dose/ water quality parameter), allowing for
finer control of PAA dosing with the color parameter.

Phase 4: Adjustment of Algorithm Using Color for Feed-forward Dose Control
Based on analysis of the Phase 2 and Phase 3 results, PAAset was programmed to 7 ppm for
Phase 4, which was designed to allow for additional minor adjustments to the dosing algorithm
to optimize chemical use. During Phase 4, severe weather impacted the delivery of chemicals to
the temporary trial system. Thus, a ―conservation‖ program was initiated part way through Phase
4 to reduce the amount of chemical used when critical data was not being collected. The
conservation program consisted of reducing the dosage of PAA into the disinfection contact tank
to a flow-paced 2 ppm, during periods when E. coli sampling did not occur (weekends and
weekday evening hours). It was shown that this reduction in off-hour PAA usage did not
negatively interfere with E. coli control during the weekday sampling periods and did not impact
the demonstration of the PAA efficacy. The PAA residual at Probe 1 is plotted along with
undisinfected and effluent weir E. coli data collected in Figure 12.
Figure 11. Color, PAA dose and PAA residual measurements during Phase 4.
Figure 11 shows the PAA dose based on the control algorithm and the measured color values. It
is of note that during the latter part of Phase 4, the PAA conservation mode was put into effect
and did not impact the monitoring that was used to develop an assessment of the process as
shown in Figure 12, which provides the undisinfected and effluent weir E. coli concentrations
along with the PAA residuals at Probe 1. The dashed and solid red lines in Figure 12 represent
the daily maximum concentration of 487 cfu/100mL and the monthly geometric mean of 126
cfu/mL, respectively.

Figure 12. E. coli results and PAA residual measurements at Probe 1 during Phase 4.
In addition to the conservation mode that was implemented during the latter part of Phase 4 (as
shown by the PAA residual oscillations in Figure 12), one other operational issue should be
noted in interpretation of the data from this phase of work. On the evening of February 19th
and
the morning of February 20th
, extremely cold weather caused the sample line to the color
analyzer to freeze, resulting in a loss PAA dose control. During that event, the PAA dose was
automatically set to the PAAset, which was a constant 7 ppm. This default operating condition did
not provide a high enough PAA dose to meet the demand associated with the highly colored
effluent, negatively impacting disinfection performance.
As shown in Figure 12, the effluent E. coli on the morning of February 20th
exceeded the daily
maximum limit. While this would have been a non-compliance event in the final, permitted
system, this event also highlighted design considerations that would need to be addressed in the
final system design. While there was a single non-compliance event as a result of operational
issues, the remaining tests demonstrated excellent results over several cycles of wastewater

quality and flows; effluent color ranged from 450 to 3000 color units and flows varied from
below 45 mgd up to 135 mgd.
Phase 5: Validation of the Peracetic Acid Dosing System
The operational and programming challenges that were identified in the previous phases were
reconciled and the final dosing control algorithm was set for Phase 5, which was a demonstration
of the ability of the system to meet compliance over a one month period. Validation of the
system and verification of a success trial demonstration was defined as meeting the permit limits
for E. coli throughout Phase 5 based on daily samples. The PAAset for Phase 5 was 7 ppm;
additionally, the PAA ―conservation program‖ was also continued during Phase 5, and consisted
of reducing the dosage of PAA into the disinfection contact tank to a flow-paced 2 ppm, during
periods when E. coli sampling did not occur (weekends and evenings). Results of the online
monitoring for effluent color, PAA dose and PAA residual at Probe 1 are shown in Figure 13. E.
coli were measured at the influent and effluent weir over the course of the thirty day Phase 5 trial
with one sampling period per day as shown in Figure 14.
Figure 13. Color, PAA dose and PAA residual measurements at Probe 1 during Phase 5.
During Phase 5 flow ranged from 75 to 130 MGD which included the highest flow through the
plant observed during the six month trial; these high flows represented the shortest contact times
observed. Effluent color was generally high throughout Phase 5, ranging from 1000 to 3000 PtCo

units. Based on the set dose of 7 ppm and the demand from the color, the PAA dose
concentration ranged from approximately 12 to 16 ppm during this phase.
During Phase 5, some of the highest undisinfected E. coli concentrations in the trial were
observed, with concentrations exceeding 1.2 million cfu/100mL. In all samples, the effluent weir
E. coli concentrations were below the daily maximum of 487 cfu/100mL, with only one sample
exceeding the monthly geometric mean of 126 cfu/100 mL at a concentration of 204 cfu/100mL,
on March 19th
. The geometric mean of the E. coli data collected during the thirty-day period was
4 cfu/100 mL, this included non-detect values to be calculated as 0.9 cfu/100 mL. Additionally,
the PAA dose algorithm was able to provide excellent treatment performance at very high color
and high undisinfected E. coli concentrations.
Figure 13. Color, PAA dose and PAA residual measurements at Probe 1 during Phase 5.
CONCLUSIONS
The six-month full scale trial successfully demonstrated the ability to use a dose pacing plus feed
forward algorithm to provide continuous disinfection at the Stiles WWTP. This process control
strategy allows the City of Memphis to address the bacteria limits in their NPDES permit while
minimizing the chemical costs associated with implementing PAA disinfection. Disinfection
performance was demonstrated over a broad range of water quality and flows; thus, in addition to
achieving a monthly geometric mean E. coli concentration of less than the NPDES permit limit
of 126 cfu/100mL, the system was demonstrated under conditions of high wastewater color (high
PAA demand), high wastewater flow rate (short contact time) and high influent E. coli
concentrations. The trial also allowed demonstration of the functionality and stability of water
quality monitoring and PAA residual probes, when proper maintenance is conducted. Finally, the
full-scale trial allowed engineers to gain insight into important factors for final design of the
permanent, full-scale PAA disinfection system. This permanent system will be designed to meet
a peak hour flow of up to 250 MGD will be the largest full-scale PAA disinfection system in the
US.
REFERENCES
1. B. Keogh and M. Tran (2011). Old City, New Ideas: Peracetic Acid in Wastewater
Disinfection at St. Augustine. Florida Water Resources Journal, April issue.
2. Bell, K.Y. and Archer, T.A. (2013a). Design and Operation Considerations for PAA
Disinfection Systems. WEF Disinfection Conference, Indianapolis, IN, invited speaker.
3. Bell, K.Y., and Archer, T. (2013b). PAA—An Alternative for Wastewater Disinfection:
Engineering and Cost Considerations. WEF Technology and Exhibition Conference,
Chicago, IL.
4. S. Rossi, M. Antonelli, V. Mezzanotte and C. Nurrizo (2007). Peracetic Acid
Disinfection: An Alternative to Wastewater Chlorination. Water Env Res, 79, p 341 –
350.
5. K. Bell, S. Stewart, S. Morgan, J. Goldman. PAA as a Disinfection Alternative for
Challenging Municipal Effluent: MC Stiles WWTP, Memphis, TN. WEFTEC 2014, New
Orleans.
6. PeroxyChem’s VigorOx® WWT II peracetic acid (15% peracetic acid / 23% hydrogen
peroxide formulation). The VigorOx WWT II peracetic acid SDS can be found at
www.peroxychem.com.