Embed Size (px)
Citation preview

1
CONTROL OF HEXAVALENT CHROMIUM EMISSION FROM WELDING USING SILICA PRECURSORS AS SHIELD GAS ADDITIVES
By
NATHAN E. TOPHAM
A THESIS PRESENTED TO THE GRADUATE SCHOOL OF THE UNIVERSITY OF FLORIDA IN PARTIAL FULFILLMENT
OF THE REQUIREMENTS FOR THE DEGREE OF MASTER OF ENGINEERING
UNIVERSITY OF FLORIDA
2010

2
© 2010 Nathan Topham

3
To my family

4
ACKNOWLEDGMENTS
I would like to thank my graduate advisor and committee chair, Dr. Chang-Yu Wu,
for his unending patience and support during my studies. Without his guidance and hard
work, this project would not have been possible. I would also like to thank my committee
members, Dr. Jean-Claude Bonzongo and Dr. Vito Ilacqua, for their suggestions and
support. Additionally, I’d like to thank my graduate mentor, Dr. Yu-Mei Hsu, for her
support during my studies. Her leadership helped inspire me to pursue a graduate
degree. I would also like to extend my gratitude to all of my fellow undergraduate and
graduate lab mates who helped throughout this research. Finally, I’d like to thank my
better half, Chelsea, for supporting me during the difficult times during my studies and
helping me find the strength to continue striving towards my goal when I faltered.

5
TABLE OF CONTENTS page
ACKNOWLEDGMENTS .................................................................................................. 4
LIST OF TABLES ............................................................................................................ 7
LIST OF FIGURES .......................................................................................................... 9
LIST OF ABBREVIATIONS ........................................................................................... 10
ABSTRACT ................................................................................................................... 11
CHAPTER
1 INTRODUCTION .................................................................................................... 13
Fundamentals of Arc Welding ................................................................................. 13
Physical and Chemical Properties of Welding Fumes ............................................ 14 Health Effects of Welding Fume Exposure ............................................................. 15 Welding Fume Sampling and Analysis.................................................................... 18
Past Attempts to Control Welding Fume Exposure ................................................. 19 Sorbents in Combustion Systems ........................................................................... 20
Objective of Study ................................................................................................... 22
2 EXPERIMENTAL METHODS ................................................................................. 24
Overview of Experimental Methods ........................................................................ 24 GTAW Fume Generation and Sampling ................................................................. 25 GTAW Experimental Conditions ............................................................................. 26
GTAW Sample Analysis .......................................................................................... 26 GMAW Fume Generation and Sampling................................................................. 27
GMAW Experimental Conditions ............................................................................ 29 GMAW Sample Analysis ......................................................................................... 30
3 RESULTS AND DISCUSSION – GAS TUNGSTEN ARC WELDING (GTAW) ....... 35
Results .................................................................................................................... 35 Discussion .............................................................................................................. 36
Cost Analysis .......................................................................................................... 37
4 RESULTS AND DISCUSSION – GAS METAL ARC WELDING (GMAW) .............. 39
TMS Cr6+ and Particle Size Distribution Results ..................................................... 39 30 Lpm Shield Gas Flow Rate .......................................................................... 39 30 Lpm Shield Gas Flow Rate Using High Voltage .......................................... 42 25 Lpm Shield Gas Flow Rate .......................................................................... 43

6
20 Lpm Shield Gas Flow Rate .......................................................................... 44
Effects of Shield Gas Flow Rate ....................................................................... 45 TMS Cost Analysis ................................................................................................. 46
Regulatory Compliance........................................................................................... 47
5 CONCLUSIONS ..................................................................................................... 61
APPENDIX
A DETERMINATION OF THEORETICAL MINIMUM PRECURSOR CONCENTRATION IN FUME PARTICLE FORMATION AREA ............................. 63
B DETERMINATION OF TMS AND TEOS VAPOR PRESSURE .............................. 66
C DETERMINATION OF PRECURSOR CONCENTRATION IN SATURATED CARRIER GAS ....................................................................................................... 67
D COST ANALYSIS ................................................................................................... 69
GTAW Operating Cost of TEOS Addition ............................................................... 69 GMAW Operating Cost of TMS Cost Addition ........................................................ 69
E RAW DATA FOR HEXAVALENT CHROMIUM ....................................................... 71
F SCANNING MOBILITY PARTICLE SIZER PARTICLE SIZE DISTRIBUTION DATA ...................................................................................................................... 73
G CASCADE IMPACTOR CUT SIZE AND PARTICLE SIZE DISTRIBUTION DATA ...................................................................................................................... 87
LIST OF REFERENCES ............................................................................................... 89
BIOGRAPHICAL SKETCH ............................................................................................ 96
7
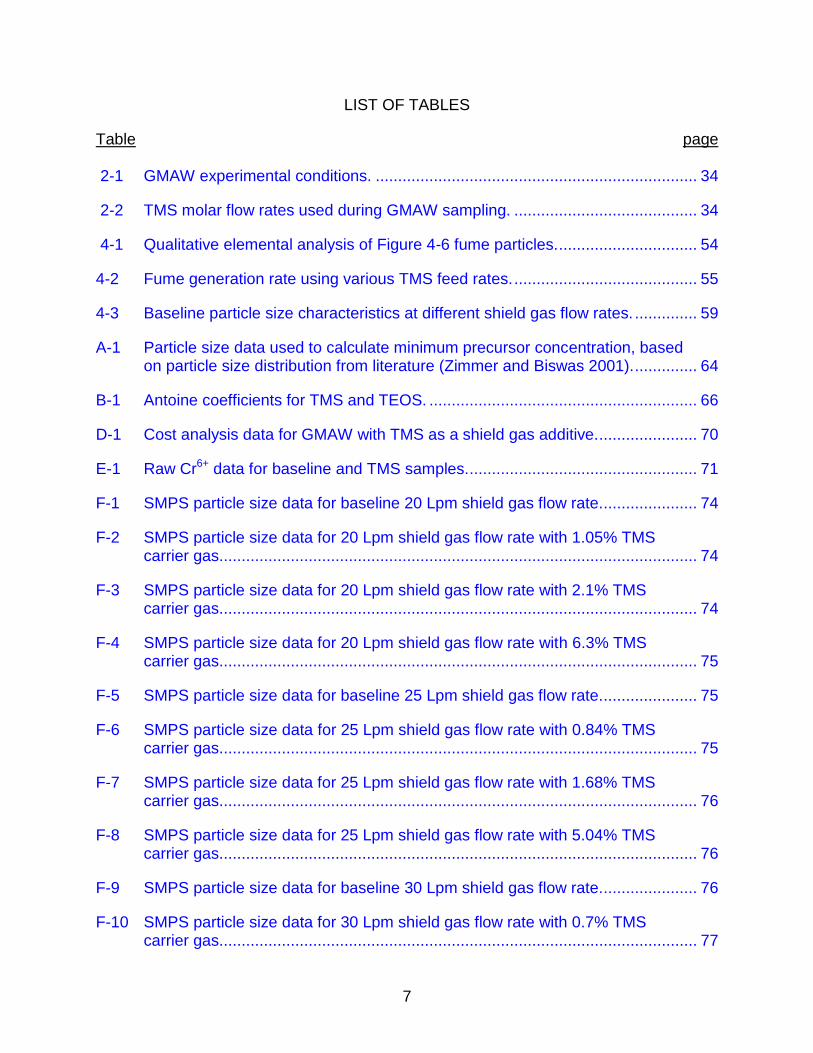
LIST OF TABLES
Table page 2-1 GMAW experimental conditions. ........................................................................ 34
2-2 TMS molar flow rates used during GMAW sampling. ......................................... 34
4-1 Qualitative elemental analysis of Figure 4-6 fume particles. ............................... 54
4-2 Fume generation rate using various TMS feed rates. ......................................... 55
4-3 Baseline particle size characteristics at different shield gas flow rates. .............. 59
A-1 Particle size data used to calculate minimum precursor concentration, based on particle size distribution from literature (Zimmer and Biswas 2001). .............. 64
B-1 Antoine coefficients for TMS and TEOS. ............................................................ 66
D-1 Cost analysis data for GMAW with TMS as a shield gas additive. ...................... 70
E-1 Raw Cr6+ data for baseline and TMS samples. ................................................... 71
F-1 SMPS particle size data for baseline 20 Lpm shield gas flow rate...................... 74
F-2 SMPS particle size data for 20 Lpm shield gas flow rate with 1.05% TMS carrier gas........................................................................................................... 74
F-3 SMPS particle size data for 20 Lpm shield gas flow rate with 2.1% TMS carrier gas........................................................................................................... 74
F-4 SMPS particle size data for 20 Lpm shield gas flow rate with 6.3% TMS carrier gas........................................................................................................... 75
F-5 SMPS particle size data for baseline 25 Lpm shield gas flow rate...................... 75
F-6 SMPS particle size data for 25 Lpm shield gas flow rate with 0.84% TMS carrier gas........................................................................................................... 75
F-7 SMPS particle size data for 25 Lpm shield gas flow rate with 1.68% TMS carrier gas........................................................................................................... 76
F-8 SMPS particle size data for 25 Lpm shield gas flow rate with 5.04% TMS carrier gas........................................................................................................... 76
F-9 SMPS particle size data for baseline 30 Lpm shield gas flow rate...................... 76
F-10 SMPS particle size data for 30 Lpm shield gas flow rate with 0.7% TMS carrier gas........................................................................................................... 77

8
F-11 SMPS particle size data for 30 Lpm shield gas flow rate with 1.4% TMS carrier gas........................................................................................................... 77
F-12 SMPS particle size data for 30 Lpm shield gas flow rate with 4.2% TMS carrier gas........................................................................................................... 77
F-13 Raw SMPS particle size distribution data for 20 Lpm shield gas flow rate. ........ 78
F-14 Raw SMPS particle size distribution data for 25 Lpm shield gas flow rate. ........ 80
F-15 Raw SMPS particle size distribution data for 30 Lpm shield gas flow rate. ........ 83
G-1 Impactor data used for cut size calculations. ...................................................... 87
G-2 Particle size data measured using cascade impactor. ........................................ 88

9
LIST OF FIGURES
Figure page 1-1 Welding torches. ................................................................................................. 23
1-2 Formation of welding particles with and without TMS addition. .......................... 23
2-1 GTAW fume generation and sampling system. .................................................. 31
2-2 GTAW torch modified to allow TEOS addition. ................................................... 32
2-3 GMAW fume generation and sampling system................................................... 33
3-1 GTAW Cr6+ and nitrate data before and after TEOS addition. ............................ 37
3-2 TEM images of GTAW fume particles. ............................................................... 38
4-1 Average Cr6+ mass as a function of TMS carrier gas flow rate at 30 Lpm total shield gas flow rate. ............................................................................................ 47
4-2 GMAW fume particle size distributions at 30 Lpm shield gas flow rate. .............. 48
4-3 GMAW fume particle size distribution under 4.2% TMS flow rate measured with cascade impactor. ....................................................................................... 49
4-4 GMAW fume agglomerate without SiO2 coating. ................................................ 50
4-5 GMAW fume agglomerate with SiO2 coating indicated by arrows. ..................... 51
4-6 GMAW primary particles coated with SiO2. ........................................................ 52
4-7 Amorphous SiO2 agglomerate fume particle. ...................................................... 53
4-8 Intercoagulation between metal particles and SiO2 agglomerate. ...................... 54
4-9 Average Cr6+ mass in GMAW fumes using globular metal transfer mode. ......... 55
4-10 Average Cr6+ mass as a function of TMS carrier gas flow rate at 25 Lpm total shield gas flow rate. ............................................................................................ 56
4-11 GMAW fume particle size distributions at 25 Lpm shield gas flow rate. .............. 57
4-12 Average Cr6+ mass as a function of TMS carrier gas flow rate at 20 Lpm total shield gas flow rate. ............................................................................................ 58
4-13 GMAW fume particle size distributions at 20 Lpm shield gas flow rate. .............. 59
4-14 Particle size trends at different shield gas and TMS carrier gas flow rates. ........ 60

10
LIST OF ABBREVIATIONS
AWS American Welding Society
cfm Cubic feet per minute
Cr6+ Hexavalent chromium
EDS Energy dispersive x-ray spectroscopy
GMAW Gas metal arc welding
GTAW Gas tungsten arc welding
IC Ion chromatography
ICP-AES Inductively-coupled plasma – atomic emission spectrometry
Lpm Liters per minute
mmHg Millimeter mercury
mM Millimolar
MMD Mass median diameter
NIOSH National Institute for Occupational Safety and Health
nm Nanometer
OSHA Occupational Safety and Health Administration
ppm Parts per million
SMPS Scanning mobility particle sizer
TEM Transmission electron microscopy
TEOS Tetraethyloxysilane (CAS # 78-10-4)
TMS Tetramethylsilane (CAS # 75-76-3)
μg Microgram
μg/m3 Microgram per cubic meter of air
μm Micrometer
UV Ultraviolet

11
Abstract of Thesis Presented to the Graduate School of the University of Florida in Partial Fulfillment of the
Requirements for the Degree of Master of Engineering
CONTROL OF HEXAVALENT CHROMIUM EMISSION FROM WELDING USING SILICA PRECURSORS AS SHIELD GAS ADDITIVES
By
Nathan E. Topham
August 2010
Chair: Chang-Yu Wu Major: Environmental Engineering Sciences
Hexavalent chromium (Cr6+) emitted from arc welding poses serious health risks to
workers exposed to welding fumes in occupational settings. Stainless steel gas
tungsten arc welding (GTAW) and gas metal arc welding (GMAW) produce aerosols
that contain Cr6+, nickel, manganese, and gaseous pollutants such as ozone and
nitrogen oxides (NOx) that lead to a number of respiratory and neurological ailments as
well as cancer. Traditional welding technologies employ shield gas or material
incorporated into the welding wire to minimize fume formation. However, significant
amounts of hazardous air pollutants (HAPs) are generated during gas shielded welding
processes.
In this study, tetraethyloxysilane (TEOS) and tetramethylsilane (TMS) were added
to GTAW and GMAW shield gas to provide a two-fold approach at controlling HAPs
produced during stainless steel welding. Silica precursors acted as reducing agents
when they decomposed in the high temperature welding arc, thereby limiting ozone and
Cr6+ formation. Additionally, an amorphous film of silica (SiO2) was deposited on
welding fume particles. This film insulated the aerosols, preventing subsequent

12
oxidation of surface chromium and masking the toxic effects of all of the metals
contained in the particles.
Cr6+ in GTAW fumes was reduced by 45% when 26.3% of the shield gas was used
as TEOS carrier gas. A 53% reduction in NOx emissions was observed, indicating a
reduction in reactive oxygen species. Tranmission electron microscope (TEM) imagery
showed a film of SiO2 on welding fume particles. The SiO2 film could insulate GTAW
aerosols, masking the toxic effects of all metals within the fume particles.
Experimental results demonstrated that total shield gas flow rate impacted the
effectiveness of TMS as a GMAW shield gas additive. Low shield gas flow rates led to
premature thermal decomposition of TMS and no observable change in Cr6+ mass in
fumes. Increasing shield gas flow rate led to significant reductions in Cr6+ mass when
TMS was used. When 4.2% of the 30 liter per minute (Lpm) shield gas flow rate was
used as TMS carrier gas, Cr6+ mass in GMAW fumes was reduced by at least 92.9%.
Adding TMS to GMAW shield gas increased fume particle size beyond the
nanometer range in all shield gas flow rates tested. Geometric mean particle size
increased from 40-60 nanometers (nm) under baseline conditions to 180-300 nm when
TMS was added. SiO2 particles formed from decomposition of silica precursors
scavenged nanoparticles through intercoagulation. TEM imagery provided visual
evidence of an amorphous film of SiO2 on some fume particles along with the presence
of large amorphous SiO2 agglomerates. These results showed that vapor phase
sorbents may be capable of reducing the health risks posed by welding fumes through
elimination of nanoparticles and reduction of Cr6+.

13
CHAPTER 1 INTRODUCTION
Fundamentals of Arc Welding
Gas metal arc welding (GMAW) and gas tungsten arc welding (GTAW) are
commonly used welding processes that use mild or stainless steel wire as filler material
to join pieces of metal. Shield gas is used to protect the superheated weld site from
gaseous species in air that degrade the mechanical properties of the weld and
destabilize the welding arc. The operator controls welding parameters such as voltage,
shield gas composition, shield gas flow rate, and wire feed speed to obtain desired weld
characteristics. As shown in Figure 1-1, the GTAW electrode is non-consumable
tungsten and a separate rod is used for filler material while in GMAW the consumable
steel wire acts as the electrode and filler material.
Operating parameters influence the properties of the welding arc and welded
material. Voltage and metal transfer mode are related, with low voltage conditions
creating short circuit and high voltage creating globular and spray transfer (Soderstrom
and Mendez 2008). During globular metal transfer mode, droplet detachment from the
electrode is chaotic and large amounts of spatter and fumes can result from operating
under this metal transfer mode (Simpson 2009; Pires et al. 2007). Choice of shield gas
can also impact the characteristics of the weld. The addition of carbon dioxide (CO2) to
GMAW shield gas requires higher voltage to maintain arc stability and weld penetration
due to loss of arc heat by conduction by CO2 (Pires et al. 2007). The operating
parameters impact fume formation as well as weld characteristics which creates a
challenge for industry to balance maximum product quality with minimum emissions.
14
Physical and Chemical Properties of Welding Fumes
The intense energy of the welding process results in the formation of fumes
containing a high number concentration of nanosized and sub-micron particles
containing toxic metals as well as a number of gaseous species including ozone and
nitrogen oxides (Jenkins et al. 2005; Hewett 1995a; Liu et al. 2007). Fume aerosols
generated during arc welding processes are typically less than 1 micrometer (μm) in
diameter and the primary particles are often in the nanometer range (Jenkins et al.
2005; Biswas and Wu 2005; Zimmer et al. 2002; Stephenson et al. 2003). The fume
characteristics are influenced by a variety of parameters, including shield gas
composition, welding wire composition, voltage, and metal transfer mode (Zimmer et al.
2002; Hovde and Raynor 2007). Increasing the shield gas flow rate yields higher
hexavalent chromium (Cr6+) formation while increasing the amount of CO2 in shield gas
reduces Cr6+ formation (Dennis et al. 1997). Fume formation increases as welding
voltage is increased (Hovde and Raynor 2007). GMAW processes are more commonly
used and have much higher fume formation rates than GTAW (Serageldin and Reeves
2009). Thus, fume formation from GMAW has been studied much more thoroughly than
GTAW.
The chemical composition of welding aerosols depends on the composition of the
welding wire used as well as the operating parameters. Mild steel welding fumes
generally consist of iron and manganese oxides (Minni et al. 1984; Jenkins and Eagar
2005). Stainless steel welding fumes contain manganese and iron; however, they also
contain chromium and nickel oxides (Castner and Null 1998; Heung et al. 2007). About
1-5% of the chromium found in GMAW fumes is in the hazardous hexavalent state
(Heung et al. 2007; Serageldin and Reeves 2009). These metals are layered in a

15
core-shell structure. Fume particles typically contain a core made up primarily of iron
with other metals making up the outer layers along with surface enrichment by lighter
elements such as silicon, chlorine, and fluorine (Konarski et al. 2003a,b; Maynard et al.
2004).
Welding uses a shield gas to maintain arc stability, produce desirable weld
penetration, and reduce fume formation rate (Dennis et al. 1997; Ebrahimnia et al.
2009). The shield gas chosen has an impact on ultraviolet (UV) light, ozone generated,
particle size distribution of aerosols, and the amount of Cr6+ (Zimmer et al. 2002; Dennis
et al. 1997). The use of shield gas in GMAW decreases overall fume formation rate;
however, it may increase the formation rate of some of the toxic species in welding
fumes. Dennis et al. (1997) studied the effect of shield gas flow rate on formation rates
of Cr6+, UV light, ozone, and total fume. As the shield gas flow rate increased, the total
fume formation rate decreased. However, the formation rates of UV light, ozone, and
Cr6+ all increased with shield gas flow rate. The absence of shield gas leads to low UV
light production and rapid decomposition of ozone through reactions with nitrogen. As
ozone formation increases, the Cr6+ generation rate also increases as ozone is
considered the dominant oxidizer of chromium. The toxic species present in welding
fumes lead to many adverse health effects following occupational exposure.
Health Effects of Welding Fume Exposure
Professional welders are a group that has been the subject of many
epidemiological studies linking occupational exposures to aerosols with adverse health
effects including a wide variety of respiratory and cardiovascular ailments (Lillienberg et
al. 2008; Loukzadeh et al. 2009; Fang et al. 2009; Antonini 2003). A number of the
metallic species present in welding fumes are potentially detrimental to worker health

16
and ambient air quality. Hexavalent chromium causes decreased lung function,
asthma, and a number of other respiratory ailments (Bagchi et al. 2002; Pascal and
Tessier 2004). Cr6+ is also a known human carcinogen, with extensive human and
animal data available (Holmes et al. 2008; IARC 1990; Seel et al. 2007). Studies of
welding emissions in California found that welding is the primary source of airborne Cr6+
in the state (Chang et al. 2004). Nickel is also a known human carcinogen (IARC 1990),
which is linked with oxidative stress after inhalation (Luo et al. 2009).
Manganese (Mn) exposure can cause a number of adverse neurological effects,
including a Parkinson’s-like disorder known as manganism (Smargiassi et al. 2000;
Yuan et al. 2006; Antonini et al. 2006; Bowler et al. 2006; Halatek et al. 2005; Bowler et
al. 2007; Flynn and Susi 2009). Although this disorder creates symptoms similar to
Parkinson’s disease, it is a distinct disease and exposure to welding fumes is not linked
with increased incidence of Parkinson’s disease (Park et al. 2006a; Stampfer 2009).
The prevalence of neurological effects among workers exposed to welding fume
manganese is as high as one in three (Park et al. 2006b). The high risk of developing
serious neurological impairment from exposure to manganese in welding fumes will
likely lead to tightening regulations for this metal. Elimination of metals in welding fumes
from the body is a slow process. The half lives of chromium and nickel in urine are 730
days and 610 days, respectively (Schaller et al. 2007). The health effects from welding
aerosols are compounded by the fact that exposure to multiple potentially toxic
constituents usually occurs at the same time.
The particulate metal species are not the only harmful constituents of welding
fumes. Ozone is present in welding fumes and enhances the toxic effects of the metals
17
in welding fumes by inhibiting defense mechanisms in the human respiratory system
(Cohen et al. 2003). Ozone is produced within a few seconds when welding starts and
persists up to 10 minutes after welding is stopped (Liu et al. 2007). This complicates the
use of local ventilation because pumps are often turned off after welding stops since
particles are only generated during welding while ozone persists beyond the cessation
of welding.
The size and shape of welding aerosols also play a key role in toxicity. A large
percentage of inhaled welding fume particles can deposit in the lungs, typically in the
alveoli (Hewett 1995b). Few welding fume particles deposit in the upper respiratory
system, while deposition in the lower regions of the respiratory system occurs more
readily (Yu et al. 2000; Kleinstreuer et al. 2008). Toxicity of nanoparticles is unique
because the solid particles can be translocated across pathways other than the
respiratory system that are typically not considered for larger particles (Biswas and Wu
2005). For example, manganese nanoparticles can be translocated through the
olfactory nerve directly to the brain where manganese expresses neurotoxic effects
(Elder et al. 2006). Once inhaled, the behavior of the species present in welding fume
particles in biological systems becomes important.
Solubility is an important factor in determining toxicity. Welding fumes have been
divided into soluble and insoluble fractions, and the toxic effects of each fraction have
been examined separately. The soluble fraction of welding fumes is responsible for
toxicity due to oxidative stress and free radical production (McNeilly et al. 2004; Taylor
et al. 2003). It also causes more loss of lung macrophage viability than the insoluble
components (Antonini et al. 1999). The insoluble fraction of welding particles is also

18
responsible for pulmonary damage. Welding particles differ from other metal aerosols in
that the insoluble and soluble fractions of the fumes are both significant contributors to
toxicity (Antonini et al. 2004). The serious adverse health effects of welding fumes have
led regulatory agencies to develop a number of sampling and analytical techniques to
measure the toxic constituents of welding fumes in occupational settings.
Welding Fume Sampling and Analysis
The process of sampling and analyzing welding fumes is complicated with many
variables that must be controlled. The American Welding Society (AWS) has developed
a method of generating and collecting welding fumes (AWS 1999). This technique uses
a welding torch fixed inside a chamber in which fumes are generated, and welding
fumes are collected on a glass fiber filter. The collection efficiency of the glass fiber
filters used in this method has been tested and verified (Quimby and Ulrich 1999). The
AWS hood allows for a number of operating parameters to be fixed, making it ideal for
generating welding fumes while only varying certain operating parameters.
Personal samplers are a common method for collecting welding fumes in actual
occupational settings. These methods typically involve a filter placed near the breathing
zone that is connected to a personal pump. Recent research has shifted to placing
personal samplers inside welding masks to gather samples that accurately represent
particles present in the welder’s breathing zone (Lidén and Surakka 2009). While there
are a number of National Institute for Occupational Safety and Health (NIOSH) and
Occupational Safety and Health Administration (OSHA) methods for personal sampling
of Cr6+, there is no significant difference between the results obtained by these methods
(Boiano et al. 2000).

19
Analytical techniques used to measure components of welding fumes focus on
measuring Cr6+. NIOSH has developed multiple methods for analyzing Cr6+ in
occupational air that rely on ion chromatography (IC). NIOSH Method 7604 (NIOSH
1994) uses ion chromatography with conductivity detection while Method 7605 (NIOSH
2003) uses ion chromatography with UV detection. Method 7605 is an improvement
over Method 7604 in that the detection limit is reduced from 3.5 micrograms (μg) per
sample using 7604 to 0.02 μg per sample using 7605. However, metals such as iron
and nickel that are present in welding fumes can potentially interfere with Method 7605
and lead to overestimation of Cr6+ concentration (NIOSH 2003). OSHA Method ID-215
attempts to address the possible interferences by precipitating interfering metals out of
the extraction solution while employing the same analytical technique as NIOSH Method
7605 (Ku and Eide 1998). The sampling and analysis methods for Cr6+ in welding fumes
are necessary to protect workers because of significant adverse health effects that can
result from exposure.
Past Attempts to Control Welding Fume Exposure
OSHA recently reduced the permissible exposure limit for Cr6+ in occupational air
from 52 micrograms per cubic meter of air (μg/m3) to 5 μg/m3 (OSHA 2006). This
change placed pressure on industry to develop new control technologies to limit
emissions of Cr6+ from arc welding. The simplest method of controlling welding fume
exposure is removing the fumes from the breathing zone of the welder. Studies have
shown that using large vacuum pumps can reduce exposure to metals in welding fumes
by about half if the hose for the pump is placed 2-3 inches from the welding torch
(Meeker et al. 2007). This technology can be invasive and inconvenient for workers and
only removes some fume particles (Flynn and Susi 2009).

20
Previous research has demonstrated that the use of reducing agents as shield
gas additives can reduce ozone formation in the welding fume (Dennis et al. 2002).
Similarly, the addition of reactive metals, such as zinc and aluminum, to welding wires
can reduce Cr6+ formation (Dennis et al. 1996). However, the use of reactive metals was
not effective for controlling Cr6+ formation in some operating conditions. Reactive metal
additives caused an increase in Cr6+ formation in some high voltage operating
conditions. These technologies have not controlled formation of Cr6+ effectively enough
to gain acceptance in industry. Furthermore, nickel and manganese are present in
different oxidation states that have varying solubility and toxicity (Minni et al. 1984;
Jenkins and Eagar 2005). Therefore, traditional shield gas additives that act solely as
reducing agents may not be as effective at limiting the toxicity of these metals in welding
fumes. Mruczek et al. (2008) attempted to reduce manganese exposure by developing
welding wire with reduced Mn content. This study found that Mn content in welding
fumes could be reduced with this process modification; however, the change in
composition of the wire resulted in unacceptable degradation of weld properties. This
study demonstrates the difficulty in controlling hazardous components in welding fumes;
they cannot simply be removed without degrading the needed mechanical properties of
the weld. Therefore, it is necessary to develop a control technology that will limit
exposure to these pollutants while maintaining the integrity of the welded metal.
Sorbents in Combustion Systems
Sorbent injection into combustion systems has been examined as a means for
removing trace metals. Sorbents are capable of scavenging a variety of vapor phase
metals in combustion systems to prevent nucleation of metallic aerosols (Biswas and
Wu 1998). Thermodynamic analyses have been carried out that have shown sorbents

21
to be an effective means for removing vanadium, molybdenum, and arsenic metal
vapors in combustion environments (Lee and Wu 2002; Cho and Wu 2004; Wu and
Barton 2001; Iida et al. 2003). Injection of bulk solid phase sorbents is not feasible for
welding systems. Fortunately, vapor phase sorbents have recently emerged as an
alternative to solid phase materials. Numerous studies have tested the use of vapor
phase silica precursors for control of metal emissions in generic combustion systems.
During combustion, the precursor molecule is broken apart at high temperature. This
process leads to the formation of silica (SiO2) along with carbon dioxide and water.
Silica, formed from pyrolysis and subsequent oxidation of precursor chemicals,
has been proven effective as a sorbent for lead produced during combustion (Biswas
and Zachariah 1997; Owens and Biswas 1996a,b). Silica is capable of forming an
amorphous web that effectively captures ultrafine metal aerosols and increases their
particle size (Biswas and Zachariah 1997; Owens and Biswas 1996a,b; Lee et al. 2005).
The increase in aggregate particle size is beneficial for improved performance of
filtration systems. The silica formed from the injection of silica precursors into
combustion systems is amorphous phase silica rather than crystalline silica (Owens and
Biswas 1996; Jang et al. 2006). Amorphous silica does not cause the toxic effects
observed from inhalation of crystalline silica (Reuzel et al. 1991).
In regards to welding fume control, this technology is superior to traditional shield
gas additives because the silica coating formed around the metallic aerosols insulates
all of the metals in the aerosols, as seen in Figure 1-2, rather than simply manipulating
oxidation state of chromium while failing to address the toxicity of manganese and
nickel. During welding, oxygen that is able to penetrate the shield gas is consumed

22
during the pyrolysis process, thereby reducing the concentration of reactive oxygen
species (O, O3) that would otherwise lead to the formation of Cr6+. The reactions in
Equations 1-1 and 1-2 are simplified versions of the stoichiometric pyrolysis processes
that lead to the formation of SiO2 using two common silica precursors,
tetraethyloxysilane (TEOS) and tetramethylsilane (TMS), respectively. In reality, there
are many possible intermediate reactions leading to the end products (Phadungsukanan
et al. 2009; Herzler et al. 1997).
Si(OC2H5)4 + Oxidant SiO2 + 8CO2 + 10H2O (1-1)
Si(CH3)4 + Oxidant SiO2 + 4CO2 + 6H2O (1-2)
Objective of Study
The overall goal of this study was to investigate the use of silica precursors as
shield gas additives to limit exposure to hazardous metals in fumes from GTAW and
GMAW. The study was conducted in two phases. In phase I, TEOS was tested as an
additive to GTAW shield gas to lower Cr6+ concentration in fumes. Cr6+, nitrate and total
Cr formation in fumes were measured and the ratio of Cr6+/Cr was compared for
baseline welding and welding with TEOS. In phase II, TMS was tested as an additive to
GMAW shield gas because this welding process is more commonly used and
responsible for far more emissions than GTAW. The total shield gas flow rate was
varied to investigate its effect on the efficacy of Cr6+ control. The flow rate of TMS
carrier gas used also was varied in each of the total shield gas flow rates tested to
determine the optimal feed rate. Welding voltage was altered to study whether the
precursors were effective under different operating conditions. Success in this phase of
the experiment was defined as a 90% reduction in the formation of Cr6+ in welding fume
particles.

23
Figure 1-1. Welding torches. A) GTAW torch and welding rod. B) GMAW torch.
Figure 1-2. Formation of welding particles with and without TMS addition.

24
CHAPTER 2 EXPERIMENTAL METHODS
Overview of Experimental Methods
Two types of welding were used in this study. The first method discussed in this
chapter is gas tungsten arc welding (GTAW). The methodology used for gas metal arc
welding (GMAW) is presented afterwards.
GTAW fumes were generated by a welder operated by a user with welding
experience who used a specific mass of welding rod in each sample. The user
maintained similar speeds when consuming welding rod between samples. However,
there was some variation between welding times in different samples. During GTAW
sampling, the welding was performed outdoors with a hood placed directly above the
welding. Ion chromatography and atomic emission spectrometry (ICP-AES) were used
for characterizing how precursors impacted the amount of Cr6+ emitted from GTAW.
Tetraethyloxysilane (TEOS, Acros Organics, 98%, CAS # 78-10-4) was tested during
this phase of the experiment.
GMAW fumes were generated automatically by a torch placed inside a chamber.
In GMAW samples, welding time was held constant as well as the wire feed rate to
consume the same mass of wire between samples. During GMAW sampling, the
welding was performed indoors inside a closed chamber. The closed chamber used in
the GMAW experiments allowed for Cr6+ mass to be compared directly between
samples via ion chromatography, eliminating the need for measurement of total
chromium. Tetramethylsilane (TMS, Acros Organics, 99.9%, CAS # 75-76-3) was tested
during this phase of the experiment.

25
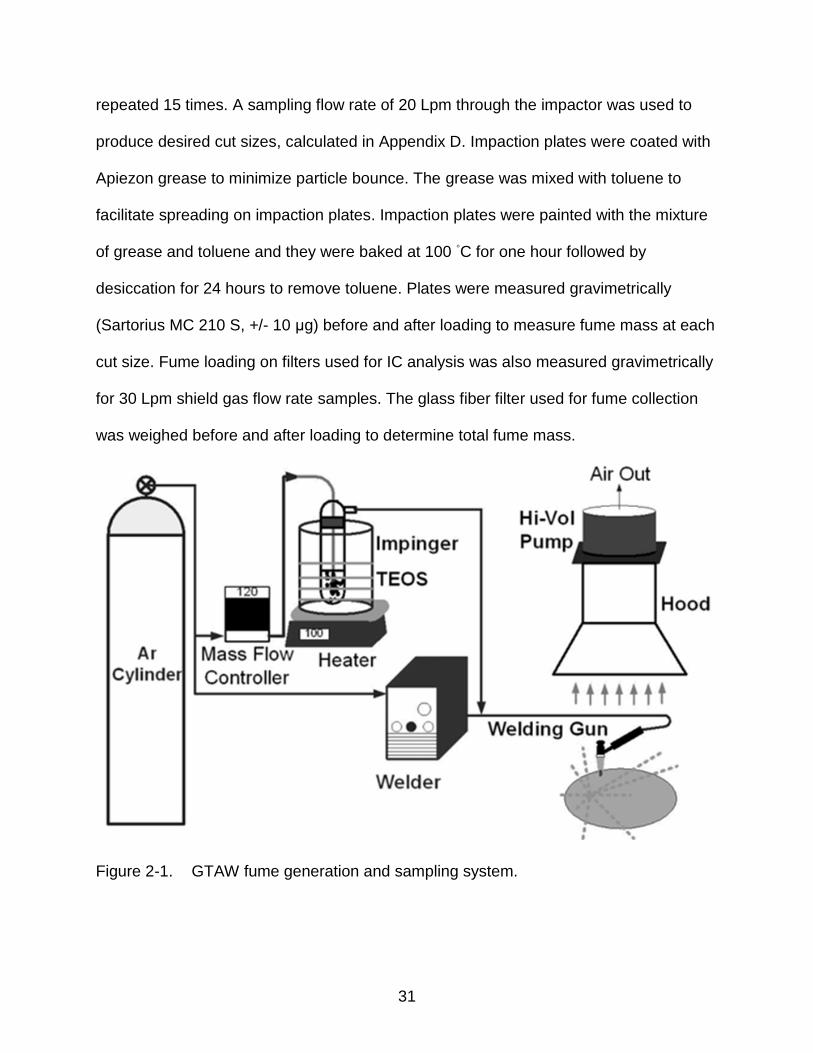
GTAW Fume Generation and Sampling
Figure 2-1 shows the schematic of the welding and sampling system. A Miller
Maxstar 150 STL gas tungsten arc welder was used for producing the welding aerosols.
ER 308L stainless steel welding rods were used, which have an average chromium
content of 19.5%-22.0%. This rod also contained 9.0-11.0% nickel, 1.0-2.5%
manganese, as well as 0.35-0.65% silica added to stabilize the iron in the weld. The
remainder of the welding rod was iron. Forty-five grams of welding rod were consumed
per sample. Mild steel base metal was used for sampling in order to avoid interference
from chromium emitted from the base sheet metal.
The welding hoses were modified to allow injection of TEOS, shown in Figure 2-2.
A Y-fitting was added to the welding torch where the hose joined the welding gun. Wires
were connected to the end of the welder gas hose and the base of the welding torch to
maintain the electric current after the Y-fitting was added. The gas hose leaving the
shield gas cylinder was connected to a Y-fitting to split the gas flow into two parts. The
main gas flow was passed through the welder as in normal operation while the
remainder of the shield gas was passed over a reservoir of liquid TEOS.
The TEOS feed rate was controlled by varying the flow rate of carrier gas that was
passed over the liquid TEOS reservoir, maintained at 100 degrees Celsius (◦C), with a
mass flow controller. The recommended minimum gas flow rate designated for this
model of welder is 7.1 liters per minute (Lpm), which was adopted in this study. A 6”x12”
rectangular hood was placed approximately 18” directly above the mild steel base metal
on which the welding occurred. A 90 millimeter (mm) diameter glass fiber filter (Millipore
APFA 090) was placed at the top of the hood and connected to a high volume (Hi-Vol,
44 cfm) pump for collecting the aerosols.

26
Ultra high purity argon (Airgas, 99.999%) was used as the welding shield gas. This
is the shield gas most commonly used in GTAW to maintain arc stability during welding
operations. It acted as the needed carrier gas without requiring a secondary carrier gas.
The vapor pressure of TEOS at room temperature is only 2 millimeters mercury
(mmHg), which was too low to meet the theoretical amount of Si needed to produce a
mono-atomic layer on the welding aerosols, determined in Appendix A. A water bath
(100 ◦C) was used to heat the reservoir and raise the vapor pressure of the liquid TEOS
to 86 mmHg (Stull 1947) in order to generate sufficient vapor with a reasonable shield
gas flow rate passing over the liquid.
GTAW Experimental Conditions
Baseline samples using only argon as a shield gas were run to determine
emissions of Cr6+ relative to total chromium fume formation during normal welding
operation. This scenario represented the standard welding method currently used in
industrial environments. The baseline samples ensured that the sampling time was long
enough to provide concentrations needed for the analytical methods. For the
experimental set, the TEOS carrier gas feed rate was set at 26.3% of the total 7.1 Lpm
shield gas flow rate, resulting in a TEOS molar flow rate of 6.96Χ10-3 gram-mol per
minute (gmol/min). Three TEOS samples and six baseline samples were collected.
GTAW Sample Analysis
Inductively coupled plasma with atomic emission spectroscopy (ICP-AES, Perkin
Elmer Plasma 3200) was used to measure total chromium. This analytical method does
not differentiate between trivalent and hexavalent chromium. Therefore, IC (Dionex ICS
1500, IonPac AS9-HC analytical column, DS6 conductivity detector) was used to
measure the soluble hexavalent chromium species, chromate (CrO42-). IC was also

27
used concurrently for nitrate analysis. Using these methods in conjunction provided the
needed data to determine the reduction of Cr6+ species using the TEOS additive.
Prior to analysis, samples were extracted from filter media using techniques
specific to the analytical method used. Sample extraction for IC followed a modified
NIOSH Method 7604 (NIOSH 1994). Soluble Cr6+ species were extracted using a
9 millimolar (mM) sodium carbonate solution and were placed in a water bath at 100 ◦C
for 1 hour. For ICP-AES analysis, acid digestion was used, based on previously verified
techniques (Karanasiou et al. 2005). Aerosols and silica coatings, along with the filter
media, were dissolved using 9 milliliters (mL) of 65% nitric acid and 1 mL of 48%
hydrofluoric acid. The acidic extraction was placed in a heat block for five hours at
150 ◦C. Afterwards, 1 mL of 10% boric acid was added to neutralize the free fluorine in
the solution.
Additionally, transmission electron microscopy (TEM, Model 2010F, JEOL) was
used to provide images that depicted the SiO2 coating formed on fume particles.
Specialty grids designed for TEM (Pelco, Lacey Carbon Type-A, 300 mesh) were held
directly in the fumes to collect particles for the TEM analysis.
GMAW Fume Generation and Sampling
Figure 2-3 shows the schematic setup of the welding fume generation and
sampling system used during baseline and TMS welding. This system followed a
modified AWS fume hood design (AWS 1999). A conical chamber 36” in diameter at the
base, 8” in diameter at the pump, and 36” in height was constructed. A Lincoln
PowerMIG 140C welder was used for producing welding fumes. ER 308L stainless steel
welding wire was used, which has an average chromium content of 19.5%-22.0%. This
wire also contains 9.0-11.0% Ni, 1.0-2.5% Mn, and 0.35-0.65% Si. Mild steel base metal

28
was used for sampling in order to avoid interference from chromium emitted by the base
sheet metal. The welding torch hose was modified to allow injection of TMS. A Y-fitting
was inserted to connect the torch and the gas hose. A longer wire guide was installed to
ensure it was long enough to reach the contact tip. The trigger was removed and the
wires inside the trigger were extended outside the chamber to allow remote operation of
the welding gun. The hose from the shield gas cylinder was connected to a T-fitting to
allow the gas flow to be separated into two parts. The main shield gas flow was passed
through the welder as in normal operation while the remainder of the gas was used as
TMS carrier gas. The recommended minimum shield gas flow rate designated for this
model of welder is 15 Lpm. An initial shield gas flow rate of 30 Lpm was chosen to
produce quality welds after preliminary testing. The silica precursor feed rate was
controlled by varying the flow rate of carrier gas that was passed over the liquid TMS
reservoir, maintained at 0 ◦C, with a mass flow controller. The carrier gas saturated with
TMS vapor was then rejoined to the main shield gas flow prior to reaching the welding
torch. The base metal was placed on a rotating turntable (MK Products Aircrafter T-25)
to maintain a constant weld speed. The turntable was placed in a hood in which the
fumes were generated and collected. A 90 mm diameter glass fiber filter (Millipore
APFA 090) was placed at the top of the hood and connected to a high volume (Hi-Vol,
45 cubic feet per minute (cfm)) pump for collecting the aerosols.
A mixture of 75% argon and 25% CO2 was used as the welding shield gas. The
shield gas acted as the needed carrier gas for TMS without requiring a secondary
carrier gas. TMS is a highly volatile compound with a vapor pressure at room
temperature of 598 mmHg (Aston et al. 1941). Appendix B contains information used to

29
calculate vapor pressure. The TMS reservoir was placed in an ice bath to lower the
vapor pressure to about 270 mmHg. This was done to slow down evaporation of the
TMS while still producing enough TMS vapor to exceed the minimum theoretical TMS
concentration needed to coat the aerosols in a mono-atomic layer of SiO2. See
Appendix A for minimum TMS concentration calculation and Appendix C for calculations
and rationale behind the actual operating TMS concentration produced in the carrier
gas.
GMAW Experimental Conditions
The experimental conditions in this study are summarized in Table 2-1. Baseline
samples using 75% Ar/25% CO2 as a shield gas were run to determine emissions of
Cr6+ during normal welding operation using short-circuit metal transfer. This scenario
represented the standard welding method currently used in industrial environments. The
baseline samples ensured that the sampling time was long enough to produce enough
Cr6+ to demonstrate 90% reduction without being limited by the detection limits of the
analytical methods.
Experimental set A was performed to determine the effect of TMS carrier gas flow
rate on Cr6+ formation. In experimental set B, high voltage was tested to account for
different emission rates of pollutants under globular metal transfer mode. In
experimental sets C and D, total shield gas flow rate was decreased to 25 and 20 Lpm,
respectively, to test the effect of shield gas flow rate on the efficacy of this technology.
The molar flow rates of TMS that correspond to the TMS carrier gas flow rates used in
experimental sets A, B, C, and D were calculated by multiplying the flow rate of carrier

30
gas by the concentration of TMS in saturated carrier gas, found in Appendix C. The
values for molar flow rates tested during GMAW sampling are presented in Table 2-2.
GMAW Sample Analysis
IC (Dionex ICS 1500, CS5A analytical column, DS6 conductivity detector) was
used to measure the soluble hexavalent chromium species, chromate (CrO42-). Prior to
analysis, samples were extracted from filter media using techniques specific to the
analytical method used. Sample extraction for IC followed a modified NIOSH Method
7604 (NIOSH 1994). Soluble Cr6+ species were extracted using a 5 mM sodium
carbonate/1 mM sodium bicarbonate solution and heated in a water bath to 100 ◦C for
one hour. Additionally, TEM and energy-dispersive x-ray spectroscopy (EDS) (Model
2010F, JEOL) were used to provide images that depicted the SiO2 coating formed on
fume particles along with elemental analysis of those particles. Specialty grids designed
for TEM (Pelco, Lacey Carbon Type-A, 300 mesh) were loaded with fume particles for
analysis.
A scanning mobility particle sizer (SMPS, TSI Model 3081 Long DMA) was used to
obtain aerosol size distribution data between 10 nanometers (nm) and 515 nm. Welding
was performed for 10 seconds at which point the SMPS pump was turned on. After the
SMPS completed its 135 second sampling run, the hi-vol pump was turned on to clear
the chamber of particles.
A cascade impactor (U of W Mark III Source Test Cascade Impactor) was used to
obtain particle size distribution data between 0.1 μm and 10 μm for 30 Lpm shield gas
flow rate with 4.2% TMS. Welding was performed in 10 second increments. After each
10 second increment, the cascade impactor pump was turned on for 135 seconds after
which the hi-vol pump was used to clear the chamber of particles. This process was
31
repeated 15 times. A sampling flow rate of 20 Lpm through the impactor was used to
produce desired cut sizes, calculated in Appendix D. Impaction plates were coated with
Apiezon grease to minimize particle bounce. The grease was mixed with toluene to
facilitate spreading on impaction plates. Impaction plates were painted with the mixture
of grease and toluene and they were baked at 100 ◦C for one hour followed by
desiccation for 24 hours to remove toluene. Plates were measured gravimetrically
(Sartorius MC 210 S, +/- 10 μg) before and after loading to measure fume mass at each
cut size. Fume loading on filters used for IC analysis was also measured gravimetrically
for 30 Lpm shield gas flow rate samples. The glass fiber filter used for fume collection
was weighed before and after loading to determine total fume mass.
Figure 2-1. GTAW fume generation and sampling system.

32
Figure 2-2. GTAW torch modified to allow TEOS addition.
Wire
Y-fitting Gas Hose

33
Figure 2-3. GMAW fume generation and sampling system. A) Without TMS. B) With TMS.

34
Table 2-1. GMAW experimental conditions.
Experimental condition
Precursor carrier gas flow rate (% of total shield gas flow rate)
Total shield gas flow rate (Lpm)
Voltage Silica precursor
Baseline 0 20, 25, 30 Low None
A 1.4-4.2 30 Low TMS
B 0, 4.2 35 High TMS
C 5.0 25 Low TMS
D 2.1-6.3
20 Low TMS
Table 2-2. TMS molar flow rates used during GMAW sampling.
Experimental condition
Precursor carrier gas flow rate (% of total shield gas flow rate)
Total shield gas flow rate (Lpm)
TMS molar flow rate (mol/min)
A 1.4, 2.8, 3.5, 4.2 30 0.007, 0.013, 0.017, 0.020
B 4.2 30 0.020
C 5.0 25 0.020
D 2.1, 4.2, 6.3
20 0.007, 0.013, 0.020

35
CHAPTER 3 RESULTS AND DISCUSSION – GAS TUNGSTEN ARC WELDING (GTAW)
Results
Data pertinent to chromium, nitrogen oxides, and ozone formation are presented.
As shown in Figure 3-1, the average Cr6+/Cr ratio decreased by 45% from the average
baseline Cr6+/Cr ratio (from 0.170 to 0.094) when TEOS was added. Figure 3-1 also
shows the nitrate concentrations at baseline and TEOS sampling conditions. Nitrate is
the end product of oxidation of atmospheric nitrogen, which is oxidized by the same
reactive oxygen species as chromium. Therefore, it can be used as an indicator of the
formation of reactive oxygen species and oxidation potential within welding fumes
during the welding process (Dennis et al. 2002). Upon the addition of TEOS, nitrate
concentration decreased from an average baseline value of 83 parts per million (ppm)
to 39 ppm. This 53% decrease from baseline conditions is in line with the Cr6+
reduction. This result demonstrates an oxidation potential of chromium within the
welding fume. Previous studies used other reducing agents as shield gas additives. For
example, Dennis et al. (2002) used 3% ethene and 3% nitrogen oxide and obtained
42% and 45% reduction in Cr6+ formation, respectively, which was slightly lower than
what was achieved in this study.
There was large variation in the values shown in Figure 3-1. GTAW is a manual
process in which inconsistencies when operating the welder can impact emission rates.
This can contribute to errors in measuring welding fume emissions that are present
even in automatic systems (Serageldin and Reeves 2009).
Figure 3-2 shows TEM images of fume aerosols collected. The metal vapors
formed during welding quickly condense and form primary particles a few nanometers in

36
diameter. These nanometer primary particles at very high number concentration
undergo rapid coagulation to form aggregates (Fig. 3-2a). Fig. 3-2b shows an aggregate
particle with TEOS addition. In this image, the metallic aerosol is coated in a thin SiO2
film. Metal aerosols appear very dark on the images because the electrons passed
through the sample to generate the image are less able to penetrate dense material like
chromium. Silica is less dense than the metal aerosols and produces a lighter colored
film around the dark aerosols. Figure 3-2c is a closer look at higher magnification. A
primary particle with distinct layering of different metals coated with SiO2 is clearly seen.
These images visually demonstrate that primary and aggregate metal particles formed
during TIG welding were covered in a film of amorphous SiO2.
Discussion
These results support previous studies that showed vapor phase sorbent
precursors increase effective particle size, prevent formation of the ultrafine mode of the
aerosols, and aid in collection efficiency of traditional control technologies (Owens and
Biswas 1996; Biswas and Zachariah 1997). Therefore, the use of less obtrusive
respirators or dust masks may become a more appealing option for workers exposed to
welding fumes. The SiO2 coating prevents or slows down the dissolution of chromium
as nanometer SiO2 takes weeks or more to dissolve in lung fluids (Reuzel et al. 1991).
Since the soluble portions of welding fumes are the most toxic, decreased solubility
decreases the effective toxicity of the aerosols (Antonini et al. 1999). This silica layer
also makes silica precursor compounds more effective reducing agents than other
gaseous species previously studied because oxidation of the metals is prevented long
after formation of the aerosols due to the silica layer.

37
Cost Analysis
The increase in operating costs when using TEOS as a shield gas additive is
calculated in Appendix D. Using lab quality TEOS as an additive at the feed rate tested
in this study creates an additional cost of about $3.80 per hour of welding time. Based
on an estimate of consumption rate used in this study (3.6 grams of consumable used
per minute), the cost of TEOS addition would be roughly $17.60 per kg of welding rod
used. The cost can further be reduced using industrial quality chemical.
Figure 3-1. GTAW Cr6+ and nitrate data before and after TEOS addition.

38
Figure 3-2. TEM images of GTAW fume particles. A) Baseline agglomerate particle without SiO2 coating. B) Agglomerate particle with SiO2 coating when welding with TEOS. C) Primary particle with SiO2 coating when welding with TEOS.
39
CHAPTER 4 RESULTS AND DISCUSSION – GAS METAL ARC WELDING (GMAW)
TMS Cr6+ and Particle Size Distribution Results
30 Lpm Shield Gas Flow Rate
A total shield gas flow rate of 30 Lpm was tested to determine the effect of TMS
addition on Cr6+ formation in GMAW fumes. The results indicate adding TMS to shield
gas reduced formation of Cr6+, as seen in Figure 4-1. When 4.2% of the shield gas was
used as TMS carrier gas, the mass of Cr6+ was reduced to below the IC detection limit
of roughly 4.5 μg for all replicate samples. Since it was impossible to determine the
exact mass for samples that were below detection, the mass for all non-detectable
samples was set equal to the detection limit. This was a reduction in Cr6+ mass of at
least 92.9% compared to baseline conditions.
The reduction in Cr6+ mass achieved when using TMS as a shield gas additive
exceeded the results seen in previous studies that incorporated reducing agents into
shield gas or welding wire (Dennis et al. 1996; Dennis et al. 2002). The differences in
Cr6+ mass between TMS feed rates were statistically significant (p = 6.8 Χ 10-11, ANOVA
single factor, α = 0.05).
SMPS particle size data using a total shield gas flow rate of 30 Lpm demonstrated
that adding silica precursors to shield gas increased the particle size of fume particles,
as seen in Figure 4-2. When welding without TMS, the peak in the nanometer size
range at about 20 nm was very large relative to the peak seen at 200-300 nm. The
baseline mass median diameter (MMD) calculated from SMPS data was 380 nm which
agreed very well with previous research that studied this characteristic (Jenkins et al.
2005).

40
As increasing amounts of TMS were fed into the system, the metal nanoparticles
were scavenged by SiO2 agglomerates and the particle size distribution shifted towards
larger particle sizes. The count geometric mean diameter increased from 60 nm out of
the nanometer range to 180 nm as TMS feed rate was increased (Appendix F). The
increase in particle size observed when TMS was added agreed with previous studies
that utilized silica precursors to control lead emissions from combustion systems. In
those studies, adding silica precursors increased particle size out of the nanometer
range (Owens and Biswas 1996a; Owens and Biswas 1996b).
The mass size distribution of welding fume particles with 4.2% TMS additive
collected using a cascade impactor is displayed in Figure 4-3. There was evidence of
overloading on the lower stages of the impactor. This might lead to re-entrainment of
some fume particles that would otherwise not have made it to the final filter.
Nevertheless, the cascade impactor data show the right tail of the particle size
distribution that was too large to be measured using SMPS. The presence of particles
between 1-10 μm in diameter further indicated that SiO2 particles were assisting in
coagulation and increasing fume particle size because baseline welding fume particles
formed through nucleation and coagulation in this size range were absent in previous
research (Jenkins et al. 2005).
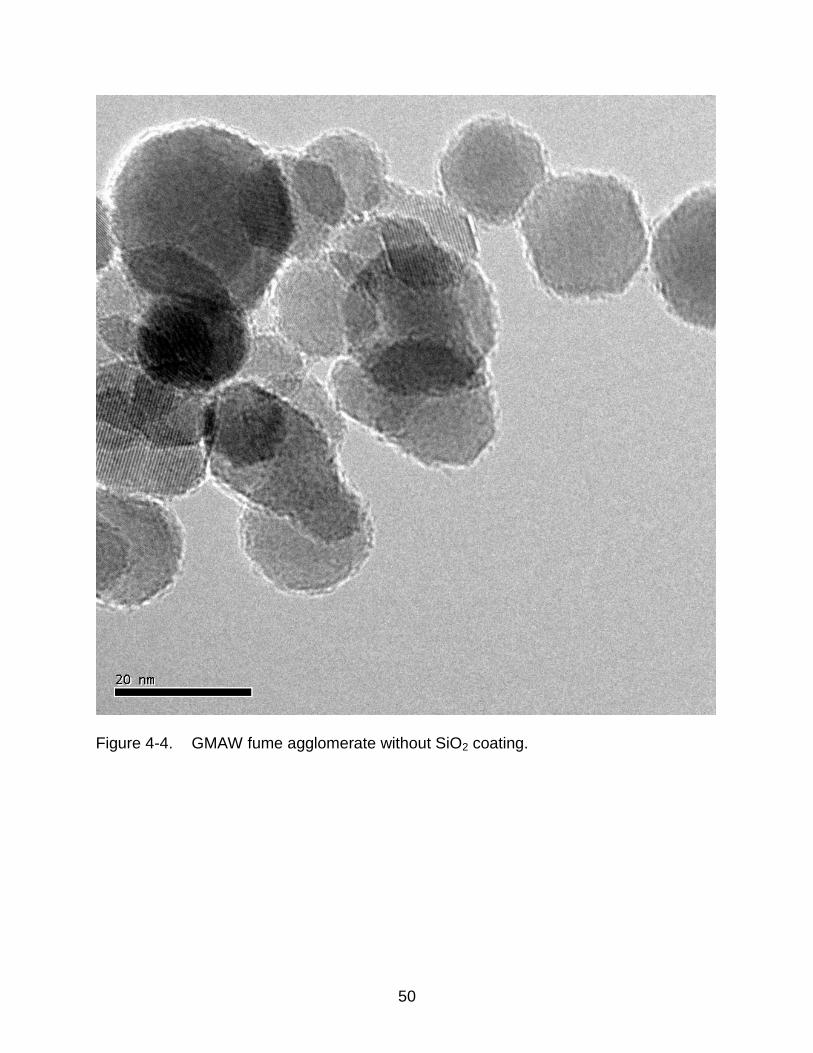
TEM images were obtained to determine whether a SiO2 coating was present on
fume particles when TMS was used as an additive. The images demonstrate that in
some cases a coating of SiO2 was formed but there were many particles without a
distinct coating, such as those seen in Figure 4-4. The image showed that some surface
enrichment with lighter elements did occur which mirrors results of previous studies of
41
welding fume particle structure that showed aerosol surface enrichment with silicon
chlorine and fluorine (Maynard et al. 2004). Figure 4-5 shows an agglomerate particle
that had a coating of SiO2 that encapsulated the entire agglomerate rather than surface
enrichment of individual primary particles. Figure 4-6 displays individual primary
particles with thick SiO2 coatings. This coating in Figures 4-5 and 4-6 was more
significant than the surface enrichment seen on individual primary particles under
baseline conditions in previous research (Maynard et al. 2004; Konarski et al. 2003).
Elemental analysis of the particles in Figure 4-6 was performed using EDS, shown in
Table 4-1. About 17.5% of the particle mass was silicon, which was much higher than
surface enrichment with silicon (about 5%) in baseline welding fumes measured in
previous research (Minni et al. 1984).
Figure 4-7 shows an amorphous agglomerate particle composed primarily of SiO2.
The TEM imageries obtained show that coating by SiO2 was not uniform for all fume
particles. Some particles were not coated, some primary particles were thickly coated
with SiO2, some agglomerate particles were covered in a thin layer of SiO2, and some
separate amorphous agglomerates composed mostly of SiO2 were all present. Figures
4-5 and 4-6 indicate that silica precursor additives may be capable of reducing toxicity
of all of the metals in welding fume particles through the formation of a SiO2 film on
metal particles. This phenomenon is similar to that observed in previous research where
metal nanoparticles formed in combustion systems can be trapped in a web of
amorphous SiO2 (Owens and Biswas 1996). Metal nanoparticles that are coated in SiO2
are less likely to exhibit toxic effects because the SiO2 coating could take weeks to
dissolve in the respiratory system (Roelofs and Vogelsberger 2004). This would provide

42
the respiratory system’s removal mechanisms more time to remove the particles before
exposure to the toxic metals occurs. In addition, there are agglomerates of metal fume
particles with SiO2 particles formed by intercoagulation, as shown in Figure 4-8.
Total fume mass was measured gravimetrically to evaluate the impact of TMS
addition on GMAW fume generation rate, shown in Table 4-2. Although OSHA does not
currently regulate total welding fume concentration, it is important to minimize total
particulate concentration in occupational environments. Meanwhile, NIOSH does have a
recommended exposure limit of the lowest feasible concentration of total welding fume.
A technology that leads to a drastic increase in fume mass would present problems
when trying to produce the lowest feasible concentration of fume particles during
GMAW.
30 Lpm Shield Gas Flow Rate Using High Voltage
Under high voltage, the welding process undergoes globular metal transfer mode.
This process creates violent explosions of metal droplets leaving the tip of the welding
wire. The baseline Cr6+ formation under these conditions was 17.4% higher than using
short circuit metal transfer mode. The addition of TMS did not have as dramatic an
effect on Cr6+ formation as under short circuit conditions, as seen in Figure 4-9. This
may be due to the violence associated with globular metal transfer. Some molten
spatter droplets are ejected far from the arc and may leave the area where TMS
scavenges reactive oxygen species and collected during sampling, leading to an
increase in measured Cr6+ mass from fume formation. Although 90% reduction in Cr6+
mass was not achieved during this type of welding, the 47% reduction was significant
(p-value <0.05) and could help reduce occupational exposure. Globular metal transfer is
not as widely used as short circuit and spray transfer modes due to the large amount of
43
spatter and fumes produced during this operating condition. Spatter creates additional
labor costs as the spatter particles that deposit on the base metal must be removed with
a grinder. Therefore, the success of TMS addition using short-circuit metal transfer was
more important for reducing Cr6+ emissions from welding sources than during globular
transfer.
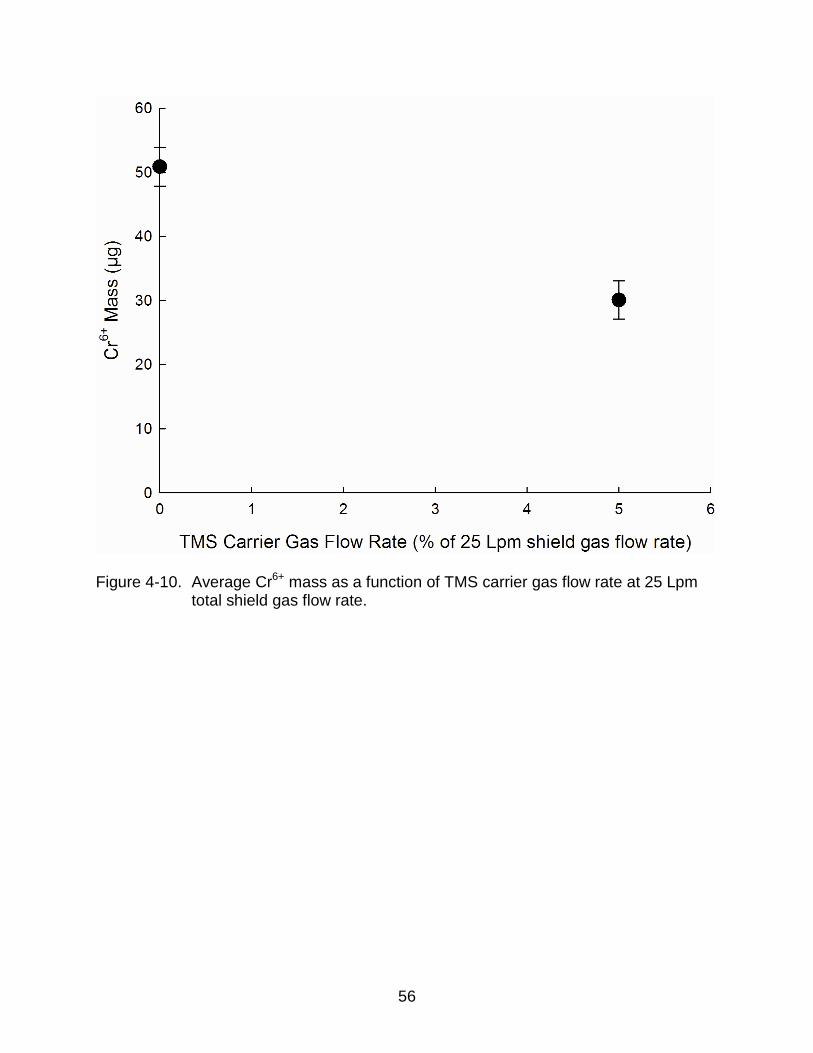
25 Lpm Shield Gas Flow Rate
Total shield gas flow rate was decreased to 25 Lpm to reduce the consumption
rate of shield gas and associated operating costs. There was a decrease in baseline
Cr6+ mass when the shield gas flow rate was decreased from 30 to 25 Lpm. Figure 4-10
shows that when 5.0% of the shield gas flow rate was used as TMS carrier gas, there
was a significant decrease in Cr6+ mass of about 40% with a p-value far below 0.05
(Student’s T-test, 2 tails, unequal variance). There was some white powder observed
inside the head of the welding torch after sampling. The reduction in Cr6+ indicated that
some of the TMS was surviving until reaching the area where reactive oxygen species
were present. However, the decreased efficiency of Cr6+ reduction coupled with the
white powder inside the head of the welding torch indicated that some TMS was likely
prematurely decomposing. The welding torch was heating during sampling and the TMS
residence time in the hot torch was long enough for it to thermally decompose prior to
entering the area where fume particle formation was occurring. Compared with 30 Lpm
shield gas flow rate data, this set of experiments shows that total shield gas flow rate
impacted effectiveness of TMS and the goal of 90% reduction in Cr6+ mass was not
reached under 25 Lpm shield gas flow rate.
The SMPS particle size data for 25 Lpm shield gas flow rate followed the same
pattern as that for 30 Lpm, as displayed in Figure 4-11. When welding without TMS, a

44
large peak was seen at about 20 nm and a much smaller peak was present at
200-300 nm. As the TMS feed rate was increased, the peak in the nanometer range
became smaller relative to the peak larger than 0.1 μm. The number concentration for
the nanometer range peak at 0.84% TMS carrier gas was higher than the number
concentration for this peak under baseline conditions. However, the height of this peak
relative to the peak at larger particle sizes still follows the same pattern as the 30 Lpm
shield gas flow rate data. As TMS feed rate was increased, the peak in the nanometer
size range shrank relative to the peak above 0.1 μm. The aberration in absolute number
concentrations was most likely due to variable fume emission rates encountered during
welding. The shape of particle size distributions followed the same pattern of change
despite the variation in number concentration.
20 Lpm Shield Gas Flow Rate
The impact of TMS addition on Cr6+ generation during GMAW using a total shield
gas flow rate of 20 Lpm is shown in Figure 4-12. A large amount of white powder was
observed inside the head of the welding torch after sampling. It likely resulted from
thermal decomposition of TMS inside the head of the welding torch. When this
happened, TMS did not function as a reducing agent or coat fume particles in a SiO2
film because the TMS had already reacted before reaching the area where fume particle
formation was occurring. There was no statistically significant difference between the
amount of Cr6+ mass in the fumes regardless of the amount of TMS that was added
(p = 0.229, ANOVA single factor, α = 0.05).
The addition of TMS led to an increase in fume particle size just as it had using
higher shield gas flow rates, as shown in Figure 4-13. During baseline welding, SMPS
measurements showed a large number of particles with an average size of about

45
20 nm. As increasing amounts of TMS were added, this peak decreased and eventually
vanished. The particle size distribution shifted towards larger particles with the
nanoparticles being replaced with particles larger than 0.1 μm in diameter. These
results and TEM imagery (Figure 4-8) are consistent with previous modeling research
that found coarse particles such as the large amorphous SiO2 particles formed here are
capable of scavenging nanoparticles through intercoagulation (Lee and Wu 2005). It is
also possible that some metal vapor is scavenged by SiO2 particles, a result
demonstrated in previous research studying the impact of sorbents on metals in
combustion systems. When SiO2 is formed in the area where metals are evaporating,
metal vapor in the combustion system is scavenged, which prevents nucleation.
Nanomaterials can exhibit unique toxic effects based on their size (Biswas and Wu
2005; Jeng and Swanson 2006). Therefore, scavenging nanoparticles is a beneficial
outcome as it may reduce toxicity of welding fume particles by removing the
toxicological mechanisms of these particles that result from their size. The potential
reduction in toxicity based on elimination of nanoparticle pathways would occur
regardless of whether or not metal speciation in the welding fumes changed.
Effects of Shield Gas Flow Rate
The MMD was between 0.35-0.4 μm for baseline samples at all shield gas flow
rates tested. The total baseline number concentration decreased and the geometric
mean particle size increased as shield gas flow rate increased, as seen in Table 4-3,
which agrees with observations reported in previous studies (Dennis et al. 1997). It is
possible that particle size increased with increasing shield gas flow rate because
greater dispersion of metal vapor lowered the saturation ratio of metal vapor in the
46
system. This could have caused the rate of nucleation to decrease relative to the rate of
condensation.
As total shield gas flow rate decreased, the reduction of Cr6+ in welding fumes
observed after TMS addition decreased. However, the shift of particle size out of the
nanometer range was observed in all shield gas flow rates tested, as seen in
Figure 4-14. This points to intercoagulation as the dominant mechanism in increasing
particle size rather than SiO2 coating on metal agglomerates. If SiO2 coating was
responsible for increased particle size, Cr6+ concentration would have decreased at all
shield gas flow rates tested and TEM imagery would have shown consistent SiO2
coating of fume particles. This means that Cr6+ reduction was due primarily to TMS
scavenging reactive oxygen species during pyrolysis rather than formation of SiO2
coating on particles containing Cr6+. Intercoagulation between nanosized fume particles
and larger SiO2 particles occurred whether TMS decomposed in the area where fume
particle formation and oxidation occurred or whether TMS decomposed before reaching
the area of fume particle formation. However, the change in particle size due to
intercoagulation would not help meet OSHA standards for Cr6+ concentration. In order
to achieve Cr6+ reduction using TMS, residence time of the precursor vapor in the head
of the welding torch must be short enough to ensure TMS does not heat enough to
decompose before exiting the torch.
TMS Cost Analysis
The operating cost associated with adding TMS through delivery as a vapor from a
liquid reservoir is calculated in Appendix D. The cost of TMS addition at the most
effective flow rate tested was $78.96 per kg of welding electrode consumed. The cost
for TMS addition was high due to the expense of purchasing high purity laboratory

47
grade chemical. The added cost can be reduced by purchasing lower purity industrial
grade chemical.
Regulatory Compliance
The baseline welding samples produced at 30 Lpm shield gas flow rate created an
average Cr6+ concentration of 35.1 μg/m3. This concentration was over seven times
higher than the OSHA permissible exposure limit of 5 μg/m3 for Cr6+ (OSHA 2006).
When 4.2% of the 30 Lpm shield gas flow rate was used to deliver TMS vapor, the
resultant maximum Cr6+ concentration was 2.5 μg/m3. The use of TMS brought the
GMAW process into compliance with OSHA limits for Cr6+ without the use of any local
ventilation.
Figure 4-1. Average Cr6+ mass as a function of TMS carrier gas flow rate at 30 Lpm total shield gas flow rate.

48
Figure 4-2. GMAW fume particle size distributions at 30 Lpm shield gas flow rate.

49
Figure 4-3. GMAW fume particle size distribution under 4.2% TMS flow rate measured with cascade impactor.
50
Figure 4-4. GMAW fume agglomerate without SiO2 coating.

51
Figure 4-5. GMAW fume agglomerate with SiO2 coating indicated by arrows.
SiO2 coating

52
Figure 4-6. GMAW primary particles coated with SiO2.

53
Figure 4-7. Amorphous SiO2 agglomerate fume particle.

54
Figure 4-8. Intercoagulation between metal particles and SiO2 agglomerate.
Table 4-1. Qualitative elemental analysis of Figure 4-6 fume particles.
Element Weight %
Si K 17.66 Cr K 28.06 Mn K 27.93 Fe K 26.35
SiO2
Metal Fume Particles

55
Table 4-2. Fume generation rate using various TMS feed rates.
TMS carrier gas flow rate (% of 30 Lpm shield gas flow rate)
Average mass of fume particles ± standard deviation (mg)
0 29.515±3.612
1.4 27.728±0.735
2.8 26.820±1.551
3.5 25.406±3.288
4.2 22.189±5.307
Figure 4-9. Average Cr6+ mass in GMAW fumes using globular metal transfer mode.
56
Figure 4-10. Average Cr6+ mass as a function of TMS carrier gas flow rate at 25 Lpm total shield gas flow rate.

57
Figure 4-11. GMAW fume particle size distributions at 25 Lpm shield gas flow rate.

58
Figure 4-12. Average Cr6+ mass as a function of TMS carrier gas flow rate at 20 Lpm total shield gas flow rate.

59
Figure 4-13. GMAW fume particle size distributions at 20 Lpm shield gas flow rate.
Table 4-3. Baseline particle size characteristics at different shield gas flow rates.
Total shield gas flow rate (Lpm) Total concentration (#/cm3)
Count geometric mean diameter (nm)
20 8.14E+05 40.7
25 7.10E+05 52.1
30 5.13E+05 60.9

60
Figure 4-14. Particle size trends at different shield gas and TMS carrier gas flow rates.
61
CHAPTER 5 CONCLUSIONS
The GTAW study conducted as a part of this research showed that vapor phase
sorbents can reduce Cr6+ emissions from this type of welding. Nitrogen oxide
concentrations were also reduced during GTAW. Some particles were coated in a film
of amorphous SiO2. This part of the study demonstrated the feasibility of using silica
precursor vapor to produce in-situ silica sorbents for control of Cr6+ in welding fumes.
Mechanical properties of the weld after TMS addition is an important piece of
information in evaluating the effectiveness of any welding fume control technology that
must be addressed prior to any application of vapor phase sorbents to GTAW shield
gas.
Silica precursors led to reduction in Cr6+ in GMAW fumes of over 90%. The use of
TMS as a shield gas additive brought Cr6+ concentration down from a level that
exceeded the OSHA permissible exposure limit by over seven times to within regulatory
limits. This result may help industry to keep pace with tightening OSHA limits for this
hazardous air pollutant. The increase in particle size observed when TMS was added
provides another benefit for using these chemicals. It may become more feasible to use
less obtrusive filtration systems or personal protective equipment such as dust masks
instead of full face respirators to protect workers from welding fume particles after their
size has been increased using silica precursors. New technologies to scavenge
nanoparticles from effluent gas streams will be required as nanomaterial manufacturing
spreads. Silica precursors may provide a tool for dealing with this challenging problem.
TEM imagery demonstrated that some particles were coated in a film of amorphous
62
SiO2. All of the metals contained in the particles that were coated in SiO2 were insulated
regardless of speciation.
More research is needed to determine how effectively silica precursors mask the
toxic effects of nickel and manganese through encapsulation in amorphous silica.
Research using less expensive silica precursors may lead to a more cost effective
process that is more appealing to industry. Further research is necessary to quantify the
effect of silica precursors as shield gas additives on the mechanical properties of the
materials being welded.

63
APPENDIX A DETERMINATION OF THEORETICAL MINIMUM PRECURSOR CONCENTRATION IN
FUME PARTICLE FORMATION AREA
In order to estimate how much TMS must be added to coat the aerosols produced
during GMAW, it was first necessary to estimate the volume and radius of a single SiO2
molecule using Equation A-1. The molecular mass of SiO2 divided by the density of
SiO2 was multiplied by Avagadro’s number to calculate v1. The diameter of an SiO2
molecule was calculated using v1, assuming molecules were spherical. It was then
necessary to calculate the total volume of aerosols produced during GMAW. A typical
particle size distribution was obtained from the literature (Zimmer and Biswas 2001).
The next step was to calculate the change in volume that occurred upon adding a
mono-atomic layer of SiO2 by adding two diameters of SiO2 molecules to the aerosol
diameter, assuming spherical particles. Finally, the concentration required to produce
the above change in volume was calculated using Equation A-2.
(A-1)
(A-2)
ΔC = Change in concentration required to produce change in volume
N = Number concentration (#/cm3) Nav = 6.022E23 dp = dp0 + 2dSiO2 v1 = 4.05E-20 cm3 dSiO2 = 4.43E-8 cm
The concentration calculated using this technique relies on the assumption that
coating of uniform thickness occurs on all particles although in reality the coating is

64
almost certainly not homogeneous. The values used for the calculation of the minimum
precursor concentration are presented in Table A-1. The total concentration derived in
Table A-1 was 103-104 times lower than the concentration of TMS saturated carrier gas
used during experiments. The rationale behind the actual operating TMS carrier gas
feed rates can be found in Appendix C.
Table A-1. Particle size data used to calculate minimum precursor concentration, based on particle size distribution from literature (Zimmer and Biswas 2001).
N (#/cm3) dpo (cm) [(πN)/(NAVv1)] [(dp)3-(dpo)
3] ΔC (mol/cm3)
1.00E+05 1.80E-06 1.29E+01 9.03E-19 1.16E-17 4.48E+05 1.90E-06 5.77E+01 1.00E-18 5.80E-17 6.44E+06 2.00E-06 8.29E+02 1.11E-18 9.20E-16 1.72E+07 2.20E-06 2.22E+03 1.34E-18 2.96E-15 6.05E+07 2.40E-06 7.79E+03 1.59E-18 1.24E-14 2.55E+08 2.60E-06 3.28E+04 1.86E-18 6.09E-14 1.25E+09 2.80E-06 1.61E+05 2.15E-18 3.46E-13 8.59E+09 3.20E-06 1.11E+06 2.80E-18 3.09E-12 2.31E+06 3.40E-06 2.98E+02 3.15E-18 9.38E-16 1.39E+07 3.60E-06 1.79E+03 3.53E-18 6.30E-15 1.68E+07 3.75E-06 2.16E+03 3.82E-18 8.26E-15 2.41E+07 3.95E-06 3.11E+03 4.24E-18 1.32E-14 4.70E+07 4.30E-06 6.06E+03 5.01E-18 3.04E-14 6.40E+07 4.60E-06 8.24E+03 5.73E-18 4.72E-14 9.88E+07 5.00E-06 1.27E+04 6.76E-18 8.59E-14 1.68E+08 5.40E-06 2.17E+04 7.87E-18 1.71E-13 3.09E+08 5.70E-06 3.98E+04 8.76E-18 3.49E-13 5.36E+08 6.00E-06 6.90E+04 9.70E-18 6.69E-13 7.29E+08 6.45E-06 9.39E+04 1.12E-17 1.05E-12 8.88E+08 6.80E-06 1.14E+05 1.24E-17 1.42E-12 1.54E+09 7.40E-06 1.99E+05 1.47E-17 2.93E-12 1.84E+09 7.90E-06 2.37E+05 1.68E-17 3.97E-12 4.10E+09 8.30E-06 5.27E+05 1.85E-17 9.75E-12 9.47E+09 9.00E-06 1.22E+06 2.17E-17 2.65E-11 1.08E+10 9.50E-06 1.39E+06 2.42E-17 3.36E-11 1.98E+10 1.00E-05 2.55E+06 2.68E-17 6.82E-11 2.22E+10 1.10E-05 2.85E+06 3.24E-17 9.24E-11 3.81E+10 1.20E-05 4.90E+06 3.85E-17 1.89E-10 4.67E+10 1.30E-05 6.01E+06 4.52E-17 2.71E-10 9.89E+10 1.40E-05 1.27E+07 5.24E-17 6.67E-10 1.51E+11 1.55E-05 1.95E+07 6.42E-17 1.25E-09 2.62E+11 1.60E-05 3.38E+07 6.84E-17 2.31E-09
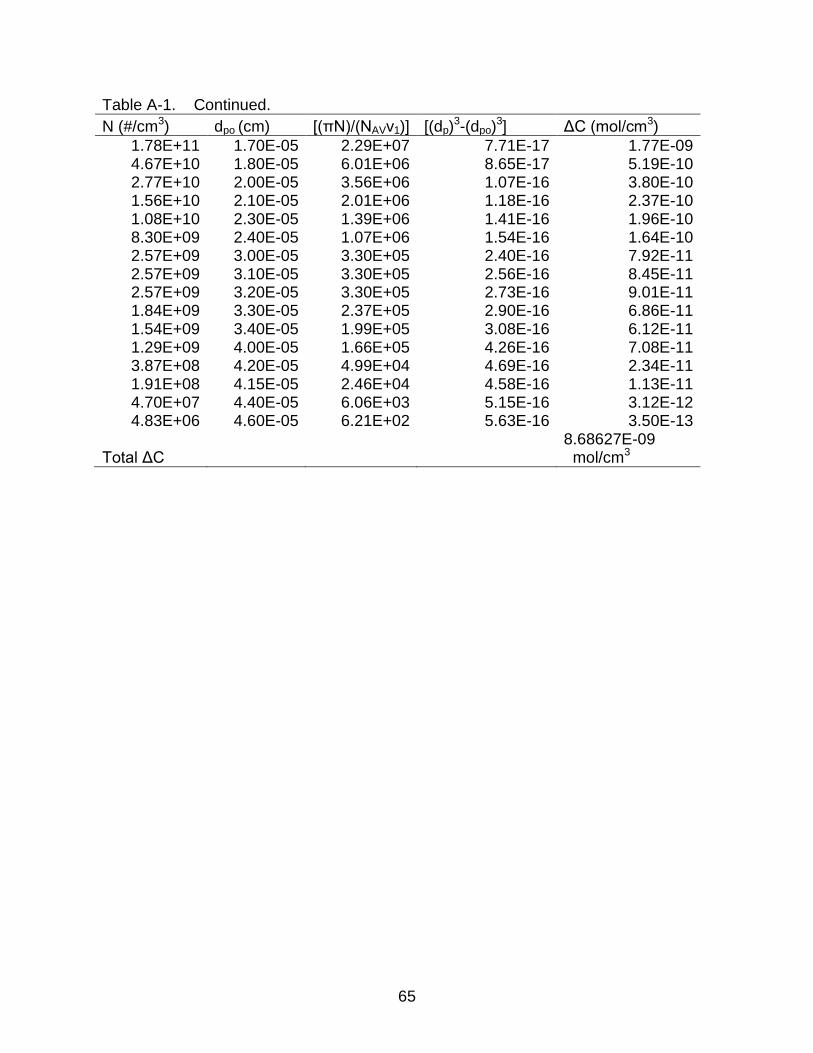
65
Table A-1. Continued.
N (#/cm3) dpo (cm) [(πN)/(NAVv1)] [(dp)3-(dpo)
3] ΔC (mol/cm3)
1.78E+11 1.70E-05 2.29E+07 7.71E-17 1.77E-09 4.67E+10 1.80E-05 6.01E+06 8.65E-17 5.19E-10 2.77E+10 2.00E-05 3.56E+06 1.07E-16 3.80E-10 1.56E+10 2.10E-05 2.01E+06 1.18E-16 2.37E-10 1.08E+10 2.30E-05 1.39E+06 1.41E-16 1.96E-10 8.30E+09 2.40E-05 1.07E+06 1.54E-16 1.64E-10 2.57E+09 3.00E-05 3.30E+05 2.40E-16 7.92E-11 2.57E+09 3.10E-05 3.30E+05 2.56E-16 8.45E-11 2.57E+09 3.20E-05 3.30E+05 2.73E-16 9.01E-11 1.84E+09 3.30E-05 2.37E+05 2.90E-16 6.86E-11 1.54E+09 3.40E-05 1.99E+05 3.08E-16 6.12E-11 1.29E+09 4.00E-05 1.66E+05 4.26E-16 7.08E-11 3.87E+08 4.20E-05 4.99E+04 4.69E-16 2.34E-11 1.91E+08 4.15E-05 2.46E+04 4.58E-16 1.13E-11 4.70E+07 4.40E-05 6.06E+03 5.15E-16 3.12E-12 4.83E+06 4.60E-05 6.21E+02 5.63E-16 3.50E-13
Total ΔC
8.68627E-09 mol/cm3

66
APPENDIX B DETERMINATION OF TMS AND TEOS VAPOR PRESSURE
The vapor pressures for TMS and TEOS were calculated using the Antoine
equation (Equation B-1). The Antoine coefficients used in the calculations are presented
in Table B-1 (Aston et al. 1941; Stull 1947).
Table B-1. Antoine coefficients for TMS and TEOS.
A B C
TEOS 4.17312 1561.277 -67.572 TMS 3.97703 1047.242 -36.057
(B-1)
P = vapor pressure (bar) T = temperature (K), 273 K for TMS, 373 K for TEOS

67
APPENDIX C DETERMINATION OF PRECURSOR CONCENTRATION IN SATURATED CARRIER
GAS
The following calculations show how the actual TMS feed rates used during this
research were calculated. Assuming the carrier gas leaving the liquid reservoir was
saturated with TMS vapor, the ideal gas law (Equation C-1) was used to calculate the
concentration of TMS vapor in the saturated carrier gas.
(C-1)
(vapor pressure of TMS vapor at 273 K)
(gas constant)
The TMS molar feed rates were calculated by multiplying the above concentration by
the carrier gas flow rates passed over the liquid reservoir, found in Table 2-1. For
example, when 4.2% of the 30 Lpm shield gas flow rate was used as TMS carrier gas,
the calculation would be performed as in Equation C-2.
TMS Molar Feed Rate =30 L shield gas
min×
0.042 L carrier gas
1 L shield gas
×103 cm3 carrier gas
1 L carrier gas×
1.589×10⁻⁵mol TMS
cm3 carrier gas
=2.00×10⁻² mol TMS
min
(C-2)
The same calculation was performed for TEOS using appropriate values for partial
pressure and temperature. The calculation was done for a temperature of 373 degrees
Kelvin (K) where vapor pressure was 0.114 atmospheres (atm). The corresponding

68
concentration of TEOS in saturated carrier gas was 3.713 Χ 10-6 mol TEOS/cm3. The
actual experimental concentration of TMS in the area of fume formation should be
higher than the minimum theoretical concentration calculated in Appendix A because of
dilution upon rejoining the main shield gas flow. It further decreased upon leaving the
welder into the ambient air where fume particle formation occurred. These factors were
taken into account when choosing the carrier gas flow rates to be tested.
In previous research that used reducing agents to minimize oxidation of chromium,
the use of 5.64 Χ 10-4 gmol/min ethene or 5.64 Χ 10-4 gmol/min nitrogen oxide by
Dennis et al. (2002) obtained 42% and 45% reduction in Cr6+ formation, respectively.
Based on this result, the current study used higher TMS feed rates to meet the desired
goal of 90% reduction in Cr6+ formation. The TMS carrier gas flow rates chosen were
also influenced by preliminary research performed by Dr. Daniel P. Chang in which
1.6% of the total GMAW shield gas flow rate was used as TMS carrier gas. Cr6+ was
reduced by 64% in Dr. Chang’s work. The current study used more of the shield gas as
TMS carrier gas than Dr. Chang in an attempt to exceed the 64% reduction attained by
Dr. Chang. In experimental set A, the specific TMS carrier gas percentages varied from
1.4 – 4.2% for a 30 Lpm shield gas low rate, presented in Table 2-1. Experimental set C
tested 5.0% of the 25 Lpm shield gas flow rate to see if a lower shield gas flow rate
impacted successful delivery of TMS additive to the welding arc. The results showed
that there was some reduction of Cr6+ mass but not enough to reach 90%. The shield
gas flow rate was further decreased to 20 Lpm and the TMS was varied between
2.1-6.3% in experimental set D.

69
APPENDIX D COST ANALYSIS
GTAW Operating Cost of TEOS Addition
The additional operating cost incurred based on the cost of laboratory grade TEOS
is calculated below. The cost of 98% pure TEOS obtained from Acros Organics used in
the calculation is $41.09 U.S. dollars (USD) per liter or 0.437 USD per gram TEOS. The
TEOS carrier gas flow rate used in this study was 1.874 Lpm. The concentration of
TEOS in saturated carrier gas was 3.7137 Χ 10-3 mol TMS/L carrier gas and the
molecular weight of TEOS is 208.33 grams per mole (g/mol). The added operating cost
of using TEOS as a GTAW shield gas additive is $3.80 USD per hour of welding time,
as calculated using Equation D-1.
Additional Operating Cost =1.874 L TEOS carrier gas
min×
3.7137×10⁻³ mol TEOS
1 L carrier gas
×208.33 g TEOS
1 mol TEOS×
0.0437 USD
1 g TEOS (D-1)
GMAW Operating Cost of TMS Cost Addition
The cost of using TMS as a GMAW shield gas additive is calculated below. The
cost of laboratory grade 99.9% pure TMS obtained from Acros Organics is $80.80 USD
per 100 grams of chemical. The molecular weight of TMS is 88.23 g/mol. The
concentration of TMS in saturated carrier gas is 1.589 x 10⁻² mol TMS/L, as calculated
in Appendix C. The calculation in Table D-1 was performed by multiplying the mass flow
rate of TMS by the cost per gram of TMS, as shown in Equation D-2. The electrode
consumption rate was held constant during experiments so the cost was also calculated
in terms of USD per unit mass of electrode consumed. The electrode consumption used
in the calculations was roughly 18 grams welding wire per minute of welding time. The

70
cost of TMS addition was calculated at a number of TMS feed rates and a total shield
gas flow rate of 30 Lpm. The condition that provided a >90% reduction in Cr6+ would
require an additional operating cost of $78.96 per kilogram of electrode consumed. This
cost is high due to the cost of the high purity laboratory grade chemical used in the
experiments.
Additional Operating Cost =X L TMS carrier gas
min×
1.589×10⁻² mol TMS
1 L carrier gas
×88.23 g TMS
1 mol TMS×
0.808 USD
1 g TMS
(D-2)
Table D-1. Cost analysis data for GMAW with TMS as a shield gas additive.
Carrier Gas % of Total Shield Gas Flow Rate
Total Shield Gas Flow Rate (Lpm)
TMS Carrier Gas Flow Rate (Lpm)
TMS Molar Flow Rate (gmol/min)
TMS Mass Flow Rate (g/min)
Cost of TMS Addition (USD/min welding time)
Cost of TMS Addition (USD/kg electrode consumed)
1.4% 30 0.42 0.007 0.589 $0.48 $26.32
2.8% 30 0.84 0.013 1.178 $0.95 $52.64
3.5% 30 1.05 0.017 1.472 $1.19 $65.80
4.2% 30 1.26 0.020 1.766 $1.43 $78.96

71
APPENDIX E RAW DATA FOR HEXAVALENT CHROMIUM
Table E-1. Raw Cr6+ data for baseline and TMS samples.
Sample IDa Shield Gas Flow
Rate (Lpm)
Precursor Carrier Gas Flow Rate (% of shield gas flow rate)
Cr6+ Mass (μg)
20_0_A 20 0 22.156
20_0_B 20 0 53.380
20_0_C 20 0 34.707
20_0_D 20 0 50.913
20_0_E 20 0 40.212
20_0_F 20 0 38.186
20_0_G 20 0 40.476
20_0_H 20 0 25.547
20_0_I 20 0 43.603
20_2.1_A 20 2.1 32.441
20_2.1_B 20 2.1 41.531
20_2.1_C 20 2.1 28.749
20_2.1_D 20 2.1 31.670
20_2.1_E 20 2.1 28.505
20_2.1_F 20 2.1 47.456
20_2.1_G 20 2.1 40.152
20_2.1_H 20 2.1 30.940
20_2.1_I 20 2.1 26.801
20_4.2_A 20 4.2 14.407
20_4.2_B 20 4.2 55.416
20_4.2_C 20 4.2 38.241
20_4.2_D 20 4.2 42.951
20_6.3_A 20 6.3 47.709
20_6.3_B 20 6.3 50.896
20_6.3_C 20 6.3 29.916
20_6.3_D 20 6.3 33.531
20_6.3_E 20 6.3 29.583
25_0_A 25 0 53.724
25_0_B 25 0 46.175
25_0_C 25 0 51.698
25_0_D 25 0 49.710
25_0_E 25 0 52.987
25_5.0_A 25 5.0 33.567
25_5.0_B 25 5.0 25.694
25_5.0_C 25 5.0 31.735
25_5.0_D 25 5.0 29.240

72
Table E-1. Continued.
Samplea Shield Gas Flow
Rate (Lpm)
Precursor Carrier Gas Flow Rate (% of shield gas flow rate)
Cr6+ Mass (μg)
25_5.0_E 25 5.0 30.098
30_0_A 30 0 66.026
30_0_B 30 0 63.212
30_0_C 30 0 61.831
30_0_D 30 0 62.521
30_1.4_A 30 1.4 37.588
30_1.4_B 30 1.4 43.546
30_1.4_C 30 1.4 37.916
30_2.8_A 30 2.8 32.463
30_2.8_B 30 2.8 32.354
30_2.8_C 30 2.8 32.517
30_3.5_A 30 3.5 32.071
30_3.5_B 30 3.5 28.719
30_3.5_C 30 3.5 14.732
30_3.5_D 30 3.5 11.342
30_3.5_E 30 3.5 20.627
30_3.5_F 30 3.5 23.518
30_3.5_G 30 3.5 26.347
30_3.5_H 30 3.5 28.506
30_4.2_A 30 4.2 4.480
30_4.2_B 30 4.2 4.480
30_4.2_C 30 4.2 4.480
30_4.2_D 30 4.2 4.480
**30_0_A_HV 30 0 73.834
**30_0_B_HV 30 0 80.865
**30_0_C_HV 30 0 73.903
**30_0_D_HV 30 0 77.938
**30_0_E_HV 30 0 65.612
**30_4.2_A_HV 30 4.2 38.564
**30_4.2_B_HV 30 4.2 38.363
**30_4.2_C_HV 30 4.2 32.551
**30_4.2_D_HV 30 4.2 39.856
**30_4.2_E_HV 30 4.2 48.170
*Sample ID format: ShieldGasFlowrate(Lpm)_TMS%_Replicate. **HV denotes high voltage.

73
APPENDIX F SCANNING MOBILITY PARTICLE SIZER PARTICLE SIZE DISTRIBUTION DATA
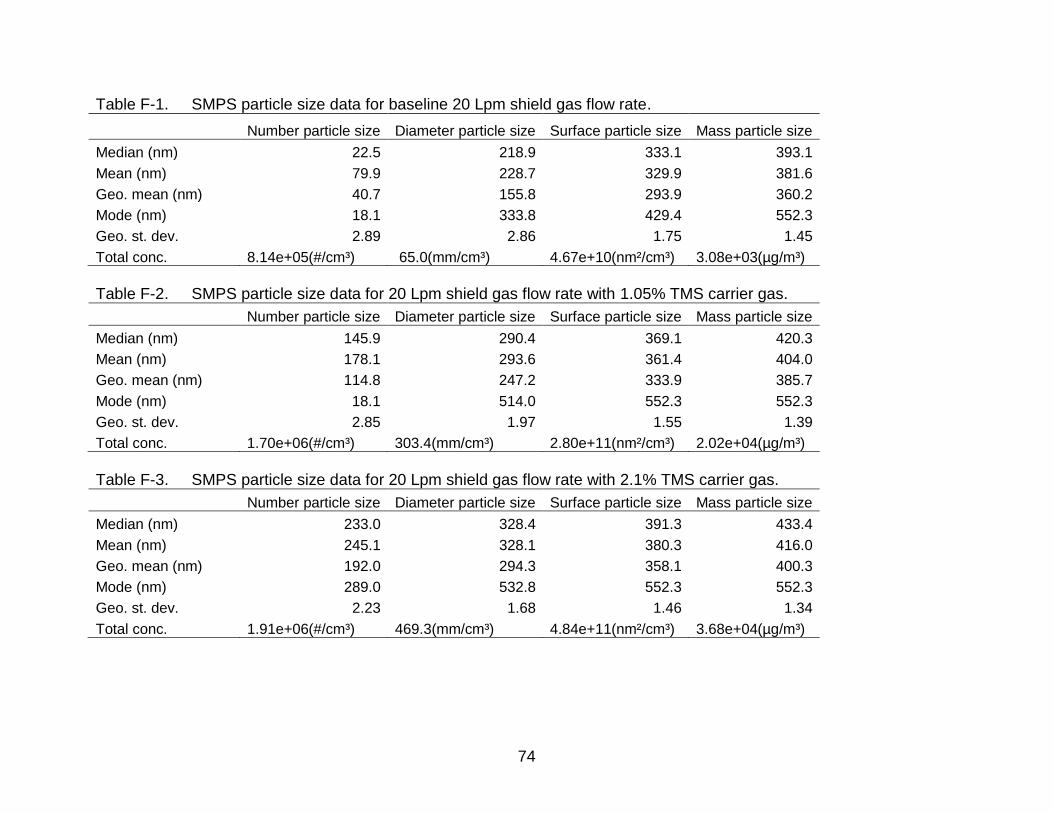
74
Table F-1. SMPS particle size data for baseline 20 Lpm shield gas flow rate.
Number particle size Diameter particle size Surface particle size Mass particle size
Median (nm) 22.5 218.9 333.1 393.1
Mean (nm) 79.9 228.7 329.9 381.6
Geo. mean (nm) 40.7 155.8 293.9 360.2
Mode (nm) 18.1 333.8 429.4 552.3
Geo. st. dev. 2.89 2.86 1.75 1.45
Total conc. 8.14e+05(#/cm³) 65.0(mm/cm³) 4.67e+10(nm²/cm³) 3.08e+03(µg/m³)
Table F-2. SMPS particle size data for 20 Lpm shield gas flow rate with 1.05% TMS carrier gas.
Number particle size Diameter particle size Surface particle size Mass particle size
Median (nm) 145.9 290.4 369.1 420.3
Mean (nm) 178.1 293.6 361.4 404.0
Geo. mean (nm) 114.8 247.2 333.9 385.7
Mode (nm) 18.1 514.0 552.3 552.3
Geo. st. dev. 2.85 1.97 1.55 1.39
Total conc. 1.70e+06(#/cm³) 303.4(mm/cm³) 2.80e+11(nm²/cm³) 2.02e+04(µg/m³)
Table F-3. SMPS particle size data for 20 Lpm shield gas flow rate with 2.1% TMS carrier gas.
Number particle size Diameter particle size Surface particle size Mass particle size
Median (nm) 233.0 328.4 391.3 433.4
Mean (nm) 245.1 328.1 380.3 416.0
Geo. mean (nm) 192.0 294.3 358.1 400.3
Mode (nm) 289.0 532.8 552.3 552.3
Geo. st. dev. 2.23 1.68 1.46 1.34
Total conc. 1.91e+06(#/cm³) 469.3(mm/cm³) 4.84e+11(nm²/cm³) 3.68e+04(µg/m³)
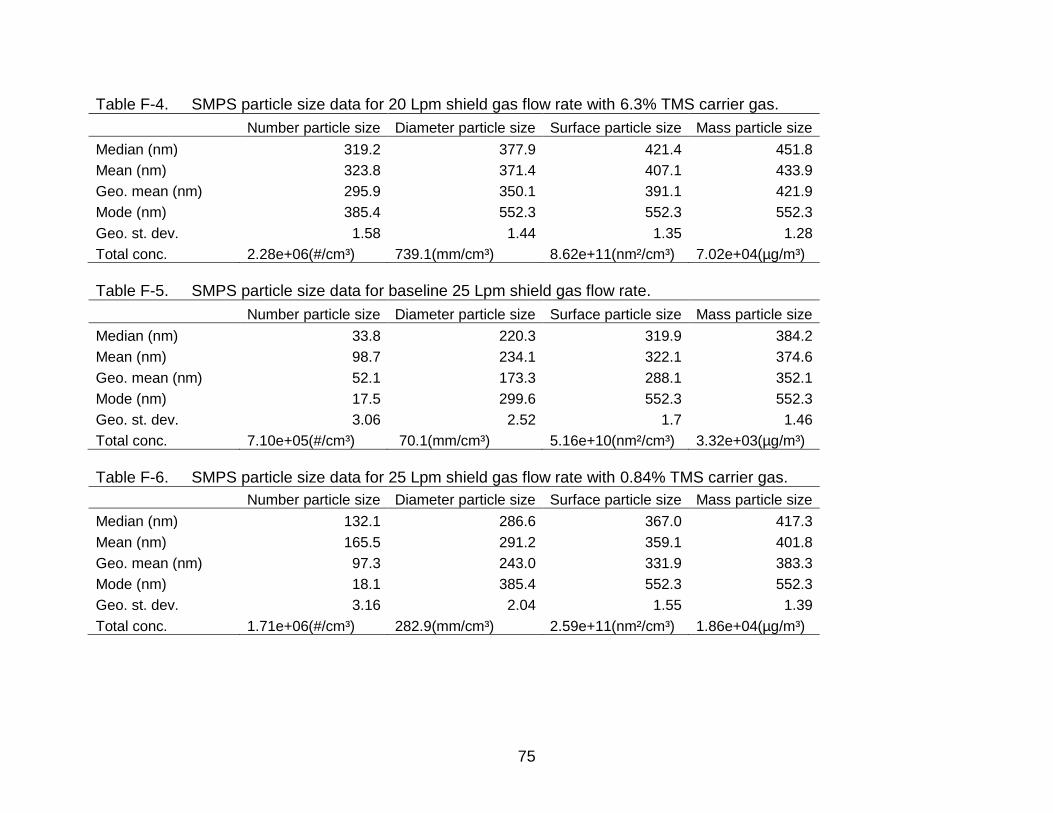
75
Table F-4. SMPS particle size data for 20 Lpm shield gas flow rate with 6.3% TMS carrier gas.
Number particle size Diameter particle size Surface particle size Mass particle size
Median (nm) 319.2 377.9 421.4 451.8
Mean (nm) 323.8 371.4 407.1 433.9
Geo. mean (nm) 295.9 350.1 391.1 421.9
Mode (nm) 385.4 552.3 552.3 552.3
Geo. st. dev. 1.58 1.44 1.35 1.28
Total conc. 2.28e+06(#/cm³) 739.1(mm/cm³) 8.62e+11(nm²/cm³) 7.02e+04(µg/m³)
Table F-5. SMPS particle size data for baseline 25 Lpm shield gas flow rate.
Number particle size Diameter particle size Surface particle size Mass particle size
Median (nm) 33.8 220.3 319.9 384.2
Mean (nm) 98.7 234.1 322.1 374.6
Geo. mean (nm) 52.1 173.3 288.1 352.1
Mode (nm) 17.5 299.6 552.3 552.3
Geo. st. dev. 3.06 2.52 1.7 1.46
Total conc. 7.10e+05(#/cm³) 70.1(mm/cm³) 5.16e+10(nm²/cm³) 3.32e+03(µg/m³)
Table F-6. SMPS particle size data for 25 Lpm shield gas flow rate with 0.84% TMS carrier gas.
Number particle size Diameter particle size Surface particle size Mass particle size
Median (nm) 132.1 286.6 367.0 417.3
Mean (nm) 165.5 291.2 359.1 401.8
Geo. mean (nm) 97.3 243.0 331.9 383.3
Mode (nm) 18.1 385.4 552.3 552.3
Geo. st. dev. 3.16 2.04 1.55 1.39
Total conc. 1.71e+06(#/cm³) 282.9(mm/cm³) 2.59e+11(nm²/cm³) 1.86e+04(µg/m³)

76
Table F-7. SMPS particle size data for 25 Lpm shield gas flow rate with 1.68% TMS carrier gas.
Number particle size Diameter particle size Surface particle size Mass particle size
Median (nm) 182.1 320.9 388.3 430.1
Mean (nm) 201.7 318.4 376.6 413.6
Geo. mean (nm) 125.9 276.6 353 397.5
Mode (nm) 18.8 429.4 552.3 552.3
Geo. st. dev. 3.12 1.87 1.48 1.35
Total conc. 1.18e+06(#/cm³) 238.9(mm/cm³) 2.39e+11(nm²/cm³) 1.80e+04(µg/m³)
Table F-8. SMPS particle size data for 25 Lpm shield gas flow rate with 5.04% TMS carrier gas.
Number particle size Diameter particle size Surface particle size Mass particle size
Median (nm) 266.3 346.6 400.9 438.3
Mean (nm) 274.1 344.2 389.3 421.4
Geo. mean (nm) 226.1 315.8 369.7 407.1
Mode (nm) 333.8 532.8 552.3 552.3
Geo. st. dev. 2.07 1.58 1.41 1.32
Total conc. 1.71e+06(#/cm³) 467.5(mm/cm³) 5.06e+11(nm²/cm³) 3.94e+04(µg/m³)
Table F-9. SMPS particle size data for baseline 30 Lpm shield gas flow rate.
Number particle size Diameter particle size Surface particle size Mass particle size
Median (nm) 59.2 211.8 312 383.5
Mean (nm) 108.6 231.6 316.6 372.2
Geo. mean (nm) 60.9 176.9 281.9 348.1
Mode (nm) 17.5 259.5 461.4 552.3
Geo. st. dev. 3.01 2.36 1.71 1.48
Total conc. 5.13e+05(#/cm³) 55.7(mm/cm³) 4.05e+10(nm²/cm³) 2.57e+03(µg/m³)
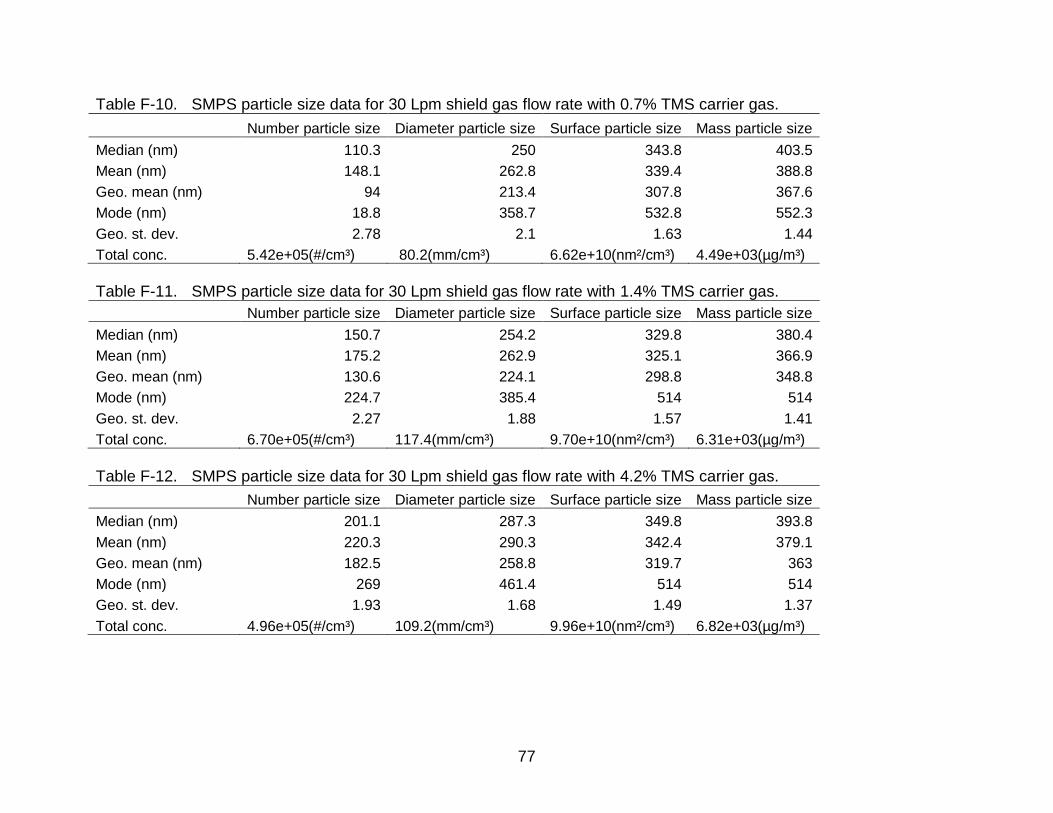
77
Table F-10. SMPS particle size data for 30 Lpm shield gas flow rate with 0.7% TMS carrier gas.
Number particle size Diameter particle size Surface particle size Mass particle size
Median (nm) 110.3 250 343.8 403.5
Mean (nm) 148.1 262.8 339.4 388.8
Geo. mean (nm) 94 213.4 307.8 367.6
Mode (nm) 18.8 358.7 532.8 552.3
Geo. st. dev. 2.78 2.1 1.63 1.44
Total conc. 5.42e+05(#/cm³) 80.2(mm/cm³) 6.62e+10(nm²/cm³) 4.49e+03(µg/m³)
Table F-11. SMPS particle size data for 30 Lpm shield gas flow rate with 1.4% TMS carrier gas.
Number particle size Diameter particle size Surface particle size Mass particle size
Median (nm) 150.7 254.2 329.8 380.4
Mean (nm) 175.2 262.9 325.1 366.9
Geo. mean (nm) 130.6 224.1 298.8 348.8
Mode (nm) 224.7 385.4 514 514
Geo. st. dev. 2.27 1.88 1.57 1.41
Total conc. 6.70e+05(#/cm³) 117.4(mm/cm³) 9.70e+10(nm²/cm³) 6.31e+03(µg/m³)
Table F-12. SMPS particle size data for 30 Lpm shield gas flow rate with 4.2% TMS carrier gas.
Number particle size Diameter particle size Surface particle size Mass particle size
Median (nm) 201.1 287.3 349.8 393.8
Mean (nm) 220.3 290.3 342.4 379.1
Geo. mean (nm) 182.5 258.8 319.7 363
Mode (nm) 269 461.4 514 514
Geo. st. dev. 1.93 1.68 1.49 1.37
Total conc. 4.96e+05(#/cm³) 109.2(mm/cm³) 9.96e+10(nm²/cm³) 6.82e+03(µg/m³)

78
Table F-13. Raw SMPS particle size distribution data for 20 Lpm shield gas flow rate.
Baseline 1.05% TMS 2.1% TMS 6.3% TMS
Diameter (nm) #/cm³ #/cm³ #/cm³ #/cm³
12.6 5.24E+04 2.42E+04 2.56E+03 3.86E+02
13.1 9.51E+04 3.61E+04 2.07E+03 3.60E+02
13.6 1.22E+05 5.00E+04 1.77E+03 3.95E+02
14.1 1.35E+05 5.38E+04 3.64E+03 1.22E+02
14.6 1.73E+05 8.44E+04 6.58E+03 0.00E+00
15.1 2.94E+05 1.22E+05 1.95E+04 0.00E+00
15.7 6.88E+05 2.39E+05 4.57E+04 1.01E+02
16.3 1.65E+06 5.55E+05 1.05E+05 9.55E+01
16.8 2.70E+06 1.06E+06 1.64E+05 2.72E+02
17.5 3.56E+06 1.67E+06 2.17E+05 1.72E+02
18.1 3.74E+06 1.98E+06 2.69E+05 5.76E+02
18.8 3.45E+06 1.92E+06 3.29E+05 5.51E+02
19.5 2.88E+06 1.66E+06 3.79E+05 1.33E+03
20.2 2.36E+06 1.38E+06 4.38E+05 1.10E+03
20.9 1.89E+06 1.17E+06 4.28E+05 2.47E+03
21.7 1.54E+06 1.01E+06 4.14E+05 1.75E+03
22.5 1.31E+06 9.13E+05 3.83E+05 2.38E+03
23.3 1.14E+06 8.35E+05 3.32E+05 2.30E+03
24.1 9.82E+05 7.51E+05 3.12E+05 2.51E+03
25.0 8.61E+05 6.77E+05 3.01E+05 2.00E+03
25.9 7.41E+05 6.03E+05 2.70E+05 3.19E+03
26.9 6.18E+05 5.44E+05 2.56E+05 2.36E+03
27.9 5.16E+05 4.92E+05 2.39E+05 3.14E+03
28.9 4.51E+05 4.66E+05 2.26E+05 4.42E+03
30.0 3.83E+05 4.44E+05 2.18E+05 4.28E+03
31.1 3.40E+05 4.33E+05 2.13E+05 4.70E+03
32.2 3.08E+05 4.34E+05 2.16E+05 6.82E+03
33.4 2.74E+05 4.32E+05 2.16E+05 7.91E+03
34.6 2.56E+05 4.63E+05 2.24E+05 8.68E+03
35.9 2.39E+05 4.83E+05 2.34E+05 1.09E+04
37.2 2.25E+05 5.16E+05 2.56E+05 1.41E+04
38.5 2.15E+05 5.61E+05 2.82E+05 1.42E+04
40.0 2.03E+05 5.92E+05 3.06E+05 1.71E+04
41.4 2.02E+05 6.17E+05 3.28E+05 2.07E+04
42.9 1.98E+05 6.51E+05 3.53E+05 2.55E+04
44.5 1.96E+05 6.73E+05 3.77E+05 2.78E+04
46.1 1.91E+05 6.98E+05 4.17E+05 3.26E+04

79
Table F-13. Continued.
Baseline 1.05% TMS 2.1% TMS 6.3% TMS
Diameter (nm) #/cm³ #/cm³ #/cm³ #/cm³
47.8 1.88E+05 7.32E+05 4.35E+05 3.92E+04
49.6 1.86E+05 7.71E+05 4.83E+05 4.49E+04
51.4 1.83E+05 7.87E+05 5.03E+05 5.09E+04
53.3 1.84E+05 8.11E+05 5.40E+05 5.78E+04
55.2 1.85E+05 8.35E+05 5.72E+05 6.76E+04
57.3 1.80E+05 8.42E+05 6.03E+05 7.76E+04
59.4 1.76E+05 8.57E+05 6.15E+05 8.63E+04
61.5 1.82E+05 8.53E+05 6.45E+05 1.00E+05
63.8 1.84E+05 8.70E+05 6.67E+05 1.14E+05
66.1 1.86E+05 8.75E+05 6.91E+05 1.29E+05
68.5 1.82E+05 8.91E+05 7.13E+05 1.43E+05
71.0 1.83E+05 9.01E+05 7.36E+05 1.65E+05
73.7 1.86E+05 8.89E+05 7.50E+05 1.82E+05
76.4 1.88E+05 8.94E+05 7.94E+05 2.03E+05
79.1 1.86E+05 8.96E+05 8.09E+05 2.31E+05
82.0 1.90E+05 8.84E+05 8.19E+05 2.54E+05
85.1 1.89E+05 8.93E+05 8.34E+05 2.79E+05
88.2 1.95E+05 9.01E+05 8.46E+05 3.06E+05
91.4 2.01E+05 9.05E+05 8.61E+05 3.34E+05
94.7 2.08E+05 9.19E+05 8.81E+05 3.72E+05
98.2 2.13E+05 9.25E+05 8.94E+05 4.02E+05
101.8 2.19E+05 9.31E+05 9.16E+05 4.52E+05
105.5 2.30E+05 9.60E+05 9.35E+05 4.95E+05
109.4 2.35E+05 9.79E+05 9.75E+05 5.54E+05
113.4 2.45E+05 1.00E+06 1.02E+06 5.98E+05
117.6 2.56E+05 1.02E+06 1.05E+06 6.44E+05
121.9 2.67E+05 1.05E+06 1.10E+06 6.95E+05
126.3 2.78E+05 1.08E+06 1.17E+06 7.59E+05
131.0 2.85E+05 1.11E+06 1.21E+06 8.28E+05
135.8 3.02E+05 1.15E+06 1.28E+06 9.11E+05
140.7 3.08E+05 1.20E+06 1.36E+06 1.00E+06
145.9 3.22E+05 1.25E+06 1.42E+06 1.09E+06
151.2 3.26E+05 1.29E+06 1.51E+06 1.18E+06
156.8 3.38E+05 1.33E+06 1.59E+06 1.32E+06
162.5 3.40E+05 1.38E+06 1.69E+06 1.46E+06
168.5 3.39E+05 1.42E+06 1.78E+06 1.60E+06
174.7 3.47E+05 1.48E+06 1.88E+06 1.79E+06

80
Table F-13. Continued.
Baseline 1.05% TMS 2.1% TMS 6.3% TMS
Diameter (nm) #/cm³ #/cm³ #/cm³ #/cm³
181.1 3.52E+05 1.52E+06 1.97E+06 1.98E+06
187.7 3.59E+05 1.57E+06 2.06E+06 2.15E+06
194.6 3.57E+05 1.60E+06 2.15E+06 2.33E+06
201.7 3.71E+05 1.64E+06 2.24E+06 2.52E+06
209.1 3.62E+05 1.66E+06 2.33E+06 2.68E+06
216.7 3.59E+05 1.67E+06 2.42E+06 2.88E+06
224.7 3.52E+05 1.67E+06 2.49E+06 3.07E+06
232.9 3.44E+05 1.67E+06 2.55E+06 3.24E+06
241.4 3.39E+05 1.68E+06 2.64E+06 3.44E+06
250.3 3.25E+05 1.68E+06 2.69E+06 3.59E+06
259.5 3.27E+05 1.70E+06 2.73E+06 3.78E+06
269.0 3.12E+05 1.71E+06 2.77E+06 3.95E+06
278.8 3.00E+05 1.71E+06 2.79E+06 4.06E+06
289.0 2.94E+05 1.71E+06 2.82E+06 4.23E+06
299.6 2.81E+05 1.71E+06 2.80E+06 4.35E+06
310.6 2.76E+05 1.68E+06 2.77E+06 4.41E+06
322.0 2.68E+05 1.63E+06 2.76E+06 4.52E+06
333.8 2.64E+05 1.58E+06 2.76E+06 4.62E+06
346.0 2.48E+05 1.53E+06 2.68E+06 4.68E+06
358.7 2.42E+05 1.49E+06 2.63E+06 4.71E+06
371.8 2.34E+05 1.44E+06 2.58E+06 4.76E+06
385.4 2.18E+05 1.38E+06 2.52E+06 4.80E+06
399.5 2.09E+05 1.32E+06 2.46E+06 4.73E+06
414.2 1.95E+05 1.27E+06 2.41E+06 4.72E+06
429.4 1.84E+05 1.23E+06 2.35E+06 4.76E+06
445.1 1.69E+05 1.19E+06 2.30E+06 4.71E+06
461.4 1.56E+05 1.15E+06 2.25E+06 4.67E+06
478.3 1.48E+05 1.10E+06 2.19E+06 4.65E+06
495.8 1.36E+05 1.07E+06 2.13E+06 4.56E+06
514.0 1.27E+05 1.05E+06 2.06E+06 4.52E+06
Table F-14. Raw SMPS particle size distribution data for 25 Lpm shield gas flow rate.
Baseline 0.84% TMS 1.68% TMS 5.04% TMS
Diameter (nm) #/cm³ #/cm³ #/cm³ #/cm³
12.6 2.21E+04 5.05E+03 3.89E+03 0.00E+00
13.1 5.46E+04 7.75E+03 3.28E+03 0.00E+00
13.6 9.45E+04 9.60E+03 3.51E+03 2.63E+02

81
Table F-14. Continued.
Baseline 0.84% TMS 1.68% TMS 5.04% TMS
Diameter (nm) #/cm³ #/cm³ #/cm³ #/cm³
14.1 1.25E+05 1.72E+04 7.98E+03 0.00E+00
14.6 1.51E+05 2.46E+04 1.81E+04 1.49E+02
15.1 2.65E+05 6.06E+04 7.08E+04 1.63E+03
15.7 7.01E+05 2.90E+05 3.39E+05 4.52E+03
16.3 1.52E+06 1.06E+06 6.99E+05 2.75E+04
16.8 2.39E+06 2.34E+06 1.17E+06 1.19E+05
17.5 3.01E+06 3.54E+06 1.76E+06 2.66E+05
18.1 2.91E+06 3.80E+06 2.07E+06 3.68E+05
18.8 2.43E+06 3.58E+06 2.11E+06 4.13E+05
19.5 1.81E+06 3.14E+06 1.83E+06 3.90E+05
20.2 1.31E+06 2.66E+06 1.49E+06 3.50E+05
20.9 9.66E+05 2.15E+06 1.16E+06 3.04E+05
21.7 7.47E+05 1.70E+06 8.69E+05 2.72E+05
22.5 6.29E+05 1.33E+06 6.46E+05 2.34E+05
23.3 5.25E+05 1.03E+06 5.12E+05 1.99E+05
24.1 4.50E+05 7.81E+05 3.83E+05 1.74E+05
25.0 3.99E+05 6.14E+05 3.04E+05 1.53E+05
25.9 3.57E+05 5.01E+05 2.44E+05 1.38E+05
26.9 3.35E+05 4.31E+05 2.09E+05 1.15E+05
27.9 3.14E+05 3.76E+05 1.86E+05 1.06E+05
28.9 2.86E+05 3.48E+05 1.62E+05 1.02E+05
30.0 2.64E+05 3.12E+05 1.48E+05 9.70E+04
31.1 2.50E+05 2.90E+05 1.32E+05 8.81E+04
32.2 2.42E+05 2.79E+05 1.30E+05 9.32E+04
33.4 2.28E+05 2.74E+05 1.22E+05 8.94E+04
34.6 2.27E+05 2.74E+05 1.22E+05 9.46E+04
35.9 2.25E+05 2.83E+05 1.27E+05 9.93E+04
37.2 2.30E+05 2.95E+05 1.27E+05 1.04E+05
38.5 2.29E+05 3.11E+05 1.31E+05 1.08E+05
40.0 2.31E+05 3.31E+05 1.35E+05 1.18E+05
41.4 2.28E+05 3.43E+05 1.38E+05 1.30E+05
42.9 2.34E+05 3.55E+05 1.48E+05 1.39E+05
44.5 2.38E+05 3.80E+05 1.60E+05 1.47E+05
46.1 2.37E+05 4.04E+05 1.65E+05 1.58E+05
47.8 2.41E+05 4.26E+05 1.80E+05 1.74E+05
49.6 2.37E+05 4.43E+05 1.93E+05 1.94E+05
51.4 2.35E+05 4.71E+05 2.11E+05 2.03E+05
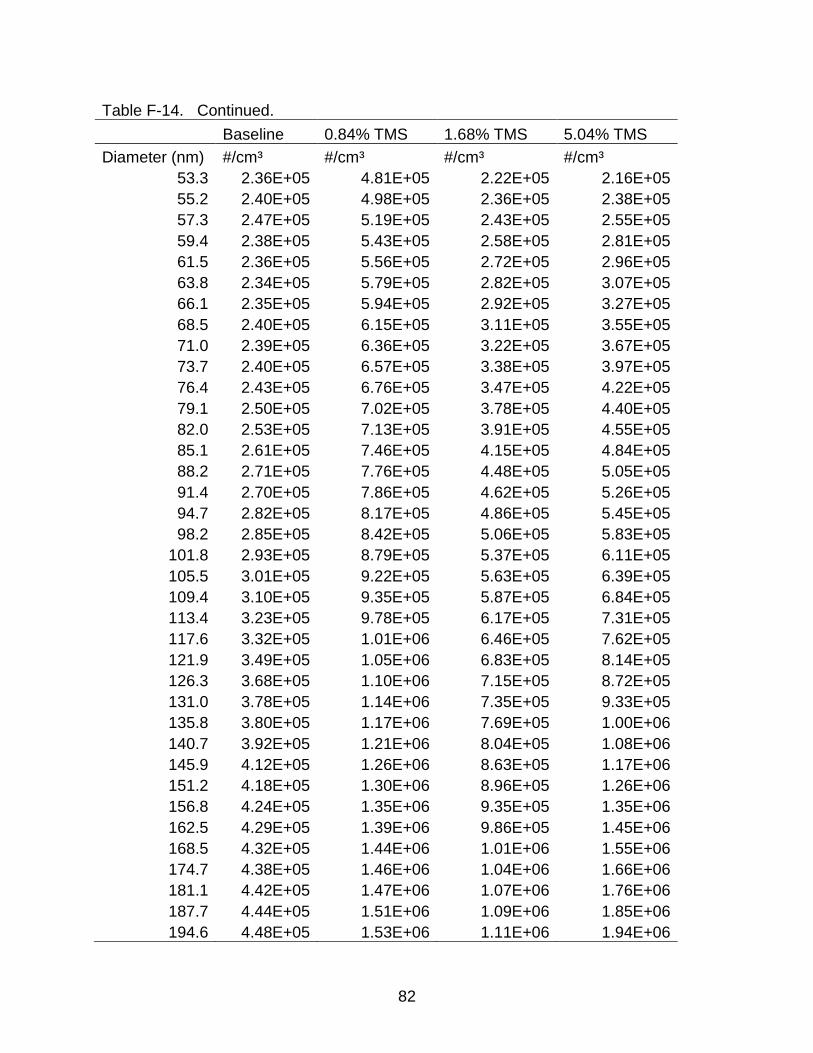
82
Table F-14. Continued.
Baseline 0.84% TMS 1.68% TMS 5.04% TMS
Diameter (nm) #/cm³ #/cm³ #/cm³ #/cm³
53.3 2.36E+05 4.81E+05 2.22E+05 2.16E+05
55.2 2.40E+05 4.98E+05 2.36E+05 2.38E+05
57.3 2.47E+05 5.19E+05 2.43E+05 2.55E+05
59.4 2.38E+05 5.43E+05 2.58E+05 2.81E+05
61.5 2.36E+05 5.56E+05 2.72E+05 2.96E+05
63.8 2.34E+05 5.79E+05 2.82E+05 3.07E+05
66.1 2.35E+05 5.94E+05 2.92E+05 3.27E+05
68.5 2.40E+05 6.15E+05 3.11E+05 3.55E+05
71.0 2.39E+05 6.36E+05 3.22E+05 3.67E+05
73.7 2.40E+05 6.57E+05 3.38E+05 3.97E+05
76.4 2.43E+05 6.76E+05 3.47E+05 4.22E+05
79.1 2.50E+05 7.02E+05 3.78E+05 4.40E+05
82.0 2.53E+05 7.13E+05 3.91E+05 4.55E+05
85.1 2.61E+05 7.46E+05 4.15E+05 4.84E+05
88.2 2.71E+05 7.76E+05 4.48E+05 5.05E+05
91.4 2.70E+05 7.86E+05 4.62E+05 5.26E+05
94.7 2.82E+05 8.17E+05 4.86E+05 5.45E+05
98.2 2.85E+05 8.42E+05 5.06E+05 5.83E+05
101.8 2.93E+05 8.79E+05 5.37E+05 6.11E+05
105.5 3.01E+05 9.22E+05 5.63E+05 6.39E+05
109.4 3.10E+05 9.35E+05 5.87E+05 6.84E+05
113.4 3.23E+05 9.78E+05 6.17E+05 7.31E+05
117.6 3.32E+05 1.01E+06 6.46E+05 7.62E+05
121.9 3.49E+05 1.05E+06 6.83E+05 8.14E+05
126.3 3.68E+05 1.10E+06 7.15E+05 8.72E+05
131.0 3.78E+05 1.14E+06 7.35E+05 9.33E+05
135.8 3.80E+05 1.17E+06 7.69E+05 1.00E+06
140.7 3.92E+05 1.21E+06 8.04E+05 1.08E+06
145.9 4.12E+05 1.26E+06 8.63E+05 1.17E+06
151.2 4.18E+05 1.30E+06 8.96E+05 1.26E+06
156.8 4.24E+05 1.35E+06 9.35E+05 1.35E+06
162.5 4.29E+05 1.39E+06 9.86E+05 1.45E+06
168.5 4.32E+05 1.44E+06 1.01E+06 1.55E+06
174.7 4.38E+05 1.46E+06 1.04E+06 1.66E+06
181.1 4.42E+05 1.47E+06 1.07E+06 1.76E+06
187.7 4.44E+05 1.51E+06 1.09E+06 1.85E+06
194.6 4.48E+05 1.53E+06 1.11E+06 1.94E+06

83
Table F-14. Continued.
Baseline 0.84% TMS 1.68% TMS 5.04% TMS
Diameter (nm) #/cm³ #/cm³ #/cm³ #/cm³
201.7 4.38E+05 1.55E+06 1.15E+06 2.04E+06
209.1 4.34E+05 1.55E+06 1.17E+06 2.14E+06
216.7 4.23E+05 1.56E+06 1.21E+06 2.24E+06
224.7 4.15E+05 1.58E+06 1.24E+06 2.34E+06
232.9 4.07E+05 1.61E+06 1.27E+06 2.46E+06
241.4 4.05E+05 1.60E+06 1.29E+06 2.54E+06
250.3 3.88E+05 1.62E+06 1.30E+06 2.63E+06
259.5 3.71E+05 1.62E+06 1.32E+06 2.68E+06
269.0 3.57E+05 1.64E+06 1.33E+06 2.74E+06
278.8 3.41E+05 1.61E+06 1.33E+06 2.77E+06
289.0 3.32E+05 1.60E+06 1.35E+06 2.79E+06
299.6 3.27E+05 1.55E+06 1.36E+06 2.83E+06
310.6 3.12E+05 1.52E+06 1.34E+06 2.82E+06
322.0 2.92E+05 1.46E+06 1.34E+06 2.84E+06
333.8 2.77E+05 1.45E+06 1.34E+06 2.86E+06
346.0 2.69E+05 1.40E+06 1.32E+06 2.83E+06
358.7 2.56E+05 1.36E+06 1.32E+06 2.82E+06
371.8 2.40E+05 1.35E+06 1.30E+06 2.78E+06
385.4 2.25E+05 1.31E+06 1.27E+06 2.75E+06
399.5 2.09E+05 1.24E+06 1.25E+06 2.70E+06
414.2 2.03E+05 1.20E+06 1.22E+06 2.66E+06
429.4 1.85E+05 1.15E+06 1.19E+06 2.59E+06
445.1 1.74E+05 1.09E+06 1.14E+06 2.51E+06
461.4 1.61E+05 1.05E+06 1.10E+06 2.46E+06
478.3 1.50E+05 9.90E+05 1.05E+06 2.40E+06
495.8 1.42E+05 9.76E+05 1.02E+06 2.35E+06
514.0 1.25E+05 9.30E+05 9.69E+05 2.29E+06
Table F-15. Raw SMPS particle size distribution data for 30 Lpm shield gas flow rate.
Baseline 0.7% TMS 1.4% TMS 4.2% TMS
Diameter (nm) #/cm³ #/cm³ #/cm³ #/cm³
12.6 6.84E+03 3.18E+03 1.10E+03 1.56E+03
13.1 1.39E+04 4.78E+03 1.18E+03 5.71E+02
13.6 3.09E+04 2.96E+03 1.21E+03 5.27E+02
14.1 4.81E+04 2.73E+03 2.72E+03 7.17E+02
14.6 8.28E+04 2.92E+03 2.95E+03 1.50E+03
15.1 1.81E+05 5.62E+03 3.52E+03 1.93E+03

84
Table F-15. Continued.
Baseline 0.7% TMS 1.4% TMS 4.2% TMS
Diameter (nm) #/cm³ #/cm³ #/cm³ #/cm³
15.7 5.83E+05 1.14E+04 7.72E+03 2.76E+03
16.3 1.23E+06 5.09E+04 1.87E+04 4.39E+03
16.8 1.58E+06 1.88E+05 3.05E+04 8.03E+03
17.5 1.66E+06 4.49E+05 4.01E+04 1.19E+04
18.1 1.44E+06 6.10E+05 4.68E+04 1.48E+04
18.8 1.18E+06 6.82E+05 4.47E+04 1.48E+04
19.5 9.33E+05 6.56E+05 5.57E+04 1.34E+04
20.2 7.29E+05 6.33E+05 6.81E+04 1.29E+04
20.9 5.84E+05 5.92E+05 8.89E+04 1.38E+04
21.7 4.71E+05 5.20E+05 1.13E+05 1.26E+04
22.5 3.82E+05 4.61E+05 1.29E+05 1.27E+04
23.3 3.30E+05 4.02E+05 1.43E+05 1.00E+04
24.1 2.99E+05 3.66E+05 1.47E+05 9.13E+03
25.0 2.63E+05 3.36E+05 1.46E+05 9.27E+03
25.9 2.50E+05 3.21E+05 1.52E+05 9.97E+03
26.9 2.21E+05 3.10E+05 1.54E+05 1.16E+04
27.9 2.09E+05 2.88E+05 1.64E+05 1.35E+04
28.9 2.02E+05 2.80E+05 1.80E+05 1.62E+04
30.0 1.90E+05 2.57E+05 2.01E+05 1.63E+04
31.1 1.80E+05 2.49E+05 2.23E+05 1.78E+04
32.2 1.80E+05 2.42E+05 2.40E+05 2.37E+04
33.4 1.77E+05 2.37E+05 2.60E+05 2.69E+04
34.6 1.73E+05 2.35E+05 2.84E+05 3.14E+04
35.9 1.71E+05 2.34E+05 2.99E+05 4.00E+04
37.2 1.72E+05 2.34E+05 3.27E+05 4.54E+04
38.5 1.74E+05 2.35E+05 3.45E+05 5.31E+04
40.0 1.72E+05 2.42E+05 3.62E+05 6.03E+04
41.4 1.76E+05 2.38E+05 3.75E+05 7.09E+04
42.9 1.76E+05 2.46E+05 4.04E+05 8.04E+04
44.5 1.77E+05 2.45E+05 4.28E+05 9.02E+04
46.1 1.78E+05 2.50E+05 4.42E+05 1.02E+05
47.8 1.79E+05 2.60E+05 4.67E+05 1.16E+05
49.6 1.82E+05 2.63E+05 4.75E+05 1.29E+05
51.4 1.88E+05 2.67E+05 4.86E+05 1.43E+05
53.3 1.89E+05 2.73E+05 4.94E+05 1.64E+05
55.2 1.91E+05 2.73E+05 4.95E+05 1.72E+05
57.3 1.97E+05 2.73E+05 4.98E+05 1.87E+05

85
Table F-15. Continued.
Baseline 0.7% TMS 1.4% TMS 4.2% TMS
Diameter (nm) #/cm³ #/cm³ #/cm³ #/cm³
59.4 2.00E+05 2.77E+05 4.95E+05 1.96E+05
61.5 2.06E+05 2.76E+05 4.93E+05 2.06E+05
63.8 2.05E+05 2.84E+05 4.97E+05 2.21E+05
66.1 2.11E+05 2.87E+05 4.89E+05 2.36E+05
68.5 2.19E+05 2.92E+05 4.81E+05 2.49E+05
71.0 2.28E+05 2.99E+05 4.75E+05 2.68E+05
73.7 2.30E+05 2.96E+05 4.76E+05 2.79E+05
76.4 2.37E+05 3.01E+05 4.77E+05 2.99E+05
79.1 2.53E+05 3.04E+05 4.70E+05 3.10E+05
82.0 2.56E+05 3.01E+05 4.50E+05 3.22E+05
85.1 2.64E+05 2.97E+05 4.40E+05 3.38E+05
88.2 2.71E+05 2.97E+05 4.26E+05 3.54E+05
91.4 2.74E+05 3.04E+05 4.16E+05 3.66E+05
94.7 2.80E+05 3.15E+05 4.07E+05 3.72E+05
98.2 2.87E+05 3.19E+05 4.16E+05 3.97E+05
101.8 2.94E+05 3.37E+05 4.28E+05 4.01E+05
105.5 3.01E+05 3.44E+05 4.33E+05 4.24E+05
109.4 3.08E+05 3.71E+05 4.36E+05 4.41E+05
113.4 3.16E+05 3.79E+05 4.46E+05 4.49E+05
117.6 3.23E+05 3.93E+05 4.58E+05 4.51E+05
121.9 3.30E+05 4.17E+05 4.68E+05 4.59E+05
126.3 3.37E+05 4.24E+05 4.86E+05 4.63E+05
131.0 3.42E+05 4.37E+05 5.17E+05 4.64E+05
135.8 3.63E+05 4.50E+05 5.47E+05 4.74E+05
140.7 3.69E+05 4.61E+05 5.83E+05 4.87E+05
145.9 3.73E+05 4.68E+05 6.33E+05 4.97E+05
151.2 3.83E+05 4.69E+05 6.60E+05 5.06E+05
156.8 3.82E+05 4.72E+05 6.90E+05 5.07E+05
162.5 3.86E+05 4.65E+05 7.10E+05 5.31E+05
168.5 3.85E+05 4.73E+05 7.38E+05 5.37E+05
174.7 3.77E+05 4.67E+05 7.50E+05 5.60E+05
181.1 3.77E+05 4.63E+05 7.49E+05 5.84E+05
187.7 3.69E+05 4.60E+05 7.57E+05 5.84E+05
194.6 3.62E+05 4.59E+05 7.61E+05 6.09E+05
201.7 3.54E+05 4.65E+05 7.60E+05 6.25E+05
209.1 3.42E+05 4.55E+05 7.61E+05 6.38E+05
216.7 3.33E+05 4.66E+05 7.71E+05 6.50E+05

86
Table F-15. Continued.
Baseline 0.7% TMS 1.4% TMS 4.2% TMS
Diameter (nm) #/cm³ #/cm³ #/cm³ #/cm³
224.7 3.31E+05 4.61E+05 7.76E+05 6.63E+05
232.9 3.15E+05 4.62E+05 7.70E+05 6.86E+05
241.4 3.09E+05 4.62E+05 7.71E+05 6.90E+05
250.3 2.98E+05 4.53E+05 7.48E+05 6.99E+05
259.5 2.90E+05 4.45E+05 7.32E+05 7.00E+05
269.0 2.72E+05 4.23E+05 7.08E+05 7.06E+05
278.8 2.58E+05 4.16E+05 6.82E+05 6.98E+05
289.0 2.54E+05 3.99E+05 6.59E+05 6.92E+05
299.6 2.44E+05 3.97E+05 6.50E+05 6.79E+05
310.6 2.35E+05 3.77E+05 6.19E+05 6.72E+05
322.0 2.19E+05 3.70E+05 5.93E+05 6.58E+05
333.8 2.06E+05 3.53E+05 5.80E+05 6.41E+05
346.0 1.94E+05 3.49E+05 5.58E+05 6.04E+05
358.7 1.83E+05 3.39E+05 5.41E+05 5.83E+05
371.8 1.72E+05 3.17E+05 5.27E+05 5.69E+05
385.4 1.71E+05 3.08E+05 5.11E+05 5.41E+05
399.5 1.54E+05 2.94E+05 4.84E+05 5.26E+05
414.2 1.43E+05 2.85E+05 4.56E+05 5.02E+05
429.4 1.42E+05 2.67E+05 4.27E+05 4.90E+05
445.1 1.35E+05 2.49E+05 4.02E+05 4.80E+05
461.4 1.28E+05 2.40E+05 3.82E+05 4.64E+05
478.3 1.14E+05 2.34E+05 3.56E+05 4.44E+05
495.8 1.09E+05 2.13E+05 3.44E+05 4.16E+05
514.0 9.90E+04 2.02E+05 3.31E+05 4.09E+05

87
APPENDIX G CASCADE IMPACTOR CUT SIZE AND PARTICLE SIZE DISTRIBUTION DATA
Cut sizes for the cascade impactor were calculated using a total flow rate (Q)
through the impactor of 20 Lpm. Equations G-1 – G-3 were used to calculate the values
in Table G-1. The data for cascade impactor measurement with a 30 Lpm shield gas
flow rate and 4.2% TMS are presented in Table G-2. The jet velocity is determined by
(G-1)
where Qj = jet flow rate (Q/nj), cm3/s Dj = jet diameter, cm nj = number of jets
The cut size can then be calculated using the following equations:
(G-2)
where η = 1.81E-5 cm2/s Stk50 = 0.24 ρp = 1 g/cm3
(G-3)
Table G-1. Impactor data used for cut size calculations.
Stage Vj nj Dj (cm) dp*√(Cc) (μm) dp (μm)
1 1.28E+02 1 1.82E+00 23.64 23.56
2 2.11E+02 6 5.79E-01 10.36 10.28
3 5.95E+02 12 2.44E-01 4.00 3.93
4 7.61E+02 90 7.87E-02 2.01 1.93
5 1.50E+03 110 5.08E-02 1.15 1.07
6 3.28E+03 110 3.43E-02 0.64 0.56
7 7.03E+03 90 2.59E-02 0.38 0.30

88
Table G-2. Particle size data measured using cascade impactor.
Upper cut size
Lower cut size
Geometric mean dp
Fume mass (g)
Mass fraction Δlogdp
Fume
mass/Δlogdp
100.000 23.560 48.539 0.00137 0.018 0.628 0.0022
23.560 10.283 15.565 0.00020 0.003 0.360 0.0006
10.283 3.925 6.353 0.00089 0.012 0.418 0.0021
3.925 1.934 2.755 0.00251 0.033 0.307 0.0082
1.934 1.075 1.442 0.00707 0.093 0.255 0.0277
1.075 0.561 0.777 0.01135 0.150 0.282 0.0402
0.561 0.302 0.412 0.00743 0.098 0.270 0.0276
0.302 0.030 0.095 0.04491 0.593 1.002 0.0448
Total
0.07574 1
0.1533
The MMD could not be calculated using the Hatch-Choate equation. The
distribution was not linear when plotted on log-probability paper and over half the mass
was found on the final filter, preventing accurate estimation of the geometric standard
deviation. However, the MMD could be estimated by plotting only the upper and lower
cut sizes of the final filter, where 60% of the mass was present, on log probability paper.
The MMD for was estimated at about 265 nm, typical for welding fume particles
(Jenkins et al. 2005).

89
LIST OF REFERENCES
American Welding Society. (1999). “Method F1.2-1999” Laboratory Method for Measuring Fume Generation Rates and Total Fume Emission of Welding and Allied Processes ANSI/AWS; Miami, Florida.
Antonini, J.M. (2003). Health Effects of Welding Fumes, Crit. Rev. Toxicol. 33:61-103.
Antonini, J.M., Lawryk, N.J., Murthy, G.G.K., and Brain, J.D. (1999). Effect of Welding Fume Solubility on Lung Macrophage Viability and Function in Vitro, J. Toxicol. Environ. Health Part A. 58:343-363.
Antonini, J.M., Taylor, M.D., Zimmer, A.T., and Roberts, J.R. (2004). Pulmonary Responses to Welding Fumes: Role of Metal Constituents, J Toxicol. Environ. Health Part A. 67:233-249.
Antonini, J.M., Santamaria, A.B., Jenkins, N.T., Albini, E., and Lucchini, R. (2006). Fate of Manganese Associated With the Inhalation of Welding Fumes: Potential Neurological Effects, NeuroToxicology. 27:304-310.
Aston, J.G., Kennedy, R.M., and Messerly, G.H. (1941). The Heat Capacity and Entropy, Heats of Fusion and Vaporization and the Vapor Pressure of Silicon Tetramethyl, J. Am. Chem. Soc. 63:2343-2348.
Bagchi, D., Stohs, S.J., Downs, B.W., Bagchi, M., and Preuss, H.G. (2002). Cytotoxicity and Oxidative Mechanisms of Different Forms of Chromium, Toxicology. 180:5-22.
Biswas, P., and Wu, C.Y. (1995). Control of Toxic Metal Emissions From Combustors Using Sorbents: a Review, J. Air & Waste Manage. Assoc. 48:113-127.
Biswas, P., and Wu, C.Y. (2005). Nanoparticles and the Environment, J. Air & Waste Manage. Assoc. 55:708-746.
Biswas, P., and Zachariah, M. (1997). In Situ Immobilization of Lead Species in Combustion Environments by Injection of Gas Phase Silica Sorbent Precursors, Environ. Sci. Technol. 31:2455-2463.
Boiano, J.M., Wallace, M.E., Sieber, W.K., Groff, J.H., Wang, J., and Ashley, K. (2000). Comparison of Three Sampling and Analytical Methods for the Determination of Airborne Hexavalent Chromium, J. Environ. Monit. 2:329-333.
Bowler, R.M., Gysens, S., Diamond, E., Nakagawa, S., Drezgic, M., and Roels, H.A. (2006). Manganese Exposure: Neuropsychological and Neurological Symptoms and Effects in Welders, NeuroToxiology. 27:315-326.

90
Bowler, R.M., Nakagawa, S., Drezgic, M., Roels, H.A., Park, R.M., Diamond, E., Mergler, D., Bouchard, M., Bowler, R.P., and Koller, W. (2007). Sequelae of Fume Exposure in Confined Space Welding: a Neurological and Neuropsychological Case Series, NeuroToxicology. 28:298-311.
Castner, H.R., and Null, C.L. (1998). Chromium, Nickel and Manganese in Shipyard Welding Fumes, Weld. J. 77:223-231.
Chang, D.P., Heung, W., Yun, M., and Green, D.P. (2004). Improving Welding Toxic Metal Emission Estimates in California, Final Report to the California Air Resources Board. 2004.
Cho, K., and Wu, C.Y. (2004). Control of Molybdenum Emission by Sorbents: Equilibrium Analysis, J. Environ. Eng. 130:201-204.
Cohen, M.D., Sisco, M., Baker, K., Bowser, D., Chel, L.C., and Schlesinger, R.B. (2003). Impact of Coexposure to Ozone on the Carcinogenic Potential of Inhaled Chromium. I. Effects on Retention and on Extra- and Intracellular Distribution, J. Toxicol. Environ. Health Part A. 66:39-55.
Dennis, J.H., French, M.J., Hewitt, P.J., Mortazavi, S.B., and Redding, C.A.J. (1996). Reduction of Hexavalent Chromium Concentration in Fumes from Metal Cored Arc Welding by Addition of Reactive Metals, Ann. Occup. Hyg. 40:339-344.
Dennis, J.H., Mortazavi, S.B., French, M.J., Hewitt, P.J., and Redding, C.R. (1997). The Effects of Welding Parameters on Ultra-violet Light Emissions, Ozone and CrVI Formation in MIG Welding, Ann. Occup. Hyg. 41:95-104.
Dennis, J.H., French, M.J., Hewitt, P.J., Mortazavi, S.B., and Redding, C.A.J. (2002). Control of Exposure to Hexavalent Chromium and Ozone in Gas Metal Arc Welding of Stainless Steels by Use of a Secondary Shield Gas, Ann. Occup. Hyg. 46:43-48.
Ebrahimnia, M., Goodarzi, M., Nouri, M., and Sheikhi, M. (2009). Study of the Effect of Shielding Gas Composition on the Mechanical Weld Properties of Steel ST 37-2 in Gas Metal Arc Welding, Mater. Des. 30:3891-3895.
Elder, A., Gelein, R., Silva, V., Feikert, T., Opanashuk, L., Carter, J., Potter, R., Maynard, A., Ito, Y., Finkelstein, J., and Oberdörster, G. (2006). Translocation of Inhaled Ultrafine Manganese Oxide Particles to the Central Nervous System, Environ. Health Perspect. 114:1172-1178.
Fang, S.C., Cavallari, J.M., Eisen, E.A., Chen, J.C., Mittleman, M.A., and Christiani, D.C. (2009). Vascular Function, Inflammation, and Variations in Cardiac Autonomic Responses to Particulate Matter Among Welders, Am. J. Epidemiol. 169:848-856.
Flynn, M.R., and Susi, P. (2009). Neurological Risks Associated With Manganese Exposure From Welding Operations – a Literature Review, Int. J. Hyg. Environ. Health. 212:459-469.

91
Halatek, K., Sinczuk-Walczak, H., Szymczak, M., and Rydzynski, K. (2005). Neurological and Respiratory Symptoms in Shipyard Welders Exposed to Manganese, Int. J. Occup. Med. Environ. Health. 18:265-274.
Herzler, J., Manion, J.A., and Tsang, W. (1997). Single-Pulse Shock Tube Study of the Decomposition of Tetraethoxysilane and Related Compounds, J. Phys. Chem. A. 101:5500-5508.
Heung, W., Yun, M.J., Chang, D.P., and Green, P.G. (2007). Emissions of Cr(VI) from Arc Welding, J. Air & Waste Manage. Assoc. 57:252-260.
Hewett, P. (1995). The Particle Size Distribution, Density, and Specific Surface Area of Welding Fumes from SMAW and GMAW Mild and Stainless Steel Consumables, Am. Ind. Hyg. Assoc. J. 56:128-135. (a)
Hewett, P. (1995). Estimation of Regional Pulmonary Deposition and Exposure for Fumes from SMAW and GMAW Mild and Stainless Steel Consumables, Am. Ind. Hyg. Assoc. J. 56:136-142. (b)
Holmes, A.L., Wise, S.S., and Wise, J.P. (2008). Carcinogenicity of Hexavalent Chromium, Indian J. Med. Res. 128:353-372.
Hovde, C.A., and Raynor, P.C. (2007). Effects of Voltage and Wire Feed Speed on Welding Fume Characteristics, J. Occup. Environ. Hyg. 4:903-912.
IARC. (1990). Chromium, Nickel and Welding, IARC Monographs on the Evaluation of Carcinogenic Risk of Chemicals to Humans. 49.
Iida, K., Pierman, J., Tolaymat, T., Townsend, T., Wu, C.Y. (2003). Control of Chromated Copper Arsenate Wood Incineration Air Emissions and Ash Leaching Using Sorbent Technology, J. Environ. Eng. 130:184-192.
Jang, H.D., Chang, H., Suh, Y., Okuyama, K. (2006). Synthesis of SiO2 nanoparticles from sprayed droplets of tetraethylorthosilicate by the flame spray pyrolysis, Curr. Appl. Phys. 6S1:e110-e113.
Jeng, H.A., and Swanson, J. (2006). Toxicity of Metal Oxide Nanoparticles in Mammalian Cells, J. Environ. Sci. Health Part A. 41:2699-2711.
Jenkins, N.T., and Eagar, T.W. (2005). Chemical Analysis of Welding Fume Particles, Weld. J. 84:87s-93s.
Jenkins, N.T., Pierce, W.M.G., and Eagar, T.W. (2005). Particle Size Distribution of Gas Metal and Flux Cored Arc Welding Fumes, Weld. J. 84:156s-163s.
Karanasiou, A.A., Thomaidis, N.S., Eleftheriadis, K., Siskos, P.A. (2005). Comparative Study of Pretreatment Methods for the Determination of Metals in Atmospheric Aerosol by Electrothermal Atomic Absorption Spectrometry, Talanta. 65:1196-1202.

92
Kleinstreuer, C., Zhang, Z., and Li, Z. (2008). Modeling Airflow and Particle Transport/Deposition in Pulmonary Airways, Respir. Physiol. Neurobiol. 163:128-138.
Konarski, P., Iwanejko, I., and Ćwil, M. (2003). Core-Shell Morphology of Welding Fume Micro- and Nanoparticles, Vacuum. 70:385-389. (a)
Konarski, P., Iwanejko, I., and Mierzejewska, A. (2003). “SIMS Depth Profiling of Working Environment Nanoparticles, Appl. Surf. Sci. 203-204:757-761. (b)
Ku, J.C., and Eide, M. (1998). Hexavalent Chromium in the Workplace Atmosphere, OSHA ID-215, Salt Lake City, Utah, Occupational Safety and Health Administration.
Lee, M.H., Cho, K., Shah, A.P., and Biswas, P. (2005). Nanostructured Sorbents for Capture of Cadmium Species in Combustion Environments, Environ. Sci. Technol. 39:8481-8489.
Lee, S.R., and Wu, C.Y. (2005). Size Distribution Evolution of Fine Aerosols Due to Intercoagulation with Coarse Aerosols, Aerosol Sci. Technol. 39:358-370.
Lee, S.R., and Wu, C.Y. (2002). Study of Vanadium Emission Control in Combustion Systems by Thermodynamic Equilibrium Analyses, Adv. Environ. Res. 7:1-10.
Lidén, G., and Surakka, J. (2009). A Headset-Mounted Mini Sampler for Measuring Exposure to Welding Aerosol in the Breathing Zone, Ann. Occup. Hyg. 53:99-116.
Lillienberg, L., Zock, J.P., Kromhout, H., Plana, E., Jarvis, D., Torén, K., and Kogevinas, M. (2008). A Population-Based Study on Welding Exposures at Work and Respiratory Symptoms, Ann. Occup. Hyg. 52:107-115.
Liu, H.H., Wu, Y.C., and Chen, H.L. (2007). Production of Ozone and Reactive Oxygen Species After Welding, Arch. Environ. Contam. Toxicol. 53:513-518.
Loukzadeh, Z., Sharifian, S.A., Aminian, O., and Shojaoddiny-Ardekani, A. (2009). Pulmonary Effects of Spot Welding in Automobile Assembly, Occup. Med. 59:267-269.
Luo, J.C.J., Hsu, K.H., and Shen, W.S. (2009). Inflammatory Responses and Oxidative Stress from Metal Fume Exposure in Automobile Welders, J. Occup. Environ. Med. 51:95-103.
Maynard, A.D., Ito, Y., Arslan, I., Zimmer, A.T., Browning, N., Nicholls, A. (2004). Examining Elemental Surface Enrichment in Ultrafine Aerosol Particles Using Analytical Scanning Transmission Electron Microscopy, Aerosol Sci. Technol. 38:365-381.

93
McNeilly, J.D., Heal, M.R., Beverland, I.J., Howe, A., Gibson, M.D., Hibbs, L.R., MacNee, W., and Donaldson, K. (2004). Soluble Transition Metals Cause the Pro-Inflammatory Effects of Welding Fumes in Vitro, Toxicol. Appl. Pharmacol. 196:95-107.
Meeker, J.D., Susi, P., and Flynn, M.R. (2007). Manganese and Welding Fume Exposure and Control in Construction, J. Occup. Environ. Hyg. 4:943-951.
Minni, E., Gustafsson, T.E., Koponen, M., and Kalliomaki, P.L. (1984). A Study of the Chemical Structure of Particles in the Welding Fumes of Mild and Stainless Steel, J. Aerosol Sci. 15:57-68.
Mruczek, M.F., Konkol, P.J., Ferree, S., and Sierdzinski, M. (2008). Reducing Mn Fumes Through Electrode Development, Weld. J. 87:25-29.
NIOSH. (1994). Method 7604, Issue 2: Chromium, Hexavalent by Ion Chromatography, NIOSH Manual of Analytical Methods. 4th edition.
NIOSH. (2003). Method 7605, Issue 1: Chromium, Hexavalent by Ion Chromatography, NIOSH Manual of Analytical Methods. 4th edition.
OSHA. (2006). 29 CFR 1910-1026.
Owens, T.M., and Biswas, P. (1996). Vapor Phase Sorbent Precursors for Toxic Metal Emissions Control from Combustors, Ind. Eng. Chem. Res. 35:792-798. (a)
Owens, T.M., and Biswas, P. (1996). Reactions Between Vapor Phase Lead Compounds and In Situ Generated Silica Particles at Various Lead-Silicon Feed Ratios: Applications to Toxic Metal Capture in Combustors, J. Air & Waste Manage. Assoc. 46:530-538. (b)
Park, J., Yoo, C.I., Sim, C.S., Kim, J.W., Yi, Y., Shin, Y.C., Kim, D.H., and Kim, Y. (2006). A Retrospective Cohort Study of Parkinson’s Disease in Korean Shipbuilders, NeuroToxicology. 27:445-449. (a)
Park, R.M., Bowler, R.M., Eggerth, D.E., Diamond, E., Spencer, K.J., Smith, D., and Gwiazda, R. (2006). Issues in Neurological Risk Assessment for Occupational Exposures: the Bay Bridge Welders, NeuroToxicology. 27:373-384. (b)
Pascal, L.E., and Tessier, D.M. (2004). Cytotoxicity of Chromium and Manganese to Lung Epithelial Cells in Vitro, Toxicol. Lett. 147:143-151.
Phadungsukanan, W., Shekar, S., Shirley, R., Sander, M., West, R.H., and Kraft, M. (2009). First-Principles Thermochemistry for Silicon Species in the Decomposition of Tetraethoxysilane, J. Phys. Chem. A. 113:9041-9049.

94
Pires, I., Quintino, L., and Miranda, R.M. (2007). Analysis of the Influence of Shielding Gas Mixtures on the Gas Metal Arc Welding Metal Transfer Modes and Fume Formation Rate, Mater. Des. 28:1623-1631.
Quimby, B.J., and Ulrich, G.D. (1999). Fume Rormation Rates in Gas Metal Arc Welding, Weld. J. 78:142s-149s.
Reuzel, P.G.J., Bruijntjes, J.P., Feron, V.J., and Woutersen, R.A. (1991). Subchronic Inhalation Toxicity of Amorphous Silicas and Quartz Dust in Rats, Fd. Chem. Toxic. 29:341-354.
Roelofs, F., Vogelsberger, W. (2004). Dissolution Kinetics of Synthetic Amorphous Silica in Biological-Like Media and Its Theoretical Description, J. Phys. Chem. B. 108:11308-11316.
Schaller, K.H., Csanady, G., Filser, J., Jüngert, B., and Drexler, H. (2007). Elimination Kinetics of Metals After an Accidental Exposure to Welding Fumes, Int. Arch. Occup. Environ. Health. 80:635-641.
Seel, E.A., Zaebst, D.D., Hein, M.J., Liu, J., Nowlin, S.J., and Chen, P. (2007). Inter-Rater Agreement for a Retrospective Exposure Assessment of Asbestos, Chromium, Nickel, and Welding Fumes in a Study of Lung Cancer and Ionizing Radiation, Ann. Occup. Hyg. 51:601-610.
Serageldin, M., and Reeves, D.W. (2009). Development of Welding Emission Factors for Cr and Cr(VI) with a Confidence Level, J. Air & Waste Manage. Assoc. 59:619-626.
Simpson, S.W. (2009). Metal Transfer Instability in Gas Metal Arc Welding, Sci. Technol. Weld. Joining. 14:262-273.
Smargiassi, A., Baldwin, M., Savard, S., Kennedy, G., Mergler, D., and Zayed, J. (2000). Assessment of Exposure to Manganese in Welding Operations During the Assembly of Heavy Excavation Machinery Accessories, J. Occup. Environ. Hyg. 15:746-750.
Soderstrom, E.J., and Mendez, P.F. (2008). Metal Transfer During GMAW with Thin Electrodes and Ar-CO2 Shielding Gas Mixtures, Weld. J. 87:124s-133s.
Stampfer, M.J. (2009). Welding Occupations and Mortality from Parkinson’s Disease and Other Neurodegenerative Disease Among United States Men, 1985-1999, J. Occup. Environ. Hyg. 6:267-272.
Stephenson, D., Seshadri, G., and Veranth, J.M. (2003). Workplace Exposure to Submicron Particle Mass and Number Concentrations from Manual Arc Welding of Carbon Steel, Am. Ind. Hyg. Assoc. J. 64:516-521.

95
Taylor, M.D., Roberts, J.R., Leonard, S.S., Shi, X., and Antonini, J.M. (2003). Effects of Welding Fumes of Differing Composition and Solubility on Free Radical Production and Acute Lung Injury and Inflammation in Rats, Toxicol. Sci. 75:181-191.
Wu, C.Y., and Barton, T. (2001). A Thermodynamic Equilibrium Analysis to Determine the Potential Sorbent Materials for the Control of Arsenic Emissions from Combustion Sources, Environ. Eng. Sci. 18:177-190.
Yu, I.J., Kim, K.J., Chang, H.K., Song, K.S., Han, K.T., Han, J.H., Maeng, S.H., Chung, Y.H., Park, S.H., Chung, K.H., Han, J.S., and Chung, H.K. (2000). Pattern of Deposition of Stainless Steel Welding Fume Particles Inhaled into the Respiratory systems of Sprague-Dawley Rats Exposed to a Novel Welding Fume Generating System, Toxicol. Lett. 116:103-111.
Yuan, H., He, S., He, M., Niu, Q., Wang, L., and Wang, S. (2006). A comprehensive Study on Neurobehavior, Neurotransmitters and Lymphocyte Subsets Alteration of Chinese Manganese Welding Workers, Life Sci. 78:1324-1328.
Zimmer, A.T., Baron, P.A., and Biswas, P. (2002). The Influence of Operating Parameters on Number-Weighted Aerosol Size Distribution Generated from a Gas Metal Arc Welding Process, J. Aerosol Sci. 33:519-531.
Zimmer, A.T., and Biswas, P. (2001). Characterization of the Aerosols Resulting from Arc Welding Processes, J. Aerosol Sci. 32:993-1008.

96
BIOGRAPHICAL SKETCH
Nathan Topham was born in Boston, Massachusetts in 1985. He moved to
Orlando, Florida at 5 years of age. Nathan attended high school at Lake Brantley High
School in Altamonte Springs. He began attending the University of Florida (UF) in 2003.
He performed research in aerosol sampling techniques as an undergraduate student.
He earned his bachelor’s degree in environmental engineering sciences from the
University of Florida in the fall of 2008. Nathan was admitted to graduate school the
following semester at UF to pursue a Master of Engineering degree in environmental
engineering sciences.