Embed Size (px)
Citation preview

UNIVERSITAS INDONESIA
CONTRIBUTIONS OF SUB TARGET AND CONFINEMENT EFFECTS IN EXTENSION OF LASER INDUCED SHOCK WAVE PLASMA SPECTROSCOPY
TO NON-METALLIC TARGETS
D I S E R T A S I
untuk memperoleh gelar Doktor dalam ilmu Opto-Elektroteknika dan Aplikasi Laser yang dipertahankan di hadapan Sidang Senat Terbuka Senat Akademik
Universitas Indonesia di bawah pimpinan Rektor Universitas Indonesia dr. Usman Chatib Warsa, Sp.MK., Ph.D.
pada hari Rabu, tanggal 25 September 2002, pukul 10.00 WIB
RINDA HEDWIG
Program Pascasarjana Opto-Elektroteknika dan Aplikasi Laser Fakultas Teknik
2002

Promotor:
Prof. Tjia May On, Ph.D. Guru Besar pada Jurusan Fisika
Fakultas Matematika dan Ilmu Pengetahuan Alam Institut Teknologi Bandung
Guru Besar Luar Biasa pada Program Pascasarjana Opto-Elektroteknika dan Aplikasi Laser,
Fakultas Teknik, Universitas Indonesia
Ko-Promotor:
Prof. Kiichiro Kagawa, Dr.Eng.Sc. Department of Physics, Faculty of Education and Regional Studies,
Fukui University, Japan
Ko-Promotor:
Dr. Hendrik Kurniawan Program Pascasarjana Opto-Elektroteknika dan Aplikasi Laser,
Fakultas Teknik, Universitas Indonesia

Panitia Penguji:
1. Prof. Muhammad Barmawi, Ph.D.
2. Prof. Dr. Rustam Effendi Siregar
3. Prof. Dr. Andrianto Handojo
4. Prof. Dr. Sardy S.
5. Dr. Muhammad Hikam

i
ABSTRACT
An comprehensive study has been carried out for the study and extension of laser
induced shock wave plasma spectroscopy (LISPS) application to non metallic soft and
hard samples. For this purpose, a series of experiments were conducted to investigate
the dynamical process taking place in the laser plasma generated by a high power and
short pulse laser irradiations on a non metal soft and hard samples. It was found that
in the case of non metal soft sample, the ablated atoms failed to induce a visible
plasma at the surface of the target due to the gushing speed of the atom is very low.
With the support of a sub target however, it became possible, after a few laser shots
depending on the target layer thickness, to generate the shock wave plasma emitting
the characteristic spectral lines of the target material.
Another related phenomenon studied in this experiment is the pre-irradiation
effect observed on a non metal hard sample such as quartz sample, which was
characterized by the absence of secondary plasma at the initial shots. The
disappearance of this effect at a later stage was found to be connected with the
appearance of a crater of appropriate depth on the sample surface created by initial
repeated irradiations on the sample surface. The plasma produced thereafter exhibited
typical features of a secondary plasma. Further experiment employing artificial ring
crater on the sample surface has eliminated the pre-irradiation effect completely, and
has thus demonstrated that it is the confinement effect of the crater which was solely
responsible for the generation of secondary plasma from the non metal hard target.
This conclusion is in conformation with the shock wave model proposed earlier.
These experimental studies have thus considerably substantia ted our
understanding of the process of secondary plasma generation. In turn, this result helps
to improve the quality and extend the scope of LISPS applications in the future.
Keywords:
laser-induced shock wave plasma, soft sample, sub target effect, spectrochemical
analysis, confinement effect

ii
ACKNOWLEDGEMENT
Glory to the Lord. I would like to express my endless thanks to:
??Prof. Tjia May On, Ph.D. for giving me the creative leeway to present
Contributions of Sub Target and Confinement Effects in Extension of Laser
Induced Shock Wave Plasma Spectroscopy to Non Metallic Targets’ information
in a way that’s accessible, informal, and as human as a discussion between
researchers. Through his support and guidance, I have a thesis that retains a focus
on the information that really needed to know to make working in experiment a
challenging experience. We tried all this together, and it’s nothing short of
privilege to continue to work with him.
??Prof. Kiichiro Kagawa, Dr.Eng.Sc. for his encouragement was deeply felt by me
and it was a learning process for me. I’ve known him since 1997, and I am so
thankful for his guidance during his stay in Jakarta and the chance to finally work
with him in Fukui University, Japan.
??Dr. Hendrik Kurniawan who is giving me the fond of research experiences. For
his guidance and chance to work in Applied Spectroscopy Laboratory, I then can
fulfill my duty to “Tri Darma Perguruan Tinggi”. His friendship and professional
sensitivity means more than words can say in an acknowledgement section of a
thesis.
??The excellent member of referees who gave critical comments on this thesis. Their
feedback was a great benefit to me.
??Ir. Th. Widia S., MM., Ph.D., Rector of Bina Nusantara University, for giving
me a chance to continue my study. I hope I can make her proud, and I appreciate
her encouragement and management support.
??My family for bearing with me during my study. They accepted the reduction in
our time together as well as taking some of the tasks that I no longer had time for.
??Special thanks go to Cane for running innumerable errands and applying
encouragement when needed. Spading together with him for the many hours of
critical scrutiny he devoted to reading and giving ideas to this thesis.
??All my fellow colleagues, especially Marincan P., Hery S., Mangasi A.M.,
M.M. Suliyanti, Wahyu S.B., and Emon S. who pass on their knowledge about

iii
spectroscopy. It was the knowledge I gained from these resources that made this
thesis possible.
??The same thankful also goes to all my colleagues in Bina Nusantara University,
especially those who work in Hardware Laboratory. Their cooperative works did
support some of my tasks that I had no chance to finish.
??Last but not least, I apologize to all those who helped that I did not acknowledge
specifically. I believe there were many appreciate your assistance.
Part of this work was supported by Research Team Grant and Grant-in-Aid
from Indonesia’s Ministry of Education and Culture through the University Research
for Graduate Education Program. Also some of this work was supported by CRETE
FUKUI of JST (Japan Science and Technology Corporation). I wish to dedicate this
thesis to my country, especially in the field of science and technology.

iv
LIST OF CONTENTS Abstract ……………………………………………………………………………..
Acknowledgement ………………………………………………………………….
List of Contents …………………………………………………………………….
List of Figures ………………………………………………………………………
List of Tables ……………………………………………………………………….
List of Abbreviations ……………………………………………………………….
I. General Introduction …...………………………………………………………
II. Role of Lasers in Spectrochemical Analysis …..…………………...……….....
II.1. Spectrochemical Applications of Laser Ablation Technique ……………
II.2. Laser Ablation Emission Spectrochemical Analysis (LAESA) …………
II.3. Laser-Induced Shock-Wave Plasma Spectroscopy (LISPS) …..….....…..
II.3. The Limitation of LISPS Method ………………….………………....…
III. Sub Target Effect on TEA CO2 Laser Induced Plasma from Soft Sample ……..
III.1. The Role of a Sub Target in Laser Plasma Generated at Low
Pressure ……………………………………………………………….…
III.1.1. Introduction …………………………………………………….
III.1.2. Plasma Generation at Low Pressure Surrounding Air …………
III.1.3. Results and Discussion …………………………………………
III.1.4. Conclusion ……………………………………………………..
III.2. Sub Target Effect on Laser Plasma Generated at Atmospheric
Pressure ………………………………….………………………………
III.2.1. Introduction …………………………………………………….
III.2.2. Plasma Generation in Surrounding He at Atmospheric Pressure
III.2.3. Results and Discussion …………………………………………
III.2.4. Conclusion ……………………………………………………..
IV. Confinement Effect in Quartz Sample …....…………………………………...
IV.1. Confinement Effect in Enhancing Shock Wave Plasma Generation at
Low Pressure by TEA CO2 Laser Bombardment on Quartz Sample ……
IV.1.1. Introduction …………………………………………………….
IV.1.2. Experimental Procedure ………………………………………..
IV.1.3. Results and Discussion …………………………………………
IV.1.4. Conclusion ……………………………………………………..
i
ii
iv
vi
ix
x
1
5
5
8
9
10
12
12
12
12
14
20
21
21
21
22
26
28
28
28
29
31
41
v
IV.2. Confinement Effect of Primary Plasma on Glass Sample Induced by
Irradiation of Nd-YAG Laser at Low Pressure ………………………….
IV.2.1. Introduction …………………………………………………….
IV.2.2. Experimental Procedure ………………………………………..
IV.2.3. Results and Discussion …………………………………………
IV.2.4. Conclusion ……………………………………………………..
V. General Conclusion ……........…………………………………………………
References ………………………………………………………………………….
List of Scientific Publication ……………………………………………………….
Curriculum Vitae …………………………………………………………………...
42
42
42
44
49
50
52
55
57

vi
LIST OF FIGURES Fig 3.1. A series of silicon grease plasma photographs for (a) the initial application of laser radiation to the sample, (b), (c) and (d) the application of laser radiation for the second, third and fourth times to the sample surface at a fixed position ………………………………………………………………. Fig 3.2. Spectrum of the silicon grease plasma in the UV region (a) when the laser radiation has not reached the sub target and (b) when the laser radiation reaches the sub target ……………………………………………… Fig 3.3. The relationship between the velocity of the Si I 298.7 nm, Zn I 481.0 nm and incandescent emission light as a function of plasma position ... Fig 3.4. Incandescent light’s time profile as the function of position ……….. Fig 3.5. The relationship between the time and the distance of the rising point of emission of Si I 298.7 nm and Zn I 481.0 nm in log-log plot ….…... Fig 3.6. Diagram of experimental setup for this experiment ………………... Fig 3.7. Time and spatially integrated emission intensity of Si I 288.1 nm and He I 587.5 nm as a function of the number of laser shots at a fixed position. Data were taken in surrounding helium gas of 1 atm ……………… Fig 3.8. Time profiles of the emission intensity of Si I 288.1 nm and He I 587.5 nm observed at 1.3 mm in helium at 1 atm …………………………… Fig 3.9. Relationship between the propagation length of the secondary plasma front and helium atoms as the function of time ……………………... Fig 3.10. Emission spectra of a silicon grease sample containing calcium at low concentrations, taken in surrounding helium gas of 1 atm ……………… Fig 4.1. Diagram of experimental setup ……………………...……………… Fig 4.2. A plasma picture taken by irradiating a quartz sample using a TEA CO2 laser of 550 mJ energy (a) at the first irradiation, only the primary plasma can be seen in this picture and (b) after 25th repeated irradiations in which the secondary plasma could clearly observable ………………………. Fig 4.3. The relationship between the occurrence of emission intensity of primary plasma and secondary plasma as a function of laser shot number on quartz sample. The TEA CO2 laser energy was set at 550 mJ and using an air at 2 Torr as a surrounding gas ………………………………………...…..
15
16
17
18
18
21
23
24
25
26
29
31
32

vii
Fig 4.4. The relationship between the occurrence of emission intensity of primary plasma and secondary plasma as a function of laser shot number on quartz sample. An aluminum mask with a diameter of 1 mm and thickness of 1 mm was put in front of the quartz sample. The TEA CO2 laser energy was set at 550 mJ and using an air at 2 Torr as a surrounding gas ……………….. Fig 4.5. The relationship between the secondary plasma emission intensity and laser shot number for different mask thickness. The TEA CO2 laser energy was set at 550 mJ and using an air at 2 Torr as a surrounding gas …... Fig 4.6. Time evolution of the primary plasma emission intensity at the initial shot and after 25th repeated shots without using an aluminum mask. The TEA CO2 laser energy was set at 550 mJ and was focused onto quartz sample at surrounding air pressure of 2 Torr ………………………………... Fig 4.7. The emission spectra of the primary plasma taken with the use of OMA system using time-integrated mode when 550 mJ pulse of TEA CO2 laser was focused at a fixed point on quartz surface. Part (a) in this figure is the result of accumulating spectra of the first 10 shots, namely during the pre-irradiation stage. Part (b) is the result of accumulating spectra of the next 10 shots, namely after the appearance of the secondary plasma, while part (c) is obtained from the following 40 shots ………………………………….. Fig 4.8. The relationship between plasma emission intensity (Si I 288.1 nm) as a function of shot number under different air pressures. The TEA CO2 laser energy was set at 550 mJ and was focused onto quartz sample ……….. Fig 4.9. The relationship between the secondary plasma emission intensity and laser shot number for different gas kind. The TEA CO2 laser energy was set at 550 mJ and using helium, nitrogen and argon at 14 Torr, 2 Torr and 1.4 Torr, respectively ………………………………………………………... Fig 4.10. Diagram of the experimental setup ………………………………... Fig 4.11. Emission spectra taken after several laser shot irradiation at a fixed position of the glass sample; 2 shots, 4 shots, 6 shots and 8 shots. Each spectrum was taken upon single shot irradiation after the pre-irradiation. The laser irradiation was performed using a pulse energy of 28 mJ in the surrounding air pressure of 2 Torr …………………………………………… Fig 4.12. Relationship between the time-integrated emission intensity of the primary plasma and the laser shot number at different laser energies, A for 20 mJ, B for 28 mJ, C for 48 mJ and D. Curve D was obtained in the experiment where the pre-irradiation was caused with 10 shots using 48 mJ pulse energy and after sufficient cooling time the irradiation was resumed at the same position with the same pulse energy of 28 mJ in the surrounding air pressure of 2 Torr ………………………………………...…………………..
33
34
35
38
39
40
43
44
45

viii
Fig 4.13. Relationship between the total emission intensity of the secondary plasma (Si I 288.1 nm) and the laser shot number at different laser energies. These data were obtained simultaneously with those in Fig 4.12, and notations A, B, C and D have the same meaning as in Fig. 4.12. The data taken in surrounding air pressure at 2 Torr …………………….…………….
46

ix
LIST OF TABLES 2-1 A sample of commonly used techniques ………………………………….... 2-2. Laser induced plasmas: semantical variations on the theme ………………. 2-3. Target materials and selected applications of laser induced plasma spectroscopy ……………………………………………………………………..
6
6
7

x
LIST OF ABBREVIATIONS
LAESA : Laser Ablation Emission Spectrochemical Analysis
LISPS : Laser Induced Shock Wave Spectroscopy
LIBS : Laser Induced Breakdown Spectroscopy
AAS : Atomic Absorption Spectrometry
AFS : Atomic Fluorescence Spectrometry
ICP : Inductively Coupled Plasma
TEA : Transversely Excited Atmospheric
FWHM : Full Width Half Maximum
OMA : Optical Multichannel Analyzer
EPMA : Electron Probe Micro Analysis
UV : Ultra Violet
Nd-YAG : Neodymium Yttrium Aluminum Garnet

1
Chapter One
GENERAL INTRODUCTION
Spectrochemical methods of analysis are among the most widely used analytical
methods. The application of spectrochemical methods ranges from qualitative analysis
to the determination of quantitative composition of materials as well as detection of
trace elements of great importance. As a result, they have been widely used for
process control and product quality assessment as well as environmental monitoring.
The most popular among the existing technique are Atomic Absorption Spectrometry
(AAS), Atomic Fluorescence Spectrometry (AFS), and Atomic Emission
Spectrometry. Each method has its advantages and disadvantages. For instance, AAS
method which has become the most widely used single-element technique for the
determination of metals, operates on the basis of absorption spectra from the neutral,
ground-state atoms produced by an atomizer.1) AAS has been used to determine
metals and some nonmetals in almost every conceivable type of samples. Many
standard procedures for water analysis are based on AAS, except for water samples
with a high salt content; the analysis is usually straightforward. The use of AAS in the
metallurgical and mining industries is common for analysis of metals, alloys,
geochemical samples and electroplating solutions. However, this method requires
tedious sample preparation procedure. Analysis of petroleum products for example,
presents special sample preparation difficulties. For biological and clinical samples, it
is critical to remove the organic matrix by digestion or some other method before
analysis.
The AFS method which is a sensitive and powerful technique for detecting
molecules and atoms, boasts the often cited advantages of low detection limit, large
linear dynamic ranges, multi-element capabilities, simplicity, and freedom from
spectral interferences. Its overall detection limit are not generally better and often
worse than those reported for AAS except for few elements. In terms of dynamic
range and multi-element capability, atomic fluorescence spectrometry is superior to
AAS, but comparable to AES. Nondispersive AFS systems based on conventional
excitation sources can be relatively simple and inexpensive.1)
The AES method has great potential as a qualitative and quantitative tool since all
elements can be made to emit characteristic spectra under the appropriate conditions.

2
Lockyer stated in 1874 that while the qualitative spectrum analysis depends on the
position of the lines, the quantitative analysis depends on their length, brightness,
thickness and number.2) The spark discharges were first used to obtain spectra from
solution and various spark sources were developed with static electrical sources. It has
now become common to use high-voltage, low-current oscillatory discharge with
voltages of 10,000–50,000 V. The arc gave very intense and therefore sensitive
spectra, but the reproducibility was poor. The electronic temperature was in the order
of 6000–8000 K, and under these conditions metal electrodes melted and vaporized
directly. This was an advantage because many metals and alloys can be analyzed
directly, avoiding any pretreatment which may introduce errors. The advantage of
using AES is mainly its direct applicability to elemental detection using simple
equipment compared to any other method.
In the mean time, the advent of lasers has greatly expanded the field of
spectroscopy in many areas since tunable lasers have now been obtained at
wavelengths covering the range from far-infrared to ultra-violet region. The use of
laser sources are making it possible to obtain information that was difficult or
impossible to obtain with conventional sources.3)
The method of laser atomic emission spectrochemical analysis (LAESA) was first
introduced by Brech4) in 1962. Its potential as a sensitive and convenient tool for
microanalysis was henceforth quickly recognized. Thanks to the continued
improvement in its detection sensitivity and sample applicability in addition to the
advantage of rapid analysis without the need of sample pretreatment, this method has
gained growing acceptance in wide ranging field of spectrochemical applications.
This technique has many advantages compared to other analytical methods which
exhibits several attractive features such as the ablated matter is sufficiently atomized
to permit analysis by auxiliary methods requiring material in the atomic state, thus
eliminating the time-consuming steps which involved in sample preparation.
Moreover, the laser pulse can ablate material for in situ analysis and microanalysis
can be obtained due to the small size of the laser spot at its focal. Also, laser ablation
minimize the amount of sample used in the analysis3) and reduced surface damaged
caused by laser bombardment.
Nevertheless the more conventional LAESA method suffers from some
drawbacks, in particular the intrinsically large background which can only be partially
overcome by the use of expensive detecting system. This background of emission is

3
very strong due to high density and high temperature plasma which made the S/B
ratio relatively low, and detection limit becomes low sensitivity. Besides, self-
absorption of the emission line takes place to a remarkable extent due to the
generation of large temperature difference between the inside and outside of the
plasma, which brings about the non-linear calibration curve.3) In addition to this, in
LAESA method some problems were also observed when analysis is done for non
metal soft sample or applied to non metal hard sample.
In a later development, an alternative method was initiated in the studies of
plasma emission induced by a high power and short pulse laser on a target surrounded
by air at reduced pressures.5-12) It was found that the laser plasma produced invariably
consists of two distinct parts. The first part occupies a small region of high
temperature (the primary plasma), which gives rise to an intense and continuous
emission for a short time, right above the surface of the target. The second part (the
secondary plasma) expands with time around the primary plasma, emitting sharp
atomic spectral lines. These characteristics of the secondary plasma has led to its
special advantages for highly sensitive spectrochemical analysis. Among these
favorable characteristics are, the low background emission spectrum; the good
linearity between the emission intensity and the content of the element most
remarkable. The symmetrical hemispherical shape which leads to high precision
analysis and high excitation temperature brings to high sensitive analysis are also
advantages.
By means of time-resolved measurements in our experiments using a TEA CO2
laser7) and an excimer laser,6) we were able to demonstrate that this secondary plasma
was induced by a shock wave generated in the surrounding gas, while the primary
plasma acted as a source of explosion energy. It was further shown that the atomic
emission in the plasma was also the result of thermal excitation made possible by the
shock wave which proved by density jump experiment.13) We refer to this method as
laser-induced shock wave plasma spectroscopy (LISPS). There are two obvious
practical applications of LISPS; one is its application to the rapid inspection of
industrial products, such as steel6) and glass samples,8) and the other is the application
to the field-based spectrochemical analysis of mining or geological samples.
It has been recognized generally that the characteristics of a laser plasma depend
on a number of factors involved in the process. Three of these factors are assumed to
be most important. One is the surrounding gas conditions such as the kind of gas and

4
its pressure. Another is the characteristics of the laser light itself such as the
wavelength, pulse energy, pulse width and the power density. In addition to this, it
also has been noticed in the case of LISPS, that hardness of the target also influences
considerably the plasma characteristics. In fact, the generation of all secondary
plasmas reported previously were observed on solid metallic targets.6,7) In order to
examine the applicability of LISPS to non metallic samples, the possibility of
generating secondary plasmas from such targets must be investigated.
In this study, two types of non metallic targets are used. One consists of non-
metallic soft targets, and the other consists of non metallic hard target. In addition to
the purpose of extending the application of LISPS to non-metallic samples, these
experimental works are also aimed at examining the validity of the laser induced
shock wave model which has been established for secondary plasma generated from
metallic targets. It will be shown that in the case of unsupported soft target, the
secondary plasma simply fails to show up, while the use of target immediately
restores the condition for normal formation of the secondary plasma. In the case of
hard target, the formation of secondary plasma is preceded by a pre-irradiation effect
in the few initial laser shots, which may lead to intolerable damage to the sample
surface in some specific applications. It will be shown in this study that this problem
too can be properly overcome by the use of artificial crater.

5
Chapter Two
ROLE OF LASERS IN SPECTROCHEMICAL ANALYSIS
2.1. Spectrochemical Applications of Laser Ablation Technique
When a high irradiance (of the order of GW cm-2) laser beam reaches a solid
target, an explosion occurs and a plasma is formed (laser spark). The mechanism of
interaction has been well studied but remains less than completely clear. The name
‘laser ablation’ is generally used, and preferred to laser explosion, although the term
‘laser-material interaction’ would seem more appropriate since it does not imply a
mechanism.14) The plasma formed can be investigated by monitoring, in a time
resolved manner by its spectral emission behavior or by evaluating several of its
parameters, at variable delay times, with another laser tuned at a given atomic
transition energy and measuring the resulting absorption, fluorescence or ionization
signal. On the other hand, the material removed from the target can be transported
into practically every other analytical source (flames, graphite furnaces, glow
discharge and especially ICPs) for subsequent absorption, emission or ionization
measurements. In the later case, the laser is only used for sampling. Laser sampling
has the obvious important advantage that it offers direct sampling from any material
and without sample preparation. The physical mechanisms and associated methods of
technical implementation for spectrochemical applications are listed and described in
table 2-1.
The analytical use of the plasma formed by high intensity laser bombardment on
a target has been well known since the early 1960s.15) There are several reasons why
the interest in this well known laser method has been revived and is currently
enjoying so much success. We can see the number of acronyms used for it, collected
in table 2-2, as well as the variety of target materials and applications collected in
table 2-3. The increasing need to incorporate more on-line control devices in
industrial processes has undoubtedly acted as trigger, but probably the major reasons
have to be found in the technological development of good, intensified CCD detectors
together with the capability of handling a large amount data, and the availability of
compact, cheap and reliable Nd:YAG lasers. The simultaneous multi-element
potential, coupled with the rapidity of analysis, is retained here and the sensitivity is

6
adequate for many applications as indicated at table 2-3. When the technique is used
for quantitative microanalysis, matrix effects are considered to be the major
drawback, although normalizing parameters such as vaporized mass and the plasma
excitation temperature allows for an efficient correction of such effects.
Table 2-1 A sample of commonly used techniques.
Absorption Emission Fluorescence Ionization Ablation
Use lasers as primary sources for atomic and molecular absorption measurements. Absorbing species are generally located outside the laser cavity, but can also be present inside (intracavity absorption)
Use lasers tightly focused on a solid, liquid or gaseous sample to create plasma from which atomic and ionic emission of the target constituents is measured
Use lasers as excitation sources to pump atoms into selected excited states from which radiative de-excitation is measured. Atoms are generated independently outside the laser cavity, but can also be present inside (intracavity fluorescence)
Use lasers to pump atoms in highly excited levels from which collisional ionization occurs or to photoionize selectively the atoms (resonance ionization). The charges produced are introduced into a time-of-flight mass spectrometry
Use lasers as a sampling device to generate atoms, molecules and particles from a target sample, which are transported into an excitation source, e.g., a plasma
Table 2-2. Laser induced plasmas: semantical variations on the theme.
LAAS
LIBS
TRELIBS
FOLIBS
LIESA
LAESA
LIPS
LISPS
LA-OES
LALM
RSP
Laser spark spectroscopy
Laser induced breakdown spectroscopy
Time resolved LIBS
Fiber optics LIBS
Laser induced emission spectral analysis
Laser ablation emission spectrochemical analysis
Laser induced plasma spectroscopy
Laser induced shock wave plasma spectroscopy
Laser ablation-optical emission spectroscopy
Laser ablation in a liquid medium
Repetitive spark pair
Some of these techniques are characterized by extremely high detection sensitivity for
selected elements, while others can be used for real time, simultaneous monitoring of

7
many elements in different samples of environmental interest. Referring to the
ionization technique, for instance, it has been repeatedly stressed theoretically and
demonstrated experimentally that it possesses several unique characteristics such as
single atom or single molecule detection limit, spectral resolution limited only by the
homogeneous linewidth, temporal resolution below picosecond, spatial resolution of
the order of the De Broglie wavelength of the electron or ion, selectivity which can
reach 1 X 10²⁰ and finally applicability to any atom or molecule. Single ion
absorption and fluorescence are also possible from the theoretical point of view.
Table 2-3. Target materials and selected applications of laser induced plasma spectroscopy.
Electronic substrates Nuclear materials Glasses – ceramics Polymer materials Marble cleaning – art conservation Chemical imaging – element mapping Microanalysis of alloys – depth profiling Particulate in combustion environments Trace pollutants in soil, sand, sewage Metal aerosol emission Particle detection and counting Atomization of solid targets in a liquid medium
Despite these impressive characteristics, it is known that the large majority of
laser systems used are complex to operate and expensive to acquire. The many
statements made, both in the literature and in specific round table discussions held at
scientific meetings, that the use of lasers in routine analytical applications will always
be limited to few selected applications were more or less justified. Consequently, it
appeared that laser methods could be eliminated as viable contenders for near-term
routine atomic spectrometric measurements.15) However, this picture has changed
dramatically thanks to a series of remarkable advances achieved in the near future due
to commercial development of tunable solid-state laser, as well as other developments
which will be described in the latest part of this chapter.
In the following sections, we will start our discussion on laser ablation emission
spectrochemical analysis (LAESA), and proceed with more recent developments in
the field including especially the one applied at low pressure surrounding gas, where
during its application we found phenomenon which will be clarified in this thesis.

8
2.2. Laser Ablation Emission Spectrochemical Analysis (LAESA)
LAESA is a typical application for high power pulse lasers. This technique has
many latent advantages over other analytical methods which exhibits several
attractive features, especially compared to ordinary AES method. First, in many cases,
the ablated matter is sufficiently atomized to permit analysis by auxiliary methods
requiring material in the atomic state, thus eliminating the time-consuming steps
sometimes involved in sample preparation. Second, the laser pulse can ablate material
for analysis at a remote location. Third, all types of material can be sampled with the
laser spark because ablation is accomplished by focused light energy and does not
rely on the electrical properties of the material, as does ablation via conventional
electrode sparks. Fourth, the small spot size of a focused laser pulse can provide a
spatially resolved microanalysis of a surface. Fifth, laser ablation minimize the
amount of sample used in the analysis. The last, many of the auxiliary techniques
have greater detection sensitivities, dynamic ranges, and freedom from matrix effects
than direct spectroscopic analysis of the laser plasma. Combining these techniques
with laser ablation permits use of these improved capacities together with the rapid
sampling provided by the laser spark.16) On the other hand, the disadvantages of this
method is that the background of this emission spectrum is very strong due to high
density and high temperature plasma, self-absorption of the emission line takes place
to a remarkable extent due to the generation of large temperature difference between
the inside and outside of the plasma, which brings about the non-linear calibration
curve.17) As the result, the LAESA method was mainly used only for qualitative
analysis or semi-quantitative analysis, and the research of LAESA had become
inactive since in the early of 1980s.
Nowadays good quality laser system such as YAG is commercially available
offering good shot to shot power stability and good beam quality which brings high
focusibility of the laser light. Also the development of optical multi-channel analyzer
(OMA) has contributed to the study of laser spectroscopy. Supported by these new
instruments, recently the study of LAESA has become revival because the LAESA is
still attractive to spectrochemist as the rapid quantitative analytical method for solid
samples.
Roughly speaking, nowadays there are two main streams of development in this
study. The first adopts a high-pressure surrounding gas, which has been developed by

9
Radziemski and Cremer’s group and is usually called laser-induced breakdown
spectroscopy (LIBS).2,18) In this method high peak power with short duration laser
such as Nd:YAG laser was focused onto the sample at atmospheric pressure. In order
to remove the disturbing background spectrum coming from high temperature and
high density plasma, gated OMA was effectively incorporated in the detection system.
Another stream of development in LAESA is the use of low gas pressure and we refer
to this method as laser-induced shock-wave plasma spectroscopy (LISPS).5-11)
2.3. Laser-Induced Shock -Wave Plasma Spectroscopy (LISPS)
LAESA for low pressure surrounding gas17) is observed when laser plasma is
produced under reduced pressure aiming the deduction of the background emission
intensity in the spectrum. We have shown in our previous experiments that laser-
induced shock wave plasma is generated when a pulse laser such as N2 laser, TEA
CO2 laser, or excimer laser and YAG laser, is focused onto a solid target at a reduced
gas pressure of around 1 Torr.5-8) The laser plasma consists of two distinct region. The
first is a small area of high temperature plasma (the primary plasma), which gives off
an intense, continuous emission spectrum for a short time just above the surface of the
target. The second area (the secondary plasma) expands with time around the primary
plasma, emitting sharp atomic spectral line spectrum with negligibly low background
signals. Atoms in the secondary plasma are excited by the shock wave, while the
primary plasma acts as an initial explosion energy source. We have referred this
method as laser-induced shock wave plasma spectroscopy (LISPS).
We have also proved that the laser-induced shock wave plasma is excellent light
source for emission spectrochemical analysis. In ordinary atomic emission
spectrometry, such as arc discharge method and spark discharge method, atoms are
excited by means of an electric discharge. In general, in atomic emission spectrometry
the detection limit of the elements is mainly determined by the intensity of the
background emission, which arises from the process of electron-ion recombination or
the electron-ion bremsstrahlung.19) The lower the background emission intensity, the
lower the minimum determinable concentration of the elements. In contrast to this, in
plasma induced by the shock wave at low pressures, the background emission
intensity is expected to be considerably reduced, because in the shock wave plasma
the excitation of the atoms takes place by means of a purely thermal process, without

10
employing any electric fields, and the excitation process is substantially a non-
equilibrium process.
This secondary plasma has characteristics quite favorable to spectrochemical
analysis. Among these positive characteristics are, low background emission spectrum
and good linearity between the emission intensity and the content of the element are
representative. The symmetrical hemispherical shape which leads to high precision
analysis and high excitation temperature brings to high sensitive analysis are also
advantages. There are two obvious practical applications of LISPS; one is its
application to the rapid inspection of industrial products, such as steel and glass
samples, and the other is the application to the field-based spectrochemical analysis of
mining or geological samples.
It can be said that this LISPS method has substantially high prospect to compete
with ICP spectrometry when we use this LISPS method for inspection of
homogeneous samples of industrial products. In order to prove this practical
quantitative experiment should be made using polychromator in the near future.
At present EPMA (Electron Probe Micro Analysis) is widely used to make micro
analysis on the small minerals in rock samples. However, for this purpose the sample
surface must be polished flatly with high precision, and therefore it takes time for
pretreatment. In contrast to this in our method, rapid quantitative analysis can be
made with more high sensitivity because in our method required flatness is not so
sever and the required pressure condition can be easily obtained using air. Also in our
method compact requirement can be realized by combining small pulse laser with a
pulse energy of several mJ and OMA for spectrum detection system. Such compact
equipment can be easily moved by a car and quantitative analysis can be made in
outdoor. It is expected that our LISPS method will be used effectively in the field of
mining industry and geological science.
2.4. The Limitation of LISPS Method
Despite the remarkable progress described in the preceding action, demonstrating
viability of the LISPS technique for various high sensitivity spectrochemical
detection, this method remains restricted to metallic and certain hard targets (such as
ruby, ceramic and other hard oxide materials). In the case of light oxide materials
(such as glass and agate), this technique suffers from pre-irradiation effect, and

11
becomes inapplicable to even softer target such as silicone grease. These problems are
expected to have their origin in the effectiveness in the generation of shock wave
required for the formation of the secondary plasma.
This research is aimed at overcoming those limitation mentioned above. To this
end the condition of shock wave generation will be reexamined. A series of
experiments are performed for this study, and special techniques are devised to get
around the problems stated above in order to extend the applicability of the LISPS
technique. These experiments and the results obtained as well as the techniques
developed will described respectively in the following sections.
12
Chapter Three
SUB TARGET EFFECT ON TEA CO2 LASER INDUCED PLASMA FROM SOFT SAMPLE
3.1. The Role of a Sub Target in Laser Plasma Generated at Low Pressure
3.1.1 Introduction
The characteristics of a laser plasma depend on some factors involved in the
process. Three kinds of factors are assumed to be most important. One is surrounding
gas conditions, another is the characteristics of the laser light itself and in addition to
this, in the case of LISPS, hardness of the target also influences the pla sma
generation. In fact in LISPS using TEA CO2 laser, some problems were observed in
the case of a soft material, such as low melting point glass8) or biological samples,
where shock wave plasma could not be generated. We understood this phenomenon
by assuming that the soft target absorbs recoil energy and atoms gushing from the
primary plasma do not acquire sufficient speed to form a shock wave. If the process is
true, we can overcome this problem by setting the sub target on the back of the sample
so as to produce the repulsion force by which the gushing speed of the atoms is
increased. In order to prove this, the present study was undertaken using mainly
silicon grease as a sample.
3.1.2. Plasma Generation at Low Pressure Surrounding Air
A TEA CO2 laser (Lumonics, multigas laser, model HE-440B, set at 100 mJ,
FWHM 100 ns) was used in the present experiments. The actual pulse energy,
however, which was focused on the target was roughly 50 mJ. During this experiment
the laser was operated shot by shot, and the power fluctuations were determined to be
less than 5%.

13
The laser radiation was focused by a ZnSe lens (f = 100 mm) through a ZnSe
window onto the surface of the sample. The spot size of the focusing laser light on the
surface is about 100 ?m, and power density of the focusing laser light about 6
GW/cm2. The radiation of the laser plasma was observed at a right angle to the laser
beam with the use of an imaging quartz lens (f = 100 mm). The sample was placed in
a small, vacuum-tight metal chamber (75 mm X 75 mm X 75 mm), which could be
evacuated with a vacuum pump, and which was filled with the desired surrounding
gas. The chamber pressure was measured precisely with a digital Pirani gauge (Diavac
Ltd., model PT-1DA). Gas flow through the chamber was regulated by a needle valve
in the gas line and a valve in the pumping line. For all experiments, the air pressure
inside the vacuum was maintained at 1 Torr. The sample, together with the entire
chamber and focusing lens, could be moved in the y-direction relative to the laser
beam by means of a step motor and, in the x-direction via a micrometer screw. In
addition to the window for transmitting the laser radiation, two optical windows were
positioned around the laser plasma for visual and spectral observations. The windows
were sufficiently large to ensure that plasma light was not obstructed by the walls
when the position of the chamber was moved.
When no shock wave plasma was observed, the orange color incandescent
emission light was imaged 1:1 by the quartz lens (f = 100 mm) with an aperture of 7
mm X 7 mm onto the plane of the entrance of two optical fibers which centers were
separated by a distance of 6 mm. The exit of the fibers was then sent to each
photomultiplier (Hamamatsu IP28) and photocurrents from the photomultipliers were
then sent directly to different channels of a digital sampling storage scope (HP
54600B) after passing through a 500? resistance. The synchronization signal for the
digital sampling storage scope was regulated by the external trigger function of the
laser system. The velocity of the entities which induces incandescent emission was
measured by reading the time difference in the rising time of each emission signal by
varying the position of the combined fibers.
When the shock wave plasma was produced after the laser beam reached the sub
target, the plasma light was imaged 1:1 by the quartz lens with an aperture of 10 mm
X 10 mm on the plane of the entrance slit of a monochromator (Spex, model M-750,
Czerny Turner conFiguration, focal length 750 mm, grating 1200 grooves/mm blazed
at 500 nm). The output of the photomultiplier (Hamamatsu IP -28) was then fed to a

14
digital-sampling storage scope (HP 54610B, 500 MHz) after passing through a low -
impedance circuit.
When the emission spectra of the shock wave plasma and the incandescent light
of the gushing particles were taken, a gated intensified photo-diode-array (PDA,
Princeton IRY 700) was used and the synchronization signal was also regulated by the
external trigger function of the laser system.
The sample used in this experiment was high-vacuum silicon grease which was
painted on the sub target material issued in this experiment was mainly copper (Rare
metallic, 4N, thickness 0.2 mm).
3.1.3. Results and Discussion
Figure 3.1 shows a series of photographs when a TEA CO2 laser was irradiated
on the silicon grease painted on the copper sub target at a reduced air pressure of 1
Torr, (a) for the first irradiation, and (b), (c) and (d) for the second, third and fourth
irradiations at the same sample position. It can be seen in Figs. 3.1 (a) and 3.1 (b) that
the laser light had not yet reached the hard sub target and, as a result, only the
incandescent emission light can be seen. The orange-red color is supposed to be
associated with the heated particles coming from the grease sample. In Fig 3.1 (c), the
combination of the incandescent light and the bright laser plasma light can be seen. In
Fig 3.1 (d) a characteristic plasma shape is observed, which can be attributed to shock
wave plasma. The bright color is assumed to come from highly excited atoms. After
the laser light reached the sub target, two or three shots of laser irradiation were
effective in producing the shock wave plasma, and after that no plasma generation
took place even though laser irradiation was repeated. This means that the grease
layer at the focused point on the surface was completely removed by the laser
irradiation.
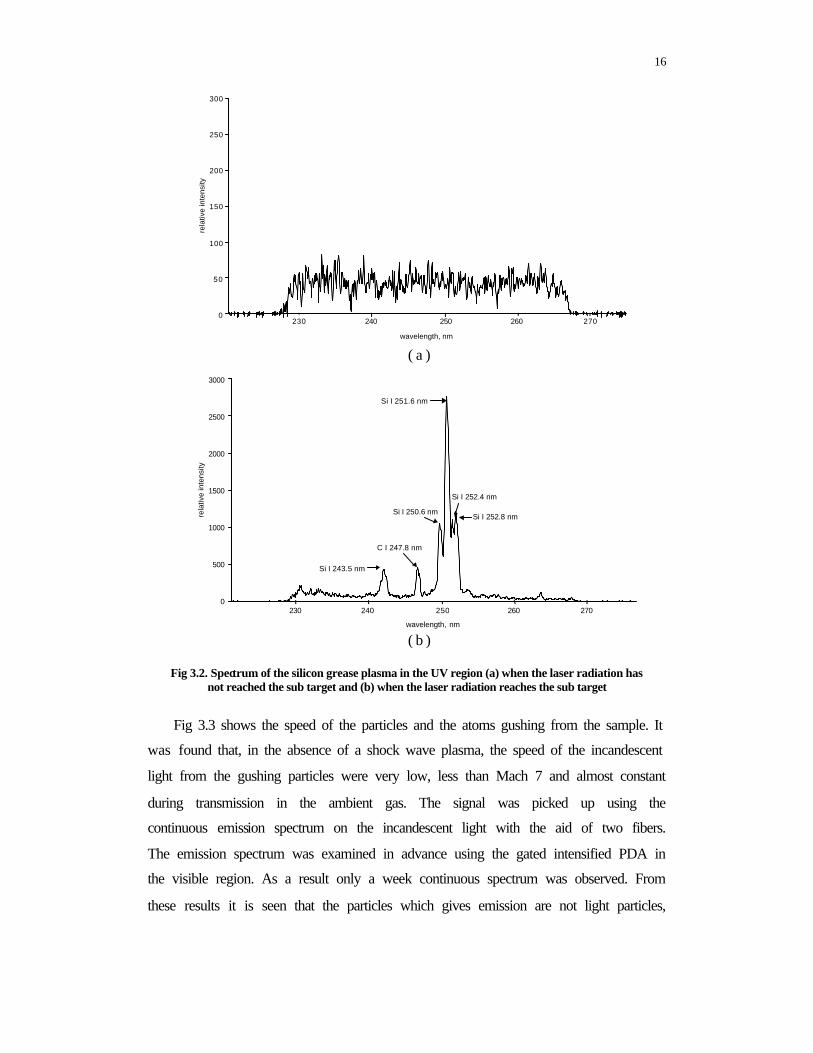
Fig 3.2 shows the spectrum in the UV region obtained (a) when the laser radiation
has not attacked the sub target and (b) when the laser radiation has attacked the sub
target. These spectra were collected by single-shot irradiation using the gated mode
with an exposure time of 100 ? s. It can be clearly seen that before the laser light
reaches the sub target, no atomic emission line was observed in the spectrum but only
a dark noise. The atomic emission observed in (b) is attributed mainly to Si atoms. We
also confirmed the detection of a strong 288.1 nm emission line (3p2 1 D-4s1p0) whose

15
( a ) ( b )
( c ) ( d )
Fig 3.1. A series of silicon grease plasma photographs for (a) the initial application of laser radiation to the sample, (b), (c) and (d) the application of laser radiation for the second, third and
fourth times to the sample surface at a fixed position
excitation energy is as high as 5.08 eV. Considering the strong emission from the
excited state of Si, it is assumed that the temperature of the secondary plasma is more
than several thousand degrees. According to our previous experiments on the shock
wave plasma, the temperature was estimated to be around 8000oK.6,9)
Here, it should be stressed that under careful microscopic investigation, crater
formation and damage to the surface of the copper sub target were not observed after
the laser bombardment in both cases, with the silicon grease and without the silicon
grease. However, when we used brass as the sub target, a small crater was seen after
successive laser irradiation. This is because the threshold of its high reflectivity
(more than 90%) at around 10.6 ? m. From this result we can say that the secondary
plasma consists of only silicon grease, and the copper plate plays the role of a
repulsion substrate only, enhancing the speed of the gushing atoms and it is never
evaporated.
16
( a )
( b )
Fig 3.2. Spectrum of the silicon grease plasma in the UV region (a) when the laser radiation has not reached the sub target and (b) when the laser radiation reaches the sub target
Fig 3.3 shows the speed of the particles and the atoms gushing from the sample. It
was found that, in the absence of a shock wave plasma, the speed of the incandescent
light from the gushing particles were very low, less than Mach 7 and almost constant
during transmission in the ambient gas. The signal was picked up using the
continuous emission spectrum on the incandescent light with the aid of two fibers.
The emission spectrum was examined in advance using the gated intensified PDA in
the visible region. As a result only a week continuous spectrum was observed. From
these results it is seen that the particles which gives emission are not light particles,
0
50
100
150
200
250
300
wavelength, nm
rela
tive
inte
nsity
230 240 250 260 270
0
500
1000
1500
2000
2500
3000
wavelength, nm
rela
tive
inte
nsity
230 240 250 260 270
Si I 243.5 nm
C I 247.8 nm
Si I 250.6 nm
Si I 251.6 nm
Si I 252.4 nm
Si I 252.8 nm

17
but rather weight particles or droplets because if they are light particles that speed
would soon decrease due to collision with the ambient gas.
Fig 3.3. The relationship between the velocity of the Si I 298.7 nm, Zn I 481.0 nm and incandescent light as a function of plasma position
The velocity and time position can be calculated as follows:
(Mach) velocity airin n propagatio sound
velocity
(Km/s) velocity npropagatio timefibers obetween tw distance
s)(n propagatio time setting timesetting timescale 1 oflength signals twoofpoint starting
?
?
???
?
When a shock wave plasma was generated, the speed of the silicon atoms was
measured using Si I 298.7 nm and was as high as Mach 55 near the target (3 mm),
decreasing to Mach 30 at 6 mm above the sample surface. These data were derived
from the result of the relationship between the slit position and the rising time, which
was obtained by varying position of the chamber together with the focusing lens, as
mentioned in the previous section. The time profile as the function of position is
shown in Fig 3.4. In order to compare the result of Si plasma with ordinary laser-
induced metal plasma, we used brass sample as the target without grease. The curve is
shown in Fig 3.3.
0
10
20
30
40
50
60
70
3 4 5 6
position, mm
velo
city
, Mac
h
Si I 288.1 nm
Zn I 481.0 nm
droplet's vapor

18
Fig 3.5 shows the relationship between time and the displacement distance of the
front of the emission which was observed by reading the rising point of the secondary
plasma. It can be clearly seen that, for the both cases, the slope is near 0.4 which is
Fig 3.4. Incandescent light’s time profile as the function of position
Fig 3.5. The relationship between the time and the distance of the rising point of emission of Si I 298.7 nm and Zn I 481.0 nm at 1 Torr surrounding air in log-log plot
good with the agreement with the theoretical result derived by Sedov for the blast
wave.21) Based on these experimental facts we have already proved that the zinc
plasma can also be produced even in the soft material when the suitable sub target is
placed at the back of the sample.
102 2 31
2
3
101
log-log scale
5
8
5 8Time, ns
Pos
itio
n, m
m
Si I 288.1 nmZn I 481.0 nm
19
In addition to these experiments another experiment was performed. Namely
CuSO 4.5H2O powder was mixed with silicon grease in several weight percentages.
The grease containing CuSO4.5H2O was painted on the copper sub target, and
irradiated in the same manner as described above. As the result, a similar result was
observed; namely, no secondary plasma was observed at the beginning of the shots of
laser irradiation, but after the laser light reached the target very bright secondary
plasma was observed with a nearly hemispherical shape after a few shots of laser
irradiation. The secondary plasma emitted very bright green emission due to Cu atoms
in CuSO4.5H 2O. Therefore, it can be said that this sub target technique can be applied
to the spectrochemical analysis of powder samples; in general, such powder samples
can not be used as a sample for laser ablation atomic emission spectrometry.
It is assumed that when the surface of the target is soft, the expulsion of atoms by
the surface is weakened because the softened surface absorbs the recoil energy and the
atoms gushing from the primary plasma do not acquire sufficient speed to form a
shock wave. On the other hand, when the hard sub target is placed on the back in tight
contact with the sample, the forward momentum of the gushed atoms does not weaken
without absorbing the energy. We have already proposed the model to explain the
generation of shock wave plasma.6,9) Namely, by the action of atoms gushing from the
target, the induced adiabatic compression of the surrounding gas creates a shock
wave. As a result of the compression, the kinetic energy of the propelled atoms is
converted into heat energy in the plasma.
The sub target effect was also confirmed on a phosphor low-melting-point glass.
As reported in the previous work, shock wave plasma could not be generated when a
TEA CO2 laser (300 mJ) was focused on a phosphor low-melting-point glass with a
power density of 0.6 GW/cm2, while under the irradiation of XeCl laser, a shock wave
plasma was produced.8) We have checked the sub target effect on the phosphor low -
melting-point glass using the previous TEA CO2 laser. As a result good shock wave
plasma was observed when we set a metal sub target on the back of the glass. Namely,
before the laser beam penetrated the target, only jet-like orange color emission was
observed. However, after several laser shots of irradiation the bright hemispherical
plasma appears suddenly when the laser beam attacked the sub target directly, and the
atomic emission assigned to phosphor was clearly observed.
Another experiment was performed to confirm the sub target effect on a pellet
which was made by compressing KI powder mixed with tea leaf powder. The purpose

20
of this experiment was to perform a quantitative analysis of the F element in the tea
leaf. In order to increase the detection sensitivity, we increased the amount of tea leaf
powder content in the pellet. In such a case the pellet hardness was extremely
degraded, and it became difficult to produce a shock wave plasma because of the lack
of repulsion force on the surface of the sample. However, when we set the sub target
on the back of the pellet, bright secondary plasma was produced after the laser beam
penetrated the pellet, and the generation of the bright secondary plasma was observed.
By this method, we succeeded in detecting F in the tea leaf using several ionic
emission line of F, such as F II 350.5 nm and F II 384.7 nm.22) Therefore, we can say
that the sub target effect can be effectively employed for practical application in the
quantitative analysis of soft samples.
3.1.4. Conclusion
It has been proved that in the case of soft samples, such as silicon grease shock
wave plasma cannot be produced. However, when we placed a sub target on the back
of the sample, shock wave plasma is generated. It is believed that in the absence of a
sub target, the expulsion of atoms is weakened because the soft surface absorbs recoil
energy, and atoms gushing from the primary plasma do not acquire sufficient speed to
form a shock wave. The main role of the sub target is to produce a repulsion force for
atoms gushing with high speed. That experimental results obtained in this study are
also strong evidence that support our shock wave model which explains the
mechanism of laser-induced shock wave plasma. It should be noted that this sub target
method can be successfully utilized to realize highly sensitive and rapid quantitative
analysis of soft sample, such as grease and biological samples.

21
3.2. Sub Target Effect on Laser Plasma Generated at Atmospheric Pressure
3.2.1. Introduction
In this experiment, we prove that even at 1 atm the shock wave model can well
explain the generation of the laser plasma. Thus, the characteristics of the laser
plasma obtained at this atmospheric pressure were then analyzed based on our shock
wave model proposed for low -pressure laser plasma, and the results showed that the
excitation mechanism of LIBS is essentially the same as that our shock wave model.
It is therefore believed that the breakdown mechanism did not play a crucial role in
the generation of atmospheric laser plasma. Initial quantitative analysis for elemental
calcium of water from the blow-off of a boiler system was also carried out.
3.2.2. Plasma Ge neration in Surrounding He at Atmospheric Pressure
The experimental arrangement used here can be readily seen in Fig 3.6. In this
experiment, laser irradiation from a 10.6 ?m TEA CO2 laser (Lumonics, multigas
laser, model HE440) was operated shotwise, and the laser output energy was fixed at
100 mJ. The laser beam was focused by a ZnSe lens (f = 100 mm) through a ZnSe
window onto the surface of a sample.
Fig 3.6. Diagram of experimental setup for this experiment
The sample was placed in a metal chamber (75 mm X 75 mm X 90 mm) could be
evacuated with a vacuum pump and filled with the desired gas up to a certain
pressure. Chamber pressure was measured precisely by a digital manometer (Diavac
laser printer
cooling system
OMA systemtrigger signal
Time/DivVolt/Div
Trigger Y2Y1
TEACO2
laser
sub-target
target: Si grease
plasma
concave mirror
computer
fiber optic
HV
PMTSlit
Monochromator
digital samplingstorage scope
ZnSelens

22
PT-1DA). Gas flow through the chamber was regulated by a needle valve in the air
line and another valve in the pumping line. The sample, together with the entire
chamber and the ZnSe lens, could be moved in two directions with the use of a step
motor for movement in the laser beam direction. The sample was fixed at the same
position during irradiation.
The radiation of the laser-induced plasma was observed through an optical
window at right angles to the laser beam by means of an imaging quartz lens (f = 100
mm) with an aperture 10 mm X 10 mm. The plasma was imaged with an enlargement
(1:3) onto the entrance slit of a monochromator (Spex M-750, Czerny Turner
configuration, focal length 750 mm, grating of 1200 grooves/mm blazed at 500 nm).
The entrance slit was set at 2 mm in height and 100 ?m in width so that the
observation area could be restricted to the limited region. The electric signal output
from a photomultiplier (Hamamatsu IP -28) was fed through a time-resolved circuit
(its RC time constant was 30 ns) into the first channel of a digital sampling storage
scope was obtained from the trigger output of the laser system.
When emission spectral data were taken, a gated intensified photo diode array
(PDA, Princeton IRY 700) with 700 sensitized channel was used and the
synchronization signal was regulated by the external trigger function of the laser
system. The sample used in this experiment was high-vacuum silicon grease which
was painted on the sub-target surface with a thickness of roughly 100 microns. The
sub-target material used in this experiment mainly copper (Rare Metallic Co. 4N,
thickness of 0.2 mm). When quantitative analysis of water was carried out, water from
the blow-off of a boiler system which contained calcium was used. The water (50
cm3) was then allowed to evaporate and the remaining solid was collected by using
silicon grease.
3.2.3. Results and Discussion
A TEA CO2 laser was accurately focused on silicon grease samples painted on
the copper surface as a sub-target in a surrounding air of 1 atm. At the first irradiation,
the laser light had not yet reached the hard sub-target and, as a result, the sound from
the explosion was very weak until the fourth shot. For the fifth shot, the laser light
was assumed to have reached the sub-target set in the back surface of the silicon
grease samples, and at this point, a loud sound due to the generation of shock waves

23
could be clearly heard. The plasma was cone-shaped with a diameter around 4 mm in
the case of surrounding air at 1 atm. In the case of helium at 1 atm, the plasma size
was smaller than that in air at the same laser energy. It should also be noted that
helium emission lines could be readily observed compared to air, and this was why
we used helium in all of our experiments. Here, it should be stressed that careful
microscopic investigation revealed no crater formation on or damage to the surface of
the copper sub-target after laser bombardment in either case with and without the
silicon grease. On the basis of these results, we can say that the laser plasma consists
of only silicon grease, and the copper plate plays the role of a repulsion substrate
only. Namely, it is considered that when the surface of the silicon grease is soft, the
expulsion of atoms is weakened because the soft surface absorbs the recoil energy and
the atoms gushing from the silicon grease is not weakened because the copper plate
acts as a wall on which atoms are reflected.
Fig 3.7. Time and spatially integrated emission intensity of Si I 288.1 nm and He I 587.5 nm as a function of the number of laser shots at a fixed position. Data were taken in surrounding helium
gas of 1 atm
In order to examine how the emission intensity of He I 587.5 nm and Si I 288.1
nm varies with the number of repeated laser irradiation at a fixed position, we
investigated the effect of laser bombardment on a silicon grease target on copper plate
in the presence of helium gas at 1 atm. Figure 3.7 shows that the emission intensity
could not be found at the initial laser bombardment but after five shots, the emission
intensity appeared for both helium and silicon and increased rapidly up to 200 laser
shots, after which it more or less became constant and then decreased with the further
increase in the number of laser shots to 1000. It should be noted that in our previous
0
200
400
600
800
1000
1200
1400
0 100 200 300 400 500 600 700 800 900 1000
number of shots
emis
sion
inte
nsity
(co
unts
)
HeliumSilicone

24
work conducted at reduced pressure in air, only the third and fourth shots produced
shock wave plasma and thereafter the plasma disappeared because the laser light
already reached the surface of the sub-target. It is therefore considered that in the
high-pressure case, the silicon grease around the laser focal point, melted during the
repeated laser irradiation and the flow grease were then directed to the laser focal
point, yielding almost a constant emission intensity of the silicon lines.
Fig 3.8. Time profiles of the emission intensity of Si I 288.1 nm and He I 587.5 nm observed at 1.3 mm in helium at 1 atm
Figure 3.8 shows the time profiles of the emission intensity of Si I 288.1 nm and
He I 587.5 nm observed at 1.3 mm under helium gas at 1 atm. Both curves show a
similar pattern consisting of two components: one is a steep climb observed at the
early stage of plasma irradiation and the other is the decline at a slower pace. These
emission characteristics are considered to correspond to the shock excitation stage and
the cooling stage, respectively, which have been proposed to explain laser plasma
generation at low pressures; namely, the steep climb is related to the process of
continuous compression of the gushing atoms. It has been proved in our previous
studies.6,35) that the life time of the primary plasma is about twice that of the laser
pulse width (FWHM = 50 ns), and within the time, most of the atoms gush out from
the primary plasma at high speed. At the beginning of the expansion, the temperature
of the atom cluster gushing out from the primary plasma is relatively low. With time,
the compression proceeds and intensifies. Consequently, the plasma temperature rises

25
to enhance the atomic emission. This process takes place in the shock excitation stage.
Soon afterward, the cluster of atoms begins to slow down while losing its energy to
the surrounding gas. As a result, no further excitation will take place, since the
compression between the shock front and the propelling atoms can no longer be
sustained due to the increasing separation between them, while the cluster of atoms
continues to move forward with its residual momentum. Since the surrounding gas
behind the shock wave is left with high temperature, and the secondary plasma also
contains a large amount of residual thermal energy, the cooling of the plasma is bound
to proceed slowly with time. We call this part of the process the cooling stage. It
should be noted that the rising point of helium emission comes later than that of
silicon emission. This means that the breakdown mechanism did not play a crucial
role in the atmospheric plasma generation and therefore, by compressing of the atoms
gushing from the target, the surrounding gas was excited.
Fig 3.9. Relationship between the propagation length of the secondary plasma front and helium atoms as the function of time
In order to complete the elucidation of the excitation mechanism of the secondary
plasma and the surrounding gas atoms, one also needs to know how the front of the
secondary plasma and He emission moves with time. This key information on the
propagation of the secondary plasma and He emission is provided by the data
depicted in Fig 3.9. The plot consists of one linear segment with a slope of 0.4. It
should be noted that the fronts of the Si emission and He emission share the same
position in curve. This means that Si atoms and He emission move with the same
speed; namely, Si atoms function as a piston in compressing the surrounding helium
102 2 3 1031
2
3
101
Surrounding gas : Helium at 1 atm
5
8
5 8Time, ns
Pos
itio
n, m
m
Si 288.1 nmHe 587.5 nm
Log-log scale

26
gas, yielding the emission of helium atoms. The slope of 0.4 exactly supports the
shock wave model proposed by Sedov.21)
Initial quantitative analysis to confirm the sub target effect in the generation of
the atmospheric shock wave plasma was also carried out. In this experiment, water
from the blow-off a boiler system was used. This water, which contained calcium,
was then evaporated and the residual solid was collected with the silicon grease which
was then painted on the copper surface. Figure 3.10 shows the emission spectra taken
using the OMA system. From the spectra we can clearly see the appearance of Ca II
393.3 nm and Ca II 396.8 nm. The detection limit in this experimental stage was
estimated from the signal to noise ratio in the emission spectra in Fig 3.10, to be
around 5 ppm for calcium in natural water. It is expected that this detection limit will
be much lowered by increasing the energy of TEA CO2 laser, because in this
experiment we used the TEA CO2 laser with a relatively low pulse energy.
Fig 3.10. Emission spectra of a silicon grease sample containing calcium at low concentrations, taken in surrounding helium gas of 1 atm
3.2.4. Conclusion
It has been proved that in the case of soft samples, such as silicon grease, a shock
wave plasma cannot be generated. However, when we place a sub target on the back
surface of a sample, a shock wave plasma is generated followed by the loud explosion
sound. It is believed that in the absence of a sub target, the expulsion of atoms is
0
500
1000
1500
2000
2500
3000
3500
4000
340 350 360 370 380 390 400 410 420 430 440
wavelength (nm)
emis
sion
inte
nsity
(co
unts
)
Ca II 393.3 nm
Ca II 396.8 nm

27
weakened because the soft surface absorbs recoil energy, and atoms gushing from the
primary plasma do not acquire sufficient speed to form a shock wave. The main role
of the sub target is to produce a repulsion force for atoms gushing with a high speed.
The experimental results showed that the mechanism of laser-induced breakdown
spectroscopy (LIBS) is essentially the same as that proposed in our LISPS model. It is
then believed that the breakdown mechanism did not play a crucial role in the
generation of atmospheric laser plasma. Further experiments are being undertaken in
order to apply sub target effect in spectrochemical applications in high-pressure
surrounding gas, and the results will be reported elsewhere in the near future.
28
Chapter Four
CONFINEMENT EFFECT IN QUARTZ SAMPLE
4.1. Confinement Effect in Enhancing Shock Wave Plasma Generation at Low
Pressure by TEA CO2 Laser Bombardment on Quartz Sample
4.1.1 Introduction
In performing laser microprobe analysis, repeated irradiation is usually directed
to a fixed position on the sample surface. Consequently a micro crater will be created
on the sample surface, which deepens as the shot number increases. We have
observed in a preliminary experiment using a TEA CO2 laser irradiated on a quartz
sample that the depth of the crater was intimately related to the so-called pre-
irradiation effect at the first few shots, characterized by the generation of primary
plasma without being followed by the appearance of the secondary plasma as
normally observed on metal samples. Only after a number of shots, when the crater
has reached a certain depth, did the secondary plasma begin to develop in concurrence
with the generation of the primary plasma. Since the formation of secondary plasma is
a crucial condition for the application of LISPS, the effect of the crater must be
thoroughly investigated and understood before the analytical method can be properly
applied to this and similar samples. Recently, there appeared some papers in which
crater characteristics were discussed with regard to laser ablation process.23,24)
However, to the best of our knowledge, no report has been published on the laser
plasma confinement effect arising from the crater. The aim of this experimental work
is to produce a cle ar description of the pre-irradiation phenomenon in relation to the
influence of the crater. This will in turn be studied in terms of its confinement effect
on the primary as well as secondary plasmas generated from quartz samples at
reduced surrounding gas pressure. It will be shown that the correlation between those
effects can be understood on the basis of our shock wave model.

29
4.1.2. Experimental Procedure
The complete experimental setup is described in Fig. 4.1. In this experiment, the
10.6 ?m TEA CO2 laser (Shibuya Kogyo, SQ-2000, 3J, 100 ns) was operated shot to
shot with the laser output energy varied from 500 mJ to 800 mJ by using the
appropriate apertures. The laser beam was focused by a Ge lens (f = 100 mm) through
a ZnSe window onto the sample surface. The sample was placed in a vacuum tight
metal chamber measuring 125 mm x 100 mm x 100 mm. This chamber was evacuated
with a vacuum pump and filled with the desired gas up to a certain pressure, which
was measured and monitored by a digital manometer (Nishiyama Seisakusho, DM-
760). Gas flow through the chamber was regulated by a needle valve in the air line
and another valve in the pumping line. The sample, together with the entire chamber
and the Ge lens, could be moved in two directions by the use of a step motor for
movement in the laser beam direction and a micrometer for movement perpendicular
to the laser beam direction. The sample was fixed at the same position during
irradiation, while the emission intensifies of the plasmas were detected through an
optical window of the chamber at right angle to the laser beam.
Fig 4.1. Diagram of the experimental setup
For the study of pre-irradiation effect, a time-evolution measurement was
performed on the spatially integrated emission intensifies of both the primary and
secondary plasmas. In the measurement of the secondary plasma emission, the
monochromator was set for the wavelength of Si 1 288.1 nm with the position of the
entrance slit fixed at the center of the secondary plasma without using lens, so that the
Gas Out
Sample
MotorGe lens
Gas in
He
Ne
La
ser
Monochromator 1
PMT 1
BS
DigitalOscilloscope
ch 1
TEA CO 2 laser
Plasma
Cylindrical Glass
ch 2
Monoc
hromato
r 2
PMT
3
Mirror
External Trigger
Interferencefringe
BS
1.5
m
3 m
Aperture
PMT 2
ch 2
PhotonDrag
UV filter
Quartz lens
Slit
top view
side view
1 mm
1 mm
sample
mask
sample
mask mask

30
entire emission of the plasma was collected directly by monochromator 1. Meanwhile
for intensity measurement of the primary plasma, an imaging quartz lens (f = 40 mm)
was placed outside the chamber at a position making an angle of around 60o with the
beam direction. As indicated in the figure, this arrangement allows the primary
plasma to be imaged 1:1 onto the entrance slit in front of photomultiplier 2
Hamamatsu R585). This slit was set at 2 mm in height and 2 mm in width behind a
UV band pass filter (UV D36B), so that only the image of the primary plasma was
detected by photomultiplier 2. The electric signals from two photomultipliers were
separately fed through a 500 k? resistor to the digital scope. In this experiment,
different surrounding gases were employed to study their different effects. The plasma
radiation of the primary plasma is detected by an optical multichannel analyzer (OMA
system, Atago Macs-320) attached to a monochromator with a focal length of 320mm
and connected to an optical fiber. Additionally, an investigation was conducted on the
confinement effect caused by the presence of a hole in a metal mask as well as that
due to the crater created on the sample. In an effort to explain the physical origin of
the pre-irradiation phenomenon, the crater effect and the related confinement effect
were examined in connection with the generation of shock wave, which is supposed to
be responsible for secondary plasma generation. To this end, a unique density jump
detection method using rainbow interferometer13,25,26) was adopted. In this method, a
He-Ne laser light was sent perpendicular to the TEA CO2 laser beam into the
expansion region of the laser plasma as depicted in Fig. 4.1. The outgoing probe beam
was sent into a cylindrical glass (60 mm in diameter) in such way that the laser light
undergoes minimum deviation. Under this condition, the beam emerging from the cell
exhibits a fine interference fringe pattern. It should be stressed that using this
equipment, the interferometric experiment could be carried out without the use of an
additional and delicate amplitude splitting setup. In this experiment, the second order
fringe series of the rainbow interference was chosen for the detection of density jump.
The separation between adjacent fringes in this series is about 0.5 mm. The slit of
monochromator 2 (0.1 mm) was set at the middle point between the minimum and the
peak of the second fringe for detecting the shift of the fringe when a shock wave
arrives at the probing area. The signal coming from photomultiplier 3 (Hamamatsu
R585) attached to monochromator 2 was fed into the second channel of the digital
storage scope through a 500 ? resistor. In all the measurements the digital storage

31
scope was triggered by a fraction of the TEA CO2 laser beam using a photon drag
detector (Hamaphoto B749).
4.1.3. Results and Discussion
It is found in these experiments that the primary and secondary plasmas generated
from quartz sample have distinctly different threshold energies. While the threshold
energy for primary plasma generation is 500 mJ, no secondary plasma was observed
even after 50 shots when the laser energy was set lower than 638 mJ. On the other
hand, at laser energy higher than 638 mJ, for instance 758 mJ, the secondary plasma is
found to be generated along with the primary plasma right from the first shot.
( a ) ( b )
Fig 4.2. A plasma picture taken by irradiating a quartz sample using a TEA CO2 laser of 550 mJ energy (a) at the first irradiation, only the primary plasma can be seen in this picture and (b) after 25th repeated irradiations in which the secondary plasma could clearly observable
The pre-irradiation effect observed in this experiment with 550 mJ laser energy is
illustrated by the two photos presented in Fig. 4.2. Fig. 4.2(a) shows the primary
plasma generated at the first shot of irradiation. The secondary plasma is ostensibly
absent in the picture. As the crater created on the sample surface deepens after
repeated shots of irradiation, the secondary plasma becomes fully developed around
the primary plasma as shown in Fig. 4.2(b). This observation is further corroborated
by the result of intensity measurement given in Fig. 4.3. There are two important
features to be noted in this figure. One is the delayed occurrence of the secondary
plasma at the tenth shot, although the primary plasma is already observable at the first
shot. The other feature is indicated by a sharp rise of the primary plasma intensity
after about 45 laser shots accompanied by a relatively milder increase of the
secondary plasma intensity. The delayed formation of the secondary plasma may be

32
attributed to several possible effects such as the preheating effect, radiation induced
changes of optical and physical properties or the confinement effect due to the crater
created by repeated irradiations. Clarification of the roles of these effects will be
given in the following analysis of the additional experimental data.
Fig 4.3. The relationship between the occurrence of emission intensity of primary plasma and secondary plasma as a function of laser shot number on quartz sample. The TEA CO2 laser
energy was set at 550 mJ and using an air at 2 Torr as a surrounding gas
In order to examine the preheating effect, the laser irradiation was stopped after
the secondary plasma was produced. The presence of crater was clearly visible in this
case. Soon after the sample surface had cooled down, the irradiation was resumed and
directed at the same position, and no pre-irradiation effect took place. In other words,
both primary and secondary plasma were produced from the first irradiation. This
result clearly eliminates the role of preheating effect in the generation of secondary
plasma. We are thus left with the other two possible effects.
These possibilities are investigated by using an aluminum plate measuring 1 mm
in thickness, which contains a hole with a diameter of 1 mm. This plate was used as a
mask in front of the new and unirradiated sample surface. Since the depth of the crater
formed after 100 shots is about 1 mm, the thickness chosen for the plate is certainly
appropriate to demonstrate the confinement effect of the crater. The laser irradiation
was then passed through the hole of the mask. It is found once again that both primary
and secondary plasmas could be generated at the first shot as clearly indicated in Fig.
0
500
1000
1500
2000
2500
0 20 40 60 80 100 120shot number
rela
tive
inte
nsit
y, a
rb. u
nit
Primary plasma
Secondary plasma

33
4.4. This result further eliminates the possible effect of radiation-induced changes of
optical and physical properties. This leaves us with the sole effect of plasmas
confinement due to the presence of the hole in the mask or the crater created by
repeated irradiation prior to the generation of secondary plasma.
Fig 4.4. The relationship between the occurrence of emission intensity of primary plasma and secondary plasma as a function of laser shot number on quartz sample. An aluminum mask with a diameter of 1 mm and thickness of 1 mm was put in front of the quartz sample. The TEA CO2
laser energy was set at 550 mJ and using an air at 2 Torr as a surrounding gas
In our previous experiment, we have already proposed the shock wave model to
explain the generation of secondary plasma. Namely, a shock wave is created by the
adiabatic compression of the surrounding gas induced by the action of atoms gushing
out from the target. The secondary plasma is in turn generated by the shock wave. As
a result of the compression, the kinetic energy of the propelled atoms is converted into
thermal excitation energy in the plasma. Obviously, ablated atoms with less energies
will lead to an ineffective compression process and hence unfavorable condition for
the generation of shock wave required for the formation of the secondary plasma.
It is understood on general ground that the confinement of plasma formation
region will lead to the enhancement of primary plasma and the suppression of energy
dispersion. Both of these effects are expected to result in higher gushing speed of the
ablated atoms, and hence more favorable condition for the formation of shock wave
responsible for the generation of secondary plasma and therefore the elimination of
pre-irradiation effect. This suggested effect of the crater was confirmed by the
detection of density jump with the experimental setup described in Fig. 4.1 which
was explained in our previous papers.13,25,26) It was found that no significant signal of
0
200
400
600
800
1 0 0 0
1 2 0 0
1 4 0 0
1 6 0 0
1 8 0 0
2 0 0 0
0 2 0 4 0 6 0 8 0 100 1 2 0
shot number
rela
tive
int
ensi
ty,
arb.
uni
t
P r imary p lasma
Secondary p lasma

34
density jump was observed at the initial shots of laser irradiations. A sharp density
jump showed up as soon as the secondary plasma became clearly visible in
conjunction with the appearance of a crater. This observation establishes the role of
the crater in giving rise to the confinement effect, which results in the enhancement of
shock wave formation. This shock wave plasma generation mechanism also explains
naturally the absence of pre-irradiation effect at higher laser energies.
Fig 4.5. The relationship between the secondary plasma emission intensity and laser shot number for different mask thickness. The TEA CO2 laser energy was set at 550 mJ and using an air at
2 Torr as a surrounding gas
The effect induced by the crater was further investigated by simulating it with
aluminum masks of various thickness (0.2 mm, 1 mm and 2 mm), each containing a
hole with diameter of 1 mm. The result of secondary plasma emission measurement is
presented in Fig. 4.5. It clearly shows that the presence of the mask reduces
significantly the pre-irradiation effect even with a thickness of 0.2 mm, and eliminates
the effect completely when thicker masks are used. The presence of a hole on the
irradiated surface is thus indicative of the occurrence of confinement effect, which
enhances the formation of the secondary plasma. In all cases, the plasma intensity
always undergoes initial growth and more or less stabilizes henceforth. The general
suppression of intensity upon the introduction of a mask on the sample surface is also
clearly visible. The intensity reduction is most likely due to less effective thermal
excitation process in the hole as heat is more readily diffused by the metal mask. The
intensity variation with respect to thickness of the mask can be explained as follows.
In the case of the thinnest masks (0.2 mm), the wall of the hole is simply not deep
0
2000
4000
6000
8000
10000
12000
14000
16000
18000
0 20 40 60 80 100 120 140 160 180
shot number
rela
tive
inte
nsit
y, a
rb. u
nit
without mask
mask with 1 mm thickness
mask with 2 mm thickness
mask with 0.2 mm thickness
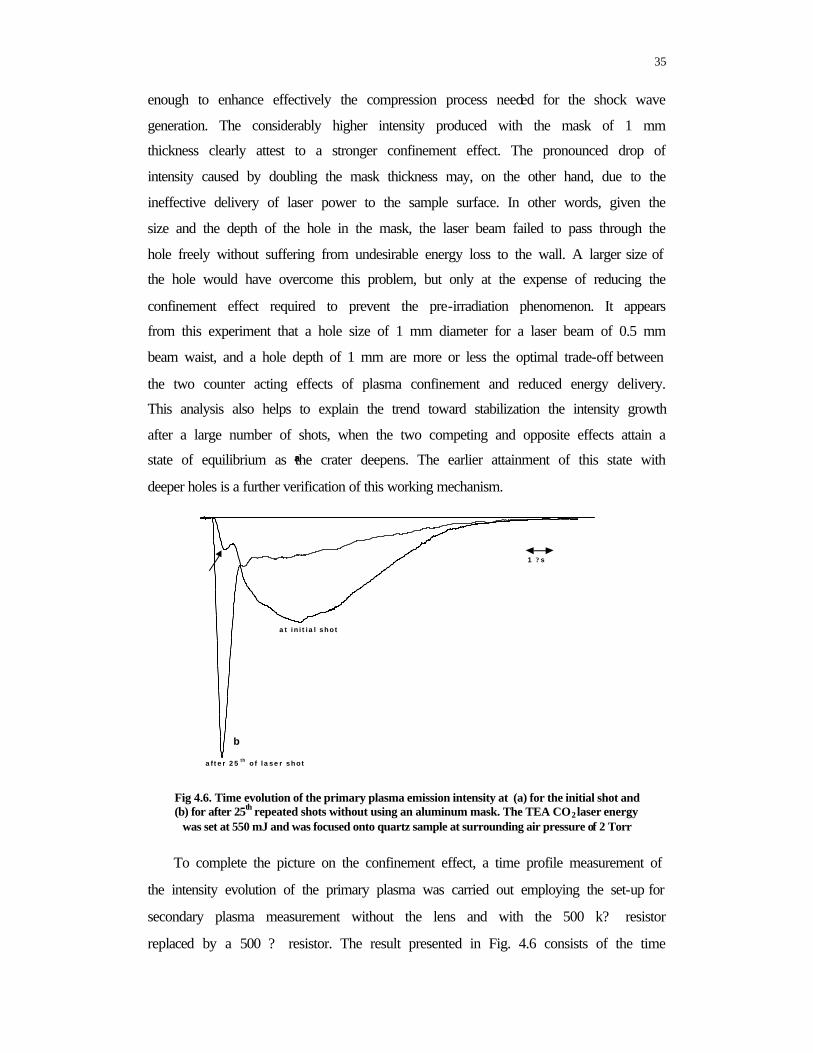
35
enough to enhance effectively the compression process needed for the shock wave
generation. The considerably higher intensity produced with the mask of 1 mm
thickness clearly attest to a stronger confinement effect. The pronounced drop of
intensity caused by doubling the mask thickness may, on the other hand, due to the
ineffective delivery of laser power to the sample surface. In other words, given the
size and the depth of the hole in the mask, the laser beam failed to pass through the
hole freely without suffering from undesirable energy loss to the wall. A larger size of
the hole would have overcome this problem, but only at the expense of reducing the
confinement effect required to prevent the pre-irradiation phenomenon. It appears
from this experiment that a hole size of 1 mm diameter for a laser beam of 0.5 mm
beam waist, and a hole depth of 1 mm are more or less the optimal trade-off between
the two counter acting effects of plasma confinement and reduced energy delivery.
This analysis also helps to explain the trend toward stabilization the intensity growth
after a large number of shots, when the two competing and opposite effects attain a
state of equilibrium as the crater deepens. The earlier attainment of this state with
deeper holes is a further verification of this working mechanism.
Fig 4.6. Time evolution of the primary plasma emission intensity at (a) for the initial shot and (b) for after 25th repeated shots without using an aluminum mask. The TEA CO2 laser energy
was set at 550 mJ and was focused onto quartz sample at surrounding air pressure of 2 Torr
To complete the picture on the confinement effect, a time profile measurement of
the intensity evolution of the primary plasma was carried out employing the set-up for
secondary plasma measurement without the lens and with the 500 k? resistor
replaced by a 500 ? resistor. The result presented in Fig. 4.6 consists of the time
at initial shot
after 25 th of laser shot
1 ? s
a
b
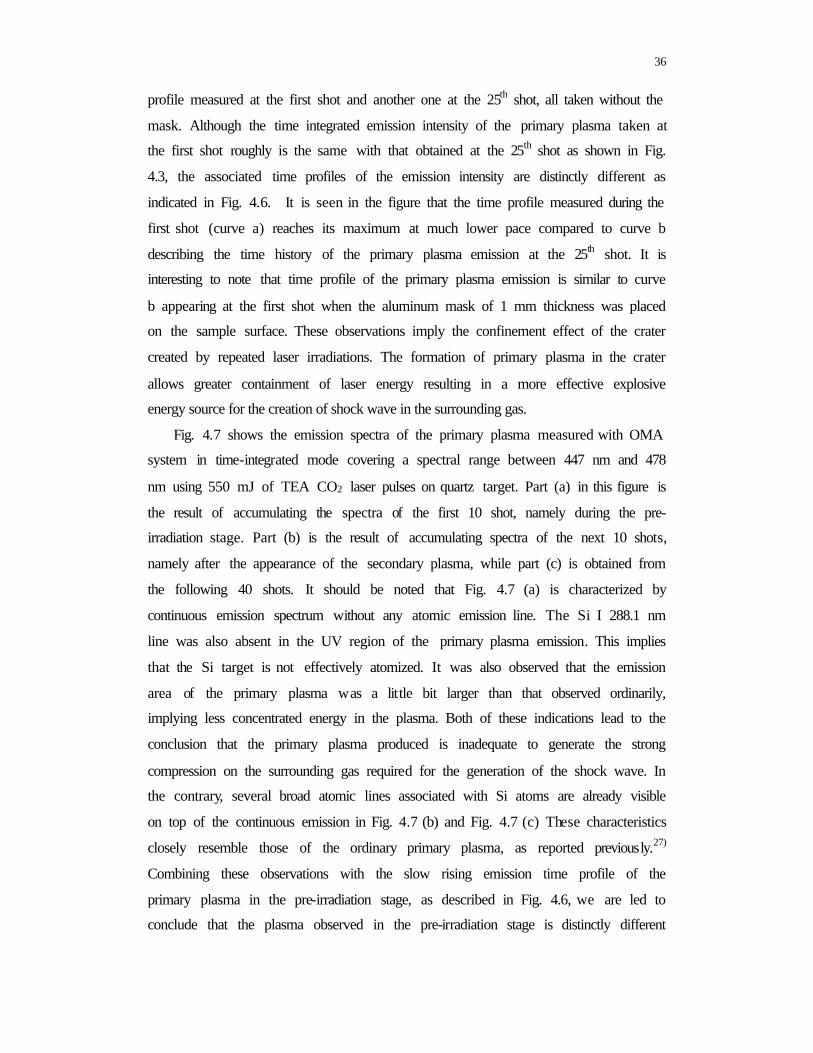
36
profile measured at the first shot and another one at the 25th shot, all taken without the
mask. Although the time integrated emission intensity of the primary plasma taken at
the first shot roughly is the same with that obtained at the 25th shot as shown in Fig.
4.3, the associated time profiles of the emission intensity are distinctly different as
indicated in Fig. 4.6. It is seen in the figure that the time profile measured during the
first shot (curve a) reaches its maximum at much lower pace compared to curve b
describing the time history of the primary plasma emission at the 25th shot. It is
interesting to note that time profile of the primary plasma emission is similar to curve
b appearing at the first shot when the aluminum mask of 1 mm thickness was placed
on the sample surface. These observations imply the confinement effect of the crater
created by repeated laser irradiations. The formation of primary plasma in the crater
allows greater containment of laser energy resulting in a more effective explosive
energy source for the creation of shock wave in the surrounding gas.
Fig. 4.7 shows the emission spectra of the primary plasma measured with OMA
system in time-integrated mode covering a spectral range between 447 nm and 478
nm using 550 mJ of TEA CO2 laser pulses on quartz target. Part (a) in this figure is
the result of accumulating the spectra of the first 10 shot, namely during the pre-
irradiation stage. Part (b) is the result of accumulating spectra of the next 10 shots,
namely after the appearance of the secondary plasma, while part (c) is obtained from
the following 40 shots. It should be noted that Fig. 4.7 (a) is characterized by
continuous emission spectrum without any atomic emission line. The Si I 288.1 nm
line was also absent in the UV region of the primary plasma emission. This implies
that the Si target is not effectively atomized. It was also observed that the emission
area of the primary plasma was a little bit larger than that observed ordinarily,
implying less concentrated energy in the plasma. Both of these indications lead to the
conclusion that the primary plasma produced is inadequate to generate the strong
compression on the surrounding gas required for the generation of the shock wave. In
the contrary, several broad atomic lines associated with Si atoms are already visible
on top of the continuous emission in Fig. 4.7 (b) and Fig. 4.7 (c) These characteristics
closely resemble those of the ordinary primary plasma, as reported previously.27)
Combining these observations with the slow rising emission time profile of the
primary plasma in the pre-irradiation stage, as described in Fig. 4.6, we are led to
conclude that the plasma observed in the pre-irradiation stage is distinctly different

37
from that observed previously, and could not serve as the explosion energy source for
the generation of shock wave.
One attempted explanation of the influence of the crater is to assume that
confinement of the ablated atoms by the crater will result in an effective acceleration
of the atoms and thereby enhances the generation of the shock wave. However, this
idea must be dismissed simply because this mechanism would lead to faster rise of
curve a similar to curve b in Fig. 4.6, which represents the rapid energy accumulation
by the ablated atoms. Further, this assumption would lead to the appearance of atomic
emission lines in the spectrum. Another possible mechanism considered in this
connection is described in the following. As a consequence of the presence of the
crater, expansion of fast moving electrons ejected from the target will be suppressed,
keeping them relatively close to the target to allow effective absorption of the laser
energy via inverse bremsstrahlung process. Note that the absorption coefficient of the
laser light due to the inverse bremsstrahlung is proportional to the density of electrons
in the initial plasma.29) As a result, a localized high temperature plasma would be
produced leading to strong ablation process which facilitates in turn the shock wave
generation. This effective energy accumulation and concentration mechanism is
simply missing without the presence of a crater.
Given the crucial role of gas compression and shock wave formation within the
framework of our shock wave plasma model, the gas pressure is expected to have
important influences on the generation of secondary plasma. It is therefore necessary
to investigate the effect of gas pressure in this experiment. The result of measurement
on that effect is described in Fig. 4.8. It is seen that increasing the pressure from 2
Torr to 300 Torr results in shorter delay in the occurrence of the secondary plasma.
This is in agreement with the expected role of the surrounding gas in the formation of
shock wave, and the increased effectiveness of such a role at higher pressure.27)
Nevertheless, the surrounding gas is also known to produce shielding effect at
pressure close to 1 atm due to its large absorption of the laser energy. Consequently,
the laser energy reaching the sample surface becomes effectively reduced. This
explains the opposite effect observed in 1 atm surrounding gas compared to those
mentioned above. The associated emission intensity of the induced plasma shows an
initial decrease with increasing pressure, but reverses the trend at higher pressure, in
good qualitative agreement with our previously reported result.17,27) It must be pointed
out that the intensities detected at 300 Torr and 1 atm are believed to have significant

38
0.00
100.00
200.00
300.00
400.00
500.00
600.00
700.00
800.00
900.00
445 450 455 460 465 470 475 480 485
wavelength (nm)
inte
nsity
(co
unts
)
( a )
0.00
200.00
400.00
600.00
800.00
1000.00
1200.00
445 450 455 460 465 470 475 480 485
wavelegth (nm)
inte
nsity
(co
unts
)
Si 455.38 nm
( b )
0.00
5000.00
10000.00
15000.00
20000.00
25000.00
445 450 455 460 465 470 475 480 485
wavelegth (nm)
inte
nsity
(co
unts
)
Si 455.38 nm
Si 456.89 nm
( c )
Fig 4.7. The emission spectra of the primary plasma taken with the use of OMA system using time-integrated mode when 550 mJ pulse of TEA CO2 laser was focused at a fixed point on
quartz surface . Part (a) in this figure is the result of accumulating the spectra of the first 10 shot, namely during the pre-irradiation stage. Part (b) is the result of accumulating spectra of the next
10 shots, namely after the appearance of the secondary plasma, while part (c) is obtained from the following 40 shots.
39
contribution from the primary plasma as the secondary plasma was seen to shrink at
those pressure. That is the reason why those intensities tend to decrease slightly after a
large number of shots, since the primary plasma generated in the crater becomes more
localized inside the hole as the crater deepens with increasing number of shot.
In the same vein, we further examine the issue on the influence of gas density on
the generation of the shock wave plasma versus that of the gas pressure itself. In this
experiment, different kinds of gas such as helium, nitrogen and argon were employed
at properly chosen pressure of 14 Torr, 2 Torr and 1.4 Torr respectively to assure that
those surrounding gases are of similar density. The result given in Fig. 4.9 shows that
the secondary plasma begins to appear at the 18th shots in helium, at the 21st shots in
nitrogen and at the 25th shots in argon. The close proximity in terms of shot number
among the pre-irradiation effects in the three cases described above apparently favors
the role of the density of the gas as reported previously.27)
Fig 4.8. The relationship between plasma emission intensity (Si I 288.1 nm) as a function of shot number under different air pressures. The TEA CO2 laser energy was set at 550 mJ and was
focused onto quartz sample
It should be stressed here that pre-irradiation effect observed in the experiments
with N2 laser (5mJ or so) on quartz sample was also observed when YAG laser (20mJ
or so) was focused on glass, quartz, and some stone samples.
0
2000
4000
6000
8000
10000
12000
14000
16000
18000
0 20 40 60 80 100 120 140 160
shot number
rela
tive
inte
nsit
y, a
rb. u
nit
2 torr
300 torr
50 torr
1 atm

40
Fig 4.9. The relationship between the secondary plasma emission intensity and laser shot number for different gas kind. The TEA CO2 laser energy was set at 550 mJ and using helium, nitrogen
and argon at 14 Torr, 2 Torr and 1.4 Torr, respectively
Once the ordinary normal primary plasma is produced, hydrodynamic
confinement of the primary plasma flow will take place in the crater, while the
secondary plasma intensity increases. This hydrodynamic confinement effect is
indicated by the experimental curve observed after about 45 laser shots presented in
Fig. 4.3. It is seen that the primary intensity increases with higher slope together with
that of the secondary plasma. The increases of the emission intensity of both the
primary and secondary plasma with increasing shot number shown in Fig. 4.4 is also
supposed to have the same origin.
As we mentioned before, this pre-irradiation effect did not take place with metal
samples. This is probably as a consequence of enhanced preheating of the sample
surface, which helped to promote the atomic ablation process. The heating effect was
in turn due to the presence of ejected free electrons from the metal during the arrival
of the initial part of the laser pulse on the target surface. This free electron cloud at the
target surface is known to absorb the laser irradiation effectively by means of inverse
bremsstrahlung. In other words, direct heating and softening of target surface by laser
irradiation alone is apparently not very effective. Therefore higher laser energy is
required to induce strong atomic ablation for the generation of secondary plasma. This
explanation is consistent with the fact that the pre-irradiation effect occurring at lower
laser energies generally disappears as the energy is raised as we found in quartz and
other non metallic samples.
0
500
1000
1500
2000
2500
0 20 40 60 80 100 120 140 160
shot number
rela
tive
inte
nsit
y, a
rb. u
nit
Argon
Nitrogen
Helium

41
4.1.4. Conclusion
We have shown in this experiment that in contrast to metallic sample, the primary
plasma generated at the initial irradiation on a quartz sample does not develop into a
secondary plasma as ordinary observed in metallic sample. It is also shown that so
called pre-irradiation effect disappears as the crater deepens due to repeated
irradiation or upon the application of metal mask of certain thickness on the sample
surface. Analysis of the experimental data imply that the elimination of this pre-
irradiation effect is supposed to have its origin confinement of the fast electron as well
as accumulation and localization of laser absorption takes place by the electron. This
results effectively in a localized hot plasma from which atoms are propelled with
supersonic speed. Further hydrodynamic confinement also takes place inside the
crater after several tens of shots enhancing the shock wave generation process and
hence the formation of secondary plasma.

42
4.2. Confinement Effect of Primary Plasma on Glass Sample Induced by
Irradiation of Nd-YAG Laser at Low Pressure
4.2.1 Introduction
In performing micro area analysis using a laser, repeated irradiation onto a fixed
position with relatively low pulse energy is required and then a micro crater will be
created on the sample surface. Therefore, the effect of the crater on the plasma
generation must be thoroughly investigated and understood in order to completely
clarify the technique of the laser microprobe emission spectrochemical analysis. Also,
the data obtained from this kind of experiment will provide useful knowledge needed
in the application of plasma emission for monitoring the laser ablation process itself.
The aim of this experimental work is to report the pre-irradiation phenomenon on
the glass samples in relation to the influence of the crater. This will in turn be studied
in terms of its confinement effect on the primary plasma generated at a reduced
surrounding air pressure. It will be shown that these effects can be understood on the
basis of our shock wave model.
4.2.2. Experimental Procedure
The experimental setup is described in Fig 4.10. In this experiment, the 1,064 nm
Nd:YAG laser (Spectra Physics, GCR 12S, full power 400 mJ with pulse duration of
8 ns) was operated in manual mode (manually repeating the operation at about 2 Hz)
with the output energy being varied from 20 mJ to 48 mJ by using appropriate filters.
The laser light was focused with a multilayer lens (f = 100 mm) through a BK-7
window onto the sample surface. The glass sample used in this experiment is museum
glass, which contains Si 19%, Ca 4%, Na 9%, Al 0.5% and Mg 0.1%. The sample was
placed in a vacuum-tight metal chamber measuring 125 mm X 100 mm X 100 mm.
This chamber was evacuated with a vacuum pump and filled with air up to a certain
pressure, which was measured and monitored by a digital absolute vacuum meter. Gas
flow through the chamber was regulated by a needle valve in the air line and another
valve in the pumping line. The sample, together with the entire chamber and the
multilayer lens, could be moved in the laser beam direction and a micrometer for
movement perpendicular to the laser beam direction. The sample was fixed at the
same position during the irradiation.

43
Fig 4.10. Diagram of the experimental setup
For the study of the pre-irradiation effect, a measurement was performed on
the spatially integrated emission intensities for both the primary and secondary
plasmas. For the secondary plasma measurement, the monochromator (Spex, Czerny
Turner configuration, focal length of 750 mm, 1,200 grooves/mm blazed at 500 nm)
was set at Si I 288.1 nm, and emission from the secondary plasma was collected
directly by the mirror of the monochromator without using an imaging lens. The exit
slit of the monochromator was connected to photomultiplier 1 (Hamamatsu IP-28).
Meanwhile, for the intensity measurement of the primary plasma, an imaging quartz
lens (f = 70 mm) was placed outside the chamber at a position making an angle
around 60o with the beam direction. This arrangement allows the primary plasma to
be imaged 3:1 onto the entrance of quartz optical fiber so that all of the emission from
the image of the primary plasma can be detected. The exit of the fiber was then sent
into photomultiplier 2 (Hamamatsu R-1104) after passing through a UV pass filter
(UV D36B) and a small aperture which was set in order to allow only the light
coming from the image of the primary plasma to come into the photomultiplier. The
electric signals from the two photomultipliers were separately fed through a 500 k?
resistor to the digital sampling storage scope (HP-54610B).
Gas Out
Sample
MotorQuartz lens
Gas in
Mon
ochr
omat
or
PMT 1
DigitalOscilloscope
ch 1
Nd-YAG laser
Plasma
ch 2
External Trigger
BS
PINPhotodiode
PM
T 2
Slit
Quartz lens
Fiber Optic
Entrance slit

44
For the secondary plasma spectrum measurement, the plasma radiation is
detected by an optical multichannel analyzer (OMA system, Princeton Instrument
IRY-700) attached to a monochromator with a focal length of 150 mm and connected
to an optical fiber with its entrance placed in front of the observation window of the
vacuum chamber.
In this experiment, the surrounding air was used as a buffer gas and the pressure
was kept constant at 2 Torr. The crater sizes produced by the laser bombardment are
160 ? m and 200 ?m in diameter for the pulse energies of the laser light of 20 mJ and
48 mJ, respectively. In addition to this, an investigation was conducted on the
confinement effect caused by the presence of a hole in an aluminum mask as well as
that caused by the crater created on the sample.
4.2.3. Results and Discussion
When the YAG laser light with around 20 mJ pulse energy was repeatedly
focused at a fixed position on the glass sample, a pre-irradiation effect was observed.
Namely, at the beginning of the irradiation, only the primary plasma was produced
without any secondary plasma appearance, but after several shots, suddenly the
secondary plasma was generated.
Fig 4.11. Emission spectra taken after several laser shot irradiation at a fixed position of the glass sample; 2 shots, 4 shots, 6 shots and 8 shots. Each spectrum was taken upon single shot
irradiation after the pre-irradiation. The laser irradiation was performed using a pulse energy of 28 mJ in the surrounding air pressure of 2 Torr
Figure 4.11 shows the features of the pre-irradiation effect to demonstrate how
the emission spectra changes with the number of shots. The spectra were taken at the
Si I
288
.1 n
m
Ca
II 3
96.8
nm
Sec
ond
orde
r of
Si I
252
.8 n
m
Na
I 58
9.5
nm
2 shots
4 shots
6 shots
> 8 shots

45
pre-irradiation of shot number 2, 4, 6 and 8. The emission spectra were taken using
the OMA in time-integrated mode. It is clearly evident that during the initial shots of
laser irradiation, with less than six shots only a weak continuous emission spectrum is
observed without any atomic emission lines. This means that the secondary plasma is
not produced until the sixth shot. On the other hand, the emission spectrum taken at
nine shots contains several atomic emission lines together with the enhanced
continuous emission spectrum.
A similar pre-irradiation effect was observed in other samples, such as quartz and
some kinds of stone of which the host element is silicon. However, phenomenon such
as the pre-irradiation effect have never been observed on metal samples in any range
of the pulse energy of laser light.
Fig 4.12. Relationship between the time-integrated emission intensity of the primary plasma and the laser shot number at different laser energies, A for 20 mJ, B for 28 mJ, C for 48 mJ and D. Curve D was obtained in the experiment where the pre-irradiation was caused with 10 shots using 48 mJ pulse energy and after sufficient cooling time the irradiation was resumed at the same position with the same pulse energy of 28 mJ in the surrounding air pressure of 2 Torr
Figure 4.12 shows how the intensity of the primary plasma changes with the shot
number for different pulse energies of the YAG laser. The intensity of the primary
plasma was detected in time-integrated mode. In Fig 4.12, it is evident that when the
pulse energy of the laser light is relatively low, the primary plasma is weak in its
intensity at the beginning of the subsequent irradiation; however, discrete increments
of the primary plasma emission take place at 11 shots for 20 mJ pulse energy and at
eight shots for 28 mJ, and after the increment, the emission increases slowly or
0
10
20
30
40
50
60
70
80
0 2 4 6 8 10 12 14 16 18 20
shot number
prim
ary
plas
ma
inte
nsity
(cou
nts)
20 mJ
28 mJ28 mJ (crater)48 mJ
C
D
B
A A
B
CD

46
remains almost constant. In contrast to this, for 48 mJ pulse energy, from the first shot
the emission intensity reaches a high value and no pre-irradiation effect is observed.
The temporal behavior of the primary plasma was also detected by using a 500 ? load
resistance attached to the photomultiplier. The primary plasma signal started with a
growth time about 50 ns decayed with a time constant of around 200 ns.
Fig 4.13. Relationship between the total emission intensity of the secondary plasma (Si I 288.1 nm) and the laser shot number at different laser energies. These data were obtained
simultaneously with those in Fig 4.12, and notations A, B, C and D have the same meaning as in Fig 4.12. The data taken in surrounding air pressure at 2 Torr
Figure 4.13 shows how the spatially and time-integrated emission of the
secondary plasma changes with the shot number for different pulse energies of the
YAG laser. The data in Figs 4.12 and 4.13 were taken simultaneously using the
experimental setup shown in Fig 4.10. The features of the curves in Fig 4.13 are
similar to those shown in Fig 4.12. However, it should be noted that for the secondary
plasma, no emission takes place before the sudden increment. Also, the sudden
increment occurred with a one or two-shot delay compared to the case for the primary
plasma; namely, for 20 mJ pulse energy, the increment occurs at 13 shots and for 28
mJ it occurs at nine shots. The temporal behavior of the secondary plasma signal was
also detected by using the 500 ? load resistance. The growth time of the signal was
about 500 ns and the decay time was about 2 ? s.
In order to clarify the reason for the pre-irradiation effect, three possible
mechanism were considered; a preheating effect due to the repeated irradiation, a
0
20
40
60
80
100
120
140
0 2 4 6 8 10 12 14 16 18 20
shot number
seco
ndar
y pl
asm
a in
tens
ity (
coun
ts)
20 mJ
28 mJ28 mJ (crater)48 mJ
C
D
B
A
AB
CD

47
confinement effect due to the crater created during the repeated irradiation, and the
effect of optical change in the glass sample, which might increase the absorption
coefficiency against the laser light. The last possibility can be eliminated because the
wavelength of the laser used in this experiment is infrared, 1.06 ? m, and the photon
energy is too low to induce such photochemical reaction in the sample under this kind
of pulse energy. Also, during the pre-irradiation, vaporization takes place from the
sample surface during every shot. Therefore, under the repeated irradiation the
accumulation of such a photochemical could not occur.
In order to clarify whether the preheating effect is the major cause of the pre-
irradiation effect, the following experiment was carried out. The laser radiation was
repeated with a very low repetition rate at the same energy. It was confirmed that even
in such a case almost identical curves were obtained for the relationship between the
emission intensities and the shot numbers. This implies that the thermal process is not
responsible for the pre-irradiation effect.
In order to confirm that the pre-irradiation effect is related to the confinement
effect, due to the crater, another experiment was carried out. The laser irradiation was
set at an energy of 48 mJ and irradiation was repeated up to ten shots, and then
stopped to confirm the clear presence of the crater with a depth of about 3 mm. Then,
the laser irradiation was resumed at the same position with a lower pulse energy of 28
mJ. In this case, no pre-irradiation effect was observed, which is different from the
curves B in Fig 4.10 and 4.11. In other words, both the primary and the secondary
plasma were produced from the first shot, as shown by the curves D in Figs 4.12 and
4.13. This indicates that if the primary plasma is produced in the deep crater, the
threshold laser energy can be considerably reduced by the confinement effect due to
the crater. This confinement effect due to crater was confirmed by another
experiment. A mask made of an aluminum plate (1 mm thickness), which had a hole
with a diameter of 1 mm, was firmly attached to the surface of the glass, and laser
irradiation of 28 mJ was made through the hole of the mask onto the new glass
surface. It was found that both primary and secondary plasma could be generated at
the first shot. Therefore, we can conclude that the pre-irradiation effect is due to the
confinement taking place in the hole or crater. In order to clarify the physical
implications of this confinement, two possible mechanisms were considered: 1)
confinement of the initial fast electron expansion, and 2) confinement of the primary

48
plasma to achieve geometrical focusing of the plasma flow. The key point to be
considered is why the primary plasma emission intensity is enhanced by the
confinement. If the laser pulse energy were fully absorbed by the interaction with the
material, the time-integrated emission intensity of the primary plasma would be
almost the same irrespective of the presence of the confinement, even though the time
behavior of the emission signal would change depending on whether the primary
plasma induces an explosion in the moment or not. However, as shown by curves A
and B in Fig 4.12, the time-integrated emission intensity of the primary plasma is
weak in the pre-irradiation stage. This implies that in this stage only a limited part of
the laser light is absorbed. In fact, the glass sample is basically transparent at the
wavelength of the laser light. We assume that the enhancement of the emission of the
primary plasma by the crater is due to the increment of the absorption of the laser
light. Namely, it is believed that because of the presence of the crater or hole the laser
light is more efficiently absorbed in the initial plasma via inverse bremsstrahlung due
to the suppression of the expansion of the fast electrons ejected from the target;28) the
absorption coefficient of the laser light due to the inverse bremsstrahlung is
proportional to the density of electrons in the initial plasma.29) Once the intense
primary plasma is produced by sufficient absorption, confinement of the
hydrodynamics of the primary plasma motion will take place due to the geometrical
focusing of plasma flow in the crater, and as result the secondary plasma is produced.
In our previous study, we have proposed the shock wave model to explain the
generation of the secondary plasma as follows.9) First, the primary plasma is produced
by the bombardment of the laser light. From the primary plasma, atoms gush out at
high speed. The movement of the gushed atom is interrupted by collision with the
surrounding gas molecules, and stagnation takes place at a certain distance from the
primary plasma. By adiabatic compression, high-temperature plasma is produced. The
most important point of the shock wave model is that the energy for producing the
secondary plasma is supplied in the form of kinetic energy, by which atoms are
excited. Clearly, if the speed of the gushing atoms has less energy, insufficient
compression takes place, and the secondary plasma will not be produced. This
insufficient compression case corresponds to the data plots before the sudden
increment in curves A and B in Fig 4.13, where no emission is observed. Once the
crater depth attains a certain value through repeated irradiation, the confinement effect
due to the wall of the crater takes place and enhances the generation of the intense

49
primary plasma, according to the process described above. Under this condition, if a
strong explosion from the primary plasma takes place and thus, favorable conditions
are provided for forming the secondary plasma, and atoms can gush out from the
primary plasma with sufficiently high speed to form the shock wave. This is how the
primary plasma grows and subsequently the secondary plasma starts to be generated.
It should be noted here that the pre-irradiation effect reported in this paper can be
interpreted well according to our shock wave model, while it basically cannot be
explained satisfactorily by other models such as the electron-ion recombination
process30,31) or electron collision process,32) even though such processes may occur to
some extent during the laser abla tion.
As shown in Figs 4.12 and 4.13, the pre-irradiation effect does not occur when
we use a pulse energy higher than 48 mJ. Therefore, if we use a relatively high-power
pulse energy to generate plasma, the pre-irradiation effect can be completely
eliminated. However, we must select conditions favorable for practical
spectrochemical analysis. As we reported with reducing the laser pulse energy, the ion
production rate decreases; as a result, the background reduces and sensitivity
increases. Therefore, we must employ a laser with a relatively low pulse energy in the
laser-induced shock wave spectroscopy. In such case, the pre-irradiation effect cannot
be neglected when we perform analysis on glass or rock samples.
4.2.4. Conclusion
We have shown in this study that in contrast to metallic samples, a characteristic
pre-irradiation effect is observed on a glass sample when the pulse energy is relatively
low. During the pre-irradiation period, only the primary plasma is observed with
increasing intensity. The generation of secondary plasma takes place only after the
first few laser shots. It is demonstrated in this experiment that the pre-irradiation
effect has its origin in the failure of shock wave formation in the initial laser
irradiation. The occurrence of shock wave and secondary plasma in the shots is shown
to be connected with the creation of a crater on sample surface due to repeated
bombardment on the sample. This gives rise to the much needed confinement effect
for the formation of shock wave and secondary plasma. In addition to explaining the
pre-irradiation effect further confining the shock wave plasma model, this experiment
result also provide the basis for extending the LISPS application to soft sample.
50
Chapter Five
GENERAL CONCLUSION
It is shown that laser induced shock wave plasma spectroscopy method which has
proved highly favorable for spectrochemical analysis of metallic samples, can not be
applied directly to non metallic soft samples. This is explained as a consequence of
the failure in the generation of secondary plasma due to the weakened expulsion of
atoms by the soft surface which tends to absorbs the recoil energy in the form of
surface deformation. Therefore, atoms gushing out from the primary plasma do not
acquire sufficient speed to form a shock wave. It is demonstrated nevertheless that the
presence of sub target behind the soft sample helps to overcome this weakness and
allows the generation of secondary plasma adequate for spectrochemical analysis. The
experimental results obtained in this study, for both low and high pressure
surrounding gases, also offer additional evidence in support of the shock wave model
which explains the mechanism of laser-induced shock wave plasma.
Another interesting and important feature revealed in this study is a characteristic
pre-irradiation effect observed in the case of non metallic hard target when a low
power pulsed laser is used. During this pre-irradiation period, the primary plasma
generated at the initial stage does not develop into a secondary plasma as ordinarily
observed in the metallic case. It is also found that the pre-irradiation effect disappears
as the crater deepens due to repeated initial irradiations. Analysis of the experimental
data clearly indicates that the pre-irradiation effect is characterized by the absence of
shock wave in the surrounding gas. On the contrary, a shock wave is detected in
conjunction with the appearance of secondary plasma after a certain number of
repeated shots on the same spot. It is suggested in this connection that plasma
confinement effect plays the main role in the effective enhancement of the shock
wave generation and hence the appearance of secondary plasma.
In a further experiment employing a mask/artificial crater of appropriate
thickness on the surface of non metallic hard sample, the pre-irradiation effect was
completely eliminated. In addition to confirming the role of plasma confinement in
overcoming the pre-irradiation effect, the experimental result also introduces a useful

51
means to avoid the undesirable damage on the sample surface for laser microprobe
analysis.
In short, we have successfully demonstrated in this study, useful secondary
plasma can be simply generated by applying a sub target behind the non metallic soft
sample and placing a small metallic mask on the surface of non metallic hard sample.
As a result, the LISPS method can be readily extended for highly sensitive and rapid
quantitative analysis to non metallic samples.
52
REFERENCES
1. J.D. Ingle, Jr. and S.R. Crouch: Spectrochemical Analysis, eds. J.D. Ingle, Jr. and
S.R. Crouch (Prentice-Hall, Inc., New Jersey, 1988)
2. L.J. Radziemski and D.A. Cremers: Laser induced Plasma and Applications, eds.
L.J. Radziemski and D.A. Cremers (Marcel Dekker, New York, 1989)
3. J. Hecht: The Laser Guide Book, eds. J. Hecht (McGraw-Hill, Singapore, 1986)
4. F. Brech and L. Cross: Optical Microemission Stimulated by a Ruby Laser, Appl.
Spectrosc. 16 (1962) 59
5. K. Kagawa, M. Ohtani, S. Yokoi and S. Nakajima: Characteristics of the Plasma
Induced by the Bombardment of N2 Laser Pulse at Low Pressures; Spectrochim.
Acta, 39B (1984) 525
6. K. Kagawa, K. Kawai, M. Tani and T. Kobayashi: XeCl Excimer Laser-Induced
Shock Wave Plasma and Its Application to Emission Spectrochemical Analysis;
Appl. Spectrosc. 48 (1994) 198
7. H. Kurniawan, M.O. Tjia, M. Barmawi, S. Yokoi, Y. Kimura and K. Kagawa: A
Time- Resolved Spectroscopic Studies on the Shock Wave Plasma Induced by
the Bombardment of A TEA CO2 Laser; J. Phys. D: Appl. Phys., 28 (1995) 879
8. H. Kurniawan, S. Nakajima, J. E. Batubara, M. Marpaung, M. Okamoto and K.
Kagawa: Laser-Induced Shock Wave Plasma in Glass and Its Application to
Elemental Analysis; Appl. Spectrosc., 49 (1995) 1067
9. H. Kurniawan, Y. Ishikawa, S. Nakajima and K. Kagawa: Characteristics of the
Secondary Plasma Induced by Focusing A 10 mJ XeCl Excimer Laser at Low
Pressures; Appl. Spectrosc., 51 (1997) 1769
10. K. Kagawa and S. Yokoi: Application of the N2 Laser Microprobe
Spectrochemical Analysis; Spectrochim. Acta, B37 (1982) 789
11. M. Tani, H. Kurniawan, H. Ueda, K. Mizukami, K. Kawai and K. Kagawa:
Reflection and Diffraction of Laser Plasma Induced by Bombardment of TEA
CO2 Laser at Low Pressures; Jpn. J. Appl. Phys., 32 , 9A (1993) 3838
12. W.S. Budi, H. Suyanto, H. Kurniawan, M. O. Tjia and K. Kagawa: Shock
Excitation and Cooling Stage in the Laser Plasma Induced by Q-Switch Nd-
YAG Laser at Low Pressures; Appl. Spectrosc., 53 (1999) 719

53
13. M. Marpaung, M. Pardede, R. Hedwig, H. Kurniawan, T.J. Lie and K. Kagawa:
Coincidence of Density Jump and Plasma Emission Front Induced by TEA CO2
Laser Bombardment at Low and High Pressures; Jpn. J. Appl. Phys., 39, 6B
(2000) 601
14. R.E. Russo: Laser Ablation ; Appl. Spectrosc., 49, 9 (1995) 14A
15. N. Omenetto: Role of Lasers in Analytical Atomic Spectroscopy: Where, When
and Why – Plenary Lecture; J. Anal. Atomic Spectrom., 13 (1998) 385
16. J.W. Robinson: Atomic Spectroscopy, eds. J.W. Robinson (Marcel Dekker, New
York, 1996)
17. K. Kagawa and H. Kurniawan: Laser-Induced Shock Wave Plasma
Spectroscopy; Trends in Appl. Spectrosc., 2 (1998) 1
18. D.A. Cremers and L.J. Radziemski: Laser Spectroscopy and Its Application, eds.
L.J. Radziemski, R.W. Solarz and J.A. Paisner (Marcel Dekker, New York, 1987)
19. T. Karlinski and G. Johnson: Developments in Atomic Plasma Spectrochemical
Analysis, eds. R.M. Barnes (Heyden and San Ltd., 1981)
20. M.M. Suliyanti, R. Hedwig, H. Kurniawan and K. Kagawa: The Role of Sub-
Target in the TEA CO2 Laser-Induced Shock-Wave Plasma; Jpn. J. Appl. Phys.,
37, 12A (1998) 6628
21. L.I. Sedov: Similarity and Dimensional Method in Mechanics (Academic Press,
New York and London, 1959)
22. M. Tani, K. Mizukami, H. Ueda, Y. Dehuchi, Y. Takagi and K. Kagawa:
Emission Spectrochemical Analysis of Fluorine in Biological Samples With a
Shock Wave Plasma Induced by TEA CO2 Laser, J. Spectrosc. Soc. Jpn., 41
(1992) 265
23. J.H. Yoo, S.H. Jeong, R. Greif and R.E. Russo: Explosive Change in Crater
Properties During High Power Nanosecond Laser Ablation of Silicon; J. Appl.
Phys., 88 , 3 (2000) 1638
24. O.V. Barisov, X.L. Mao and R.E. Russo: Effects of Crater Development on
Fractionation and Signal Intensity During Laser Ablation Inductively Coupled
Plasma Mass Spectrometry; Spectrochim. Acta, B55 (2000) 1693
25. H. Kurniawan, T.J. Lie, N. Idris, M.O. Tjia, M. Ueda and K. Kagawa: Detection
of the Density Jump in the Laser-Induced Shock Wave Plasma Using Low
energy Nd:YAG Laser at Low Pressures of Air; J. Spectrosc. Soc. Jpn., 50, 1
(2001) 13

54
26. H. Kurniawan, K. Lahna, T.J. Lie, K. Kagawa and M.O. Tjia: Detection of
Density Jump in Laser-Induced Shock Wave Plasma Using a Rainbow
Refractometer; Appl. Spectrosc., 55, 1 (2001) 92
27. A.M. Marpaung. H. Kurniawan, M.O. Tjia and K. Kagawa: Comprehensive Study
on the Pressure Dependence of Shock Wave Plasma Generation Under TEA
CO2 Laser Bombardment on Metal Sample ; J. Phys. D: Appl. Phys., 34 (2001)
758
28. X.L. Mao, W.T. Chan, M.A. Shannon and R.E. Russo: Plasma Shielding During
Picosecond Laser Sampling of Solid Materials by Ablation in He versus Ar
Atmosphere; J. Appl. Phys., 74 (1993) 4915
29. A.F. Gibson, T.P. Hughes and C.L.M. Ireland: CO2 Laser Generation of Plasma
for Spectroscopy and Spectrochemical Analysis; J. Phys. D 4 (1971) 1527
30. W. T. Silvast, L. H. Szeto and O. R. Wood II: Recombination Lasers in
Expanding CO2 Laser-Produced Plasm as of Argon, Krypton and Xenon; Appl.
Phys. Lett., 31 (1977) p. 334
31. J.M. Green, W.T. Silfvast and O.R. Wood: Evolution of A CO2-Laser-Produced
Cadmium Plasma ; J. Appl. Phys., 48 (1977) 2753
32. D. B. Geohegan: Diagnostics and Characteristics of Pulsed Laser Deposition
Laser Plasmas, in Pulsed Laser Deposition of Thin Films; (D. B. Chrisey and G.
K. Hubler, Eds, John Wiley & Sons, New York, 1994)
33. C.W. Ng, W.F. Ho, and N.H. Cheung: Spectrochemical Analysis of Liquids
Using Laser-Induced Plasma Emission: Effects of Laser Wavelength on Plasma
Properties; Appl. Spectrosc., 51, 7 (1997) 976
34. J.H. Yoo, S.H. Jeong, R. Greif, and R.E. Russo: Explosive Change in Crater
Properties During High Power Nanosecond Laser Ablation of Silicon; J. Appl.
Phys., 88 , 3 (2000) 1638
35. K. Kagawa, Y. Matsuda, S. Yokoi and S. Nakajima: Nitrogen Laser Ablation
Analysis Using the Primary Plasmas a Standard for the Qualification of
Vaporized Atoms; J. Anal. At. Spectrom., 3 (1998) 415

55
LIST OF SCIENTIFIC PUBLICATIONS
International Publications
1. M.M. Suliyanti, R. Hedwig, H. Kurniawan, and K. Kagawa: The Role of a sub-
target in the TEA CO2 Laser-Induced Shock Wave Plasma, Jpn. J. Appl.
Phys. 37, 12 (1998) pp. 6628-6632
2. K. Kagawa, T.J. Lie, R. Hedwig, S. Nur Abdulmajid, M.M. Suliyanti, and H.
Kurniawan: Sub Target Effect on Laser Plasma Generated by Transversely
Excited Atmospheric CO2 Laser at Atmospheric Gas Pressures, Jpn. J. Appl.
Phys., 39 , 1, 5A (2000) pp. 2643-2646
3. A.M. Marpaung, M. Pardede, R. Hedwig, H. Kurniawan, and K. Kagawa:
Coincidence of Density Jump and the Front of Plasma Emission Induced by
TEA CO2 Laser Bombardment at Low and High Pressures, Jpn. J. Appl. Phys.,
39, 6B (2000) pp. L601-L603
4. A.M. Marpaung, R. Hedwig, M. Pardede, H. Kurniawan, M.O. Tjia, and K.
Kagawa: Shock Wave Plasma Induced by TEA CO2 Bombardment on Glass
Samples at High Pressures, Spectrochim. Acta Part B; At. Spectrom. B55 , 10
(2000) pp. 1591-1599
5. R. Hedwig, H. Kurniawan, and K. Kagawa: Confinement Effect of Primary
Plasma on Glass Sample Induced by Irradiation of Nd-YAG Laser at Low
Pressures, Jpn. J. Appl. Phys. 40 10 (2001) pp. 5938-5941
6. R. Hedwig, M.O. Tjia, K. Kagawa, and H. Kurniawan: Confinement Effect in
Enhancing Shock Wave Plasma Generation at Low Pressure by TEA CO2 Laser
Bombardment on Quartz Sample, Spectrochim. Acta Part B (in submission)
International Conferences
1. W.S. Budi, Rinda, M. Pardede, H. Kurniawan, and K. Kagawa: Effect of
Focusing of Laser Irradiation on Spectral Emission of Laser-Induced Shock -
wave Plasma at Reduced Air Pressure, Association of Asia Pacific Physics
Conference, Yogyakarta, Indonesia (1998)
2. R. Hedwig, H. Kurniawan, M.M. Suliyanti, S. Nur, and K. Kagawa: The Role of
Sub-target for Soft Sample in Laser-Induced Shock Wave Plasma, International

56
Laser Sensing Symposium and 20th Japanese Laser Sensing Symposium, Fukui,
Japan (1999), proceeding pp. 81-84
3. M.M. Suliyanti, R. Hedwig, and H. Kurniawan: Emission Spectrochemical
Analysis of Gold Alloy Using Primary Pla sma Standardization , International
Conference on Electrical, Electronics, Communication and Information, CECI
2001, March 7-8, Jakarta, Indonesia, Proc., pp. OL1-OL5
National Publication
1. Rinda, S.P. Liawatimena, dan S. Lukas: Plotter Berbasis Mikrokontroler, Jurnal
Teknik Komputer, 1 , 1 (1995)
2. W.S. Budi, M. Pardede, H. Kurniawan, Rinda, and K. Kagawa: Effect of
Focusing of Laser Irradiation on Spectral Emission of Laser Induced Shock
Wave Plasma at Reduced Air Pressure, Physics Journal – Indonesia Physical
Society, 2 , 1 (1999) pp. 84-91
3. R. Hedwig, T.J. Lie, and H. Kurniawan: Comparison of Confinement Effect in
Enhancing Shock Wave Plasma Generation at Low Pressure between TEA CO2
and Nd-YAG Lasers on Quartz Sample , Physics Journal – Indonesia Physical
Society, A5, 0203 (2002) pp. 1-6
National Conference
1. W.S. Budi, W.T. Baskoro, and Rinda: Pengaruh Ketepatan Pemfokusan pada
Ukuran Crater dan Massa Terevaporasi Akibat Iradiasi Laser Nd-YAG ,
Prociding Seminar Nasional Fisika Terapan dan Lingkungan, 1997
2. M.M. Suliyanti dan Rinda: Peranan Sub Target Dalam Pembangkitan
Gelombang Kejut Plasma pada Target Lunak, Prociding Seminar Nasional
Fisika Terapan dan Lingkungan, 1997
3. H. Kurniawan, R. Hedwig, K. Kagawa, and M.O. Tjia: Characteristics of Laser-
Induced Shock Wave Plasma generated at 0.5 Torr, XVIII National Physics
Conference, Serpong, Indonesia, 2000
4. H. Kurniawan, T.J. Lie, R. Hedwig, and K. Kagawa: A Short Summary of Time-
Resolved Spectroscopic Study in the Laser Plasma Generated by Irradiation of
High Power Short Pulse Laser on Metal Samples Under Reduced Gas Pressure,
ICOLA 2002 Symposium (in submission)

57
CURRICULUM VITAE
Author Name : Rinda HEDWIG
Date and Place of Birth : June, 20 th 1973 in Surabaya
Gender : Female
Home Address : Tomang Tinggi IV No. 10,
Gg. Buntu RT 04/06, Jakarta 11440
Phone : +62 21 5681885 / +62 818 195976
Email Address : [email protected]
Personal Homepage : http://www.geocities.com/marinda7899
Office Address : Bina Nusantara University,
Hardware Laboratory,
KH. Syahdan 9, Jakarta 11480
Office Phone/Fax : +62 21 5345830 / +62 21 5300244
Professional Homepages : http://www.geocities.com/spectrochemical
http://www.binus.ac.id
http://www.geocities.com/pkm_binus
http://www.geocities.com/klpkm
Education:
??Computer Science degree in Computer Engineering, STMIK Bina
Nusantara, Jakarta, year 1995
??Master of Science degree in Opto-Electrotechniques and Laser
Applications, Graduate Program in Opto -Electrotechniques and Laser
Applications, University of Indonesia, Jakarta, year 1998