Embed Size (px)
Citation preview

Contributions In-Aidand Development of Fees
Utility Financial SolutionsMark Beauchamp, CPA, CMA, MBA
President616-393-9722

Contribution in Aid Polices Many policies are not based on
economics but on policies that connect customer’s without considering the financial impact to existing rate payers.
Examples: Investing $15,000 to connect a residential
customer Using a times revenue policy for a 15 mW
Ethanol plant Not contributing to expansion of hospital
that will increase electrical use

Example of Electric Line Extension Policies
Based on Annual Revenues Some charge the difference
between underground and overhead
Some contribute a per foot maximum amount
Some provide it free of charge

Industry Trend Many Utilities are moving toward policies
that places a value on a customer Considers the contribution margin of the
customer Risk of investing money to serve the customer
Objective Investment to connect customer is a good
investment for the utility and will benefit existing customers of the system

Customers Contribution per kWh
Commercial
Residential - Rate 20
Large Power - Rate 75
Test Customer Number Two
Test Customer Number Three
Test Customer Number Four
Revenues 2,155,045$ 8,368,750$ 3,391,683$ 186,043$ 775,015$ 2,035,237$ Total Variable Expenses 1,390,719 6,093,946 2,518,204 150,175 613,535 1,876,713 Fixed Cost Contribution 764,326$ 2,274,804$ 873,479$ 35,869$ 161,480$ 158,524$
kWh's 29,838,019$ 135,446,507 52,909,064 3,424,873 17,355,582 56,503,245 Contribution per kWh 0.0256$ 0.0168$ 0.0165$ 0.0105$ 0.0093$ 0.0028$ Load Factor 31.25% 55.20% 59.44% 86.00%

Utility Investment per kWh
Year CommercialResidential -
Rate 20Large Power -
Rate 75Test Customer Number Two
Test Customer Number Three
Test Customer Number Four
1 0.0256 0.0168 0.0165 0.0105 0.0093 0.0028 2 0.0256 0.0168 0.0165 0.0105 0.0093 0.0028 3 0.0256 0.0168 0.0165 0.0105 0.0093 0.0028 4 0.0256 0.0168 5 0.0256 0.0168 6 0.0168 7 0.0168
Discount Rate 7.0% 7.0% 7.0% 7.0% 7.0% 7.0%
Utility Investment per kWh $0.11 $0.091 $0.043 $0.027 $0.024 $0.007Average Annual Class Usage 10,056 Average Investment per Home $910.15Load Factor 31.25% 55.20% 59.44% 86.00%
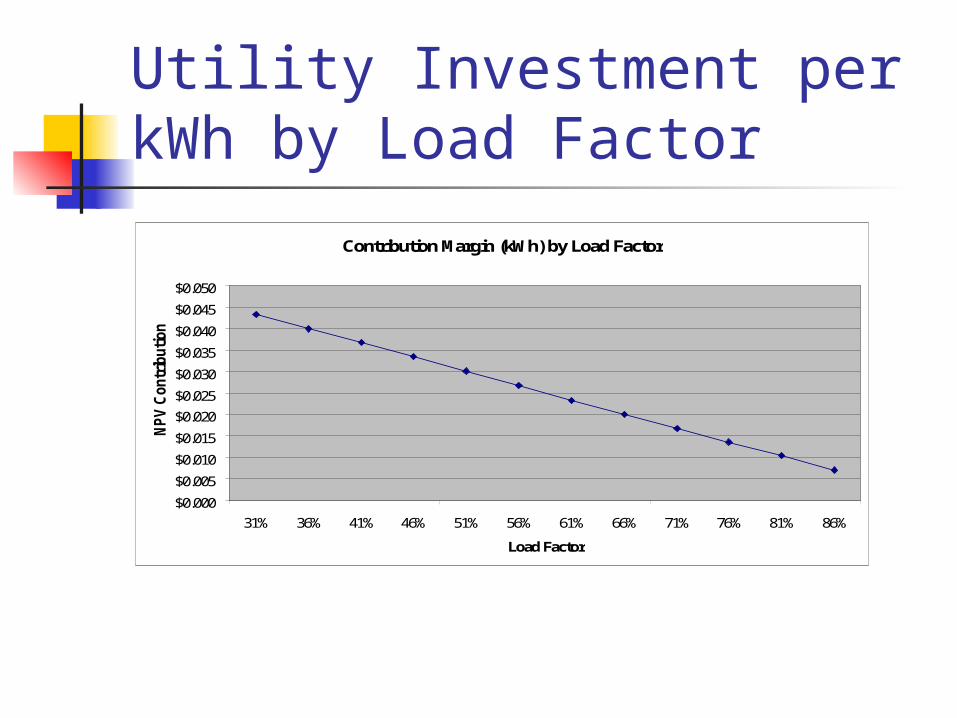
Utility Investment per kWh by Load Factor
Contribution Margin (kWh) by Load Factor
$0.000
$0.005
$0.010
$0.015
$0.020
$0.025
$0.030
$0.035
$0.040
$0.045
$0.050
31% 36% 41% 46% 51% 56% 61% 66% 71% 76% 81% 86%
Load Factor
NPV C
ontr
ibution p
er

Contribution Margin - Subdivision
Year
Subdivision Development -
Three Year Phase In
Subdivision Development -
Five Year Phase In
1 0.0055 0.0034 2 0.0112 0.0067 3 0.0168 0.0101 4 0.0168 0.0134 5 0.0168 0.0168 6 0.0168 0.0168 7 0.0168 0.0168
Discount Rate 7.0% 7.0%
Utility Investment per kWh $0.075 $0.061Average Annual Class Usage 10,056 10,056 Average Investment per Home $755.28 $614.47

Key Assumptions Discount Rate
Typically equal to Rate of Return Target for Utility
Length of time to recover investment Based on perceived
risk of investment Residential 5-9
years Commercial 4-5
years Industrial 3 years

Perceived Risks
Company going out of business Facility burning down Co-Generation Wind Mills/Solar/Fuel Cells Alternative fuels

Fees
NSF Check Charge Late Payment Charges Disconnect/Reconnect Truck Rental Charges Pole Attachment Fees

Biggest Problem with Fees
Once set not looked at again for years Results in drastic changes
Set-up a program and set fees annually

Pole Attachment Fees Cable TV Companies were typically subsidized by the
electric utility and allocated the cost of 1 foot in the center of the pole - Annual rates were typically under $5.00 per year
Telecommunications Act allows utilities to remove the subsidy and charge the common costs of the pole to all attachments – Annual rates range from $15.00 - $30.00
FCC has a formula to help determine the pole attachment fees
APPA has a program you can purchase to determine fee Communication companies have substantially increased
the number of attachments to utility poles Review and audit the number of attachments

Late Payment Fees Can vary by utility – Need to have
sufficient incentive for customers to pay on time Some utilities have a fixed Late Payment
charges that does not vary Some utilities use discounts if bill paid on time
– i.e. 10% discount Discounts cause utility to lose money when discounts
are applied to fuel adjustment charges Most common are:
10% late payment charged only once on outstanding balance
1.5% - 2.0% late payment charges on outstanding balances

Calculation of Disconnect/ Reconnect Fees Issues:
Should you charge customers when doing electrical work on their homes?
Should you charge customer for disconnection when initiated by utility?
Normal Hours After HoursPersonnel needed 1 1Pay - at overtime $18.96 $25.31Average length of time 0.62 2.00 Total labor and benefits $16.13 $50.61Cost of materials $1.00 $1.00Vehicle cost per trip $11.30 $11.30Overhead $2.84 $6.29Margin $4.69 $10.38Total Fee per connection $35.97 $79.58
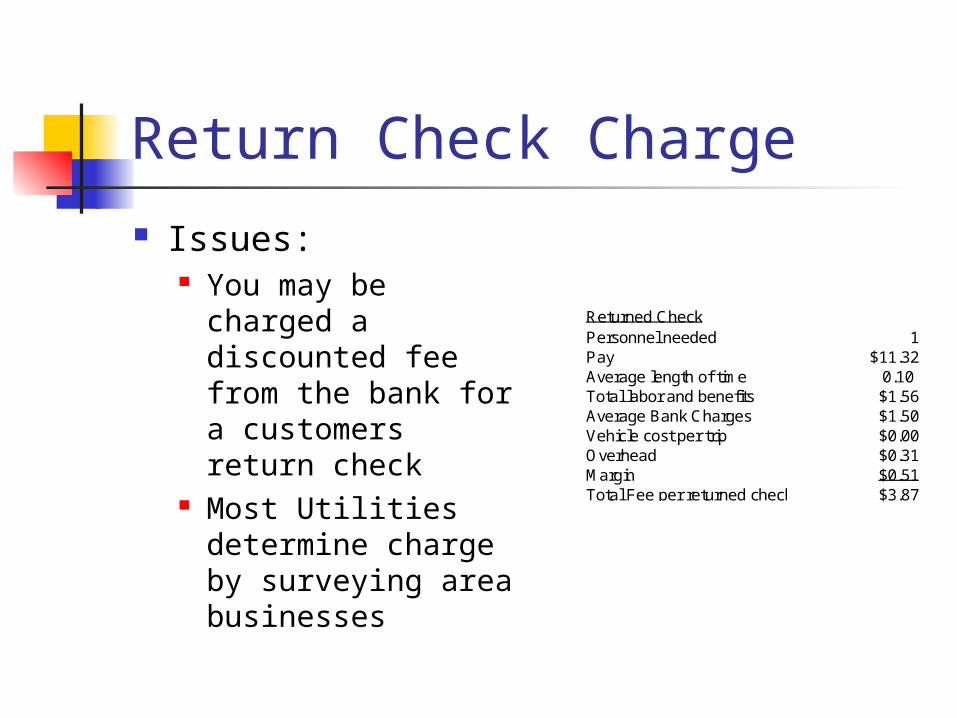
Return Check Charge Issues:
You may be charged a discounted fee from the bank for a customers return check
Most Utilities determine charge by surveying area businesses
Returned CheckPersonnel needed 1Pay $11.32Average length of time 0.10 Total labor and benefits $1.56Average Bank Charges $1.50Vehicle cost per trip $0.00Overhead $0.31Margin $0.51Total Fee per returned check $3.87

Vehicle Fees
Step one: Calculate per hour costs for Annual/Fixed costs
Step two: Calculate per mile costs for variable costs
Step Three: Add Administrative/Overhead Costs
A Number of Assumptions Must be Used

Vehicle Rental Fees – Step One:
Line No. Annual Expenses1 Cost of Vehicle $18,000 Annual Costs2 Life of Vehicle - Years 43 Return on Investment 6.5%
Depreciation Expense Line 1 divided by line 2 $4,500Return on Investment Line 1 times line 3 1,170 Insurance 4% of Line 1 720 Total Annual Costs 6,390$
Number of hours vechicle operating per year Review of operations 1,000
Annual Cost per Hour 6.39$

Vehicle Rental Fees – Step Two
Line No. Variable per Mile Expenses1 Gas Price per Gallon 2.00$ 2 Mile per Gallon 153 Oil $30/3000 miles'4 Repairs 5% of original cost = $9005 Annual Miles for Vehicle 5,000 6 Miles per trip
Gas Cost Line 1 divided by line 2 0.13$ Oil Costs $30 divided by 3000 miles 0.01Repair Costs Line 4 divided by line 5 0.18 Total Cost per mile 0.32$
Miles per trip Estimated 15 4.85$

Vehicle Rental Fee
Annual Cost per Hour 6.39$ Variable Cost per Hour 4.85 Total Cost per Hour 11.24$
Administrative Cost 24% 2.70 Total Cost per Hour 13.94$

Pricing of Fees and Charges
Ralph Carlson
APPA Business and Financial Conference
Minneapolis, MinnesotaSeptember 17-20, 2006

SMUD Fee Policy
Reflect costs incurred Updated each year Average costs for three most
recent years Proposed changes reviewed by
Rates Policy and Procedures Committee

Categories of Charges
Connection Charges Line Extensions Basic Service Facilities
Special Facilities Charges Non-standard (value-added)
equipment Deposits and Fees
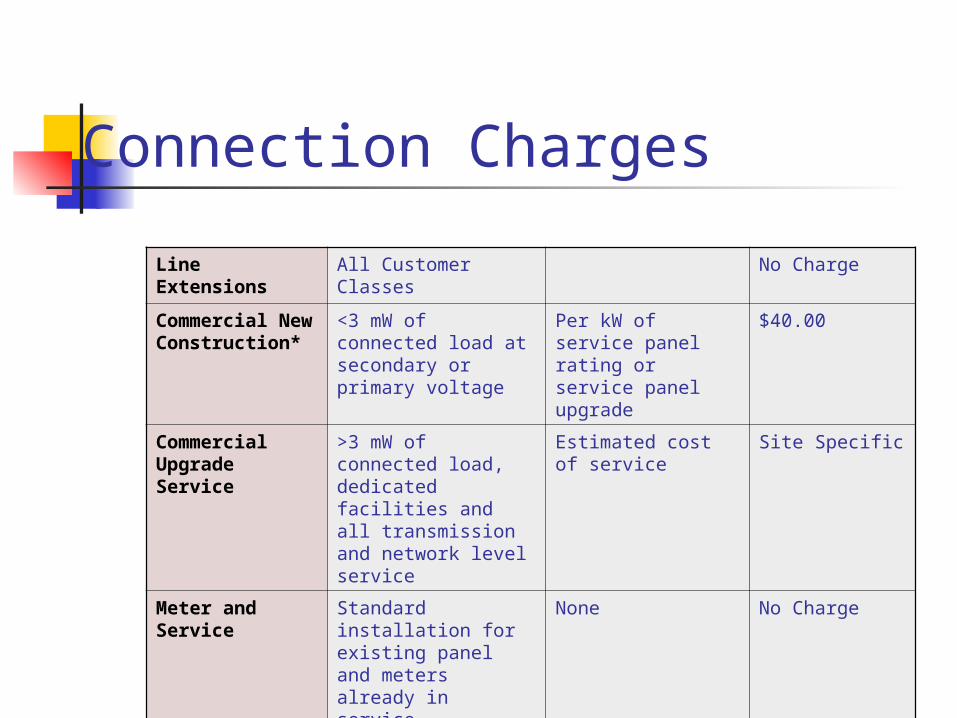
Connection Charges
Line Extensions
All Customer Classes No Charge
Commercial New Construction*
<3 mW of connected load at secondary or primary voltage
Per kW of service panel rating or service panel upgrade
$40.00
Commercial Upgrade Service
>3 mW of connected load, dedicated facilities and all transmission and network level service
Estimated cost of service
Site Specific
Meter and Service
Standard installation for existing panel and meters already in service
None No Charge
Residential New Construction
All new residential Per new residential lot
$1,050.00

Special FacilitiesOption 1 Option 2 Option 3
Monthly Lease with Advance
10-year Renewable Lease
One-Time Payment
Average Life
Minimum Advance
per $1,000
Monthly Cost per $1,000
Cost at beginning of each 10th year per
$1,000
Cost per $1,000
10-14 $200 $24.15 $2,148 $4,375
15-19 $150 $17.25 $1,534 $3125
20+ $100 $12.94 $1,151 $2,344
Transmission 20+
$100 $11.64 $1,036 $2,109