Embed Size (px)
Citation preview

Contribution of benthic invertebrate biological traits to the survey and restoration of stream
ecological quality
Cédric Mondy1,2, Nele Schuwirth2 & Philippe Usseglio-Polatera1
1: Laboratoire Interdisciplinaire des Environnements Continentaux (LIEC), CNRS UMR 7360, Université de Lorraine, Metz, France
2: Eawag – Swiss Federal Institute of Aquatic Science and Technology, Dübendorf, Switzerland

P. 2 Cédric Mondy ([email protected])
The Water Framework Directive (WFD: European Council 2000)
European Council. Directive 2000/60/EC. Office for official publications of the European Communities, Brussels 2000
Three steps: 1- Assessing the actual ecological quality of water bodies 2- Identifying the stressors that could have led to ecological impairment 3- Predicting which management options could potentially lead to the best improvement of ecological quality

P. 3 Cédric Mondy ([email protected])
Mondy C.P., Villeneuve B., Archaimbault V. & Usseglio-Polatera P. (2012). Ecological Indicators 18, 452–467.
Level of catchment anthropization
low moderate high
Step 1- Assessing the actual ecological quality
I2M2
Shannon diversity
ASPT
Polyvoltinism
Ovoviviparity
Taxonomic richness
I2M2 does not give specific information on the nature
of the main pressures involved in ecological
impairment

P. 4
Step 2- Identifying the stressors
disturbance
before after
catc
hm
en
t re
ach
H
ER
different trait combinations in communities

Cédric Mondy ([email protected]) P. 5
Water quality Habitat quality
WQ1 – Organic matter HD1 – Transportation facilities
WQ2 – Nitrogen compounds HD2 – Riverine vegetation
WQ3 – Nitrates HD3 − Urbanization (100m)
WQ4 – Phosphorous compounds HD4 – Clogging risk
WQ5 – Suspended matter HD5 – Hydrological instability
WQ6 – Acidification HD6 – Straightening
WQ7 – Mineral micropollutants
WQ8 – Pesticides
WQ9 – PAH
WQ10 – Organic micropollutants
Risk level = two-class system ‘low’ (High or Good) vs.
‘significant’ (Moderate, Poor or Bad)
216 trait-based metrics
Trait category relative use Functional composition Functional richness and diversity Specialization and niche overlap indices SPEAR indices
For each pressure category, built a Conditional Tree Forest
model (CTF) has been built: Risk level ~ trait-based metrics
Mondy C.P. & Usseglio-Polatera P. (2013). Science of The Total Environment 461–462, 750–760.
Step 2- Identifying the stressors

P. 6
test data ‘out of bag’ (OOB) data = learning data not taken into account for a given tree of the forest (37%)
Random models AUC
Good models
Poor models
Step 2- Identifying the stressors

Cédric Mondy ([email protected])
Riverine Decreasing Food type Dead plants ↓
vegetation litter inputs Living microphytes ↑
impairment Substrate Macrophytes ↑
Organic litter ↓
Increasing Temperature Psychrophilic ↓
irradiation Eurythermic ↑
Transversal River channel ↓
distribution Lake ↑
Longitudinal Crenon ↓
distribution Metapotamon ↑
P. 7
Mondy C.P. & Usseglio-Polatera P. (2013). Science of The Total Environment 461–462, 750–760.
Trait response predictions
X X X
Step 2- Identifying the stressors

Trait response predictions
P. 8 Cédric Mondy ([email protected])
Pesticides Increasing toxicity SPEAR SPEARpesticides II (%S) ↓
SPEARpesticides V (mean
community sensitivity) ↓
Resistance and Aquatic Larvae ↓
resilience stages Adults ↑
potential Dispersal Aquatic passive ↑
Aerial active ↓
Voltinism Semivoltine ↓
Plurivoltine ↑
Mondy C.P. & Usseglio-Polatera P. (2013). Science of The Total Environment 461–462, 750–760.
Step 2- Identifying the stressors

P. 9 Cédric Mondy ([email protected])
Mondy C.P. & Usseglio-Polatera P. (2013). Science of The Total Environment 461–462, 750–760.
Step 2- Identifying the stressors

P. 10 Cédric Mondy ([email protected])
Step 3- Predicting best management options
Requirements: • Modelling benthic invertebrate
dynamics • Predicting changes in biomass
dynamics in response to changes in environmental conditions
Best management/restoration option: Stream management option (e.g. upgrading of WWTP, change in agricultural practices, hydromorphological restoration) that would lead to the highest level of ecological quality improvement for a given amount of investment.
On which pressure should we focus the effort?
P. 11 Cédric Mondy ([email protected])
Formulate dynamic food web model based on mass balances, use stoichiometry to bound yields of consumption rates
w,wdt
d
θ
Brν
B
Differential equations for the biomasses of all
the taxa and of organic matter
B = (B1,…,Bn) [gDM/m]
stoichiometric coefficients ν = {νij}
process rates r = (r1,…,rm) [gDM/m2/a], which
depend on parameters θ
Schuwirth N & Reichert P. Ecology 2013;94:368–79
“Streambugs model”
Step 3- Predicting best management options

P. 12
Schuwirth N & Reichert P. Ecology 2013;94:368–79
Cédric Mondy ([email protected])
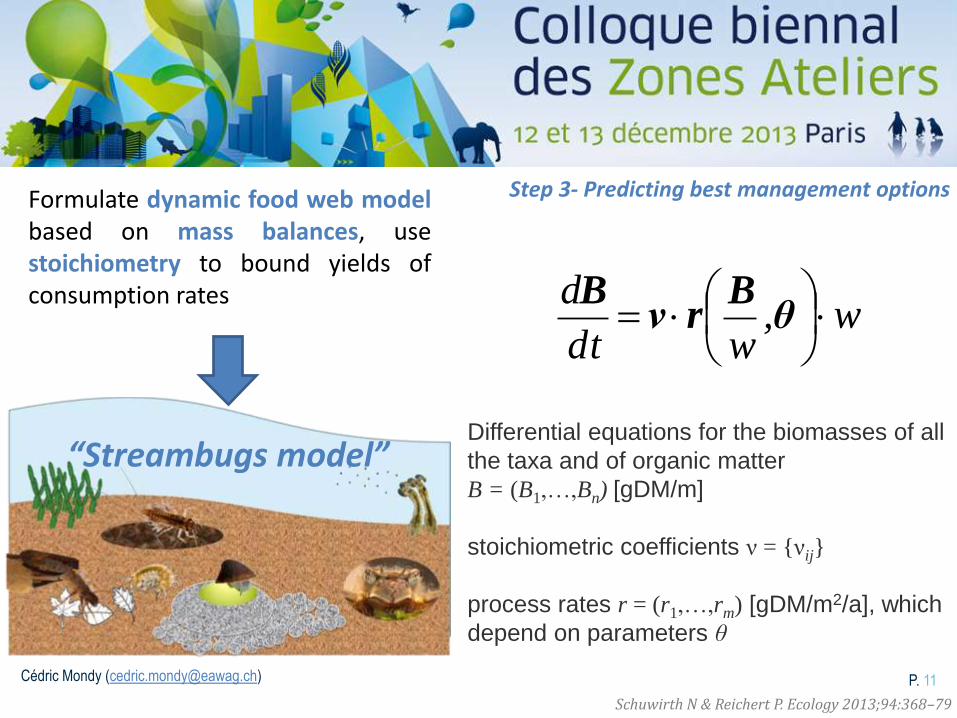
Step 3- Predicting best management options
P. 13
Schuwirth N & Reichert P. Ecology 2013;94:368–79
Cédric Mondy ([email protected])
0
10
20Temperature
0
50
100
Discharge
Floo
ds
Mortality
Step 3- Predicting best management options
(m3)
(° C
els
ius)
P. 14 Cédric Mondy ([email protected])
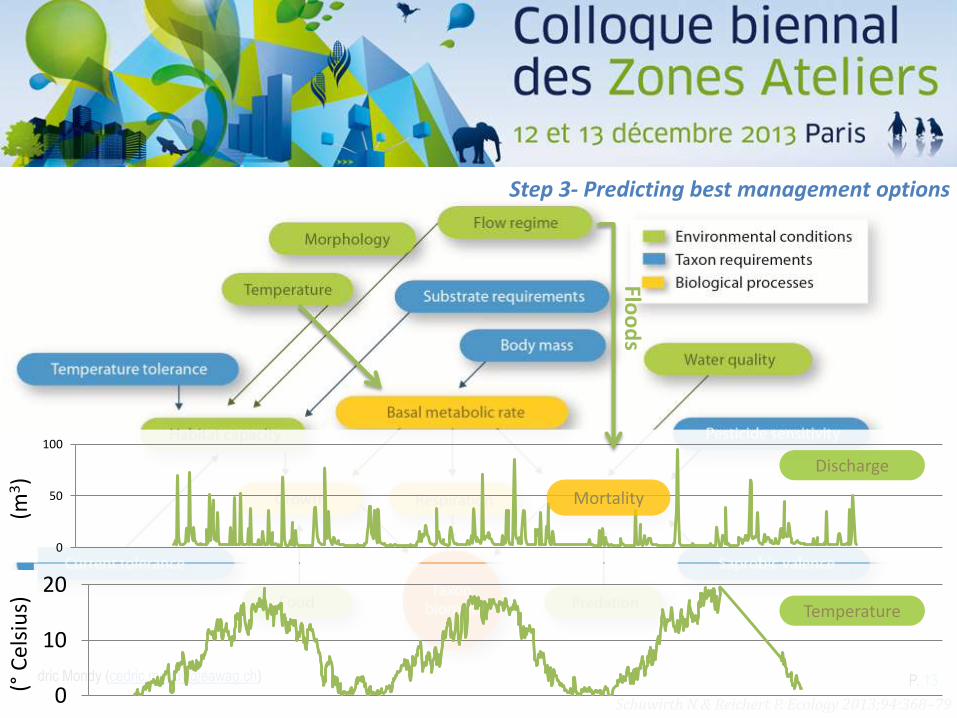
Initial parameter set:
Pretty good performance of the Streambugs model
Under/over-estimate
some taxa
Lack to explain some abundances changes
Step 3- Predicting best management options
Measured floods
Observed biomass
Predicted biomass

P. 15
Step 3- Predicting best management options Baetis
Further model development should: • take into account parameter
uncertainty

P. 16
Step 3- Predicting best management options
marginal prior (dashed lines) and posterior (solid lines with grey shading) parameter distributions; the posterior resulting from conditioning with the data
Schuwirth N & Reichert P. Ecology 2013;94:368–79
Further model development should: • take into account parameter
uncertainty • learn from data about
parameters (Bayesian inference)
• use other traits

P. 17
Baetis
Further model development should: • take into account parameter
uncertainty • learn from data about
parameters (Bayesian inference)
• use other traits • be tested and calibrated in
other streams subjected to other pressure conditions
• Scenario analysis
Step 3- Predicting best management options

P. 18
Conclusions
Traits can improve: - ecological assessment - stressor identification - ecosystem forecasting Further works: - improving our understanding and description of driving processes - extending the model to other relevant processes (dispersal, emergence…) - multi-criteria decision analysis taking into account ecological, economic, and societal endpoints


![Long term dynamics of macro-invertebrate biological traits with climate change [Alexander Milner]](https://img.dokumen.tips/doc/110x75/555ca719d8b42ab2358b4a4a/long-term-dynamics-of-macro-invertebrate-biological-traits-with-climate-change-alexander-milner.jpg)


![macroinvertebrate is the term used for invertebrate fauna ... · A [benthic] macroinvertebrate is the term used for invertebrate fauna that can be captured by a 500-‐µm net or](https://img.dokumen.tips/doc/110x75/5f927494dae45a5acc3453f3/macroinvertebrate-is-the-term-used-for-invertebrate-fauna-a-benthic-macroinvertebrate.jpg)