Embed Size (px)
Citation preview
Neuroradiology (1992) 34:184-189 Neuro radiology �9 Springer-Verlag 1992
Contrast behavior between microadenoma and normal pituitary gland after gadolinium injection as a function of time at 1.5 T T. Stadnik 1 , A . S tevenaert 2, A . B e c k e r s 3, D . Van H e r z e l e 1 , R. Luypaert 1 , T. Buissere t 1 , and M. Os teaux t
1 Department of Radiology and Medical Imaging, University Hospital V. U. B., Brussels, Belgium 2 Department of Neurosurgery and 3 Department of Endocrinology, University Hospital of Liege, Domaine Universitaire du Sart Tilman, Liege, Belgium
Summary. The behavior of contrast enhancement be- tween a microadenoma and the normal pituitary gland after gadolinium injection was evaluated in 12 operatively confirmed cases using a repetitive sequence of four coro- nal Tl-weighted spin echo series (T1 SE) (continuous ac- quisition, TR = 400 ms), followed by conventional coro- nal T1 SE (TR = 600 ms) and a three-dimensional fast low-angle shot sequence. The first and second acquisitions were useful with respect to delayed scans only in 3 cases (25 %). Nevertheless, in these cases confident diagnosis could also be made on pre-contrast studies, which dimin- ishes the real advantage of this finding. For a 1.5 T MRI unit we advocate starting with coronal T1 SE 30 s after a rapid injection of gadolinium.
K e y words: Magnetic resonance imaging - Contrast media - Pituitary neoplasms
High-resolution high-field magnetic resonance imaging (MRI) is widely accepted as the most sensitive method for imaging pituitary microadenomas. At 1.5 T, noncontrast MRI detects microadenomas with a sensitivity of 7 1 % - 100 % [1-4]. Previous studies suggest improvement in le- sion detection after gadolinium (Gd) injection [5-9]. The importance of acquiring images rapidly has been stressed for both computed tomography (CT) studies [10, 11] and Gd-enhanced Tl-weighted MRI [6]. This study specifi- cally evaluates the differential enhancement of the nor- mal pituitary gland and the microadenoma as a function of time after Gd injection. The utility of fast acquisition Gd- MRI in the detection of microadenomas is also assessed.
Materials and m e t h o d s
Twenty-five patients with clinical and/or CT signs of possible pituitary microadenoma were evaluated by MRI between April 1988 and September 1989, using the follow-
Offprint requests to: T. Stadnik
ing protocol. All MRI examinations were performed on a 1.5 T system (Magnetom Siemens) using a 22 cm field of vision (FOV) and a circularly polarized head coil. In all cases preliminary noncontrast MRI was performed using coronal Tl-weighted spin echo (SE) (TR/TE/excitations = 600/15/4), coronal three-dimensional (3D) fast low- angle shot (FLASH) (70/6/1) and two optional sequences: sagittal Tl-weighted SE (600/10/2) and coronal long TR SE (2200-2500/22,90/2); 0.3 ml/kg of Gd-Dota (Guerbet) was then injected in 30 s. Immediately after injection, i. e., 30 s after the start of the Gd injection, a repetitive se- quence of four coronal Tl-weighted SE series was ob- tained (400/10/2). The data were acquired continuously during 14.7 min (3.41 m i n x 4). Image processing took place only after the end of the fourth acquisition. There- after, conventional coronal Tl-weighted SE (600/15/4) (acquisition time 10.24 min) and coronal 3D FLASH (70/6/1) (acquisition time 19.1 min) were performed. Slice thickness was 3 mm for all SE sequences and 1.5 mm for 3D FLASH series. The 3D studies were performed using a 40 ~ flip angle and a 96 mm 3D volume.
The location of any focal abnormality was determined prospectively and preoperatively by consensus of two neuroradiologists following the algorithm given in Table 1. To date, 12 patients have undergone trans-sphe- noidal exploration by a single neurosurgeon. This paper addresses only the data from these 12 documented cases. The microadenoma was found during surgery in all 12 cases. The location determined at surgery was corre- lated with that diagnosed by MRI (Table 1). A focal ab- normality on MRI was considered as true positive (TP)
Table 1. Algorithm for describing a focal abnormality
1. The location was defined dividing the antehypophysis into 18 segments
2. The contrast between the microadenoma and the pituitary was calculated using the following equation: SImi- SIpi/SInoise, where SImi = signal intensity of the microadenoma, SIpi = signal intensity of the pituitary, SInoise = signal intensity of the noise

185
T a b l e 2. Overview of true and false positive values for 12 microadenomas confirmed by surgery
Sequence Coronal Coronal Sagittal Coronal Coronal l s t corona l 2ndcoronal 3rdcoronal 4 thcoronal Coronal Coronal T1 SE 3 DFL T1 SE PDSE T2 SE T1 SE T1 SE T1 SE T1 SE T1 SE 3D FLASH - G d - G d - G d - G d - G d + G d + G d + G d + G d + G d + Gd
N 12 11 3 4 4 12 12 12 12 11 11 TP 10 9 2 1 1 8 10 8 8 7 7 FP 0 1 1 0 0 1 1 1 1 1 1
N, Number of cases examined with a given sequence; TP, number of true positive cases; FR number of false positive cases
O
10
5
- 5 -
-10 -
P re -Gd
~
Post -Gd
-15 ~ ~ ~ ~ i ~ i TISE 3DFL lstSE 2ndSE 3rdSE 4thSE T1SE 3DFL
0 1 2 3 4 5 6 7 8
Sequence
Fig. 1. Contrast behavior for 6 cases without true positive variations after gadolinium injection
15-
I 0 -
5 -
P re -Gd
o
o [] []
I A Pos t -Gd
E - -
A O /X
- 5 -
-10 ~ J i i LT1SE 3DFL 1st SE 2nd SE 3rd SE 4th SE T1 SE 3DFL
0 1 2 3 4 5 6 7 8
Sequence
F i g . 2 . Contrast behaviour for 3 cases with false negative results on first post-Gd SE
only when at least one segment of the MRI findings over- lapped with the surgical evaluation and the side (left or right) of the lesion was concordant. Otherwise, the MRI was considered as both a false positive (FP) and a false negative (FN). The presence of a second focal MRI ab- normality distant from the TP lesion was considered as both a FP and a TR In addition, we analyzed which com-
The microadenomas correctly evaluated by the two neuroradiolo- gists were correlated with the calculated contrast levels. For all these cases the contrast level was found to be higher than 2.5 (Figs. 1-3).
bination of MRI sequences provided the highest number of TP diagnoses and the lowest number of FP misdiag- n o s e s .
Results
Results are summarized in Table2. The pituitary microadenomas were found during surgery in all 12 oper- ative cases and consisted of 8 prolactinomas, 3 ACTH- secreting adenomas and 1 growth-hormone secreting microadenoma. On the preliminary noncontrast MRI se- quences, 10 of the 12 proven microadenomas were dem- onstrated by coronal Tl-weighted SE MRI; 9 of 11 microadenomas were shown by coronal 3D FLASH. After injection of Gd, 10 of the 12 proven microadenomas were correctly demonstrated by the second of the four ser- ial Tl-weighted coronal SE series. The first post-Gd coro- nal Tl-weighted SE series and the more delayed scans gave a lower detection score (Table 2) I. There were no FP results for the noncontrast coronal T1 SE series and 1 FP result for the other pre-and post-Gd coronal Tl-weighted sequences (Table 2). The 2 of 2 FN cases of noncontrast coronal T1 SE MRI and the i of 2 FN noncontrast 3D FLASH series became TP after Gd injection (positive yield for Gd of 17 % for coronal T1 SE and 9 % for coronal 3D FLASH).
Thus 12 of the 12 proven microadenomas were correct- ly demonstrated by a combination of the noncontrast and Gd-enhanced coronal Tl-weighted sequences.
In I case of a 9-mm prolactinoma, all post-Gd sequen- ces were FN, whereas the pre-Gd series provided confi-
g �9
10 -
8
6
4
2
0
-2
-4
-6
o
Pre-Gd
A
{} o
Post -Gd
[]
[]
I L I I I { I
TISE 3DFL 1st SE 2nd SE 3rd SE 4th SE T1 SE 3DFL 1 2 3 4 5 6 7 8
Sequence
Fig. 3. Contrast behavior for 3 cases with true positive results on first and second post-Gd SE
186
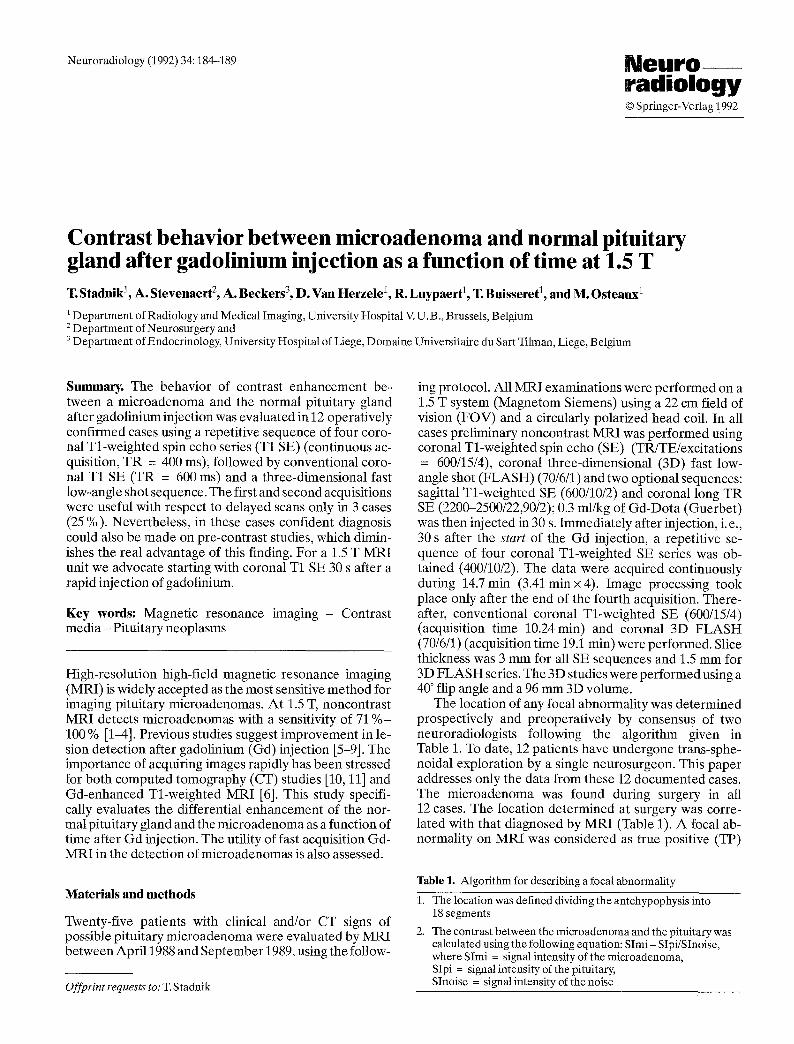
5 mm large prolactinoma 5 mm large prolactinoma (Bromocriptine therapy)
Fig.4.a Pre-GdcoronalTl-weightedSE. b lst short and c 3rdshort TR coronal post-Gd Tl-weighted SE. d Delayed (5th) post-Gd co- ronal Tl-weighted SE. e Post-Gd coronal 3D FLASH. In this case there is no advantage to performing the fast acquisition. All pre- and post-Gd sequences demonstrate the adenoma very clearly (arrow). Nevertheless, the contrast between the adenoma and the pituitary is lower on pre-Gd sequences
Fig.5.a Pre-Gd coronal Tl-weighted SE. b Pre-Gd coronal 3D FLASH. c,d 1st, 3rd post-Gd coronal Tl-weighted SE. e Post-Gd delayed (5th) Tl-weighted SE. f Post-Gd coronal 3D FLASH. Typi- cal example of flip-flop from dark to bright. On pre-Gd SE (a) and pre-Gd 3D FLASH (b) the microadenoma is hypointense and can be very clearly seen (arrows). On the 1st post-Gd coronal Tl-weighted SE the microadenoma is isointense with the pituitary (c) (false nega- tive) and becomes hyperintense on later sequences (arrows) (d-f)

9 mm large prolactinoma
187
dent visualization of the microadenoma (negative yield of 8 % for pre-Gd T1 SE for a total number of 12 cases and of 9 % for pre-Gd 3D FLASH for a total number of 11 cases.
Considering the combination of the first four, short TR, T1 SE series (400/10/2) with delayed post-Gd T1 SE (600/15/4) and 3D FLASH sequences, there were no TP variations between these sequences in 6 cases (50%) (Figs. l, 4). In 3 cases (25%) (Figs.2, 5) the first T1 SE series, and in 1 case also the second T1 SE series, was FN and failed to demonstrate a microadenoma that was cor- rectly displayed by the delayed post-Gd SE and/or the 3D FLASH series. In the last 3 cases, only the first short TR SE series and in 2 cases also the second short TR T1- weighted SE series was able to demonstrate the microadenoma with respect to delayed post-Gd scans (TP) (Figs. 3, 6).
If we analyze the time course of post-Gd contrast dif- ference between the microadenoma and the normal pitui- tary gland only for the first four short TR SE series, we see that the contrast difference for hypointense microadeno- mas always diminishes between the second and fourth SE series (approximately 4 min after Gd injection). The con- trast for the first SE series acquired immediately after Gd injection demonstrates great variability [superiority with respect to delayed scans in 3 cases (Fig. 3), inferiority in 3 other cases (Fig. 2) and no significant difference in the remaining 6 cases (Fig. 1)].
The contrast difference between a hyperintense microadenoma and the normal pituitary gland always in- creases as a function of time on the first four short TR SE series (negative values on plot of Figs. 1, 2). An interesting finding was that two microadenomas which were sponta- neously hyperintense on pre-Gd scans (negative values on plot of Figs. 2, 3) became hypointense or isointense after Gd injection, whereas the two microadenomas that be- came hyperintense after Gd injection were initially hypo- intense on the pre-Gd scans (Figs. 1, 2).
Ng.6.a Pre-Gd coronal Tl-weighted SE. b Pre-Gd sagittal T1- weighted SE. c 1st short TR coronal post-Gd Tl-weighted SE. d 3rd short TR coronal post-Gd Tl-weighted SE. e Delayed (5th) post-Gd coronal Tl-weighted SE. f, g Post-Gd coronal 3D FLASH. In this case, only the first short TR coronal Tl-weighted SE acquired in 3.4 rain immediately after Gd injection allows the confident vis- ualization of the microadenoma (c, arrows). On the consecutive post-Gd scans (d-g) the adenoma becomes isointense with the hypo- physis (false negative). Nevertheless, the adenoma is also confi- dently visualized on precontrast studies (a,b) (arrowheads)
Discussion
Recent evaluations of MRI for the diagnosis of pituitary microadenomas report variable diagnostic accuracy and variable "most useful" pulse sequence parameters [1-3, 5- 9,12].
It is generally agreed that the normal pituitary gland enhances promptly [7, 9], whereas adenomas enhance more slowly and persistently than the host pituitary gland.
The utility of fast acquisition times and of contrast en- hancement is generally accepted for CT imaging of the pi- tuitary gland [10, 11]. Doppman et al. [6] also postulated that acquiring Tl-weighted images as soon as possible fol- lowing Gd infusion is critical for the detection of small, solid microadenomas.
Our study was performed to assess the behavior of the contrast difference between the microadenoma and the normal pituitary gland as a function of time after contrast injection and especially the utility of employing T1 MRI series with very short acquisition times beginning as soon as possible after Gd injection (supposing that the microadenomas take up contrast agent more slowly than

188
4 m m l a r g e A C T H - m i c r o a d e n o m a
Fig.7.a Pre-Gd coronal Tl-weighted SE. b Post-Gd coronal T1- weighted SE. The examination on a,b was performed using a 1.5 T magnet, 3 mm slice thickness and 4 excitations. Nevertheless, TR was 450 ms and TE 30 ms. The hyperintense focal lesion is poorly demonstrated only on post-Gd sequences (b) (arrows). e,d Pre-Gd coronal Tl-weighted SE (2 contiguous slices), e, fPre-Gd coronal 3D FLASH (2 contiguous slices), g Post-Gd coronal Tl-weighted
SE. The examination performed in our department 2 months later (c-g) clearly demonstrates a microadenoma on pre-Gd Tl-weighted SE (e, d) and 3D FLASH (e, f) as a focal hypointensity (arrowheads) (pay attention to higher pituitary/adenoma contrast using 3D FLASH). On post-Gd Tl-weighted SE (g) the microadenoma becomes hyperintense (arrows)
the hypophysis and that, therefore, the contrast difference between microadenoma and hypophysis is greatest for a rather short period of time directly after Gd injection). This increase in contrast difference would be expected to compensate for the lower signal to noise ratio that occurs using shorter TR and only two excitations.
This postulate was true in 3 of 12 cases (considering only the post-Gd scans) where only the first post-Gd short TR Tl-weighted SE provided a true positive diagnosis with respect to delayed scans (Fig. 3).
The time intensity curves (Figs. 1-3) clearly show a diminution of contrast difference on delayed scans for hy- pointense microadenomas. (The higher contrast seen with the delayed, fifth T1 SE is explained by its longer TR and the four acquisitions used for this routine sequence.) Nevertheless, the first short TR post-Gd Tl-weighted SE series also accounted for 3 FN cases: insufficient impreg- nation by Gd in 1 case, a flip-flop from dark do bright in
another case (Figs. 2, 5) and flip-flop from bright to dark in a 3rd case (Fig. 2). So. considering the results of our series. we think that it can be hazardous to perform a post-Gd ac- quisition "too quickly." The post-Gd acquisition should be performed once the impregnation of hypophysis by Gd is achieved. A possible FN case. especially when the signal intensity flip-flops from dark to bright, can be resolved in most cases by comparison with the pre-Gd study, since in our series, those cases that were FN on the first post-Gd scans were always TP on the pre-Gd scans. If necessary, additional delayed Gd scans can be obtained.
Conclusions
For a 1.5 T high signal-to-noise MR unit, the Tl-weighted pre-contrast sequences permit confident diagnosis of microadenomas in most cases. Therefore, the performan-

ces of M R equipment (high field, homogeneous magnet, specialized coils, strong gradients) and optimization of the sequences (3 or 2 m m slice thickness without gap, at least four acquisitions, short TE for Tl-weighted sequences etc.) are of importance for confident detection of microadenoma without Gd injection (Fig.7). If the onfi- dent diagnosis is not reached on pre-contrast scans, an in- jection of Gd should be performed. For a 1.5 T, high-field M R I unit we advocate starting with coronal T1 SE series (600/15/4) 30 s after a rapid (less than i min) injection of Gd using 3 m m (or 2 mm) slice thickness and a 2562 ma- trix. If the diagnosis is still dubious, repetit ion of the pre- vious T1 SE series should be considered. Delayed scans (more than 30 min after injection) seem of little value.
Acknowledgements. We thank Mr. W. De Plecker for excellent tech- nical support.
References
1. Peck WW, Dillon WR Norman D, Newton TH, Wilson CB (1989) High-resolution MR imaging of pituitary microadenoma at 1.5 T: experience with Cushing diseases. AJR 152:145-151
2. Nichols DA, Laws ER, Houser OW, Abboud CF (1988) Com- parison of magnetic resonance imaging and computed tomo- graphy in the preoperative evaluation of pituitary adenomas. Neurosurgery 22:380-385
3. Kucharczyk W, Davis DO, Kelly WM, Sze G, Norman D, New- ton TH (1986) Pituitary adenomas: high-resolution MR imaging at 1.5 T. Radiology 161:761-765
4. Kulkarni MV, Lee KF, McArdle CB, Yeakley JW, Haar FL (1988) 1.5-T imaging of pituitary microadenomas: technical con- siderations and CT correlations. AJNR 9:5-11
189
5. Davis PC, Hoffman JC, Malko JA, Tindall GT, Takei Y, Avruch L, Braun IF (1987) Gadolinium-DTPA and MR imaging of pitui- tary adenoma: a preliminary report. AJNR 8:817-823
6. Doppman JL, Frank JA, Dwyer AJ, et al (1988) Gadolinium DTPA enhanced MR imaging of ACTH-secreting microadeno- mas of the pituitary gland. J Comput Assist Tomogr 12:728-735
7. Dwyer A J, Frank JA, Doppman JL, et al (1987) Pituitary adeno- mas in patients with Cushing disease: initial experience with Gd- DTPA-enhanced MR imaging. Radiology 163:421-426
8. Steiner VE, Wimberger D, Imhof H, Knosp E, Hajek P (1989) Gd-DTPA in MR diagnosis of pituitary adenomas. ROFO 150: 323-327
9. Newton DR, Dillon WR Norman D, Newton TM, Wilson CB (1989) Gd-DTPA-enhanced MR imaging of pituitary adenomas. AJNR 10:949-954 Bonneville J-F, Cattin F, Moussa-Bacha K, Portha C (1983) Dy- namic computed tomography of the pituitary gland: the "Tuft sign". Radiology 149:145-148 Hasegawa T, Ito H, Shoin K, Kogure Y, Kubota T, Yamamoto S (1984) Diagnosis of an "isodense" pituitary microadenoma by dynamic CT scanning. J Neurosurg 60:424-427 Pojunas KW, Daniels DL, Williams AL, Houghton VM (1986) MR imaging of prolactin-secreting microadenomas. AJNR 7: 209-213
10.
11.
12.
T. Stadnik, M. D. Department of Radiology and Medical Imaging University Hospital V. U. B. Laarbeeklaan 101 B-1090 Brussels Belgium


![Untitled-1 [salk.edu] · excess production of CRF may cause pituitary hyperpla- sia, leading to microadenoma formation and excess ACTH production (15, 17). That pituitary hyperplasia](https://img.dokumen.tips/doc/110x75/5fdfe2c68cd94e050b6b529d/untitled-1-salkedu-excess-production-of-crf-may-cause-pituitary-hyperpla-sia.jpg)