Embed Size (px)
Citation preview

CONTRACEPTION AS DEVELOPMENT? NEW EVIDENCEFROM FAMILY PLANNING IN COLOMBIA*
Grant Miller
There has been considerable debate in the last decade about whether or not family planning pro-grammes in developing countries reduce fertility or improve socio-economic outcomes. This articleprovides new evidence by studying the expansion of one of the world’s oldest and largest familyplanning organisations – Profamilia of Colombia. It finds that family planning explains less than 10%of Colombia’s fertility decline during its demographic transition. As in wealthy countries, however,lowering the costs of first birth postponement produced important socio-economic gains, enablingyoung women to obtain more education and to work more and live independently later in life.
The goal is not reducing, increasing, or stabilising the numbers of people. It ishelping make more possible a richer, fuller life – jobs; homes; resources; freedomfrom hunger, disease, ignorance; time for development of innate capacities – inshort, enriching the quality of life for an increasing proportion of the world’s people.
Leona Baumgartner, USAID, 1965(at the launch of USAID’s population assistance programme)
Family planning programmes have been a part of development agendas for nearly half acentury. Without modern contraceptives, the costliness of fertility control was famouslythought to cause vicious cycles of high fertility, poverty and economic stagnation(Ehrlich, 1968; Ehrlich and Holdren, 1971; Ehrlich and Ehrlich, 1990). However, beliefsabout the importance of family planning in development are at times stronger than theevidence that supports them. In particular, because the placement and utilisation offamily planning programmes are generally related to the demand for children, rigorousevaluations have proven to be difficult (Pritchett, 1994; Schultz, 1994, 2005). Even theresults of the famous Matlab family planning experiment (Phillips et al., 1988; Koeniget al., 1992; Foster and Roy, 1997; Sinha, 2003) have been called into question.1
As this shortcoming has become better recognised, a very different view has gainedprominence: development simply reduces the demand for children and the true effect
* I am grateful to David Cutler as well as David Bloom, Ken Chay and Richard Frank for their advice andsupport. Jay Bhattacharya, Hoyt Bleakley, David Canning, Erica Field, Amy Finkelstein, Paul Gertler, Ron Lee,David Levine, Mushfiq Mobarak, Sendhil Mullainathan, Joe Newhouse, Ben Olken, Steve Pischke, Kiki Pop-Eleches, Piedad Urdinola, Alan Zaslavsky, three anonymous referees and numerous seminar participantsmade helpful suggestions at various stages of this research. Gonzalo Echeverry, Angela Gomez, and especiallyGabriel Ojeda at Profamilia were generous with their time and knowledge throughout this project. The viewsexpressed here are not necessarily the views of Profamilia or its staff. Research support from the NationalInstitute on Aging (grant number T32 AG00186) through the National Bureau of Economic Research isgratefully acknowledged. All errors are my own.
1 First, there is suggestive evidence that true randomisation was not fully achieved (Joshi and Schultz,2007). Second, the family planning treatment was considered too expensive to be financially sustainablewithout considerable external support – programme expenditures per fertile women and per averted birthwere roughly 10% and 120% of per capita GDP, respectively (35 times more than mean family planningspending in other Asian countries at the time) (Pritchett, 1994). Third, because health services were integ-rated into the family planning treatment four years after the experiment began, it difficult to isolate long-runconsequences uniquely attributable to family planning alone (Phillips et al., 1984).
The Economic Journal, 120 ( June), 709–736. doi: 10.1111/j.1468-0297.2009.02306.x. � The Author(s). Journal compilation � Royal Economic
Society 2009. Published by Blackwell Publishing, 9600 Garsington Road, Oxford OX4 2DQ, UK and 350 Main Street, Malden, MA 02148, USA.
[ 709 ]

of contraceptive supply on fertility is quantitatively unimportant (even if large reduc-tions in fertility are achieved with modern contraceptives) (Bongaarts, 1994; Pritchett,1994; Easterly, 2001). This view implies either that the demand for children is quiteinelastic or that the costs of fertility control are small or are not influenced much byfamily planning. The price elasticity of demand for children is not well established, butboth experience with HIV/AIDS prevention and empirical research on intra-house-hold bargaining suggest that the costs of fertility control may be large in the absence ofmodern contraceptives.2 Moreover, debate about family planning and lifetime fertilityin poor countries often overlooks important dimensions of reproduction and well-being emphasised in wealthy country studies – in particular, the timing of first birthsand human capital accumulation (Pritchett, 1994; Angrist and Evans, 1998; Goldin andKatz, 2002; Miller, 2005; Bailey, 2006).
This article provides new evidence on the role of contraceptive supply in developingcountries by drawing on one of the world’s oldest and largest family planningorganisations – Profamilia of Colombia (Asociaci�on Probienestar de la FamiliaColombiana). Profamilia was founded in Bogota in 1965 and became the country’sdominant family planning provider for three decades. Figure 1 provides suggestiveevidence of its impact – fertility declined more abruptly in Colombia than in any otherSouth American country over any period of time precisely as it was scaling-up itsoperations in the late 1960s and early 1970s.
Although Profamilia was established during a period of unprecedented social andeconomic change in Colombia, several features of its programmes allow difficulties
Latin AmericaChile Ecuador
BoliviaPeruBrazil
VenezuelaColombia
1985–901980–851975–801970–751965–701960–651955–60
2
3
4
5
6
Tot
al F
ertil
ity R
ate
7
8
Fig. 1. Total Fertility Rates in Latin America by Country and Quinquennia, 1955–60 to 1985–90.Source: Guzman et al. (1996).
2 The challenges of HIV/AIDS prevention suggest little deviation from desired sexual activity even if theconsequences are grave (Gertler et al., 2005, UNAIDS, 2004). Women in developing countries are alsothought to have relatively little bargaining power within households (Thomas, 1990,1994; Case and Deaton,1998; Pitt and Khandker, 1998; Duflo, 2003; Rangel, 2006), so negotiating sexual activity and fertility choiceswith men may be quite costly (Ashraf et al., 2007).
710 [ J U N ET H E E C O N O M I C J O U R N A L
� The Author(s). Journal compilation � Royal Economic Society 2009

encountered by other studies to be addressed, including their country-wide coverage,their duration over several decades, their financial sustainability and their somewhatarbitrary geographic spread. This last feature provides variation in contraceptive supplynot related to demand. Because the introduction of programmes varied across municipios(hereafter �counties�) and over time, variation in contraceptive access among women thesame age but in different counties and among women of different ages but in the samecounty can be combined to estimate the relationship between family planning and avariety of demographic and socio-economic outcomes. Other studies have used similarapproaches but they have generally found that programmes were established inresponse to changes in perceived need or level of development (i.e., demand)(Rosenzweig and Wolpin, 1986; Pitt et al., 1993; Gertler and Molyneaux, 1994). A varietyof evidence suggests that this does not seem to be the case with Profamilia.
This article first investigates the link between family planning and fertility, suggestingthat the availability of modern contraceptives allowed women to postpone their firstbirth and to have about 5% fewer children in their lifetime (about one-third of a child).These reductions explain only about 6–7% of the fertility decline in Colombia’s majorpopulation centres between 1964 and 1993, implying that other factors were moreimportant determinants of women’s lifetime fertility.
Next, the article examines the relationship between family planning and women’ssocio-economic status. Women gaining access to family planning as teenagers obtained0.05 more years of schooling, were 7% more likely to work in the formal sector andwere 2% less likely to cohabit with male partners. Comparisons with other well--regarded development interventions suggest that these estimates may place familyplanning among the most effective (and cost-effective) interventions to foster humancapital accumulation. The age pattern of results also suggests that delayed first birthsrather than reduced lifetime fertility are more closely linked to these socio-economicgains. This finding is notable because unlike wealthy country studies, those focused ondeveloping countries generally emphasises completed lifetime fertility and childquantity more than the lifecycle timing of births (UNFPA, 2004).
The article then presents a variety of informal evidence to addresses natural concernsthat the spread of Profamilia’s programmes was related to secular changes in fertility,socio-economic conditions, or the demand for children. First, Profamilia’s early lead-ership suggests through interviews that programme expansion was not targeted to localdemand conditions. Second, raw population census data shows identical completedfertility among women too old to benefit from family planning (both in level andtrend) across counties with differentially-timed programmes – and staggered fertilitydeclines among younger women that coincide precisely with the introduction ofmodern contraceptives. Third, in data sources collected shortly before programmeswere established, future age-specific family planning availability is unrelated to fertilityand socio-economic indicators. Fourth, both within and across counties, there aredistinct fertility and socio-economic gradients associated with family planning amongfertile age women – but no effects at biologically-determined ages at which contra-ceptive supply should not matter. Finally, capitalising on the finding that familyplanning was unrelated to selection into motherhood, there are no changes in socio-economic status associated with family planning availability among women never givingbirth (a plausible additional control group).
2010] 711C O N T R A C E P T I O N A S D E V E L O P M E N T ?
� The Author(s). Journal compilation � Royal Economic Society 2009

In light of ongoing debate about the role of family planning in explaining fertilitydecline in developing countries, this article’s findings side more closely with the viewthat other forces (although not necessarily on the demand-side) are more potent.However, they also suggest that the ability of family planning to foster human capitalaccumulation cannot easily be dismissed.
1. Profamilia and Family Planning in Latin America
1.1. The Emergence of Family Planning Programmes in Latin America
The prevailing government philosophy in Latin America during the 1950s and early1960s was strongly pronatalist, as exemplified by the motto �gobernar es poblar�, or �togovern is to populate� (Mundigo, 1996). Nation-building required a large body ofcitizens to create international standing as well as a large domestic market and work-force. Rather than concern about a Malthusian �population bomb� leading to massstarvation, it was the high incidence of unsafe abortions that first led Latin Americangovernments to take interest in family planning in the mid-1960s. Abortions performedin unsanitary conditions by unqualified personnel were troubling in their own right(they were thought to have been the leading cause of maternal mortality at the time)but they also resulted in large public expenditures as women with abortion-relatedcomplications sought care en masse from public hospitals (Mundigo, 1996).
As Latin American governments became more receptive to family planning, they alsofaced the threat of large political costs of direct involvement from the Catholic Churchand other conservative elements. Consequently, early family planning efforts in LatinAmerica were small, private initiatives funded by international donors and NGOs. Overtime, however, growing perceptions of modern contraceptives as health inputs allowedgovernments to incorporate family planning into their public health systems. Theprolonged dominance of private family planning services in Colombia was unusual.
1.2. Profamilia and the Growth of Family Planning in Colombia
The Colombian government’s early tacit acceptance of private initiatives paved the wayfor the establishment of the private, not-for-profit Profamilia. Its founder, Dr FernandoTamayo, was a young obstetrician/gynaecologist working in a public hospital in Bogotaat the time, who also had a small private practice on this side. When he began quietlyproviding contraceptive devices (primarily IUDs at first) through his practice, theclinic’s capacity was quickly overwhelmed by the enormous latent demand for them.Poor women waited in long lines that spilled into the streets, upsetting more affluentpatients and causing his practice partners to complain. Rather than turn these womenaway, he instead sought a new clinic location, resulting in the birth of Profamilia in1965.3 With a large influx of external financing (particularly from the InternationalPlanned Parenthood Federation, UNFPA and USAID), Profamilia grew rapidly.
3 The new location first chosen had to be abandoned when the landlord discovered how the space wasbeing used, reportedly exclaiming: �I don’t mind if it is used as a whorehouse, but I will not allow it to be usedfor family planning!� (Singh, 1994).
712 [ J U N ET H E E C O N O M I C J O U R N A L
� The Author(s). Journal compilation � Royal Economic Society 2009

Because of the political quagmire surrounding family planning, Profamilia was thedominant family planning provider in Colombia for decades after its inception. Itsoperations spread to all of Colombia’s major population centres in subsequent years,growing into a network of 40 county-level programme areas over the next decade(shown in Figure 2).4 Simultaneously, contraceptive prevalence among marriedColombian women of reproductive age rose from a negligible rate in 1964 to 19% in1969, 34% in 1976 and 53% in 1986 (Seltzer and Gomez, 1998). Oral contraceptivesand IUDs were the most popular devices for many years. Over time, however, femalesterilisation has become the most common form of birth control in Colombia. None ofthese methods requires the knowledge or consent of male partners.
Profamilia’s international reputation of success rests on the ways of reaching womenwith modern contraceptives under difficult circumstances that it pioneered. Distin-guishing features of its philosophy include its focus on the poor and its recruitment oflay-women to provide outreach in their own communities. In counties where it oper-ated, Profamilia also supplied vast quantities of contraceptive devices not requiringmedical supervision to local drugstores at cost and it advertised its services by radio. In1971, Profamilia became the first family planning organisation in Latin America toserve rural areas as well.5
Figure 1 shows that the demographic transition in Colombia did not resemble thetransition in other South American countries. Its fertility decline during the late 1960sand early 1970s (when Profamilia was expanding) was the most rapid decline on recordin South America; Colombia was not developing more rapidly than its neighboursduring this period. A rough comparison with Venezuela is informative. Venezuela isgeographically adjacent to Colombia, shares much of its colonial history, experienced asimilar shift from natural resource exports to industrialisation in the post-war era andhad comparably high fertility rates during the late 1950s and early 1960s. However, itsprivately-funded family planning programmes established during the 1960s failed totake root and its public sector family planning activities languished for several decades(Parrado, 2000). From 1960–65 to 1985–90, fertility fell by about 3.5 children perwoman in Colombia and about 2.75 children per woman in Venezuela – a difference of0.75 children. This admittedly crude difference-in-difference is slightly larger than butgenerally consistent with the family planning effects that I estimate more formally usingwithin-country variation in Profamilia’s location and timing.
1.3. The Spread of Profamilia’s Programmes
Critical to the empirical strategy of this article is the way that Profamilia spread acrossColombia’s counties. Because the precise timing of its programmes is assumed to belargely exogenous, it is important to investigate regularities that may have governed
4 Appendix Table A1 shows precise programme dates. As late as 1990, Profamilia still provided about 70%of all family planning services in Colombia.
5 Direct data on utilisation of Profamilia’s services is not available before 1978, but more generally,widespread contraceptive distribution through private drugstores makes it impossible to know contraceptiveprevalence outside of nationally-representative fertility surveys (Seltzer and Gomez, 1998). Because ofuncertainty about when many rural programmes began, this article focuses on urban county programmeswhich covered about 40% of Colombia’s population.
2010] 713C O N T R A C E P T I O N A S D E V E L O P M E N T ?
� The Author(s). Journal compilation � Royal Economic Society 2009

programme placement. Dr Gonzalo Echeverry, Profamilia’s director of planning anddevelopment during the 1960s and 1970s, explained to me through interviews thatthere was neither formal nor informal targeting of programmes to areas of Colombiawith differential demand (to his lament). Rather, he considers this process to havebeen largely arbitrary.6 Figure 2 and Appendix Table A1 show that after being estab-lished in Bogota, Profamilia spread to many small counties like Sogamoso, Armero and
33 3
34 7
34 26 34
25 6
14 18 22
9 28
21 17 7 1 16
9 13 31 4
30 17 2 34 32
12
22 9 30
29 39 38 5
15
19
20 24
27 34
34
Fig. 2. The Chronological Ordering of Profamilia’s Programmes in Colombian Counties
6 Specifically, he explained that while travelling or vacationing in some part of the country, chanceencounters with local physicians at cafes or bus stops would sometimes turn to the subject of Profamilia.These physicians would occasionally express interest in Profamilia, and with this individual’s help, Profamiliawould then establish a programme in that county some time later.
714 [ J U N ET H E E C O N O M I C J O U R N A L
� The Author(s). Journal compilation � Royal Economic Society 2009

Puerto Berrio, before reaching larger population centres like Cali, Cartagena and SantaMarta. Figure 2 also shows that programme expansion did not follow any cleargeographic pattern. For example, a programme began in the coastal city ofBarranquilla in 1967 but none was established either in nearby Cartagena or SantaMarta until 1970 and 1972 (respectively). Section 5 presents a range of informal validitytests that are consistent with the identifying assumption.
2. Data and Graphical Analysis
2.1. Data
Because no longitudinal data were collected from Colombian households during the1960s and 1970s, this study requires that women from different counties and birthcohorts be matched to information on the timing and location of Profamilia’s pro-grammes. In this article, I make extensive use of the Colombian population censuses.The Colombian national statistical agency (Departamento Administrativo Nacional deEstadıstica, or DANE) conducts censuses approximately once per decade that askquestions about the number of children ever born and the number of surviving chil-dren. I use the most recent full population census available (conducted in 1993) tomaximise the share of women observed with completed fertility while also retainingconsiderable variation in women’s fertile ages at which family planning first becameavailable. To create a large sample of women ranging from not yet fertile to no longerfertile when Profamilia was established in 1965, I use all women in the 1993 census whowere born in programme counties between 1911 and 1955 (and were therefore aged10–54 when Profamilia was established).7 I also use a randomly drawn sample ofapproximately one million women from the same birth cohorts and birth counties inthe 1973 census to investigate the relationship between family planning access andthe timing of first births (which is not explicitly reported in any population census).Table 1 shows descriptive statistics for these samples.8 Finally, I use the 2% sample fromthe 1964 population census available through IPUMS International for further tests ofthe identifying assumption.
In these samples, I assign age at which family planning first became available (varyingsimultaneously by year and county of birth) to each woman using information fromProfamilia’s research department on programme timing and location (shown inFigure 2 and Appendix Table A1). Following the demography literature, I definewomen’s reproductive ages to be 15–44 and create five-year age intervals (15–19, 20–24,etc.) for all reproductive ages. Dummy variables code each woman’s reproductive age
7 Women born in non-programme counties do not generally constitute a suitable additional control groupfor two reasons. First, the Colombian government began providing family planning services though publicsector health facilities late in the study period (emphasising areas where Profamilia did not operate); ade-quate documentation of the location and timing of these programmes is not available. Second, Profamiliaitself operated less intensive �rural� programmes in other counties but sufficient documentation of the timingand location of these programmes is also not available.
8 Formal sector employment is defined as working for an establishment with three or more employees.�White collar� occupations were coded from a list of occupations to distinguish clerical and office-based jobsfrom manual labour. Cohabitation is defined here as either marriage or an extra-marital �free-union�. Infant/child mortality is defined as the difference between a woman’s reported number of lifetime births andreported number of surviving children divided by her reported number of lifetime births.
2010] 715C O N T R A C E P T I O N A S D E V E L O P M E N T ?
� The Author(s). Journal compilation � Royal Economic Society 2009

interval when family planning first became available in her county of birth.9 County ofbirth is used in the 1973 and 1993 samples rather than country of residence to addressconcerns about endogenous migration.
2.2. Graphical Analysis
I first present graphical evidence of the relationship between Profamilia’s programmesand lifetime fertility. Figure 3 plots average completed fertility among all women everhaving children by year of birth in the 1993 population census.10 Because cohort-specific fertility is difficult to illustrate separately for each county, I divide thesecounties into two groups: those with family planning programmes before 1969 (�early�programme counties), and those with programmes in 1969 or later (�late� programmecounties).11
The Figure first shows that among women too old to benefit from family planning(those born before 1920, who were aged 45þ when Profamilia was established in 1965),there were no differences in either fertility levels or trends across areas with differen-tially-timed programmes. Similarly, among women late in their reproductive years whenProfamilia was founded (those born between 1920 and 1930, who were 35–45 in 1965),there are no visibly discernable differences in fertility between women in early and late
Table 1
Characteristics of Females Born in Programme Counties between 1911 and 1955
1973 Census 1993 Census
Mean Std Dev Mean Std Dev
Age 31.36 (2.05) 50.87 (1.70)Share Married or in Free Union 0.56 (0.06) 0.58 (0.03)Share Born in Current Municipality 0.89 (0.23) 0.54 (0.19)Share Literate 0.84 (0.11) 0.85 (0.10)Share in School 0.10 (0.03) 0.04 (0.01)Years of Education 4.30 (1.16) 5.18 (1.28)Share Employed 0.23 (0.06) 0.30 (0.06)Share Ever Having a Child 0.63 (0.08) 0.88 (0.03)Children Ever Born 3.55 (0.78) 4.49 (0.71)Children Alive 3.06 (0.59) 4.31 (0.55)Age at Last Birth 27.39 (1.04) 32.71 (0.97)Share with Brick or PreFabricated Walls 0.56 (0.23) 0.80 (0.14)Share with Adobe ⁄ Pressed Dirt Walls 0.16 (0.18) 0.06 (0.09)Share with Dirt Floors 0.30 (0.12) 0.09 (0.08)Share with Water Access 0.72 (0.23) 0.88 (0.12)Share with Sewage Access 0.55 (0.28) 0.73 (0.20)Share with Electricity Access 0.74 (0.20) 0.91 (0.10)Number of Household Rooms 3.36 (0.45) 3.85 (0.35)
Notes. Descriptive statistics for samples of women born in Profamilia programme counties between 1911 and1955 randomly drawn from the 1973 and 1993 Colombian population censuses (999,902 and 950,018 women,respectively).
9 I choose dummy variables because not all individuals appear to know their precise birth year. Coding agewhen family planning became available in single years of age produces similar results.
10 The same general patterns are evident using all women.11 1969 is the population-weighted median year that Profamilia’s programmes began in these counties.
716 [ J U N ET H E E C O N O M I C J O U R N A L
� The Author(s). Journal compilation � Royal Economic Society 2009

programme counties. Then, among women earlier in their reproductive years whenmodern contraceptives first became available (those born in 1930 or later, who were 35or younger in 1965), fertility in early programme counties pulls below fertility in thelate ones. This divergence becomes more pronounced in successive birth cohorts.Among these younger women, the amount of time it took fertility in late programmecounties to catch up to fertility in the early ones (the horizontal distance between theearly and late programme series) is roughly three years. Notably, this is also the dif-ference in time between the average early group programme and the average lategroup programme. The vertical distance in these birth cohorts is about 0.25 children,which generally matches the programme effect estimates I report in Section 4. The twofertility series then re-converge among even younger women having access to familyplanning at all fertile ages, regardless of where they live (women born in 1950 or later).
3. Empirical Strategy
3.1. Fertility
I present reduced-form estimates of family planning’s consequences by exploiting thedistinct timing, geographic pattern and age-specific nature of Profamilia’s pro-grammes. Unobserved individual characteristics presumably influence the use of con-traceptive services and devices, so programme effects identified by variation inutilisation would be biased. For this reason, the effects of family planning availabilityare estimated rather than the effects of contraceptive use.12
Age 45+ in 1965
Late Programme(1969+)
Early Programme(pre-1969)
Under Age 35 in 1965 Age 35–44 in 1965
Year of Birth1945 1950 19551940193519301925192019151910
2
3
4
Lif
etim
e Fe
rtili
ty
5
6
7
Fig. 3. Women’s Lifetime Fertility by Birth Cohort and Programme Group
12 The population censuses also do not report contraceptive use, so contraceptive access cannot be used toinstrument for contraceptive use to recover treatment-on-treated estimates.
2010] 717C O N T R A C E P T I O N A S D E V E L O P M E N T ?
� The Author(s). Journal compilation � Royal Economic Society 2009

A simple approach would be to compare the fertility of women who are the same agebut live in different counties and therefore differ in access to family planning. However,counties with differentially-timed programmes could vary in fertility for reasons un-related to family planning (although Figure 3 suggests that this was not the case). Analternative would be to compare the fertility of different aged women in the samecounty. In this case, programme effects could not be disentangled from cohort effects.
To circumvent these difficulties, I combine the two approaches, using only jointvariation in the timing and location of Profamilia’s programmes to identify their age-specific effects. In doing so, I assume that the combination of variation in contraceptiveaccess across counties and over time is largely exogenous. This implies that women thesame age in counties with differentially-timed programmes would have experienced thesame changes in fertility over time in the absence of family planning. It also implies thatafter controlling for age, fertility differences between younger and older women in thesame counties are attributable only to family planning. Section 6 devotes furtherattention to evaluating the validity of the identifying assumption.
I focus on two distinct lifetime fertility choices that contraceptive access could haveaffected: whether or not to have children and how many births to have conditional onhaving any.13 A two-part empirical model allows family planning effects to differ forthese two choices. This approach is also one way of handling censoring at zero in thedistribution of births. For individual women i, birth years y, counties (or municipios) m,and reproductive age intervals a, I begin by estimating:
Prðbiym ¼ 1Þ ¼ U aþX
a
baraym þ dm þ dy þ dm � t þ eiym
!; ð1Þ
and conditional on ever giving birth (biym ¼ 1),
lnðniymÞ ¼ xþX
a
caraym þ dm þ dy þ dm � t þ niym : ð2Þ
In these specifications, the choices of ever having a child (b) and the number ofbirths (n) are assumed to depend on a constant, the reproductive age interval (r) inwhich Profamilia’s programmes first became available to woman i (15–19, 20–24, etc.),birth year dummies (dy), birth county dummy variables (dm) and county-specific linearbirth year trends (dm � t); U represents the standard normal cumulative densityfunction. The bs and cs are estimates of the relationship between family planning andextensive and intensive fertility margins (selection into motherhood and number oflifetime births conditional on being a mother, respectively). The interpretation of thecs would be more complicated if family planning were ultimately related to the decisionto have children (if the bs 6¼ 0) but Table 2 suggests that this is not the case.
The logarithmic transformation of births in (2) is reasonable given its right-skeweddistribution (conditional on any birth).14 However, count data models also fit thedistribution of births well. In particular, negative binomial models provide an attractivealternative and are more appropriate than Poisson models in instances of unequal
13 The former provides a means of investigating the timing of first births, too, as discussed in Section 5.1.14 Retransformation back to the raw scale is problematic when the error term is heteroscedastic across
treatment groups (Manning, 1998; Buntin and Zaslavsky, 2004). However, regressions of log squared residualson age-specific programme exposure suggest that this is not problematic in this instance.
718 [ J U N ET H E E C O N O M I C J O U R N A L
� The Author(s). Journal compilation � Royal Economic Society 2009

mean and variance given their flexible dispersion parameter (Cameron and Trivedi,1998).15 For this reason, log-linear OLS and negative binomial estimates are presentedside-by-side in Section 4. Finally, to explore more flexibly how family planning isassociated with shifts in the distribution of lifetime births, I re-estimate probit specifi-cations analogous to (1) for whether or not a woman had each of k births (for k ¼2,. . ., 8) as dependent variables.
3.2. Socio-Economic Status
To estimate the consequences of contraceptive access for women’s socio-economicstatus, I employ a reduced-form approach analogous to (2). A variety of socio-economicoutcomes are used as dependent variables: women’s years of educational attainment,
Table 2
Association between Age-Specific Profamilia Programme Exposure and Probability of EverHaving a Child
1993 Census 1973 Census
(1) (2) (3) (4)
Family Planning Programme 15–19 �0.0064 �0.0006 �0.0426***y �0.0398***y
(0.0057) (0.0009) (0.0093) (0.0096)Family Planning Programme 20–24 �0.0054 �0.0006 �0.0103** �0.017***
(0.0042) (0.0008) (0.0043) (0.0064)Family Planning Programme 25–29 �0.0044 �0.0004 0.0090 0.0005
(0.0038) (0.0012) (0.0063) (0.0021)Family Planning Programme 30–34 �0.0018 �0.0008 0.0121 �0.0053
(0.0029) (0.0009) (0.0089) (0.0034)Family Planning Programme 35–39 �0.0031 0.0002 0.0073 �0.0048
(0.0027) (0.0013) (0.0068) (0.0038)Family Planning Programme 40–44 0.0049 0.0014 0.0098 �0.0011
(0.0036) (0.0013) (0.0074) (0.0038)Family Planning Programme 45–49 0.0058 �0.0004 0.0036 0.0063
(0.0047) (0.0013) (0.0055) (0.0048)Cohort Fixed Effects Yes Yes Yes YesCounty Fixed Effects Yes Yes Yes YesCounty-Specific Linear Trends No Yes No YesN 950,018 950,018 999,902 999,902Pseudo R2 0.01 0.31 0.09 0.19
Notes. Columns 1 and 2 produced using the sample of women born in Profamilia programme countiesbetween 1911 and 1955 randomly drawn from the 1993 census; columns 3 and 4 produced using the sampleof women born in Profamilia programme counties between 1911 and 1955 randomly drawn from the 1973census. The estimates shown are marginal probabilities obtained from probit models calculated at the meanof the independent variables. Standard errors clustered at the county level shown in parentheses. All speci-fications include birth county and birth year fixed effects; columns 2 and 4 also control for county-specificlinear birth year trends. * p < 0.1, ** p < 0.05, *** p < 0.01. y Significant (a ¼ 0.05) after a mutiple com-parison correction (the Bonferroni multiple comparison correction for seven tests of significance requires asignificance threshold of a ¼ 0.0071 for each test to recover an overall significance level of a ¼ 0.05).
15 In the terminology of Cameron and Trivedi (1998), I specifically use a NB2 model where the dependentvariable y is assumed to have mean l ¼ exp(Xb) and variance l þ al2 (where X is a vector of independent
variables): f ðy j l; aÞ ¼ Cðy þ a�1ÞCðy þ 1ÞCða�1Þ
a�1
ða�1 þ lÞ
� �a�1
la�1 þ l
� �y
. Estimates of the dispersion parameter a range from
0.04 to 0.10 and are statistically different from zero at conventional levels, suggesting the presence of modestoverdispersion.
2010] 719C O N T R A C E P T I O N A S D E V E L O P M E N T ?
� The Author(s). Journal compilation � Royal Economic Society 2009

dichotomous indicators for formal sector employment and �white collar� occupations(conditional on working in the formal sector), cohabitation and self-reported infant/child mortality.16 I rely exclusively on a reduced-form approach because family plan-ning may affect socio-economic outcomes through pathways other than completedlifetime fertility. For example, I present evidence in Section 5.3 that family planninginfluenced the timing of births as well as the number of births. The exclusionrestriction required to instrument for completed lifetime fertility using family planningavailability is therefore presumably not met.
4. Results
4.1. Fertility Results
The first two columns of Table 2 report marginal probabilities from the first part of thetwo-part model (1) for women’s decision ever to have children using the 1993 popu-lation census. They show no evidence that family planning availability was associatedwith fertility choices on the extensive margin of selection into motherhood (Section 4.3discusses the 1973 population census estimates shown in columns 3 and 4).
Table 3
Association between Age-Specific Profamilia Programme Exposure and Completed LifetimeFertility Among Women Ever Having Children
ln(Births) Any Birth (OLS) Births Any Birth (NB2)(1) (2) (3) (4)
Family Planning Programme 15–19 �0.0563***y �0.0394***y �0.0710***y �0.0477***y
(0.0169) (0.0116) (0.0217) (0.0122)Family Planning Programme 20–24 �0.0418*** �0.0372***y �0.0464***y �0.0398***y
(0.0148) (0.0073) (0.0139) (0.0078)Family Planning Programme 25–29 �0.0326*** �0.0226*** �0.0388*** �0.0250***y
(0.0142) (0.0077) (0.0158) (0.0079)Family Planning Programme 30–34 �0.0216** �0.0203** �0.03249*** �0.0186**
(0.0103) (0.0095) (0.0122) (0.0085)Family Planning Programme 35–39 �0.0184 0.0075 �0.0212 0.0114
(0.0169) (0.0054) (0.0163) (0.0077)Family Planning Programme 40–44 �0.0117 �0.0014 �0.0126 �0.0013
(0.0137) (0.0057) (0.0184) (0.0052)Family Planning Programme 45–49 �0.0187 0.0015 �0.0240 0.0012
(0.0149) (0.0061) (0.0208) (0.0049)Cohort Fixed Effects Yes Yes Yes YesCounty Fixed Effects Yes Yes Yes YesCounty-Specific Linear Trends No Yes No YesN 881,966 881,966 881,966 881,966R2 0.11 0.22 – –
Notes. All estimates produced using the sample of women born in Profamilia programme counties between1911 and 1955 randomly drawn from the 1993 census who report ever having a child. Standard errorsclustered at the county level shown in parentheses. All specifications include birth county and birth year fixedeffects; Columns 2 and 4 also control for county-specific linear birth year trends. * p < 0.1, ** p < 0.05,*** p < 0.01. y Significant (a ¼ 0.05) after a mutiple comparison correction (the Bonferroni multiplecomparison correction for seven tests of significance requires a significance threshold of a ¼ 0.0071.)
16 Formal sector employment is determined by DANE; occupation is reported only for those classified asworking in the formal sector.
720 [ J U N ET H E E C O N O M I C J O U R N A L
� The Author(s). Journal compilation � Royal Economic Society 2009

The first and second columns of Table 3 then show log-linear OLS estimates forlifetime births among women ever having a child (the second part of the two-partmodel shown in (2)). Because the dependent variable is in logarithmic form,coefficient estimates can roughly be interpreted as percentage changes in lifetimebirths associated with first having access to family planning in each age interval.In general, the introduction of Profamilia’s programmes was negatively associated withlifetime fertility for women in their late teens to their early thirties. Relative to womenin counties without a programme at fertile ages, family planning availability at all fertileages was associated with about 4% fewer births (the estimate for �Family PlanningProgramme 15–19�). From a base of six births, this reduction is equivalent to about onequarter of a child. Lifetime fertility reductions are progressively smaller for women whowere older when modern contraceptives became available. Women first exposed tofamily planning at ages 30–34 had about 2% fewer children and meaningful associa-tions are not evident among women first exposed at age 35 or beyond. Combiningestimates from both parts of the model, Profamilia’s programmes explain about 6-7%of the fertility decline in programme counties between 1964 and 1993.17
Next, the third and fourth columns of Table 3 show comparable negative binomialestimates. These Figures are slightly larger at young ages than the log-linear estimates(although not significantly so) and they tell the same story.18 They imply that womenaged 15–19 when family planning programmes began gave birth to roughly 5%fewer children in their lifetime (or about one third of a child). Programme effectsare again present among women with programmes beginning at ages into their earlythirties.
Finally, Table 4 reports marginal probabilities obtained from probit specificationsanalogous to (1) estimated using the probability that a woman had k births (fork ¼ 2, . . ., 8) as dependent variables. The estimates are generally positive and statis-tically distinguishable from zero for low values of k (k ¼ 2 for women with programmesestablished at ages 15–19 and 20–24 and k ¼ 4 for women with programmes establishedat older ages) and negative and statistically significant at higher numbers of births(k ¼ 3þ for younger women and k ¼ 5þ for older women, respectively). This patternof results is consistent with reductions in lifetime births across fertile ages and withgreater movement to the left in the distribution of births among women exposed tofamily planning at younger ages (older women already had more children by the timemodern contraceptives became available to them).
4.2. Socio-Economic Results
Table 5 shows results for women’s socio-economic status among women ever havingchildren (and whose fertility choices changed on the intensive margin with family
17 This rough calculation was done as follows. For each programme county, I calculated the proportion ofyears between 1964 and 1993 for which family planning was available. I then produce a weighted average forall programme counties using each county’s share of the 1964 population (84%). Using estimates in Tables 2and 3, I assume that Profamilia’s programmes reduced women’s lifetime fertility by 0.30 children. The overallfertility decline in programme counties between 1964 and 1993 was about 4 lifetime children per woman.(0.30 � 0.84)/4 ¼ 6.3%.
18 The negative binomial model produces a slightly larger log-likelihood value than the maximumlikelihood equivalent of the log-linear OLS model.
2010] 721C O N T R A C E P T I O N A S D E V E L O P M E N T ?
� The Author(s). Journal compilation � Royal Economic Society 2009

planning). Each column shows estimates for a different socio-economic outcome withdependent variables at the top of each column. The first column presents estimates foryears of education. Relative to their peers without access to family planning, womenaged 15 and 19 when a programme was established in their county of birth completed0.05 additional years of schooling. From a base of slightly more than five years ofschooling, this is an increase of about 1%. The absence of meaningful estimates amongfertile women beyond school age when modern contraceptives became available isalso consistent with the assumption that family planning programme placement wasunrelated to the demand for children.19
The second column of Table 5 shows that family planning availability at young ageswas associated with a greater probability of working in the formal sector in 1993.Women aged 15–19 when family planning became available were 2 percentage pointsmore likely to be working, and women at ages 20–24 were 1 percentage point morelikely to report working. These gains represent increases of roughly 7% and 4% in theprobability of formal sector employment. Because the censuses only report employ-ment in the formal sector, these estimates bundle shifts in sectoral choice and move-ment into employment. The third column shows no evidence that conditional onformal sector employment, family planning availability is not associated with womenhaving �white collar� or professional occupations.
Table 4
Association between Age-Specific Profamilia Programme Exposure and Number of Births
DependentVariable: 2 Children 3 Children 4 Children 5 Children 6 Children 7 Children 8 Children
Family PlanningProgramme 15–19
0.0469** �0.0154***y �0.0118** �0.0139***y �0.0077*** �0.0021 �0.0011(0.0203) (0.0047) (0.0045) (0.0032) (0.0022) (0.0018) (0.0021)
Family PlanningProgramme 20–24
0.0293*** �0.0142***y 0.0012 �0.0031** �0.0010 �0.0021** �0.0013(0.0105) (0.0033) (0.0017) (0.0014) (0.0013) (0.0009) (0.0010)
Family PlanningProgramme 25–29
�0.0189 0.0045 0.0177***y �0.0121*** �0.0022 �0.0015* 0.0004(0.0124) (0.0031) (0.0044) (0.0044) (0.0016) (0.0008) (0.0009)
Family PlanningProgramme 30–34
0.0077 0.0027 0.0154** �0.0090*** �0.0027 �0.0024** 0.0010(0.0121) (0.0021) (0.0062) (0.0036) (0.0021) (0.0011) (0.0009)
Family PlanningProgramme 35–39
0.0013 �0.0011 0.0040* 0.0003 �0.0027* �0.0028** 0.0013(0.0013) (0.0026) (0.0024) (0.0022) (0.0016) (0.0012) (0.0009)
Family PlanningProgramme 40–44
0.0017 0.0037 0.0028 �0.0022 �0.0018 �0.0010 0.0012(0.0018) (0.0027) (0.0025) (0.0020) (0.0015) (0.0011) (0.0008)
Family PlanningProgramme 45–49
0.0014 0.0060 �0.0034 �0.0001 0.0013 �0.0023 �0.0013(0.0021) (0.0035) (0.0031) (0.0031) (0.0019) (0.0022) (0.0008)
N 950,018 950,018 950,018 950,018 950,018 950,018 950,018Pseudo R2 0.06 0.05 0.02 0.03 0.04 0.06 0.08
Notes. All columns produced using the sample of women born in Profamilia programme counties between1911 and 1955 randomly drawn from the 1993 census. The estimates shown are marginal probabilitiesobtained from probait models calculated at the mean of the independent variables. Standard errors clusteredat the county level shown in parentheses. All specifications include birth county and birth year fixed effectsand county-specific linear birth year trends. * p < 0.1, ** p < 0.05, *** p < 0.01. y Significant (a ¼ 0.05)after a mutiple comparison correction (the Bonferroni multiple comparison correction for seven tests ofsignificance requires a significance threshold of a ¼ 0.0071 for each test to recover an overall significancelevel of a ¼ 0.05).
19 Most Colombians did not attend college during the period studied. Among those who did, five-yearundergraduate degrees were generally terminal degrees.
722 [ J U N ET H E E C O N O M I C J O U R N A L
� The Author(s). Journal compilation � Royal Economic Society 2009

The fourth column of Table 5 shows that the establishment of a family planningprogramme at young ages was associated with a lower probability of cohabitating in1993 (either being married or participating in a long-term extra-marital cohabitation).Women 15–19 when family planning became available were about 1 percentage pointless likely to be cohabitating in 1993, a reduction of about 2%. The link betweencohabitation and well-being is nuanced and the direction of the relationship maydepend on the circumstances. For example, there may be gains from specialisation inhousehold production (Becker, 1981; Lundberg et al., 1997; Pollak, 2005) but womenwith little bargaining power within households (and their children) may do betterliving independently (Miller, 2008).
Finally, the last column shows no clear evidence that family planning influenced theself-reported infant and child mortality rate. The point estimates corresponding to firstfamily planning availability at each age interval are close to zero and they are preciselyestimated. However, measurement error may be more problematic for self-reportedinfant and child mortality. These inaccuracies could be correlated with family planningavailability, or they could simply produce classical measurement error; the sign of thepotential bias is unclear. Changes in the composition of births could also be relevant.
Table 5
Association between Age-Specific Profamilia Programme Exposure and Socio-Economic StatusAmong Women Ever Having a Child
DependentVariable:
Years ofEducation
Work inFormal Sector
�White-Collar�Job Cohabitate
Share ofChildren Dead
Family PlanningProgramme 15–19
0.0491***y 0.0206*** �0.0001 �0.0104** �0.0010*(0.0159) (0.0076) (0.0029) (0.0045) (0.0005)
Family PlanningProgramme 20–24
0.0252 0.0123*** �0.0002 �0.0076* �0.0006(0.0194) (0.0044) (0.0044) (0.0041) (0.0005)
Family PlanningProgramme 25–29
0.0174 0.0058 �0.0040 �0.0045 �0.0008(0.0199) (0.0048) (0.0056) (0.0042) (0.0005)
Family PlanningProgramme 30–34
0.0126 0.0046 �0.0081 0.0037 �0.0014(0.0164) (0.0045) (0.0073) (0.0062) (0.0008)
Family PlanningProgramme 35–39
�0.0125 0.0039 �0.0037 �0.0051 �0.0006(0.0180) (0.0073) (0.0089) (0.0052) (0.0007)
Family PlanningProgramme 40–44
0.0337 0.0047 0.0010 0.0007 �0.0002(0.0325) (0.0054) (0.0080) (0.0044) (0.0009)
Family PlanningProgramme 45–49
0.0021 0.0014 0.0077 �0.0005 0.0004(0.0290) (0.0074) (0.0128) (0.0045) (0.0008)
DependentVariable Mean
5.18 0.65 0.48 0.60 0.11
N 881,966 868,549 201,950 876,710 859,510R2/Pseudo R2 0.26 0.15 0.05 0.08 0.05
Notes. All estimates produced using the sample of women born in Profamilia programme counties between1911 and 1955 randomly drawn from the 1993 census who report ever having a child. The results shown forWork in Formal Sector, �White-Collar � Job (conditional on working in the formal sector), and Cohabitate aremarginal probabilities obtained from probit models calculated at the mean of the independent variables.Standard errors clustered at the county level shown in parentheses. All specifications include birth county andbirth year fixed effects and county-specific linear birth year trends. * p < 0.1, ** p < 0.05, *** p < 0.01.y Significant (a ¼ 0.05) after a mutiple comparison correction (the Bonferroni multiple comparison cor-rection for seven tests of significance requires a significance threshold of a ¼ 0.0071 for each test to recoveran overall significance level of a ¼ 0.05).
2010] 723C O N T R A C E P T I O N A S D E V E L O P M E N T ?
� The Author(s). Journal compilation � Royal Economic Society 2009

Because first-born children are generally more likely to die, all else equal, lower age-specific infant and child mortality rates could be offset as first births grow as a share oftotal births (Bongaarts, 1987). Nevertheless, the absence of detectable relationship withfamily planning availability stands in contrast with the view that the number and timingof births are important determinants of infant mortality (Wolpin, 1997).
4.3. How Did Family Planning Produce Socio-Economic Benefits for Colombian Women?
The age patterns of socio-economic gains associated with family planning in Table 5 donot generally match the age pattern of lifetime fertility reductions shown in Table 3.While socio-economic improvements are limited to women gaining access to familyplanning in their teens and early twenties, fertility reductions occur up to age 35. Onepossible explanation for this pattern is a common finding in wealthy country studies – aprimary benefit of modern contraceptives is lower costs of postponing motherhood(Angrist and Evans, 1998; Goldin and Katz, 2002; Miller, 2005; Bailey, 2006). ThisSection briefly explores the relationship between family planning and the timing offirst births among Colombian women.
The Colombian population censuses report neither the years of women’s births norage at first birth. However, the finding that family planning ultimately seems unrelatedto selection into motherhood provides an alternative way of investigating how familyplanning availability is associated with the timing of first births. The 1973 census wasconducted shortly after Profamilia established programmes in many counties andyoung women exposed to programmes in these counties still had most of their fertileyears ahead of them. Programme effects on whether or not young women had childrenat the time of the 1973 census can therefore reasonably be interpreted as effects on thetiming of first births. The third and fourth columns of Table 2 present results from the1973 census estimated using (1) (mirroring the 1993 census results in the first twocolumns). In 1973, however, women gaining access to family planning in their lateteens were about 4 percentage points less likely to be mothers. Together with the firsttwo columns, this result suggests that Profamilia’s programmes allowed women aged15–19 to postpone their first birth. Because this estimate only captures first birthspostponed from before until after the 1973 census was conducted, the magnitude ofdelayed first births related to family planning is presumably much larger.
Unlike the lifetime fertility results in Table 3, the pattern of first birth postponementshown in Table 2 much more closely corresponds to the age pattern of socio-economicgains shown in Table 5. The similarity of these age gradients suggests that as in wealthycountries, the timing of first births in Colombia seems to be a more important deter-minant of socio-economic outcomes than completed lifetime fertility.
4.4. Towards Estimates of Fertility and Socio-Economic Change among �Treated � Women
The estimates in Tables 2 to 5 should be interpreted as intent-to-treat (ITT) estimatesfor family planning availability (Bloom, 1984; Heckman et al., 1999; Katz et al., 2001).Although these results have immediate policy relevance, a central interest of socialscientists is the consequences of family planning among women who actually usemodern contraceptives. Even if the assignment of contraceptive availability were
724 [ J U N ET H E E C O N O M I C J O U R N A L
� The Author(s). Journal compilation � Royal Economic Society 2009

quasi-random, unobserved preferences determine contraceptive use. A natural solu-tion to this problem would be to instrument for contraceptive use with a measure ofavailability (assuming Profamilia alone was responsible for contraceptive supply inearly years). However, the Colombian population censuses do not report contraceptiveuse, Profamilia’s utilisation statistics are unavailable for years prior to 1978, andcontraceptive sales by drug stores and other distributors were not systematicallydocumented.
Some crude insight into the magnitude of treatment-on-treated (TOT) effects cannevertheless be gleaned by re-scaling the intent-to-treat estimates using national-levelcontraceptive prevalence figures (Seltzer and Gomez, 1998) and the share of Colombianwomen living in programme counties in those years. For example, 1964 census popu-lation estimates imply that 5,234,000 of 17,484,000 Colombians lived in counties whereProfamilia operated in 1969. So in rough terms, 5,234,000/17,484,000 � 0.30 ofColombians had contraceptives available to them. Seltzer and Gomez (1998) suggestthat 18.2% of married women at reproductive ages in Colombia reported using con-traceptives in 1969; 18.2/0.30 � 60.8%. Ignoring selection into contraceptive use, thisadmittedly rough calculation suggests dividing the ITT estimates by 0.61 or so, whichimplies lifetime fertility reductions of 11–12% and increases in education attainment of0.08 years among those treated at young ages at the midpoint of Profamilia’s expansion.
5. Validity Tests
This Section examines more closely the assumption that joint programme placementand timing were largely exogenous. It then considers other potential concerns aboutselective attrition among mothers due to differential mortality, migration and thepossibility that Profamilia’s programmes benefited areas other than the counties inwhich they were based.
5.1. Programme Placement
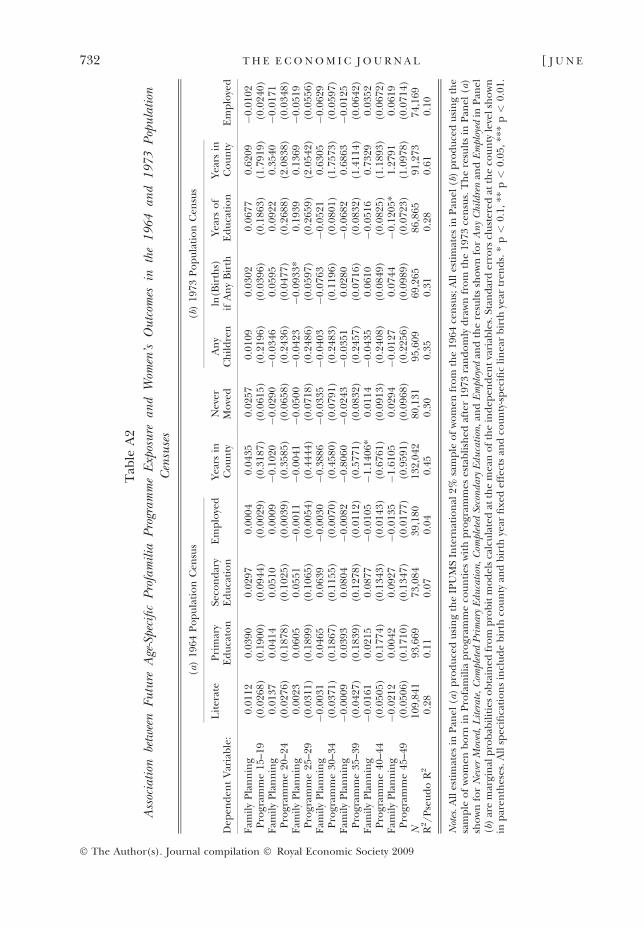
To further probe the validity of the identifying assumption, I first use populationcensus samples to investigate how future age-specific family planning availability isrelated to fertility and socio-economic outcomes shortly before programmes wereestablished. This is essentially a test for trend breaks in age-specific county-level char-acteristics that occurred just prior to the introduction of a programme (and so shouldnot be attributed to family planning programmes per se). To do so, I conduct analysesusing both women in programme counties in the 1964 census sample and women inthe 1973 census in counties with programmes beginning after 1973.20 Appendix TableA2 shows estimates obtained by regressing a variety of relevant outcomes on futureage-specific programme exposure in both samples. They suggest that programmeplacement was not correlated with pre-existing age and county-specific trends infertility or socio-economic status.
An additional way to examine the validity of the identifying assumption is to testfor programme effects among women outside the biologically-determined ages at
20 The 1964 census sample does not contain measures of fertility.
2010] 725C O N T R A C E P T I O N A S D E V E L O P M E N T ?
� The Author(s). Journal compilation � Royal Economic Society 2009

which they should benefit from reduced contraceptive costs (ages 45–49, forexample). Significant estimates at these ages might also suggest that this article’smain results mistakenly capture pre-existing trends in women’s status or the demandfor children. However, Tables 2 to 5 show the absence of programme effects atinfertile ages for all relevant outcomes. Applying similar logic to educationalattainment, Table 5 also shows no evidence of education responding to familyplanning availability at post-schooling ages. Comparisons among successively olderage groups of women (not shown) also yield precise estimates that are indistin-guishable from zero.
Finally, looking for programme effects at any age among women who never had achild arguably provides a stronger test of the identifying assumption. Because familyplanning does not appear to influence women’s decisions to become mothers, womenof the same age and born in the same counties but who never gave birth form anotherreasonable control group for women with children. Importantly, this approach is well-suited for detecting programme targeting to changing demand conditions amongyoung women (the ones most likely to benefit from family planning) precisely at thetime of programme establishment. Appendix Table A3 shows age-specific estimatesobtained by re-estimating (1) and (2) for socio-economic outcomes among women whonever had a child. There is little evidence of any programme effect at any age on anysocio-economic outcome among childless women.21
Taken together, the results in this Section suggest that if there were any confoundingforce responsible for the article’s main findings, it must have varied in a very specificway – across counties and over time in the same pattern as Profamilia’s programmes,only affecting women at biologically plausible ages within each county and not affectingchildless women.
5.2. Selective Mortality
Another potential difficulty is the possibility of selective mortality. If family planningaltered women’s survival rates (by resulting in fewer unsafe abortions, for example), itwould also alter the composition of women across counties in the censuses. Colombia’slow-quality vital statistics from the 1960s and 1970s make it difficult to investigate thispossibility directly. However, the direction of any selective mortality bias is likely to bedownward because it is poor women who disproportionately seek unsafe abortions. Ifabortions and modern contraceptives are substitutes, poor women would thereforehave higher survival rates in counties with earlier family planning programmes. Poorwomen would then comprise a larger share of all women in counties with earlierprogrammes – because poor women generally have higher fertility rates, earlier firstbirths and worse socio-economic indicators, family planning estimates would beattenuated.
Using cohort size as a proxy for survival (or cumulative mortality), the first column ofAppendix Table A4 shows more direct evidence on selective mortality. Specifically,estimates obtained by regressing log female birth cohort size on age-specificprogramme exposure (as well as birth county and birth year fixed effects and
21 About 14% of women in the sample never had a child.
726 [ J U N ET H E E C O N O M I C J O U R N A L
� The Author(s). Journal compilation � Royal Economic Society 2009

county-specific birth year trends) suggest no meaningful relationship between age-specific family planning availability and survival.22
5.3. Migration and Contamination
To address the possibility of confounding selection into programme areas throughmigration, this article’s analyses are conducted according to women’s county ofbirth rather than county of residence (under the assumption that place of birth wasnot determined by future family planning availability). If most migration occurredbefore fertile ages, county of residence may better reflect women’s true familyplanning exposure and the endogeneity of county of residence could be addressedby using county of birth as an instrument. However, analyses using the 1973 census(not shown) indicate that during this period, women migrated intensivelythroughout their twenties and into their thirties, ages far beyond mean age at firstmarriage (19.8 in 1976 and 20.2 in 1986 (Guzman et al., 1996)).23 Because a largeshare of migration occurred at ages past marriage and important fertility decisions,basing the article’s analyses on county of birth seems appropriate. Nevertheless,incorrect assignment of age-specific family planning exposure to women who moveresults in some degree of attenuation.
If attenuation were the only migration-related concern (i.e., if migration wereunrelated to programme timing and placement), it would be preferable to focus onthe subset of women who never moved. Exposure would be correctly assigned tothese women, and the characteristics of movers and stayers would not differ in a waythat is systematically related to age-specific programme exposure. Appendix TableA5 repeats the analyses shown in Table 2, 3 and 5 with never-moving women. Theestimates are generally larger than (but statistically indistinguishable from) theestimates with movers and stayers together, consistent with the presence of someattenuation.
The second and third columns of Appendix Table A4 then investigate more di-rectly whether or not migration was related to age-specific programme exposure (andhence whether or not the estimates in Appendix Table A5 are preferable to those inTables 2, 3 and 5). The second column shows estimates obtained by regressing theshare of female residents living in their county of birth on age-specific family plan-ning exposure, suggesting that there is indeed migration related to age-specificprogramme timing. The age-specific estimates are not generally statistically distin-guishable from each other (with the exception of the top row) but they are infor-mally suggestive of more movement of women from counties with later programmes.The third column then explores if these women are moving to areas with earlierprogrammes (if the movers have greater demand for family planning, for example).Specifically, using the 1973 census sample, it regresses the share of female residents
22 Ignoring the standard errors, the age pattern of the point estimates in the first column of AppendixTable A4 is consistent with relatively smaller reductions in cohort size (or lower mortality) associated with firstexposure at younger ages relative to older ages. This age pattern would therefore be broadly consistent withfamily planning leading to fewer unsafe abortions or lower maternal mortality.
23 Specifically, I use the 1973 population census to estimate the relationship between whether or notwomen had moved in the past five years and women’s age using a probit model.
2010] 727C O N T R A C E P T I O N A S D E V E L O P M E N T ?
� The Author(s). Journal compilation � Royal Economic Society 2009

born in a given county who were living in a county with an earlier programme on age-specific family planning exposure. Although imprecise, the estimates are not statis-tically different from zero, consistent with no systematic movement to counties withearlier programmes. However, the second column leaves open the possibility thatdepartures from counties with earlier programmes may have been less likely (perhapsbecause family planning led to a more desirable local environment, which plausiblyvaries with unobserved characteristics related to the demand for family planning,schooling, etc.). The estimates in Tables 2, 3 and 5 therefore seem preferable tothose in Appendix Table A5.
Finally, it is possible that Profamilia’s programmes benefited areas other than thecounties in which they were based. However, Figure 2 shows that programme areaswere not generally geographically contiguous. Moreover, most of Colombia’s majorpopulation centres are separated by formidable mountainous stretches of the Andes(attenuating the relationship between geographic distance and travel time in much ofthe country). Nevertheless, if modern contraceptives reached areas that themselves hadprogrammes established later, the resulting bias would be downward.
6. Extensions
6.1. Comparisons with Well-documented Interventions Fostering Human Capital Accumulation
Given debate over the importance of family planning in reducing poverty andpromoting development, informal comparisons with other development interven-tions help to place these benefits in context. Consider three extensively-studiedapproaches to increasing educational attainment in poor countries. First, a large-scale school construction programme in Indonesia during the 1970s increasedschooling by about 0.15 years on average, or roughly 2% (Duflo, 2001). Second,among Blacks under South Africa’s apartheid-era government, a 25% reduction inclass size was associated with an extra half year of schooling, an increase of about6% (Case and Deaton, 1999). Third, randomised private school vouchers inColombia raised educational attainment by 0.1 years of schooling, or about 1.5%(Angrist et al., 2002). Strikingly, the increases in women’s schooling associated withProfamilia’s programmes are over half of those produced by Colombia’s schoolvoucher programme. Even if family planning’s influence on lifetime fertility ismodest, its education benefits are not dissimilar to those produced by well-regardedinitiatives specifically targeting education.
6.2. Programme Costs
In addition to the size of family planning’s benefits, a key issue is how much it costs toproduce them. A formal cost–benefit analysis of Profamilia’s programmes is not pos-sible because many of its benefits cannot be directly estimated and valued. Crudecalculations of programme costs and average cost-effectiveness are feasible, however.Arguably the strongest criticism of the Matlab experiment is its unrealistic programmeexpenses and its large average cost–effectiveness ratio (the family planning treatmentcost about 10% of per capita GDP per fertile woman and about 120% of per capita GDP
728 [ J U N ET H E E C O N O M I C J O U R N A L
� The Author(s). Journal compilation � Royal Economic Society 2009

Tab
le6
Pro
fam
ilia
’sP
rogr
amm
eC
osts
and
Ave
rage
Cos
t-E
ffec
tive
nes
s
Exp
end
itu
res
Exp
end
itu
res
per
Fer
tile
Wo
man
Exp
end
itu
res
per
Fer
tile
Wo
man
asa
shar
eo
fp
erca
pit
aG
DP
Exp
end
itu
res
per
Ave
rted
Bir
th
Exp
end
itu
res
per
Ave
rted
Bir
thas
aSh
are
of
per
cap
ita
GD
P
Exp
end
itu
res
per
Year
of
Wo
men
’sSc
ho
oli
ng
Exp
end
itu
res
per
Year
of
Wo
men
’sSc
ho
oli
ng
asa
Shar
eo
fp
erca
pit
aG
DP
1973
$1,6
24,0
00$0
.42
0.10
%$2
4.33
5.71
%$4
8.65
11.4
2%19
80$5
,072
,000
$1.0
40.
09%
$60.
265.
13%
$120
.52
10.2
6%19
86$6
,929
,000
$1.2
00.
11%
$70.
046.
48%
$140
.08
12.9
5%
Not
es.
No
min
alex
pen
dit
ure
dat
ao
bta
ined
fro
mSe
ltze
ran
dG
om
ez(1
998)
;n
um
ber
of
fert
ile
wo
men
inp
rogr
amm
ear
eas
ob
tain
edfr
om
esti
mat
esp
rovi
ded
by
DA
NE
;n
om
inal
per
cap
ita
GD
Pin
1975
term
so
bta
ined
fro
mB
anco
de
laR
epu
bli
ca(h
ttp
://
ww
w.b
anre
p.g
ov.
co/
eco
no
me/
dsb
b/
i_sr
ea_0
01.x
ls).
Th
en
um
ber
of
aver
ted
bir
ths
are
calc
ula
ted
assu
min
gn
op
rogr
amm
eef
fect
on
the
shar
eo
fw
om
enh
avin
gch
ild
ren
(ap
pro
xim
ated
as86
%)
and
a2%
aver
age
amo
ng
fert
ile
wo
men
.T
he
incr
ease
ined
uca
tio
nis
calc
ula
ted
assu
min
gn
op
rogr
amm
eef
fect
on
the
shar
eo
fw
om
enh
avin
gch
ild
ren
and
anav
erag
ein
crea
seo
f0.
01ye
ars
of
edu
cati
on
amo
ng
fert
ile
age
wo
men
ever
hav
ing
ach
ild
.
2010] 729C O N T R A C E P T I O N A S D E V E L O P M E N T ?
� The Author(s). Journal compilation � Royal Economic Society 2009

per averted birth (Pritchett, 1994)). Profamilia’s programmes were dramatically lessexpensive relative to income per capita (Seltzer and Gomez, 1998).24 As Table 6 shows,average programme costs were about 0.1% of per capita GDP per fertile woman inprogramme municipalities (about 1/100th of the Matlab costs relative to income) andabout 6% of per capita GDP per birth averted (about 1/20th of the Matlab costs relativeto income). These rough calculations suggest that family planning can be successful forconsiderably less than in Matlab. Profamilia’s programmes were also reasonably cost-effective in increasing educational attainment (just above 10% of per capita GDP peryear of women’s schooling).
7. Conclusion
In light of ongoing debate about family planning’s ability to reduce fertility indeveloping countries, this article suggests that neither side is exactly right. However,it sides more closely with the view that other forces (either on the supply or demandside) are more potent. Profamilia’s programmes reduced women’s completed lifetimefertility by roughly half a child but they explain only 6–7% of the fertility decline inprogramme counties between 1964 and 1993 as Colombia underwent its demo-graphic transition.
Despite its modest role in reducing lifetime fertility, this article also demonstratesthat the ability of family planning to fight poverty cannot easily be dismissed. Colom-bian women with access to modern contraceptives at young ages experiencedsubstantial socio-economic gains. A formal cost–benefit analysis of Profamilia’s pro-grammes would be difficult because many of its benefits are hard to value. However, thegains in education and formal sector labour force participation attributable to familyplanning place it among some of the best-regarded development interventions. Giventhat 350 million couples worldwide presently lack access to family planning services(UNFPA, 2004), family planning may deserve more attention in dialogue surroundingbroader poverty relief efforts.
The age pattern of results suggests that family planning most likely generated socio-economic benefits by allowing young women to postpone their first birth. This findingimplies that the development literature’s focus on completed lifetime fertility and childquantity overlooks a critical dimension of fertility emphasised by wealthy countrystudies – the lifecycle timing of births (and first births in particular) (Ribar, 1999;Goldin and Katz, 2002; Bailey, 2006). It also suggests that Latin America’s contempo-rary increases in teenage motherhood may have more detrimental consequences thanis presently recognised (Florez and Nu~nez, 2002).
24 Only direct accounting costs are included (analogous to the approach used to estimate average cost-effectiveness for the Matlab experiment); the costs of public funds and related costs are omitted given thatProfamilia was entirely privately financed for many early years. To produce the benefits estimated in Tables 2to 5, spending is required throughout a woman’s fertile years. However, the annual spending figures are notage-specific but rather apply to women at all ages. I therefore approximate programme costs using annualexpenditures and programme effectiveness using parametric estimates of lifetime fertility reductions andeducational gains.
730 [ J U N ET H E E C O N O M I C J O U R N A L
� The Author(s). Journal compilation � Royal Economic Society 2009

Finally, this article’s major findings imply that fertility control, broadly defined, canbe quite costly in the absence of modern contraceptives. Significant dimensions ofthese costs may include forgoing desired sexual activity and negotiating sexualbehaviour and fertility with male partners. Because the costs of fertility control indeveloping countries are poorly understood, this is an important topic for furtherresearch. Policies that aim to help women achieve their desired level of fertility or toimprove economic and social conditions generally may do well to emphasise reducingthe costs of fertility control beyond what family planning achieves.
Stanford Medical School and NBER
Submitted: 5 May 2007Accepted: 29 January 2009
Appendix
Table A1The Timing of Profamilia’s Programmes in Colombian Counties
County: Date: County: Date:
Bogota September 1965 Girardot May 1971Medellin September 1966 Barrancabermeja June 1971Barranquilla May 1967 Tulua June 1971Sogamoso February 1968 Valledupar October 1971Cucuta Mar 1968 Popayan November 1971Neiva June 1968 Tumaco January 1972Ibaque August 1968 Santa Marta March 1972Pasto August 1968 Villavicencio April 1972Armero October 1968 Caucasia 1976Bucaramanga October 1968 Rionegro March 1981Buenaventura October 1968 Tunja March 1985Puerto Berrio November 1968 Quibdo 1985Manizales December 1968 Soledad 1986Cali February 1969 Ocana October 1987Monteria April 1969 Bello 1987Pereira June 1969 Florencia 1987Armenia September 1969 Riohacha 1987Palmira April 1970 San Andres 1987Sincelejo June 1970 Apartado 1988Cartagena September 1970 Aguablanca 1989
Notes. Programme dates obtained by personal communication with Profamilia. Programme years codedaccording to year of programme initiation, regardless of month.
2010] 731C O N T R A C E P T I O N A S D E V E L O P M E N T ?
� The Author(s). Journal compilation � Royal Economic Society 2009
Tab
leA
2
Ass
ocia
tion
betw
een
Futu
reA
ge-S
peci
fic
Pro
fam
ilia
Pro
gram
me
Exp
osu
rean
dW
omen
’sO
utc
omes
inth
e1964
and
1973
Pop
ula
tion
Cen
suse
s
(a)
1964
Po
pu
lati
on
Cen
sus
(b)
1973
Po
pu
lati
on
Cen
sus
Dep
end
ent
Var
iab
le:
Lit
erat
eP
rim
ary
Ed
uca
ton
Seco
nd
ary
Ed
uca
tio
nE
mp
loye
dYe
ars
inC
ou
nty
Nev
erM
ove
dA
ny
Ch
ild
ren
ln(B
irth
s)if
An
yB
irth
Year
so
fE
du
cati
on
Year
sin
Co
un
tyE
mp
loye
d
Fam
ily
Pla
nn
ing
Pro
gram
me
15–1
90.
0112
0.03
900.
0297
0.00
040.
0435
0.02
570.
0109
0.03
020.
0677
0.62
09�
0.01
02(0
.026
8)(0
.190
0)(0
.094
4)(0
.002
9)(0
.318
7)(0
.061
5)(0
.219
6)(0
.039
6)(0
.186
3)(1
.791
9)(0
.024
0)F
amil
yP
lan
nin
gP
rogr
amm
e20
–24
0.01
370.
0414
0.05
100.
0009
�0.
1020
�0.
0290
�0.
0346
0.05
950.
0922
0.35
40�
0.01
71(0
.027
6)(0
.187
8)(0
.102
5)(0
.003
9)(0
.358
5)(0
.065
8)(0
.243
6)(0
.047
7)(0
.268
8)(2
.083
8)(0
.034
8)F
amil
yP
lan
nin
gP
rogr
amm
e25
–29
0.00
230.
0605
0.05
51�
0.00
11�
0.00
41�
0.05
00�
0.04
23�
0.09
33*
0.19
390.
1369
�0.
0519
(0.0
311)
(0.1
899)
(0.1
065)
(0.0
054)
(0.4
444)
(0.0
718)
(0.2
486)
(0.0
597)
(0.2
659)
(2.0
542)
(0.0
556)
Fam
ily
Pla
nn
ing
Pro
gram
me
30–3
4�
0.00
310.
0465
0.06
39�
0.00
30�
0.38
86�
0.03
35�
0.04
03�
0.07
63�
0.05
210.
6305
�0.
0629
(0.0
371)
(0.1
867)
(0.1
155)
(0.0
070)
(0.4
580)
(0.0
791)
(0.2
483)
(0.1
196)
(0.0
801)
(1.7
573)
(0.0
597)
Fam
ily
Pla
nn
ing
Pro
gram
me
35–3
9�
0.00
090.
0393
0.08
04�
0.00
82�
0.80
60�
0.02
43�
0.03
510.
0280
�0.
0682
0.68
63�
0.01
25(0
.042
7)(0
.183
9)(0
.127
8)(0
.011
2)(0
.577
1)(0
.083
2)(0
.245
7)(0
.071
6)(0
.083
2)(1
.411
4)(0
.064
2)F
amil
yP
lan
nin
gP
rogr
amm
e40
–44
�0.
0161
0.02
150.
0877
�0.
0105
�1.
1406
*0.
0114
�0.
0435
0.06
10�
0.05
160.
7329
0.03
52(0
.050
5)(0
.177
4)(0
.134
3)(0
.014
3)(0
.676
1)(0
.091
3)(0
.240
8)(0
.084
9)(0
.082
5)(1
.189
3)(0
.067
2)F
amil
yP
lan
nin
gP
rogr
amm
e45
–49
�0.
0212
0.00
420.
0927
�0.
0135
�1.
6105
0.02
94�
0.01
270.
0744
�0.
1205
*1.
2791
0.06
19(0
.050
6)(0
.171
0)(0
.134
7)(0
.017
7)(0
.959
1)(0
.096
8)(0
.225
6)(0
.098
9)(0
.072
3)(1
.097
8)(0
.071
4)N
109,
841
93,6
6973
,084
39,1
8013
2,04
280
,131
95,6
0969
,265
86,8
6591
,273
74,1
69R
2/
Pse
ud
oR
20.
280.
110.
070.
040.
450.
300.
350.
310.
280.
610.
10
Not
es.
All
esti
mat
esin
Pan
el(a
)p
rod
uce
du
sin
gth
eIP
UM
SIn
tern
atio
nal
2%sa
mp
leo
fw
om
enfr
om
the
1964
cen
sus;
All
esti
mat
esin
Pan
el(b
)p
rod
uce
du
sin
gth
esa
mp
leo
fw
om
enb
orn
inP
rofa
mil
iap
rogr
amm
eco
un
ties
wit
hp
rogr
amm
eses
tab
lish
edaf
ter
1973
ran
do
mly
dra
wn
fro
mth
e19
73ce
nsu
s.T
he
resu
lts
inP
anel
(a)
sho
wn
for
Nev
erM
oved
,L
iter
ate,
Com
plet
edP
rim
ary
Edu
cati
on,
Com
plet
edSe
con
dary
Edu
cati
on,
and
Em
ploy
edan
dth
ere
sult
ssh
ow
nfo
rA
ny
Chi
ldre
nan
dE
mpl
oyed
inP
anel
(b)
are
mar
gin
alp
rob
abil
itie
so
bta
ined
fro
mp
rob
itm
od
els
calc
ula
ted
atth
em
ean
of
the
ind
epen
den
tva
riab
les.
Stan
dar
der
rors
clu
ster
edat
the
cou
nty
leve
lsh
ow
nin
par
enth
eses
.A
llsp
ecifi
cati
on
sin
clu
de
bir
thco
un
tyan
db
irth
year
fixe
def
fect
san
dco
un
ty-s
pec
ific
lin
ear
bir
thye
artr
end
s.*
p<
0.1,
**p<
0.05
,**
*p<
0.01
.
732 [ J U N ET H E E C O N O M I C J O U R N A L
� The Author(s). Journal compilation � Royal Economic Society 2009

Table A3
Association between Age-Specific Profamilia Programme Exposure and Socio-Economic StatusAmong Women Never Having a Child
Dependent Variable:Years of
EducationWork in
Formal Sector‘‘White-Collar’’
Job Cohabitate
Family Planning Programme 15–19 �0.0122 �0.0034 0.0154 �0.0037(0.1200) (0.0080) (0.0190) (0.0048)
Family Planning Programme 20–24 0.0148 �0.0098 0.0053 0.0009(0.0932) (0.0062) (0.0091) (0.0053)
Family Planning Programme 25–29 0.0304 �0.0111 0.0135 �0.0064(0.0696) (0.0135) (0.0132) (0.0078)
Family Planning Programme 30–34 �0.0442 0.0036 0.0272 0.0135(0.1391) (0.0103) (0.0208) (0.0090)
Family Planning Programme 35–39 0.0451 0.0077 0.0283 0.0097(0.0766) (0.0103) (0.0239) (0.0087)
Family Planning Programme 40–44 �0.0139 �0.0021 0.0148 0.0007(0.0419) (0.0092) (0.0421) (0.0105)
Family Planning Programme 45–49 0.0437 �0.0052 �0.0072 �0.0028(0.1000) (0.0100) (0.0078) (0.0105)
N 68,052 67,195 23,913 67,510R2/Pseudo R2 0.25 0.17 0.04 0.06
Notes. All estimates produced using the sample of women born in Profamilia programme counties between 1911 and1955 randomly drawn from the 1993 census who report never having a child. The results shown for Work in FormalSector, White-Collar Job (conditional on working in the formal sector), and Cohabitate are marginal probabilitiesobtained from probit models calculated at the mean of the independent variables. Standard errors clustered at thecounty level shown in parentheses. All specifications include birth county and birth year fixed effects and county-specific linear birth year trends. * p < 0.1, ** p < 0.05, *** p < 0.01.
Table A4Association of Age-Specific Profamilia Programme Exposure with Female Cohort Size, Lifetime
Migration, and Migration to an Earlier Programme County
Dependent Variable:ln(Female
Cohort Size)
Share of FemaleResidents inBirth County
Share of Moving FemalesWho Moved to a County with an
Earlier Programme
Family Planning Programme 15–19 �0.0314 �0.0227*** �0.2252(0.0399) (0.0075) (0.3222)
Family Planning Programme 20–24 �0.0855 �0.0431***y �0.2144(0.0796) (0.0114) (0.3089)
Family Planning Programme 25–29 �0.1233 �0.0623***y �0.2163(0.1227) (0.0160) (0.3074)
Family Planning Programme 30–34 �0.1639 �0.0688***y �0.2517(0.1674) (0.0205) (0.3042)
Family Planning Programme 35–39 �0.1290 �0.0702*** �0.2818(0.2057) (0.0261) (0.2934)
Family Planning Programme 40–44 �0.1129 �0.0728** �0.2916(0.2429) (0.0309) (0.2776)
Family Planning Programme 45–49 �0.1135 �0.0717** �0.2609(0.2839) (0.0361) (0.2619)
N 41,695 46,455 38,953R2 0.95 0.81 0.88
Notes. First column estimates produced using birth county-birth year female cohort size counts from the complete1993 census; second column estimates produced using county-birth year ratios of women living in their birthcounty to all women living in a county from the complete 1993 census; and third column estimates producedusing county-birth year ratios of women living in a county with an earlier programme than their birth county to allwomen not living in their birth county from the complete 1973 census. Standard errors clustered at the countylevel shown in parentheses. All specifications include birth county (county) and birth year fixed effects andcounty-specific linear birth year trends. * p < 0.1, ** p < 0.05, *** p < 0.01. y Significant (a ¼ 0.05) after amutiple comparison correction (the Bonferroni multiple comparison correction for seven tests of significancerequires a significance threshold of a ¼ 0.0071 for each test to recover an overall significance level of a ¼ 0.05).
2010] 733C O N T R A C E P T I O N A S D E V E L O P M E N T ?
� The Author(s). Journal compilation � Royal Economic Society 2009

Tab
leA
5
Ass
ocia
tion
betw
een
Age
-Spe
cifi
cP
rofa
mil
iaP
rogr
amm
eE
xpos
ure
and
Soci
oeco
nom
icO
utc
omes
Am
ong
Nev
er-M
over
sE
ver
Hav
ing
aC
hild
Dep
end
ent
Var
iab
le:
An
yB
irth
ln(B
irth
s)j
An
yB
irth
Bir
thsjA
ny
Bir
th(N
B)
Year
so
fE
du
cati
on
Wo
rkin
Fo
rmal
Sect
or
�Wh
ite-
Co
llar
�Jo
bC
oh
abit
ate
Shar
eo
fC
hil
dre
nD
ead
Fam
ily
Pla
nn
ing
Pro
gram
me
15–1
9�
0.00
15�
0.05
71**
*y�
0.06
29**
*0.
0718
***y
0.03
37**
*y0.
0165
�0.
0179
***y
�0.
0011
**(0
.001
1)(0
.017
7)(0
.024
1)(0
.018
4)(0
.006
6)(0
.019
5)(0
.004
1)(0
.000
5)F
amil
yP
lan
nin
gP
rogr
amm
e20
–24
�0.
0011
�0.
0489
***y
�0.
0432
***y
�0.
0254
0.01
39**
0.00
58�
0.00
30�
0.00
02(0
.001
3)(0
.006
0)(0
.012
8)(0
.022
6)(0
.006
8)(0
.009
4)(0
.003
8)(0
.000
6)F
amil
yP
lan
nin
gP
rogr
amm
e25
–29
�0.
0012
�0.
0457
***y
�0.
0442
***y
0.01
390.
0007
0.01
340.
0009
0.00
03(0
.001
7)(0
.011
6)(0
.006
8)(0
.022
1)(0
.002
8)(0
.013
0)(0
.002
6)(0
.000
6)F
amil
yP
lan
nin
gP
rogr
amm
e30
–34
�0.
0018
�0.
0369
***y
�0.
0313
***y
�0.
0013
�0.
0057
0.02
930.
0060
�0.
0007
(0.0
013)
(0.0
108)
(0.0
057)
(0.0
266)
(0.0
052)
(0.0
201)
(0.0
037)
(0.0
008)
Fam
ily
Pla
nn
ing
Pro
gram
me
35–3
9�
0.00
040.
0041
0.00
590.
0168
�0.
0044
0.02
980.
0081
�0.
0013
(0.0
018)
(0.0
066)
(0.0
065)
(0.0
346)
(0.0
071)
(0.0
232)
(0.0
053)
(0.0
009)
Fam
ily
Pla
nn
ing
Pro
gram
me
40–4
40.
0014
0.00
190.
0029
�0.
0363
0.00
550.
0152
0.00
80�
0.00
21(0
.002
2)(0
.008
5)(0
.007
1)(0
.031
4)(0
.009
1)(0
.041
4)(0
.024
2)(0
.001
4)F
amil
yP
lan
nin
gP
rogr
amm
e45
–49
�0.
0008
0.00
350.
0016
�0.
0146
0.00
31�
0.01
33�
0.01
490.
0020
(0.0
020)
(0.0
085)
(0.0
082)
(0.0
223)
(0.0
061)
(0.0
235)
(0.0
105)
(0.0
015)
N60
1,26
355
4,63
955
4,63
955
4,63
954
6,25
412
3,91
355
1,64
054
0,94
5R
2/
Pse
ud
oR
20.
340.
24—
—-
0.27
0.14
0.03
0.07
0.06
Not
es.
All
esti
mat
esp
rod
uce
du
sin
gth
esa
mp
leo
fw
om
enb
orn
inP
rofa
mil
iap
rogr
amm
eco
un
ties
bet
wee
n19
11an
d19
55ra
nd
om
lyd
raw
nfr
om
the
1993
cen
sus
wh
ore
po
rtn
ever
hav
ing
ach
ild
and
livi
ng
inth
eir
cou
nty
of
bir
th.T
he
resu
lts
sho
wn
for
An
yB
irth
,Wor
kin
Form
alSe
ctor
,�W
hite
-Col
lar�
Job,
and
Coh
abit
ate
are
mar
gin
alp
rob
abil
itie
so
bta
ined
fro
mp
rob
itm
od
els
calc
ula
ted
atth
em
ean
of
the
ind
epen
den
tva
riab
les.
Stan
dar
der
rors
clu
ster
edat
the
cou
nty
leve
lsh
ow
nin
par
enth
eses
.A
llsp
ecifi
cati
on
sin
clu
de
bir
thco
un
tyan
db
irth
year
fixe
def
fect
san
dco
un
ty-s
pec
ific
lin
ear
bir
thye
artr
end
s.*
p<
0.1,
**p<
0.05
,**
*p<
0.01
.y
Sign
ifica
nt
(a¼
0.05
)af
ter
am
uti
ple
com
par
iso
nco
rrec
tio
n(t
he
Bo
nfe
rro
ni
mu
ltip
leco
mp
aris
on
corr
ecti
on
for
seve
nte
sts
of
sign
ifica
nce
req
uir
esa
sign
ifica
nce
thre
sho
ldo
fa¼
0.00
71fo
rea
chte
stto
reco
ver
ano
vera
llsi
gnifi
can
cele
vel
ofa¼
0.05
).
734 [ J U N ET H E E C O N O M I C J O U R N A L
� The Author(s). Journal compilation � Royal Economic Society 2009

References
Angrist, J., Bettinger, E., Bloom, E., King, E. and Kremer, M. (2002). �Vouchers for private schooling inColombia: evidence from a randomized natural experiment�, American Economic Review, vol. 92, pp. 1535–58.
Angrist, J. and Evans, W. (1998). �Children and their parents� labor supply:evidence from exogenous variationin family size�, American Economic Review, vol. 88, pp. 450–77.
Ashraf, N., Field, E. and Lee, J. (2007). �Gender, intrahousehold decisionmaking, and the demand forchildren�, Working Paper, Harvard University.
Bailey, M.J. (2006). �More power to the pill: the impact of contraceptive freedom on women’s lifecycle laborsupply�, Quarterly Journal of Economics, vol. 121(1), pp. 289–320.
Becker, G.S. (1981). A Treatise on the Family, Cambridge, MA: Harvard University Press.Bloom, H. (1984). �Accounting for no-shows in experimental evaluation designs�, Evaluation Review, vol. 8, pp.
225–46.Bongaarts, J. (1987). �Does family planning reduce infant mortality rates?�, Population and Development Review,
vol. 13(2), pp. 323–34.Bongaarts, J. (1994). The impact of population policies: comment, Population and Development Review, vol. 20,
pp. 616–20.Buntin, M.B. and Zaslavsky, A.M. (2004). �Too much ado about two-part models and transformation? Com-
paring methods of modeling medicare expenditures�, Journal of Health Economics, vol. 23, pp. 525–42.Cameron, A.C. and Trivedi,P.K. (1998).RegressionAnalysis of CountData, Cambridge:CambridgeUniversity Press.Case, A. and Deaton, A. (1998). �Large cash transfers to the elderly in South Africa�, Economic Journal, vol.
108, pp. 1330–61.Case, A. and Deaton, A. (1999). �School inputs and educational outcomes in South Africa�, Quarterly Journal of
Economics, vol. 114(3), pp. 1047–84.Duflo, E. (2001). �Schooling and labor market consequences of school construction in Indonesia: evidence
from an unusual policy experiment�, American Economic Review, vol. 91(4), pp. 795–813.Duflo, E. (2003). �Grandmothers and granddaughters:old age pension and intra-household allocation in
South Africa�, World Bank Economic Review, vol. 17(1), pp. 1–25.Easterly, W. (2001). The Elusive Quest for Growth: Economists’ Adventures and Misadventures in the Tropics,
Cambridge, MA: MIT Press.Ehrlich, P. (1968). The Population Bomb, New York: Ballantine Books.Ehrlich, P. and Ehrlich, A. (1990). The Population Explosion, New York: Simon and Schuster.Ehrlich, P. and Holdren, J. (1971). �Impact of population growth�, Science, vol. 171, pp. 1212–7.Florez, C.E. and Nu~nez, J. (2002). �Teenage childbearing in Latin American countries�, Universidad de Los
Andes Centro de Estudios Sobre Desarrollo Economico Working Paper No. 2002–01.Foster, A.D. and Roy, N. (1997). �The dynamics of education and fertility: evidence from a family planning
experiment�, mimeo, Brown University.Gertler, P.J. and Molyneaux, J.W. (1994). �How economic development and family planning programs con-
tributed to reduce Indonesian fertility�, Demography, vol. 31(1), pp. 33–63.Gertler, P.J., Shah, M. and Bertozzi, S. (2005). �Risky business:the market for unprotected commercial sex�,
Journal of Political Economy, vol. 113(3), pp. 518–50.Goldin, C. and Katz, L. (2002). �The power of the pill: oral contraceptives and women’s career and marriage
decisions�, Journal of Political Economy, vol. 110(4), pp. 730–70.Guzman, J.M. Singh, S., Rodriquez, G. and Pantelides E.A. (1996). The Fertility Transition in Latin America. New
York: Oxford University Press.Heckman, J., LaLonde, R. and Smith, J. (1999). �The economics and econometrics of active labor market
policies�, in (O. Ashenfelter and D. Card, eds.), Handbook of Labor Economics vol. 3A, pp. 1865–2097.Amsterdam: North-Holland.
Joshi, S. and Schultz, T.P. (2007). �Family planning as an investment in female human capital: evaluatingthe long term consequences in Matlab, Bangladesh�, Yale Economic Growth Center WorkingPaper No. 951.
Katz, L., Kling, J. and Liebman, J. (2001). �Moving to opportunity in Boston: early results of a randomizedmobility experiment�. Quarterly Journal of Economics, vol. 116, pp. 607–54.
Koenig, M.A., Phillips, J., Simmons, R. and Khan, M.A. (1992). �Contraceptive use in Matlab, Bangladesh in1990: levels, trends, and explanations�, Studies in Family Planning, vol. 23(6), pp. 352–64.
Lundberg, S., Pollak, R. and Wales, T. (1997). �Do husbands and wives pool their resources? Evidence fromthe U.K. child benefit�, Journal of Human Resources, vol. 32, pp. 463–80.
Manning, W.G. (1998). �The logged dependent variable, heteroscedasticity, and the retransformation prob-lem�, Journal of Health Economics, vol. 17, pp. 283–95.
Miller, A.R. (2005). �The effects of motherhood timing on career path�, mimeo, University of Virginia.Miller, G. (2008). �Women’s suffrage, political responsiveness, and child survival in American history�,
Quarterly Journal of Economics, vol. 123(3), pp. 1287–327.
2010] 735C O N T R A C E P T I O N A S D E V E L O P M E N T ?
� The Author(s). Journal compilation � Royal Economic Society 2009

Mundigo, A.I. (1996). �The role of family planning programmes in the fertility transition of Latin America�, in(J.M. Guzman, S. Singh, G. Rodriguez, and E.A. Pantelides, eds.), The Fertility Transition in Latin America,pp. 192–212, New York: Oxford University Press.
Parrado, E.A. (2000). �Social change, population policies, and fertility decline in Colombia and Venezuela�,Population Research and Policy Review, vol. 19, pp. 421–57.
Phillips, J.F., Simmons, R., Chakraborty, J. and Chowdhury, A. (1984). �Integrating health services into anMCH-FP Program: lessons from Matlab, Bangladesh�. Studies in Family Planning, vol. 15(4), pp. 153–61.
Phillips, J.F., Simmons, R., Koenig, M.A. and Chakraborty, J. (1988). �Determinants of reproductive changein a traditional society: evidence from Matlab, Bangladesh�. Studies in Family Planning, vol. 19(6), pp. 313–34.
Pitt, M. and Khandker, S. (1998). �The impact of group-based credit programs on poor households inBangladesh:does the gender of participants matter?�, Journal of Political Economy, vol. 106, pp. 958–95.
Pitt, M.M., Rosenzweig, M.R. and Gibbons, D. (1993). �The determinants and consequences of placement ofgovernment programs in Indonesia�, World Bank Economic Review, vol. 7, pp. 319–48.
Pollak, R. (2005). �Bargaining power in marriage: earning, wage rates and household production�, NationalBureau of Economic Research Working Paper No. 11239.
Pritchett, L.H. (1994). �Desired fertility and the impact of population policies�, Population and DevelopmentReview, vol. 20(1), pp. 1–55.
Rangel, M. (2006). �Alimony rights and intra-household allocation of resources: evidence from Brazil�,Economic Journal, vol. 116, pp. 627–58.
Ribar, D.C. (1999). �The socioeconomic consequences of young women’s childbearing: Reconciling disparateevidence�, Journal of Population Economics, vol. 12, pp. 547–65.
Rosenzweig, M.R. and Wolpin, K.I. (1986). �Evaluating the effects of optimally distributed public programs:child health and family planning interventions�, American Economic Review, vol. 76(3), pp. 470–82.
Schultz, T.P. (1994). �Human capital, family planning, and their effects on population growth�, AmericanEconomic Review Papers and Proceedings, vol. 84(2), pp. 255–60.
Schultz, T.P. (2005). �Effects of fertility decline on family well-being: opportunities for evaluating populationprograms�, mimeo, Yale University.
Seltzer, J. and Gomez, F. (1998). �Family planning and population programs in Colombia 1965–1997�,Population Technical Assistance Project (POPTECH) Report No. 97-114-062.
Sinha, N. (2003). �Fertility, child work and schooling consequences of family planning programs: evidencefrom an experiment in rural Bangladesh�, Yale University Economic Growth Center Discussion Paper No.867.
Singh, R. (1994). Family Planning Success Stories (Asia, Latin America, Africa), Delhi: UBS Publishers� DistributorsLtd.
Thomas, D. (1990). �Intra-household resource allocation: an inferential approach�, Journal of Human Resources,vol. (25), pp. 635–64.
Thomas, D. (1994). �Like father, like son; like mother, like daughter: parental resources and child height�,Journal of Human Resources, vol. 29(4), pp. 950–88.
United Nations Population Fund (UNFPA). (2004). The State of World Population 2004: The Cairo Consensusat Ten – Population, Reproductive Health, and the Global Effort to End Poverty, New York: United NationsPopulation Fund.
United Nations Program on HIV/AIDS. (2004). 2004 Report on the Global AIDS Epidemic, Geneva: UnitedNations Program on HIV/AIDS.
Wolpin, K.I. (1997). �Determinants and consequences of the mortality and health of infants and children�,in (M. Rosenzweig and O. Stark, eds.), Handbook of Population and Family Economics Vol. 1A, pp. 483–557,Amsterdam: North-Holland.
736 [ J U N E 2010]T H E E C O N O M I C J O U R N A L
� The Author(s). Journal compilation � Royal Economic Society 2009