Embed Size (px)
Citation preview

1
Continuous Risk Management
2
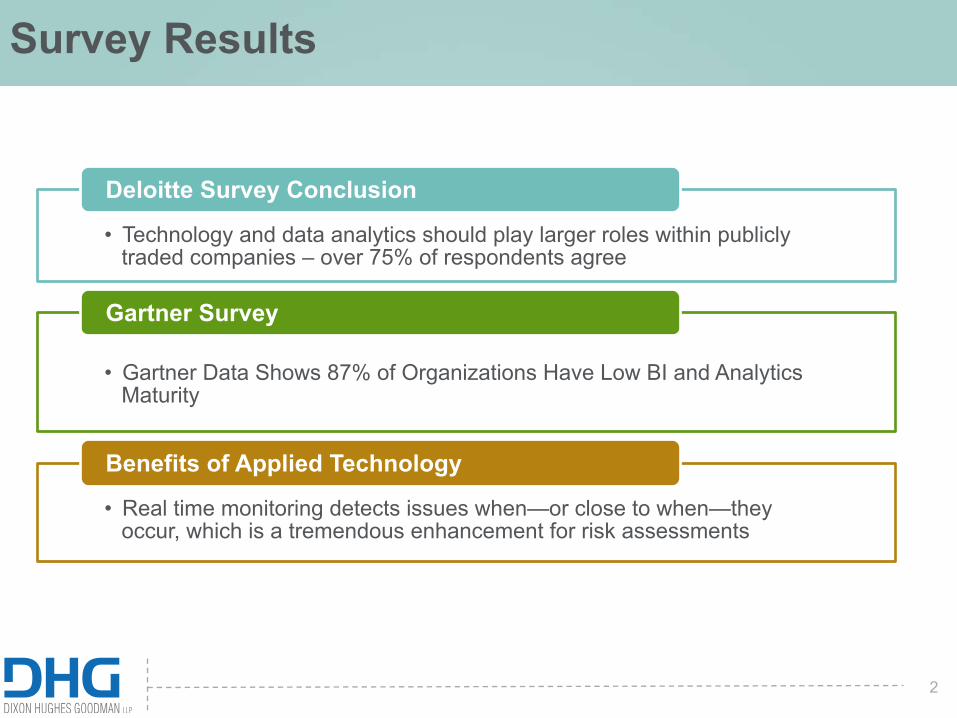
Survey Results
• Technology and data analytics should play larger roles within publicly traded companies – over 75% of respondents agree
Deloitte Survey Conclusion
Gartner Survey
• Real time monitoring detects issues when—or close to when—they occur, which is a tremendous enhancement for risk assessments
Benefits of Applied Technology
• Gartner Data Shows 87% of Organizations Have Low BI and Analytics Maturity

3
Continuous Monitoring
Continuous Assessment
1
2 43
5
Trigger Risk
Mitigation Actions
51Identify Risks
Evaluate Risk
Profile
32
Measure Key Risks
4
Report Risk
Changes
Continuous Risk Management
Identify Controls & Metrics to Monitor
Determine the Rules & Frequency
Follow-up on Alerts
Report & Manage Results
Acquire Data &
Configure Systems
Control Data
Transaction Reports
Control Measures
Testing Results
Functional Fluctuations
Risk Data
Risk Indicators
Market Indicators
Threshold Measures
Predictive Elements & Algorithms
Inputs: Data, Metrics, Internal Information, Social, News
Impacts: Risk Register, Audit Issues, Risk Remediation
Future State - Continuous Risk Management Continuous Risk Management

4
Maturity Level Definitions
CMMI Levels Definition Alternative Scale
Initial/Ad Hoc (Level 1)
The enterprise has recognized that capabilities need to be established. There are ad-hoc approaches that tend to be applied on an individual or case-by-case basis. The overall approach to management is ad-hoc.
Initial/Ad Hoc (Level 1)
Managed (Level 2)
Managed on the project level. Similar procedures are followed by different people undertaking the same task. Responsibility is left to the individual. There is a high degree of reliance on the knowledge of individuals and, therefore, errors are likely.
Managed Analytics (Level 2)
Defined Process (Level 3)
Proactive, rather than reactive. Procedures have been standardized, documented, and communicated through training. It is mandated that these procedures should be followed; however, it is unlikely that deviations will be detected. Automation is used in a limited capacity.
Continuous Assessment
(Level 3)
Quantitatively Measured (Level 4)
Measured and controlled. Organization is data-driven with quantitative performance improvement objectives that are predictable and align to meet the needs of internal and external stakeholders. Automation is used to enable the capability.
Continuous Monitoring (Level 4)
Optimized (Level 5)
Stable and flexible. Organization is focused on continuous improvement and it is built to pivot and respond to opportunity and change. The organization’s stability provides a platform for agility and innovation.
Predictive & Visual
(Level 5)

5
Three Lines of Defense
CONTINUOUS MONITORING TESTING OF CONTINUOUS MONITORING
Operation Management
Owns & Manages Risk
Functions Oversee Risk
Example: Compliance
Internal Audit Provides Independent Assurance
CONTINUOUS RISK MANAGEMENT THROUGH TECHNOLOGY-ENABLED ONGOING RISK ASSESSMENT
CONTINUOUS TRANSITION
1st 2nd 3rd

6
Global Risk Management View
Continuous Risk
Management Strategy
Automate Data Collection
Automate Baseline Tests
Generate Red Flag Reports
Automation Maintenance
Control Owner Communication
Agile Reporting
Automate Data Collection • Data pushed & pulled from
source systems • Central data request /
repository for manual artifacts
Automate Baseline Tests • Check-the-box testing • Application change controls
Generate Red Flat Reports • Auto-analyze patterns &
trends • Identify outliers, exceptions &
anomalies
Agile Reporting • Reduce cost & time • Focus on stakeholder needs • Accelerate risk cycles • Priority of high risk items • Provides insights
Control Owner Communication • Conditions of key controls • Changes to automated
controls
Automation Maintenance • Aligning to each stage of
SDLC: Planning, Defining, Designing, Building, Testing, Deployment

7
Agile Core Transformation
Managing Risk
Monitor & Support
Testing by Entity
Current State
RISK MANAGEMENT PROCESS
Risk Area/Category Agile Team
1st – Managing Risk 2nd – Monitor & Support 3rd – Testing
Siloed Responsibilities
Multiple Teams
Process Oriented
Cycle Based
Unified Responsibilities
Rotating Scrums
Results Oriented
Weekly Sprints
Future State

8
Implementation Strategy- Overview
Automation Tools • Capitalize on existing tools to reduce the cost for automating
Change Management • Deploy training and communications to promote new processes
Governance • Establish policies and procedures to support new processes
Strategy & Planning • Develop a transition strategy tailored to the organization
9
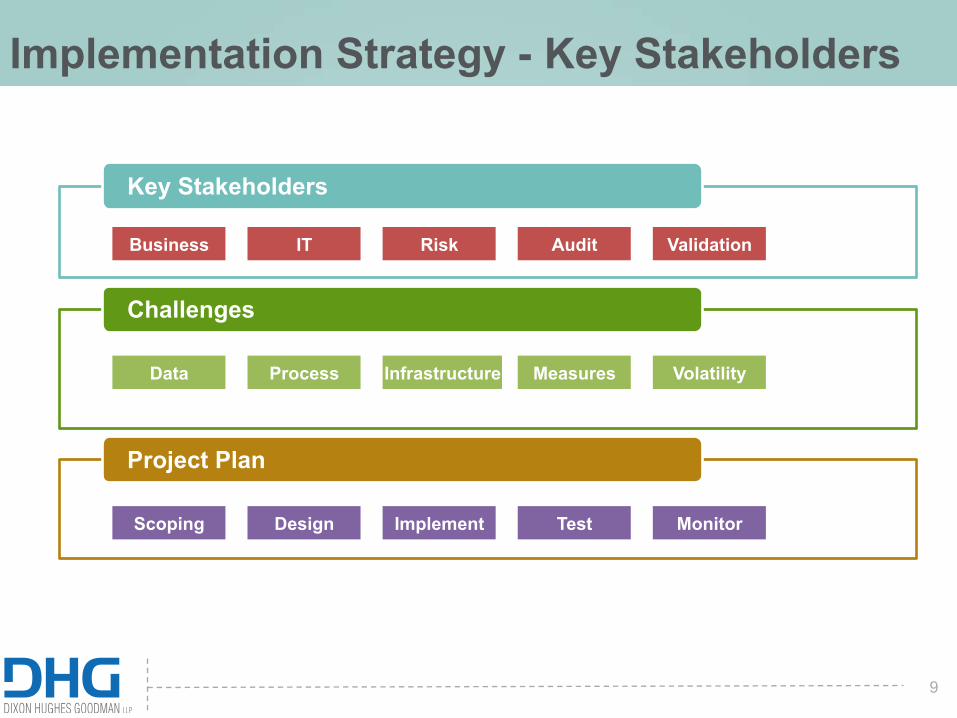
Implementation Strategy - Key Stakeholders
Key Stakeholders
Challenges
Project Plan
Business IT Risk Audit Validation
Data Process Infrastructure Measures Volatility
Scoping Design Implement Test Monitor

10
Implementation Strategy- Data
Data Quality and Integrity • Proper upkeep of data dictionary and
inventory • Accuracy, completeness & timeliness
Data Reconciliation • Proper controls, authoritative
ledgers, and standards are being followed
• Audit for manual processes and reconciliations
Controls Around Data Systems and Processes • SOX compliance • Attestation • Access controls • Functional requirement documents
Segregation of Duties • First line consists of risk-taking units
that create and transform data • Second line consists of independent
groups that are responsible for risk oversight
• Third line provides independent risk assessment, evaluation and assurance
CRM
11
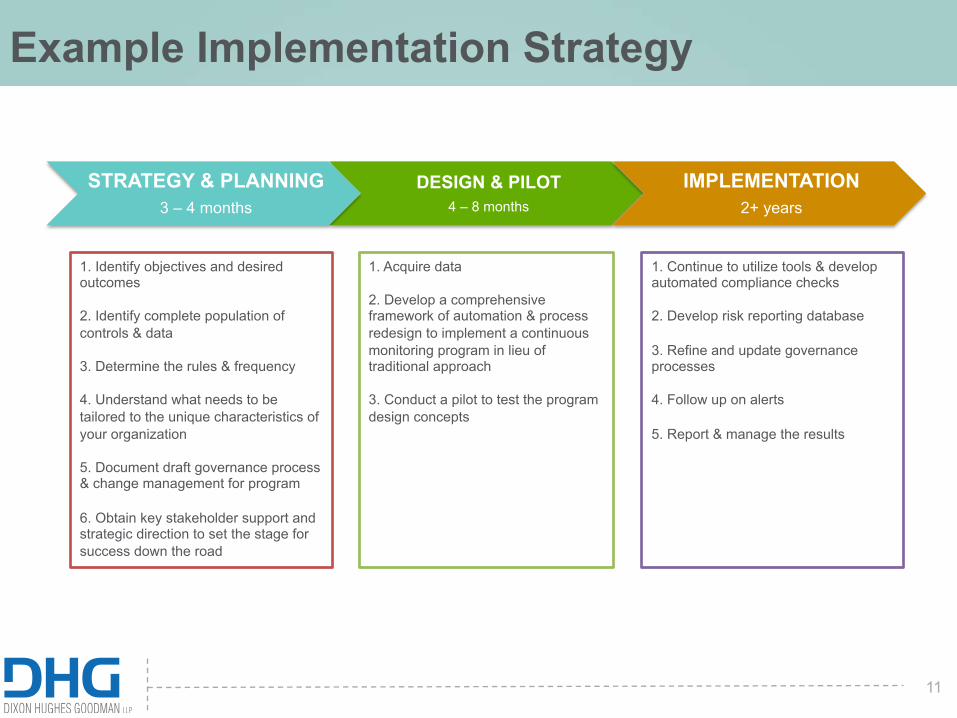
Example Implementation Strategy
DESIGN & PILOT 4 – 8 months
1. Acquire data
2. Develop a comprehensive framework of automation & process redesign to implement a continuous monitoring program in lieu of traditional approach 3. Conduct a pilot to test the program design concepts
IMPLEMENTATION 2+ years
1. Continue to utilize tools & develop automated compliance checks
2. Develop risk reporting database 3. Refine and update governance processes 4. Follow up on alerts 5. Report & manage the results
STRATEGY & PLANNING 3 – 4 months
1. Identify objectives and desired outcomes 2. Identify complete population of controls & data
3. Determine the rules & frequency 4. Understand what needs to be tailored to the unique characteristics of your organization 5. Document draft governance process & change management for program 6. Obtain key stakeholder support and strategic direction to set the stage for success down the road
12
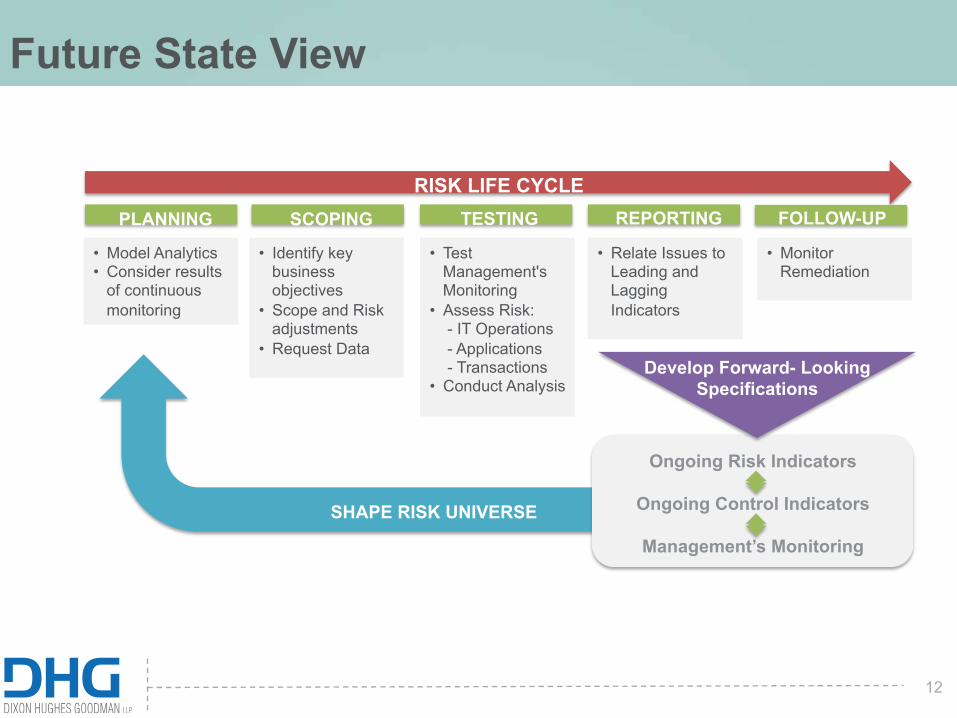
Future State View
RISK LIFE CYCLE PLANNING SCOPING TESTING REPORTING FOLLOW-UP
• Model Analytics • Consider results
of continuous monitoring
• Test Management's Monitoring
• Assess Risk: - IT Operations - Applications - Transactions • Conduct Analysis
• Identify key business objectives
• Scope and Risk adjustments
• Request Data
• Relate Issues to Leading and Lagging Indicators
• Monitor Remediation
Ongoing Risk Indicators
Ongoing Control Indicators
Management’s Monitoring
SHAPE RISK UNIVERSE
Develop Forward- Looking Specifications

13
Future State - Baseline Testing
Data is automatically
extracted
Data is compared with a
base period
Benchmark report identifies
changes in current state
Benchmark report identifies type of changes
since base period
Select key controls and drill down to assess
change
Step 1: Define key objects Step 2: Identify how to automate data collection Step 3: Decide how to automate baseline tests

14
Challenges to Implementation
Buy-in from leadership
Access to data / system access
Scope of work: Determining where to start and place priority
Programming skills available on team
Errors in programming, false positives, false negatives
Obtaining the budget / funding for implementation costs
15
Analytics

16
Predictive Analytics
Scoping Forecasting Process
Verification of data availability, high-level model and dashboard
design
Data Analysis
Prototyping a data ingestion, transformation,
analytical model and dashboards to illustrate future state functionality and forecast robustness
Output
Industrialized production-ready model and
dashboards for long term cyclic usage and iterative
development

17
Analytics Process
• Data input from multiple sources
• Parameters are used to understand and analyze large data sets
ACL / IDEA
• Holistic view of data in single interactive analysis
• Data visualization through dashboards
Tableau / Spotfire • Ability to explore all data in
large-scope risks
• Identify outliers and patterns
• Increase efficiencies
Continuous Risk Management
18
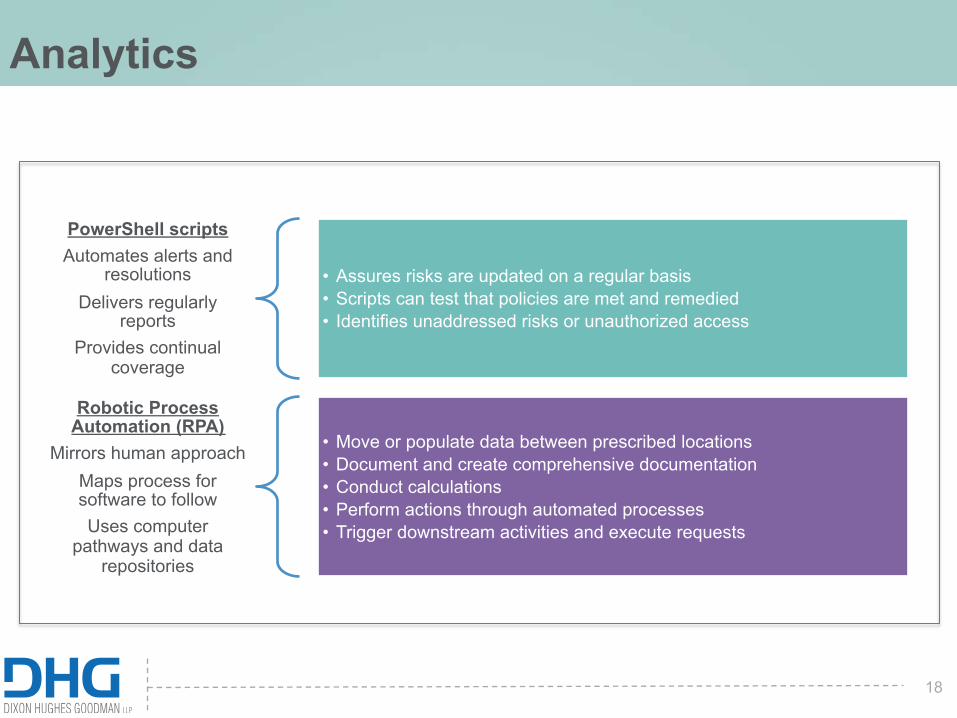
Analytics
PowerShell scripts Automates alerts and
resolutions Delivers regularly
reports Provides continual
coverage
• Assures risks are updated on a regular basis • Scripts can test that policies are met and remedied • Identifies unaddressed risks or unauthorized access
Robotic Process Automation (RPA)
Mirrors human approach Maps process for software to follow Uses computer
pathways and data repositories
• Move or populate data between prescribed locations • Document and create comprehensive documentation • Conduct calculations • Perform actions through automated processes • Trigger downstream activities and execute requests

19
Leading Practices in Analysis
Standardization Consistency Agile Core
Trustworthiness Specialists Predictive Modeling
Automation Innovation
20
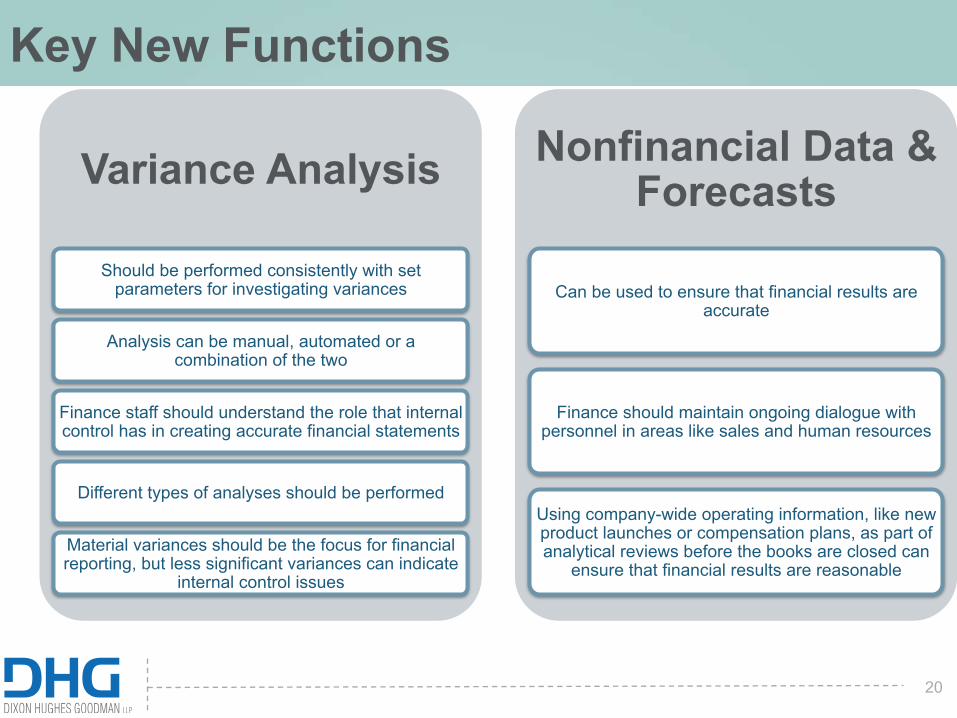
Key New Functions
Variance Analysis
Should be performed consistently with set parameters for investigating variances
Analysis can be manual, automated or a combination of the two
Finance staff should understand the role that internal control has in creating accurate financial statements
Different types of analyses should be performed
Material variances should be the focus for financial reporting, but less significant variances can indicate
internal control issues
Nonfinancial Data & Forecasts
Can be used to ensure that financial results are accurate
Finance should maintain ongoing dialogue with personnel in areas like sales and human resources
Using company-wide operating information, like new product launches or compensation plans, as part of analytical reviews before the books are closed can
ensure that financial results are reasonable

21
Key New Functions Continued
• Provides important strategic and competitive data • Can indicate inaccurate or fraudulent financial reporting • The SEC compares financial results by SIC code in reviews • Auditors compare a company's financial results to those of
peers and the overall industry to identify focus areas and risks • Financial executives should use peer metrics in the same way
that regulators and auditors do
Peer Group Metrics and
Benchmarking
• Uses systems to examine all of an organization's transactions and data to assess control effectiveness and identify risks on an ongoing basis
• If finance detects control design or implementation issues earlier, they can correct them earlier, thereby reducing cost of errors, omissions and other deficiencies
• It is important to design a process for using data to address control issues and follow up on results
Continuous Monitoring

22
Risk Management – Analytics Implementations
• Considerations:
• Identify opportunities for quick wins
• Evaluate risk assessments – shift more time to risk remediation, data cleansing, and data analysis, away from manual identification
• Evaluate tools to use (e.g. SQL, Alteryx, RapidMiner, Tableau, PowerBI, SAS)
• Evaluate team member skills (e.g. Business Analysts, PMs, Data Analysts, Programmers, Dashboard Designers, Predictive Analysts)
• Evaluate budgetary needs

23
Risk Management – Challenges to Automation
Data quality
Systems changes
Organizational resistance
Maintaining independence

24
Example Implementation Strategy – Risk Mgt Analytics
DESIGN & PILOT 2 – 4 months
1. Conduct 1-2 pilots to test the program design concepts 2. Update risk management methodology based on lessons learned 3. Continue to evaluate tools used and/or needed
IMPLEMENTATION 1+ years
1. Continue to rollout implementation 2.Provide training 3. Expand team member skills, by adding team members and providing training
STRATEGY & PLANNING 2 – 3 months
1. Identify objectives and desired outcomes
2. Evaluate methodology, tools, team member skills 3. Understand what needs to be tailored to the unique characteristics of your organization 4. Document draft methodology updates, business case, and project plan
25
Challenges to Automation
Data quality
Systems changes
Organizational resistance
Maintaining independence

26
Questions and Contacts
Prashant Panavalli, Managing Director, Risk Advisory DHG [email protected] 201-957-2550
27
THANK YOU