Embed Size (px)
Citation preview

Journal of Music Algorithms, Vol. 1, No. 1, March 2013
© 2013 Journal of Music Algorithms 1
Abstract— We describe a real-time method for continuously
determining the key of live music and detecting chords using a minimum description length (MDL) criterion. MDL is based on the idea that the model that provides the simplest explanation of the data is the “best” model. Pitch detection is performed in the time domain using a bank of gamma-tone filters tuned to the musical range of interest. Outputs across octave are collapsed into a chromagram that is matched against interval and scale models to detect chords and determine musical key. We analyze several Bach inventions, a Beethoven piano sonata, and a portion of a jazz piece. Keywords— Pitch detection, gamma-tone filter, musical key,
chord detection, minimum description length.
I. INTRODUCTION number of techniques have been developed for automatically determining musical key from MIDI and
audio data [1]. Methods that operate on audio data must first detect musical pitch. Both time- and frequency-domain pitch detection techniques are described in the literature [2]. Recognizing that pitch detection is itself an unsolved problem we have developed a statistical approach to the problem of determining musical key that is somewhat insensitive to pitch detection errors. A real-time algorithm is described that continuously determines musical key, and chords from live audio. A bank of gamma-tone filters detects musical pitch on a continuous basis over a three-octave range (Section II). The filter outputs are collapsed into a 12-element chromagram that is matched against a set of chord models. The best matching chord at each instant of time is determined by picking the chord with the minimum description length (Section III). Our MDL approach is an information-theoretic formulation of the problem of picking the best chord to describe a set of harmonic intervals. A similar approach matches scale models against detected notes over an interval of time to determine the best key (Section IV). Section V presents results for several Bach inventions and a portion of a Beethoven piano sonata. A short section of a jazz piece is analyzed to illustrate the effect of selecting different scale models for key analysis.
II. GAMMA-TONE FILTER BANK A bank of gamma-tone filters is used for pitch detection. The gamma-tone filter has been proposed as a model of the human auditory system [3]. The impulse response is the product of a gamma distribution and sine wave
The author may be reached via e-mail at mark@ carlotto.us
g(t)∝ t n−1 exp(−2πbt)cos(2π f0t +φ) (1) where n is the order of the filter. Gamma-tone filters can be implemented as discrete-time recursive filters [4] wk[m]= wk−1[m]+ 1− e
−2πbmΔt( ) zk−1[m]−wk−1[m]( ) (2)
where Δt is the sample interval and 4 < fm / bm < 8 . The complex term zk[m]= xk e
− j2π fmkΔt (3) is the sampled real-valued input signal xk multiplied by in-phase and quadrature filters:
zk[m]=xk cos(2π fmkΔt)
xk sin(2π fmkΔt)
"#$
%$
&'$
($ (4)
where fm is the center frequency of the m-th filter. We use M=37 first-order filters from C3 to C7 operating at a sample rate of 22,050 Hz. Fig. 1 shows the output from the pitch detector. The pitch with the largest magnitude is displayed above the color-coded spectrum. The complex nature of musical instruments (in this example, a pipe organ) causes the partials to rise and fall, often exceeding the magnitude of the fundamental.
Fig. 1 Output from gamma-tone pitch detector in Pitch to Note
Mark J. Carlotto
CONTINUOUS REAL-TIME DETERMINATION OF KEY AND CHORDS IN LIVE MUSIC USING MINIMUM DESCRIPTION LENGTH
A
Journal of Music Algorithms, Vol. 1, No. 1, March 2013
© 2013 Journal of Music Algorithms 2
The individual pitch detector outputs are summed over the three octaves to produce a set of accumulated magnitude values (chromagram) ck[ p]= wk[m]
p=m%12∑ (5)
corresponding to the notes (using enharmonic spellings): {C,C#,D,Eb,E,F,F#,G,Ab,A,Bb,B} (6) We use % to denote the modulus operator. These values are stored in an accumulator array that is attached to a “leaky integrator”, which provides short-term averaging of the chromagram ai = βai−1 + (1−β )ci (7) The values are renormalized to sum to one at each iteration. This loop is updated at a slower rate. Using an audio queue length of 256 samples, the ai are updated every 256/22050 = 11.6 ms.
III. CHORD DETECTION BY MINIMUM DESCRIPTION LENGTH Equation (7) is a dynamic estimate of the harmonic content
of the audio signal. Let us define a set of chord models:
1. Single note (no chord): {0} 2. 5th (no 3rd): {0,7} 3. Major: {0,4,7} 4. Minor: {0,3,7} 5. Diminished: {0,3,6} 6. Augmented: {0,4,8} 7. Dominant 7th: {0,4,7,10} 8. Minor 7th: {0,3,7,10} 9. Major 7th: {0,4,7,11} 10. Sustained 4th: {0,5,7} 11. Diminished 7th: {0,3,6,9} 12. Minor 7th with flat 5th: {0,3,6,10} 13. Minor with #7th: {0,3,7,11}
where the numbers correspond to the semitone indices relative to a root note. If a C major 7th chord is played, under perfect conditions, the chromagram would be: {0.25,0,0,0,0.25,0,0,0.25,0,0,0,0.25} Simple chord matching adds up the corresponding values from the filter bank. The C major 7th chord model adds values {0,4,7,11} to give a score of 1. The score of all other models is less than 1. But what happens when a C major chord is played? The score of chord models C major, C7, and CM7 are all the same. To determine the best chord we use the principle that the simplest explanation is the best one. Known as "minimum description length" [5] we compute the amount of information needed to represent the chord model plus the information
needed to represent the error in using that chord to describe the harmonic content of the music (chromagram). In the above example the error is zero, so what is the simplest explanation? The information needed to represent a chord is proportional to log(N), where N is the number of notes in the chord. So C major is the simplest explanation because it requires only 3 notes, while C7 and CM7 require 4, i.e., log(3) < log(4). In general scores are not equal to one; e.g., if the chromagram is say {0.25,0,0,0,0.25,0,0,0.2,0.1,0.1,0,0.2} the score for a CM7 would be reduced to 0.8. The total information is thus proportional to J = log(N)+log(ε) (8) where the error ε =1−0.8 = 0.2 . Chord detection compares the time-averaged chromagram to all chords in all keys by matching the corresponding chord models and picking the chord with the minimum description length. Expressing chord models as p-vectors du = du[ p] (9) let du,q be the elements of the u-th chord model “circularly” shifted q elements to the right; i.e., du,q = du ( p+ q)%12!" #$ (10)
This is a simple way of expressing any chord in any key; e.g., for a dominant 7th chord in the keys of C and C# we have d7,0 = 1,0,0,0,1,0,0,1,0,0,1,0!" #$
d7,1 = 0,1,0,0,0,1,0,0,1,0,0,1!" #$
The chord detection rule is argmin
u,qlogN (u)+ loge(u,q){ } (11)
where e(u,q) =1−aTdu,q (12)
is the error in picking the u-th chord in the q-th key. In practice a small number is added to the error in (8) to prevent log(0) from occurring. The chord detection display (Fig. 2) shows the detected chord and the corresponding notes in the chromagram. The slider controls the averaging (7). A settings control allows the user to pick chords that are appropriate for the type of music being analyzed, which increases accuracy.

Journal of Music Algorithms, Vol. 1, No. 1, March 2013
© 2013 Journal of Music Algorithms 3
Fig. 2 Chord detection display in MYSUS
IV. DETERMINING MUSICAL KEY Musical key is determined using a similar idea. Let us define a set of scale models:
1. Major: {0,2,4,5,7,9,11} 2. Melodic minor (ascending): {0,2,3,5,7,9,11} 3. Melodic minor (descending): {0,2,3,5,7,8,10} 4. Major pentatonic: {0,2,4,7,9} 5. Minor pentatonic: {0,3,4,7,10} 6. Blues: {0,3,5,6,7,10} 7. Bebop dominant: {0,2,4,5,7,9,10,11} 8. Bebop major: {0,2,4,5,7,8,9,11} 9. Double harmonic: {0,1,4,5,7,8,11} 10. Whole tone: {0,2,4,6,8,10} 11. Major Locrian: {0,2,4,5,6,8,10} 12. Diminished: {0,2,3,5,6,8,9,11}
Again the numbers correspond to the semitones relative to a root note; e.g., the notes of a D major pentatonic scale {D,E,F#, A,B} are represented as {2,4,6,9,11}.
Fig. 3 Current detected note displayed with a time history of previous notes Instead of using the chromagram, we pick the note p*= argmax a[ p]{ } (13)
with the largest value and write it into a circular buffer, which stores a time history of recent notes (Fig. 3). A histogram of note occurrences h is recomputed each time the circular buffer is updated and is normalized to sum to one. The key is determined by comparing the short-term histogram to all scales in all keys by matching the corresponding scale models and picking the scale with the
minimum description length. Expressing scale models as p-vectors sv = sv[ p] (14) let sv ,q be the elements of the v-th scale model “circularly” shifted q elements to the right; i.e., sv ,q = sv ( p+ q)%12!" #$ (15)
As with chords, this is a simple way of expressing any scale in any key. For example, the major pentatonic scale in the keys of C and C# are s4,0 = 1,0,1,0,1,0,0,1,0,1,0,0!" #$
s4,1 = 0,1,0,1,0,1,0,0,1,0,1,0!" #$
The error in using the v-th scale in the q-th key to describe the data is e(v,q) =1−hTdv ,q (16)
Instead of picking the key and scale at this point, the information is averaged over time and scale, Ji (q) =αJi−1(q)+ (1−α) −log 1−hi
Tdv ,q( )v∑ − logNv (17)
where Nv is the number of notes in the v-th scale, and presented to the user in the form of a time-varying bar graph (Fig. 4) that shows the score for each key. The best key is given by argmax
qlog Ji (q){ } (18)
The slider controls the amount of smoothing (17). Low values allow for quick changes in key; high values increase accuracy in transitions from one key to another. Setting controls allow the user to select the scales they wish to use; e.g., major and minor scales for Western classical music, pentatonic scales for rock, etc.
Fig. 4 What Key display shows detected key with bar graph over all keys
Journal of Music Algorithms, Vol. 1, No. 1, March 2013
© 2013 Journal of Music Algorithms 4
V. PRELIMINARY RESULTS
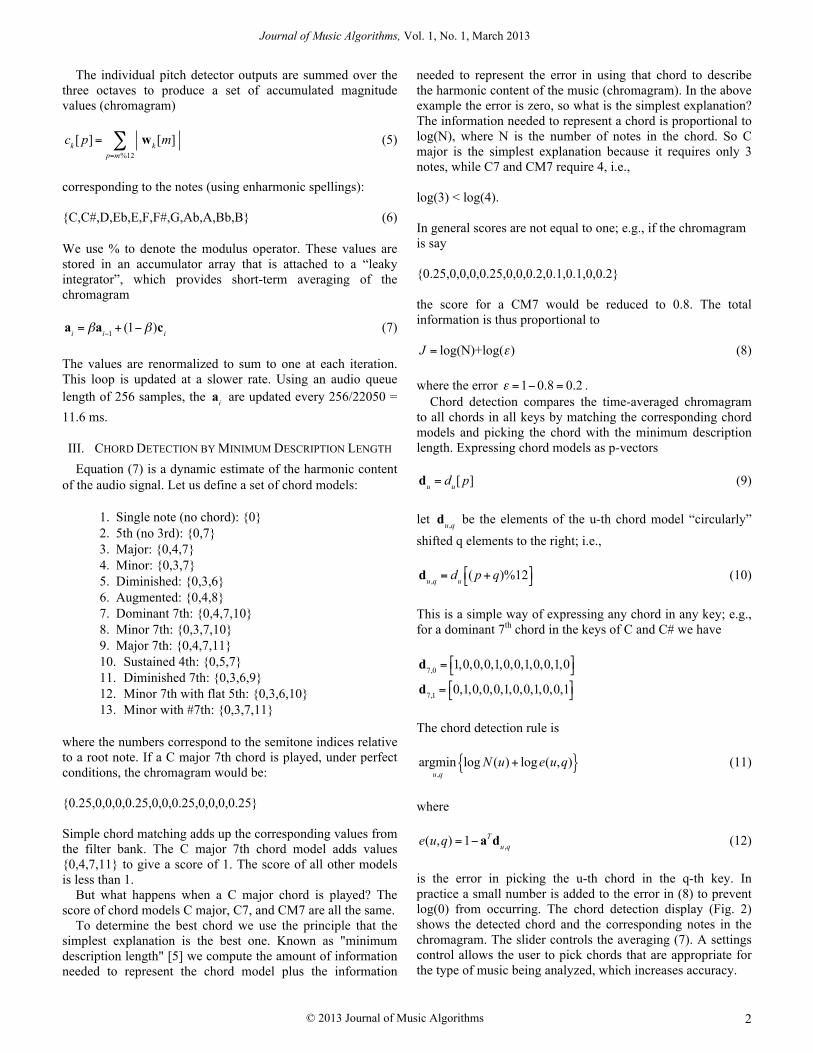
A. Determination of Musical Key Several Bach inventions were used to assess the performance of the key determination algorithm. We start with the Invention in D minor (BWV 775). The piece begins in D minor, modulates to F major, then to A, and back to D minor. Fig. 5 plots the detected key versus time where the y-axis values 0, 1, 2,… correspond to C, C#, D, etc.
0"
1"
2"
3"
4"
5"
6"
7"
8"
9"
10"
11"
1" 12"
23"
34"
45"
56"
67"
78"
89"
100"
111"
122"
133"
144"
155"
166"
177"
188"
199"
210"
221"
232"
243"
254"
265"
276"
287"
298"
309"
320"
331"
342"
353"
364"
375"
386"
397"
408"
419"
430"
441"
452"
463"
474"
485"
496"
507"
518"
529"
Fig. 5 Key vs. time for Invention in D minor
0"
1"
2"
3"
4"
5"
6"
7"
8"
9"
10"
11"
1" 19"
37"
55"
73"
91"
109"
127"
145"
163"
181"
199"
217"
235"
253"
271"
289"
307"
325"
343"
361"
379"
397"
415"
433"
451"
469"
487"
505"
523"
541"
559"
577"
595"
613"
631"
649"
667"
685"
703"
721"
739"
757"
775"
793"
811"
829"
847"
865"
Shorter"
Longer"
Fig. 6 Key vs. time for Invention in A minor
0"
1"
2"
3"
4"
5"
6"
7"
8"
9"
10"
11"
1" 19"
37"
55"
73"
91"
109"
127"
145"
163"
181"
199"
217"
235"
253"
271"
289"
307"
325"
343"
361"
379"
397"
415"
433"
451"
469"
487"
505"
523"
541"
559"
577"
595"
613"
631"
649"
667"
685"
703"
721"
739"
757"
775"
793"
811"
829"
847"
865"
Shorter"
Longer"
Fig. 7 Key vs. time for Invention in F major
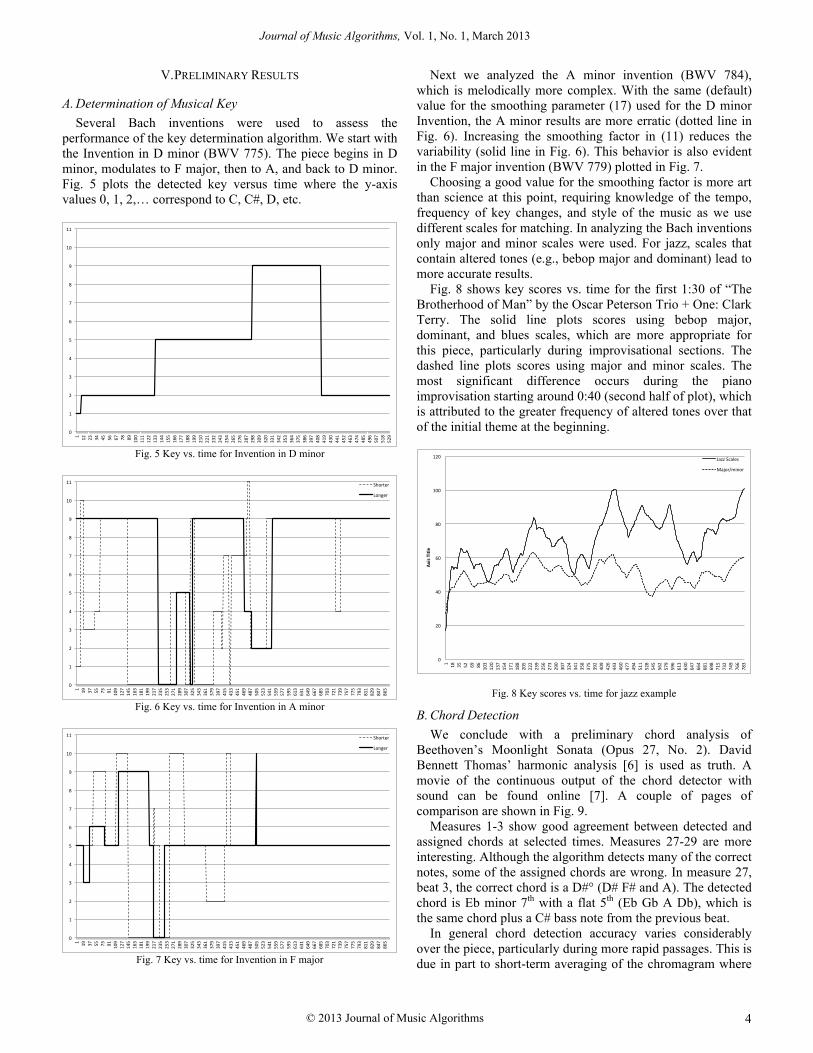
Next we analyzed the A minor invention (BWV 784), which is melodically more complex. With the same (default) value for the smoothing parameter (17) used for the D minor Invention, the A minor results are more erratic (dotted line in Fig. 6). Increasing the smoothing factor in (11) reduces the variability (solid line in Fig. 6). This behavior is also evident in the F major invention (BWV 779) plotted in Fig. 7. Choosing a good value for the smoothing factor is more art than science at this point, requiring knowledge of the tempo, frequency of key changes, and style of the music as we use different scales for matching. In analyzing the Bach inventions only major and minor scales were used. For jazz, scales that contain altered tones (e.g., bebop major and dominant) lead to more accurate results. Fig. 8 shows key scores vs. time for the first 1:30 of “The Brotherhood of Man” by the Oscar Peterson Trio + One: Clark Terry. The solid line plots scores using bebop major, dominant, and blues scales, which are more appropriate for this piece, particularly during improvisational sections. The dashed line plots scores using major and minor scales. The most significant difference occurs during the piano improvisation starting around 0:40 (second half of plot), which is attributed to the greater frequency of altered tones over that of the initial theme at the beginning.
0"
20"
40"
60"
80"
100"
120"
1" 18"
35"
52"
69"
86"
103"
120"
137"
154"
171"
188"
205"
222"
239"
256"
273"
290"
307"
324"
341"
358"
375"
392"
409"
426"
443"
460"
477"
494"
511"
528"
545"
562"
579"
596"
613"
630"
647"
664"
681"
698"
715"
732"
749"
766"
783"
Axis%Title%
Jazz"Scales"
Major/minor"
Fig. 8 Key scores vs. time for jazz example
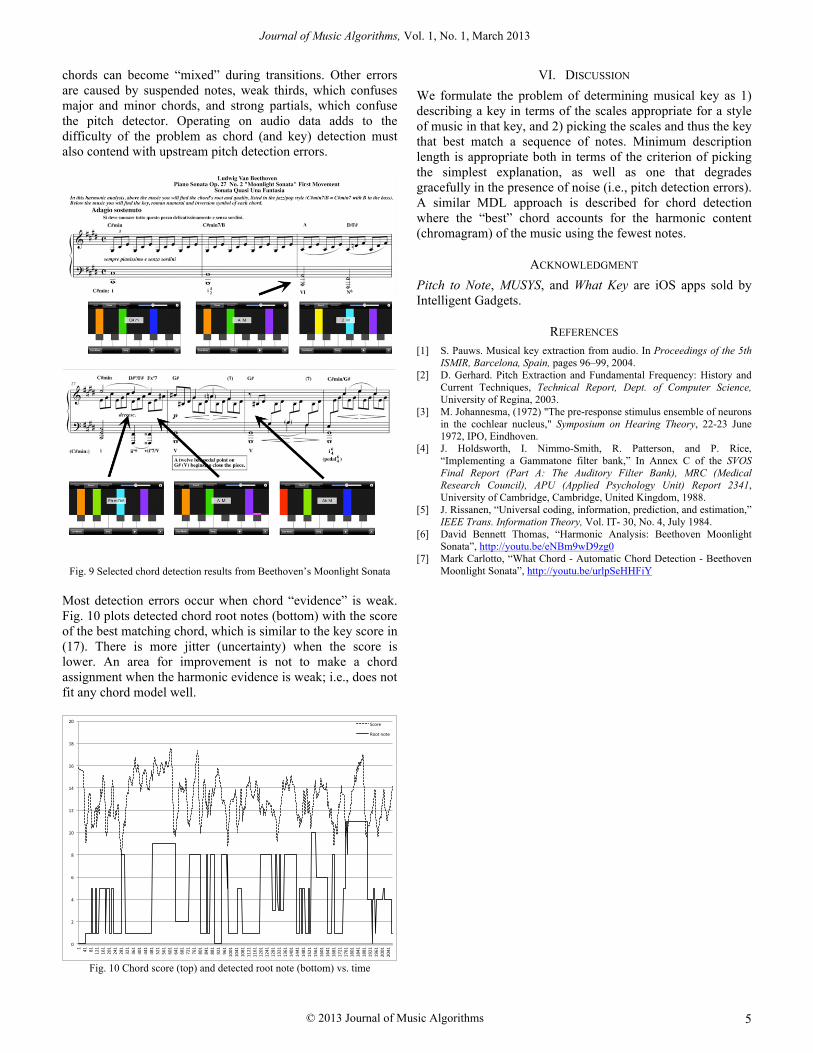
B. Chord Detection We conclude with a preliminary chord analysis of Beethoven’s Moonlight Sonata (Opus 27, No. 2). David Bennett Thomas’ harmonic analysis [6] is used as truth. A movie of the continuous output of the chord detector with sound can be found online [7]. A couple of pages of comparison are shown in Fig. 9. Measures 1-3 show good agreement between detected and assigned chords at selected times. Measures 27-29 are more interesting. Although the algorithm detects many of the correct notes, some of the assigned chords are wrong. In measure 27, beat 3, the correct chord is a D#° (D# F# and A). The detected chord is Eb minor 7th with a flat 5th (Eb Gb A Db), which is the same chord plus a C# bass note from the previous beat. In general chord detection accuracy varies considerably over the piece, particularly during more rapid passages. This is due in part to short-term averaging of the chromagram where
Journal of Music Algorithms, Vol. 1, No. 1, March 2013
© 2013 Journal of Music Algorithms 5
chords can become “mixed” during transitions. Other errors are caused by suspended notes, weak thirds, which confuses major and minor chords, and strong partials, which confuse the pitch detector. Operating on audio data adds to the difficulty of the problem as chord (and key) detection must also contend with upstream pitch detection errors.
Fig. 9 Selected chord detection results from Beethoven’s Moonlight Sonata
Most detection errors occur when chord “evidence” is weak. Fig. 10 plots detected chord root notes (bottom) with the score of the best matching chord, which is similar to the key score in (17). There is more jitter (uncertainty) when the score is lower. An area for improvement is not to make a chord assignment when the harmonic evidence is weak; i.e., does not fit any chord model well.
0"
2"
4"
6"
8"
10"
12"
14"
16"
18"
20"
1" 41"
81"
121"
161"
201"
241"
281"
321"
361"
401"
441"
481"
521"
561"
601"
641"
681"
721"
761"
801"
841"
881"
921"
961"
1001"
1041"
1081"
1121"
1161"
1201"
1241"
1281"
1321"
1361"
1401"
1441"
1481"
1521"
1561"
1601"
1641"
1681"
1721"
1761"
1801"
1841"
1881"
1921"
1961"
2001"
2041"
Score"
Root"note"
Fig. 10 Chord score (top) and detected root note (bottom) vs. time
VI. DISCUSSION We formulate the problem of determining musical key as 1) describing a key in terms of the scales appropriate for a style of music in that key, and 2) picking the scales and thus the key that best match a sequence of notes. Minimum description length is appropriate both in terms of the criterion of picking the simplest explanation, as well as one that degrades gracefully in the presence of noise (i.e., pitch detection errors). A similar MDL approach is described for chord detection where the “best” chord accounts for the harmonic content (chromagram) of the music using the fewest notes.
ACKNOWLEDGMENT Pitch to Note, MUSYS, and What Key are iOS apps sold by Intelligent Gadgets.
REFERENCES [1] S. Pauws. Musical key extraction from audio. In Proceedings of the 5th
ISMIR, Barcelona, Spain, pages 96–99, 2004. [2] D. Gerhard. Pitch Extraction and Fundamental Frequency: History and
Current Techniques, Technical Report, Dept. of Computer Science, University of Regina, 2003.
[3] M. Johannesma, (1972) "The pre-response stimulus ensemble of neurons in the cochlear nucleus," Symposium on Hearing Theory, 22-23 June 1972, IPO, Eindhoven.
[4] J. Holdsworth, I. Nimmo-Smith, R. Patterson, and P. Rice, “Implementing a Gammatone filter bank,” In Annex C of the SVOS Final Report (Part A: The Auditory Filter Bank), MRC (Medical Research Council), APU (Applied Psychology Unit) Report 2341, University of Cambridge, Cambridge, United Kingdom, 1988.
[5] J. Rissanen, “Universal coding, information, prediction, and estimation,” IEEE Trans. Information Theory, Vol. IT- 30, No. 4, July 1984.
[6] David Bennett Thomas, “Harmonic Analysis: Beethoven Moonlight Sonata”, http://youtu.be/eNBm9wD9zg0
[7] Mark Carlotto, “What Chord - Automatic Chord Detection - Beethoven Moonlight Sonata”, http://youtu.be/urlpSeHHFiY