Embed Size (px)
Citation preview

Continuous Moderator Variables
in Multiple Regression Analysis

What is a Moderator?
• A variable that alters the relationship between two or more other variables.
• If the relationship between X and Y varies across levels of M, then M is a moderator.
• “Moderation” is nothing more than what we called “interaction” in factorial ANOVA

Misanthropy, Idealism, and Attitudes About Animals• Same data I used to illustrate a Potthoff
analysis.• But idealism will not be dichotomized.• The criterion variable is score on the first
subscale of the Animal Attitudes scale.– The Animal Rights subscale– 12 Likert-type items– Cronbach alpha = .87.

Download
• Moderate.dat from my data files page.• Moderate.sas from my SAS programs
page.• Point the program to the data file.• Run the program.

Center the Variables ?
• Subtract mean from each score– For all predictor variables that are involved in
the interaction(s)• This is commonly done and believed to
prevent problems with– Multicollinearity– And other things (see Howell)
• May center the outcome variable too, but that is not necessary.

Don’t Center the Variables
• As recently demonstrated by Andrew Hayes, it is NOT necessary to center the predictors.
• It may, however, be easier to interpret the results if they are centered.
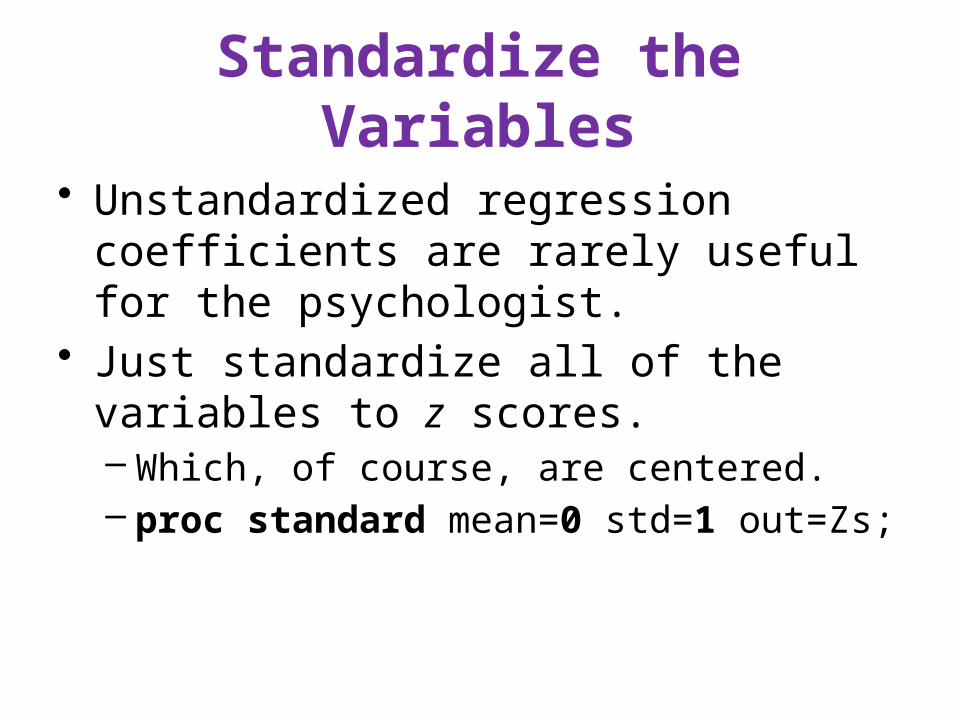
Standardize the Variables
• Unstandardized regression coefficients are rarely useful for the psychologist.
• Just standardize all of the variables to z scores.– Which, of course, are centered.– proc standard mean=0 std=1 out=Zs;
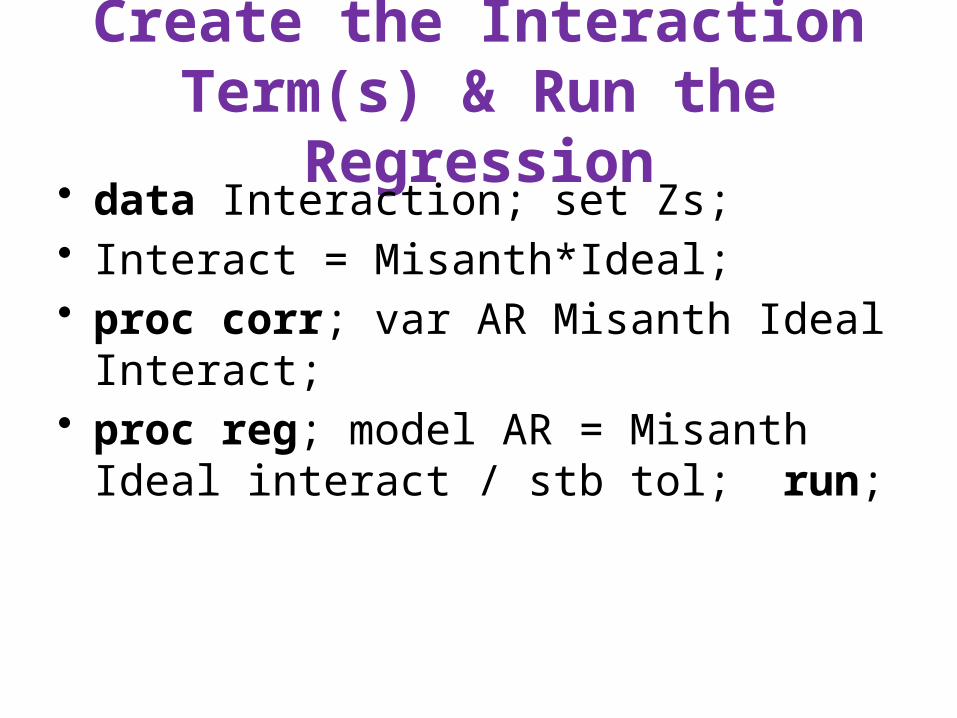
Create the Interaction Term(s) & Run the Regression
• data Interaction; set Zs;• Interact = Misanth*Ideal;• proc corr; var AR Misanth Ideal Interact;• proc reg; model AR = Misanth Ideal
interact / stb tol; run;

Regression Output
• R2 = .113 , p < .001• ZAR =
.303ZMisanth + .067ZIdeal .153Zinteract
• The interaction is significant, p = .049.• What does the regression look like for low
(-1), medium (0), and high (+1) values of the moderator?

Idealism = Low (-1)
• Substitute (-1) for ZIdeal
• .303 ZMisanth + .067(-1) + (-.153)(-1) ZMisanth
• ZAR = .456 ZMisanth - .067
• AR increases by .456 SD for each one SD increase in Misanth
• Now, watch this simple slope decrease as we increase idealism.
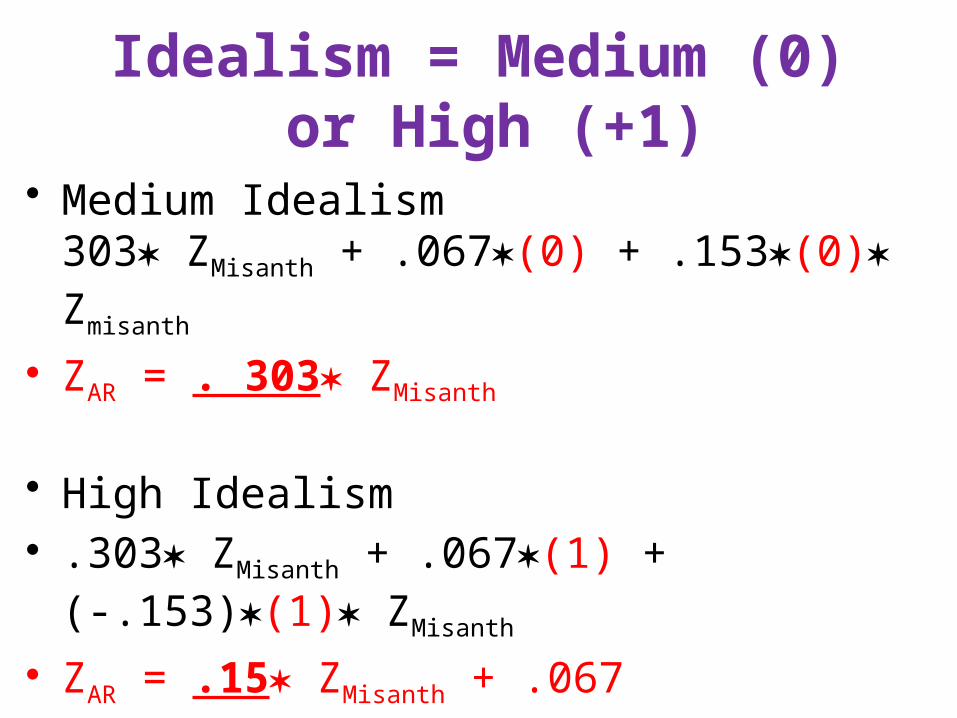
Idealism = Medium (0) or High (+1)
• Medium Idealism303 ZMisanth + .067(0) + .153(0) Zmisanth
• ZAR = . 303 ZMisanth
• High Idealism• .303 ZMisanth + .067(1) + (-.153)(1) ZMisanth
• ZAR = .15 ZMisanth + .067
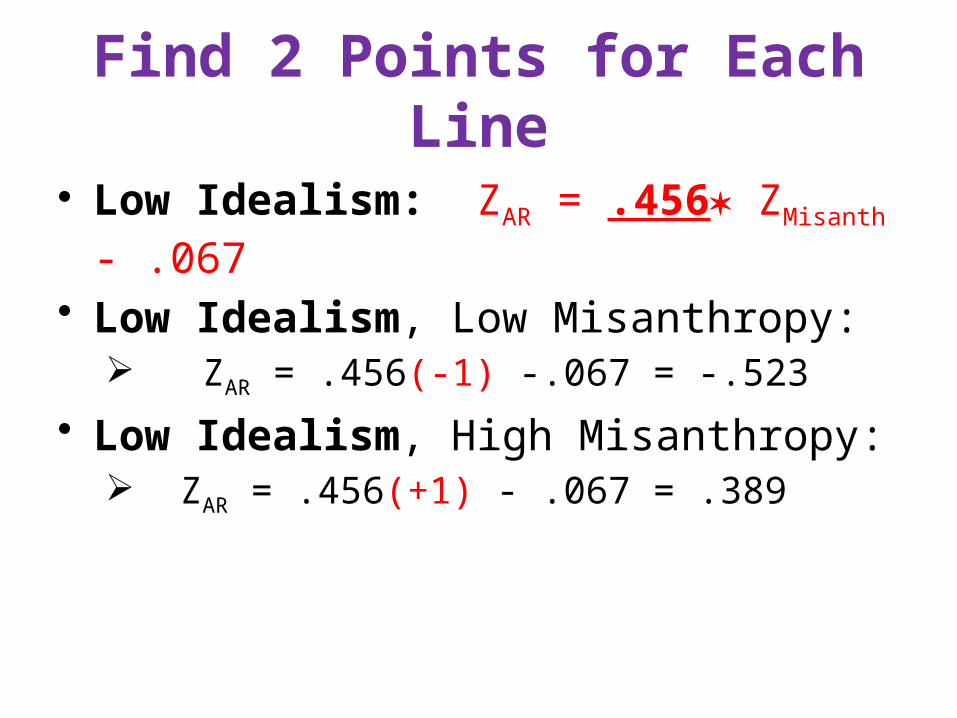
Find 2 Points for Each Line
• Low Idealism: ZAR = .456 ZMisanth - .067
• Low Idealism, Low Misanthropy: ZAR = .456(-1) -.067 = -.523
• Low Idealism, High Misanthropy: ZAR = .456(+1) - .067 = .389
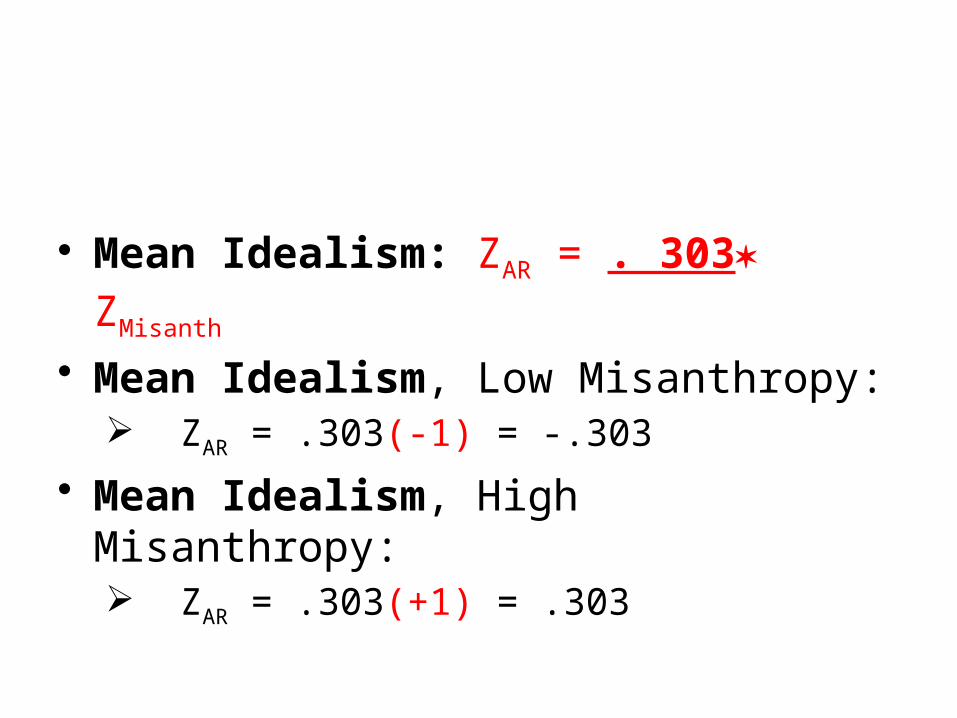
• Mean Idealism: ZAR = . 303 ZMisanth
• Mean Idealism, Low Misanthropy: ZAR = .303(-1) = -.303
• Mean Idealism, High Misanthropy: ZAR = .303(+1) = .303

• High Idealism: ZAR = .15 ZMisanth + .067
• High Idealism, Low Misanthropy: ZAR = .15(-1) + .067 = -.083
• High Idealism, High Misanthropy: ZAR = .15(+1) + .067 = .217

Plot the Three Lines

It Comes with Data
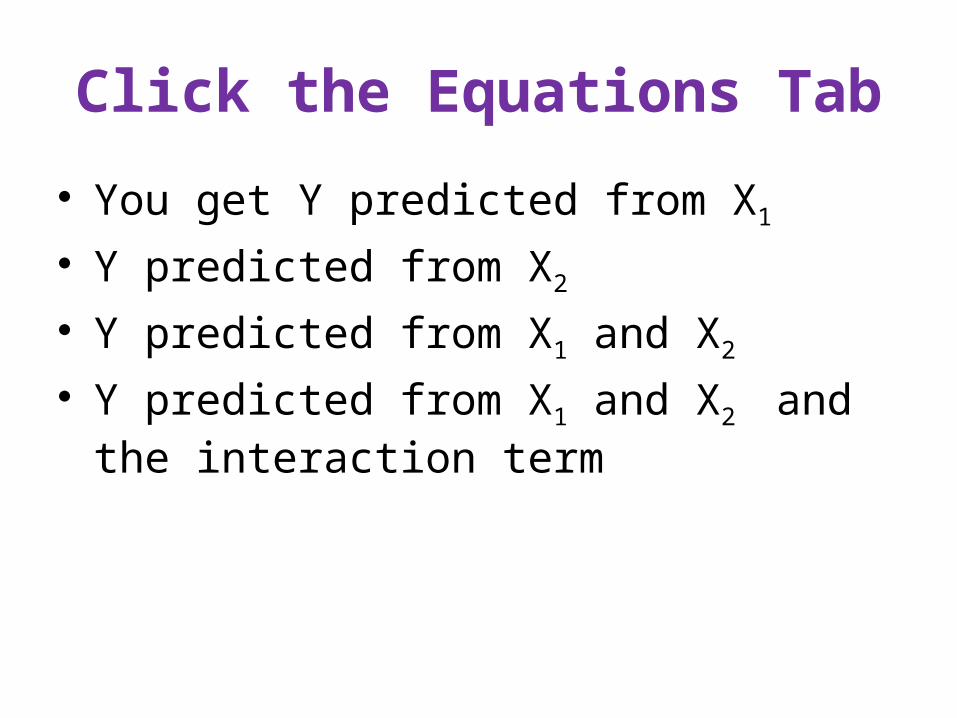
Click the Equations Tab
• You get Y predicted from X1
• Y predicted from X2
• Y predicted from X1 and X2
• Y predicted from X1 and X2 and the interaction term

Click on the 2-D View Tab
• Select the predictor variable to display on the abscissa.
• Select “Multiple with interaction.”• Move the slider to change the value of the
moderator variable.
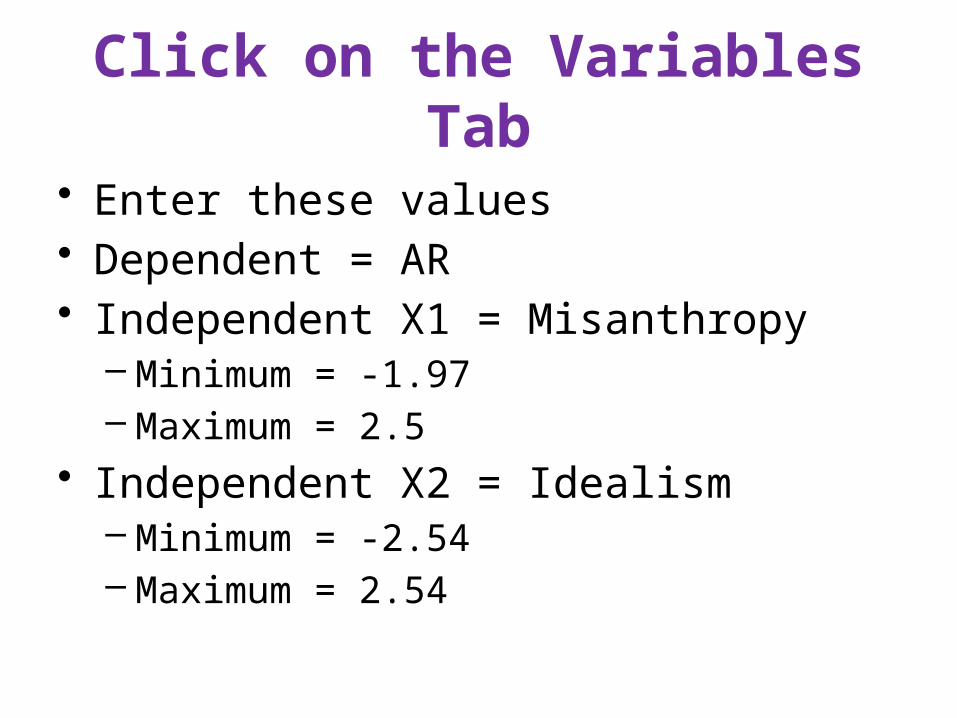
Click on the Variables Tab
• Enter these values• Dependent = AR• Independent X1 = Misanthropy
– Minimum = -1.97– Maximum = 2.5
• Independent X2 = Idealism– Minimum = -2.54– Maximum = 2.54
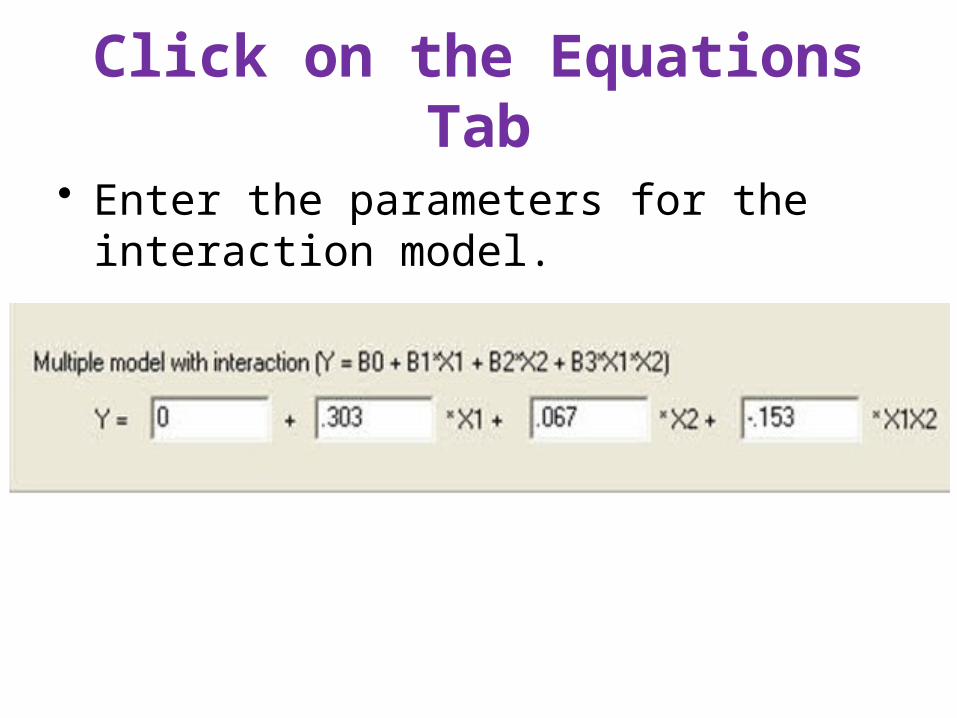
Click on the Equations Tab
• Enter the parameters for the interaction model.

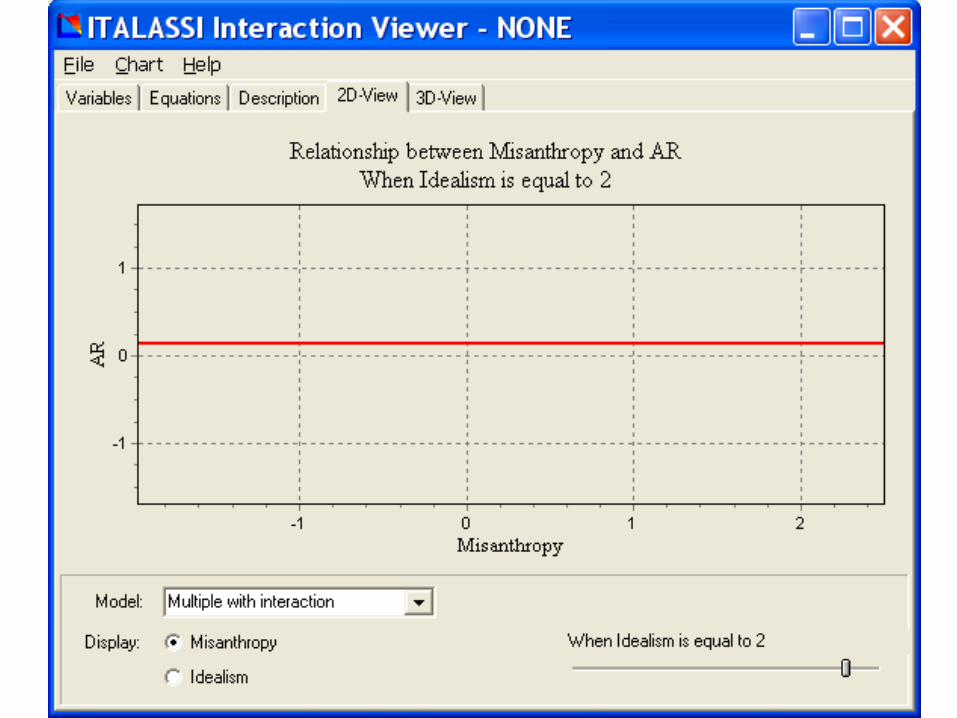
Click on the 2-D Tab
• Model: Multiple with interaction• Misanthropy on the abscissa.• Move the slider to vary the level of
idealism.


Process Hayes
• Hayes, A. F. (2013). Introduction to mediation, moderation, and conditional process analysis. New York, NY: Guilford.
• Highly recommended for those into mediation, moderation, and moderated mediation (aka conditional process analysis).

Process Hayes
• Hayes provides SAS and SPSS macros that make it much easier to conduct these analyses.
• Download the macros, data files, etc.• The first step is to identify the model that
matches the analysis you wish to do.• Run Process.sas.• If the data are not already in SAS, bring
them in.

Moderate_Process.sas
%process (data=Zs,vars=AR Misanth Ideal,y=ar,x=Misanth,m=Ideal,model=1,jn=1,plot=1);
Model SummaryR R-sq F df1 df2 p
0.3362 0.1130 6.3721 3.0000 150.0000 0.0004

Model
coeff se t p LLCI ULCI
constant -0.0202 0.0773 -0.2615 0.7940 -0.1730 0.1326
IDEAL 0.0672 0.0777 0.8643 0.3888 -0.0864 0.2207
MISANTH 0.3028 0.0777 3.8990 0.0001 0.1494 0.4563
INT_1 -0.1456 0.0733 -1.9861 0.0488 -0.2905 -0.0007
R-square increase due to interaction(s): R2-chng F df1 df2 p
INT_1 0.0233 3.9446 1.0000 150.0000 0.0488

The Simple Slopes
Conditional effect of X on Y at values of the moderator(s)
IDEAL Effect se t p LLCI ULCI
-1.0000 0.4485 0.1074 4.1738 0.0001 0.2361 0.6608
-0.0000 0.3028 0.0777 3.8990 0.0001 0.1494 0.4563
1.0000 0.1572 0.1062 1.4803 0.1409 -0.0526 0.3670
Values for “Effect” here are the standardized simple slopes at three levels of standardized Idealism.

Johnson-Neyman Technique
Moderator values(s) defining Johnson-Neymansignificance region(s)
Value % below % above0.7788 77.2727 22.7273
Misanthropy is significantly correlated with support for animal rights when the standardized value of idealism is .77 or lower.
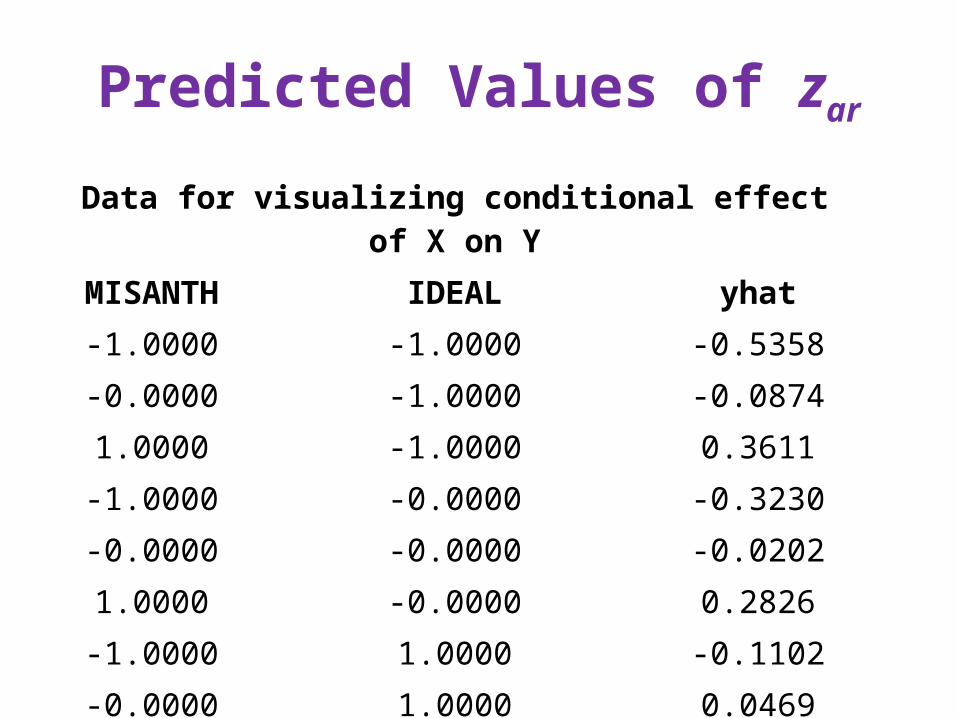
Data for visualizing conditional effectof X on Y
MISANTH IDEAL yhat-1.0000 -1.0000 -0.5358-0.0000 -1.0000 -0.08741.0000 -1.0000 0.3611-1.0000 -0.0000 -0.3230-0.0000 -0.0000 -0.02021.0000 -0.0000 0.2826-1.0000 1.0000 -0.1102-0.0000 1.0000 0.04691.0000 1.0000 0.2041
Predicted Values of zar

Data for Plot of Simple Slopes
data plot; input Misanthropy Idealism Animal_Rights; cards;-1.0000 -1.0000 -0.5358
-0.0000 -1.0000 -0.0874
1.0000 -1.0000 0.3611
-1.0000 -0.0000 -0.3230
-0.0000 -0.0000 -0.0202
1.0000 -0.0000 0.2826
-1.0000 1.0000 -0.1102
-0.0000 1.0000 0.0469
1.0000 1.0000 0.2041

Code for Plot of Simple Slopes
proc sgplot; reg x = misanthropy y = Animal_Rights / group = Idealism nomarkers;
yaxis label='Standardized Support of Animal Rights';
xaxis label='Standardized Misanthropy'; run;

Plot of Simple Slopes

Table of Conditional EffectsConditional effect of X on Y at values of the moderator (M)
IDEAL Effect se t p LLCI ULCI
-2.0275 0.5981 0.1686 3.5483 0.0005 0.2650 0.9312
-1.0140 0.4505 0.1082 4.1651 0.0001 0.2368 0.6642
0.7597 0.1922 0.0950 2.0220 0.0450 0.0044 0.3800
0.7788 0.1894 0.0959 1.9759 0.0500 0.0000 0.3788
1.0131 0.1553 0.1068 1.4533 0.1482 -0.0558 0.3664
2.0267 0.0076 0.1669 0.0458 0.9635 -0.3221 0.3374
I have trimmed this table a lot, so it would fit on this slide.
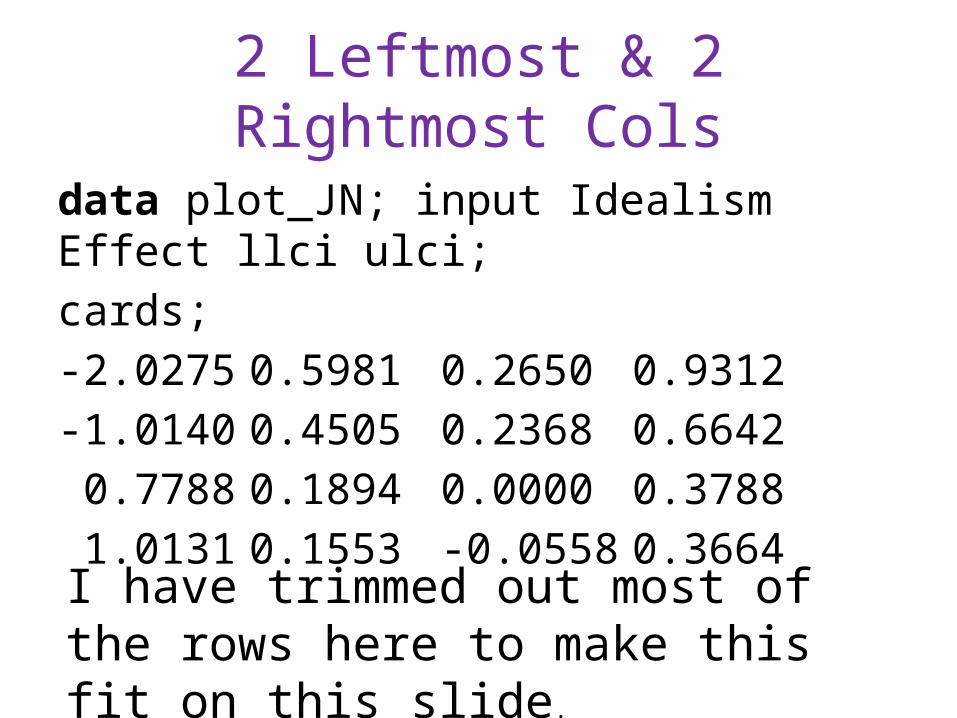
2 Leftmost & 2 Rightmost Cols
data plot_JN; input Idealism Effect llci ulci;
cards;
-2.0275 0.5981 0.2650 0.9312
-1.0140 0.4505 0.2368 0.6642
0.7788 0.1894 0.0000 0.3788
1.0131 0.1553 -0.0558 0.3664
I have trimmed out most of the rows here to make this fit on this slide.

Code for Johnson-Neyman Plot
proc sgplot;
series x=Idealism y=ulci/curvelabel = '95% Upper Limit' linesattr=(color=red pattern=ShortDash);
series x=Idealism y=effect/curvelabel = 'Point Estimate' linesattr=(color=blue pattern=Solid);
series x=Idealism y=llci/curvelabel = '95% Lower Limit' linesattr=(color=red pattern=ShortDash);
xaxis label = 'Idealism';
yaxis label = 'Conditional effect of misanthropy';
refline 0/axis=y transparency=0.5;
refline .7788/axis=x transparency=0.5; run;

Johnson-Neyman Plot

Main Effects vs Moderation
• Imagine a study where the variables are• Level of stress (state)• Dose, in mg, of a new drug (nopressor)
designed to reduce blood pressure.• SBP, patients resting systolic blood
pressure minus the systolic blood pressure considered to be normal/healthy for a person of the subject’s age and sex.

I frequently find my students writing statements (hypotheses) like this: “Dose of nopressor will moderate the effect of stress on systolic blood pressure such that those with high stress will exhibit lower blood pressure when the dose of nopressor is high. That is, nopressor will mitigate the hypertension caused by high stress.” Then I have to explain that the presence of a mitigating effect does not establish moderation.
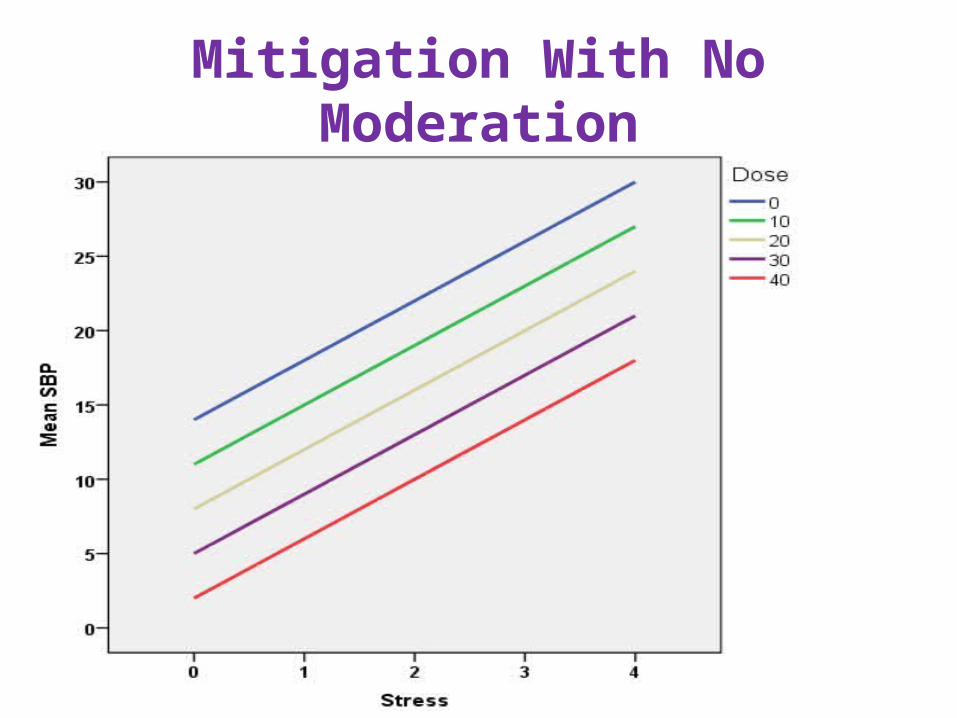
Mitigation With No Moderation

Mitigation With Moderation