Embed Size (px)
Citation preview

Project done for
Lidwala Consulting Engineers
Continuous Disposal of Ash at Majuba Power
Station:
Air Quality Basic Evaluation
Report No.: APP/12/LCE-03B Rev 0.1
Scoping Phase of EIA
DATE: September 2012
T Bird
R von Gruenewaldt

Continuous Disposal of Ash at Majuba Power Station: Air Quality Evaluation
Report No. APP/12/LCE-03B Rev 0 Page ii
REPORT DETAILS
Reference APP/12/LCE-03B
Status Revision 0
Report Title Continuous Disposal of Ash at Majuba Power Station: Air Quality Evaluation
Date August 2012
Client Lidwala Consulting Engineers
Prepared by T Bird PhD (Wits)
Reneé von Gruenewaldt (Pr. Sci. Nat.), MSc (University of Pretoria)
Notice
Airshed Planning Professionals (Pty) Ltd is a consulting company located in
Midrand, South Africa, specialising in all aspects of air quality, ranging from
nearby neighbourhood concerns to regional air pollution impacts. The
company originated in 1990 as Environmental Management Services, which
amalgamated with its sister company, Matrix Environmental Consultants, in
2003.
Declaration
Airshed is an independent consulting firm with no interest in the project other
than to fulfil the contract between the client and the consultant for delivery of
specialised services as stipulated in the terms of reference.
Copyright Warning
With very few exceptions, the copyright in all text and other matter (including
the manner of presentation) is the exclusive property of Airshed Planning
Professionals (Pty) Ltd. It is a criminal offence to reproduce and/or use,
without written consent, any matter, technical procedure and/or technique
contained in this document.
Acknowledgements The authors would like to express their appreciation for the discussions and
technical input from Ashlea Strong from Lidwala Consulting Engineers.

Continuous Disposal of Ash at Majuba Power Station: Air Quality Evaluation
Report No. APP/12/LCE-03B Rev 0 Page iii
Table of Contents
1 Introduction .................................................................................................................................... 1
1.1 Site Description ....................................................................................................................... 1
1.2 Air Quality Evaluation Approach .............................................................................................. 1
1.3 Report Outline.......................................................................................................................... 2
2 Air Quality Baseline Evaluation .................................................................................................... 3
2.1 Regional Climate and Atmospheric Dispersion Potential ........................................................ 3
2.1.1 Local wind field .................................................................................................................... 4
2.1.2 Surface Temperature ........................................................................................................... 5
2.1.3 Precipitation ......................................................................................................................... 6
2.1.4 Atmospheric Stability ........................................................................................................... 7
2.2 Ambient Air Quality near Majuba ............................................................................................. 8
3 Air Quality Evaluation .................................................................................................................. 10
3.1 Source Identification .............................................................................................................. 10
3.1.1 Construction ....................................................................................................................... 11
3.1.2 Continuous ash disposal ................................................................................................... 11
3.1.3 Rehabilitation ..................................................................................................................... 12
3.2 Qualitative Evaluation ............................................................................................................ 12
3.2.1 Construction Phase ........................................................................................................... 12
3.2.2 Continuous ash disposal ................................................................................................... 12
3.2.3 Rehabilitation ..................................................................................................................... 19
3.3 Dust Management Plan ......................................................................................................... 20
4 Conclusion .................................................................................................................................... 23
4.1 Recommendation .................................................................................................................. 23
5 References .................................................................................................................................... 25
Continuous Disposal of Ash at Majuba Power Station: Air Quality Evaluation
Report No. APP/12/LCE-03B Rev 0 Page iv
List of Figures
Figure 1: Period, day-time and night-time wind roses for Majuba (January 2009 – June 2012) ............ 4
Figure 2: Seasonal wind roses for Majuba (January 2009 – June 2012) ................................................ 5
Figure 3: Minimum, maximum and average monthly temperatures near Majuba Power Station during
the period 2009-2011 .............................................................................................................................. 6
Figure 4: Daily measured PM10 ground level concentrations (µg/m³) at the Eskom Majuba 1 monitoring
station (for the period January 2009 – June 2012) ................................................................................. 8
Figure 5: Estimated highest daily PM10 ground level concentrations at set distances from the emission
source with and without mitigation ........................................................................................................ 15
Figure 6: Estimated highest daily PM2.5 ground level concentrations at set distances from the emission
source, with and without mitigation ....................................................................................................... 16
List of Tables
Table 1: Monthly average rainfall for the site for the period August 2011 to July 2012 .......................... 6
Table 2: Atmospheric Stability Classes ................................................................................................... 7
Table 3: Measured daily ambient PM10 concentrations at Eskom’s Majuba 1 monitoring station for the
period 2009 to 2011 ................................................................................................................................. 9
Table 4: Activities and aspects identified for the construction, operational and closure phases of the
proposed operations .............................................................................................................................. 10
Table 5: Particle size distribution for the ash material at the Majuba Power Station ............................ 13
Table 6: Elemental analysis of the ash material at the Majuba Power Station ..................................... 14
Table 7: Predicted elemental concentrations at a distance of 100 m from the ash dump source ........ 18
Table 8: Predicted elemental concentrations at a distance of 1 500 m from the ash dump source ..... 19
Table 9: Air Quality Management Plan: Construction Phase ................................................................ 21
Table 10: Air Quality Management Plan: Operational Phase ................................................................ 21
Table 11: Air Quality Management Plan: Closure Phase ...................................................................... 22
Continuous Disposal of Ash at Majuba Power Station: Air Quality Evaluation
Report No. APP/12/LCE-03B Rev 0 Page v
List of Acronyms and Symbols
Airshed Airshed Planning Professionals (Pty) Ltd
Australian EPA Australian Environmental Protection Agency
Australian NPI Australian National Pollution Inventory
m metre
m² Metre squared
m/s Metre per second
mg/m²/day Milligram per metre squared per day
mamsl metres above mean sea level
NAAQS National Ambient Air Quality Standards
PM10 Particulate Matter with an aerodynamic diameter of less than 10µ
PM2.5 Particulate Matter with an aerodynamic diameter of less than 2.5µ
SA South Africa
tpa Tonnes per annum
TSP Total Suspended Particles
US United States
US.EPA United States Environmental Protection Agency
°C Degrees Celsius
Glossary
“air pollution” means any change in the composition of the air caused by smoke, soot, dust (including
coal), cinders, solid particles of any kind, gases, fumes, aerosols and odorous substances.
“ambient air” is defined as any area not regulated by Occupational Health and Safety regulations.
“atmospheric emission” or “emission” means any emission or entrainment process emanating
from a point, non-point or mobile source that results in air pollution.
“particulates” comprises a mixture of organic and inorganic substances, ranging in size and shape.
These can be divided into coarse and fine particulate matter. The former is called Total Suspended
Particulates (TSP), whilst thoracic particles or PM10 (particulate matter with an aerodynamic diameter
of less than 10 µm) fall in the finer fraction. PM10 is associated with health impacts for it represents
particles of a size that would be deposited in, and damaging to, the lower airways and gas-exchanging
portions of the lung. TSP, on the other hand, is usually of interest in terms of dust deposition
(nuisance).
Continuous Disposal of Ash at Majuba Power Station: Air Quality Evaluation
Report No. APP/12/LCE-03B Rev 0 Page 1
1 Introduction
Majuba Power Station, a coal-fired power generation facility construction started in 1983. The units
were commissioned between 1996 and 2001. The power station is located 32 km north-west of
Volksrust in the province of Mpumalanga. Majuba Power Station currently disposes of boiler ash in a
dry (20% moisture content) format, which is transported by means of conveyors. The ash is
distributed onto the ash disposal facility by means of a stacker at a rate of approximately 15 333 tons
per day. The ash disposal facility will, at full extent, cover an area of 955 ha with an airspace capacity
of 156.2 million m3. .
The proposed development of the ash disposal facility site has the following specifications:
• 0 to 15 year footprint – 362 ha (current operations)
• 15 to 60 year footprint – 550 ha (full extent of continuous ash disposal facility)
• Ground footprint of 912ha (existing & proposed ash disposal facility and pollution control
dams)
Airshed Planning Professionals (Pty) Ltd was appointed by Lidwala Consulting Engineers to
determine the potential for dust impacts on the surrounding environment and human health from the
proposed operations, with specific reference to air quality. Practical mitigation measures need to be
considered for the planning/construction and operational phases of the project. The rehabilitation of
the site also needs to be assessed.
1.1 Site Description
The existing ash disposal facilities are primarily surrounded by agricultural small holdings, power
generation and neighbouring mining operations. Major residential areas in the region include
Amersfoort (~15 km north-east) and Volksrust (~32 km south-east). Smaller residential areas in the
region include Perdekop (~14 km south-west) which includes at least two schools. Individual
residences (i.e. farm houses) are also in the immediate vicinity of the proposed operations. These
residential areas are outside of the 12 km-radius area of interest, centred at the power station.
1.2 Air Quality Evaluation Approach
The study followed a qualitative approach, using available meteorological data and pollutants typically
associated with the proposed activities to evaluate the potential for off-site impacts.
A qualitative assessment was undertaken based on the evaluation of existing windblown dust from
ash dump studies (Burger, 1994), together with the dispersion potential of the site and magnitude of

Continuous Disposal of Ash at Majuba Power Station: Air Quality Evaluation
Report No. APP/12/LCE-03B Rev 0 Page 2
expected impacts from the proposed activities. Based on the qualitative evaluation, mitigation
measures are proposed.
1.3 Report Outline
Section 2 of the report provides a description of the site specific dispersion potential through the
discussion of near-site surface meteorology.
Section 3 describes the expected process and the associated sources of air pollution followed by the
qualitative assessment of the proposed operations on the surrounding environment. A management
plan is provided.
Section 4 gives the main findings with recommendations.
The references are provided in Section 5.
Continuous Disposal of Ash at Majuba Power Station: Air Quality Evaluation
Report No. APP/12/LCE-03B Rev 0 Page 3
2 Air Quality Baseline Evaluation
The baseline evaluation primarily comprises the assessment of near-site surface meteorology. Eskom
ambient monitoring data from the Majuba 1 monitoring station, 3 km south-east of the Majuba Power
Station, provided an indication of the background air pollution in the region (Section 2.2).
2.1 Regional Climate and Atmospheric Dispersion Potential
The meteorological characteristics of a site govern the dispersion, transformation and eventual
removal of pollutants from the atmosphere (Pasquill and Smith, 1983; Godish, 1990). The extent to
which pollution will accumulate or disperse in the atmosphere is dependent on the degree of thermal
and mechanical turbulence within the earth’s boundary layer. Dispersion comprises vertical and
horizontal components of motion. The vertical component is defined by the stability of the atmosphere
and the depth of the surface mixing layer. The horizontal dispersion of pollution in the boundary layer
is primarily a function of the wind field. The wind speed determines both the distance of downwind
transport and the rate of dilution as a result of plume ‘stretching’. The generation of mechanical
turbulence is similarly a function of the wind speed, in combination with the surface roughness. The
wind direction and the variability in wind direction, determine the general path pollutants will follow,
and the extent of cross-wind spreading (Shaw and Munn, 1971; Pasquill and Smith, 1983; Oke,
1990).
Pollution concentration levels therefore fluctuate in response to changes in atmospheric stability, to
concurrent variations in the mixing depth, and to shifts in the wind field. Spatial variations, and diurnal
and seasonal changes in the wind field and stability regime are functions of atmospheric processes
operating at various temporal and spatial scales (Goldreich and Tyson, 1988). Atmospheric processes
at macro- and meso-scales must be accounted for to accurately parameterise the atmospheric
dispersion potential of a particular area. A qualitative description of the synoptic climatology of the
study region is provided based on a review of the pertinent literature. The analysis of meteorological
data observed for the proposed site, where available, and data for neighbouring sites will provide the
basis for the parameterisation of the meso-scale ventilation potential of the site.
The analysis of at least one year of hourly average meteorological data for the study site is required to
facilitate a reasonable understanding of the ventilation potential of the site. The most important
meteorological parameters to be considered are: wind speed, wind direction, ambient temperature,
atmospheric stability and mixing depth. Atmospheric stability and mixing depths are not routinely
recorded and frequently need to be calculated from diagnostic approaches and prognostic equations,
using as a basis routinely measured data, e.g. temperature, predicted solar radiation and wind speed.
Meteorological data for the Majuba Power Station site were available for the period 2009-2011.
Continuous Disposal of Ash at Majuba Power Station: Air Quality Evaluation
Report No. APP/12/LCE-03B Rev 0 Page 4
2.1.1 Local wind field
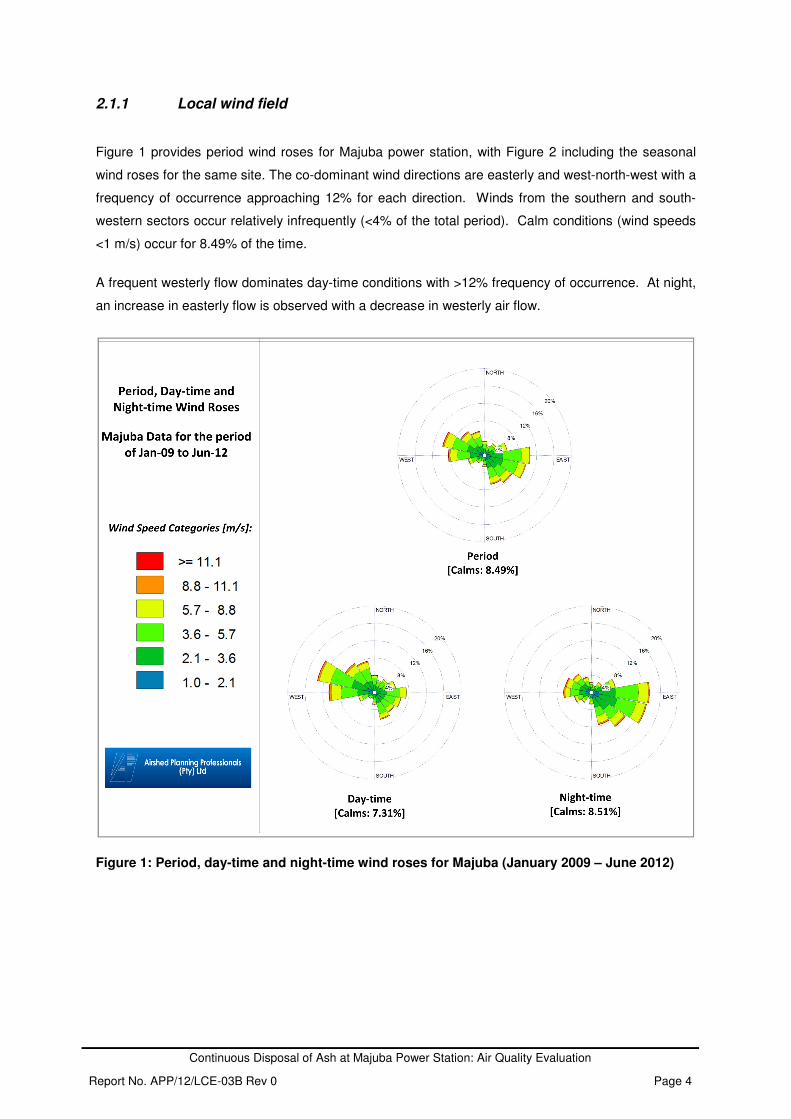
Figure 1 provides period wind roses for Majuba power station, with Figure 2 including the seasonal
wind roses for the same site. The co-dominant wind directions are easterly and west-north-west with a
frequency of occurrence approaching 12% for each direction. Winds from the southern and south-
western sectors occur relatively infrequently (<4% of the total period). Calm conditions (wind speeds
<1 m/s) occur for 8.49% of the time.
A frequent westerly flow dominates day-time conditions with >12% frequency of occurrence. At night,
an increase in easterly flow is observed with a decrease in westerly air flow.
Figure 1: Period, day-time and night-time wind roses for Majuba (January 2009 – June 2012)
Continuous Disposal of Ash at Majuba Power Station: Air Quality Evaluation
Report No. APP/12/LCE-03B Rev 0 Page 5
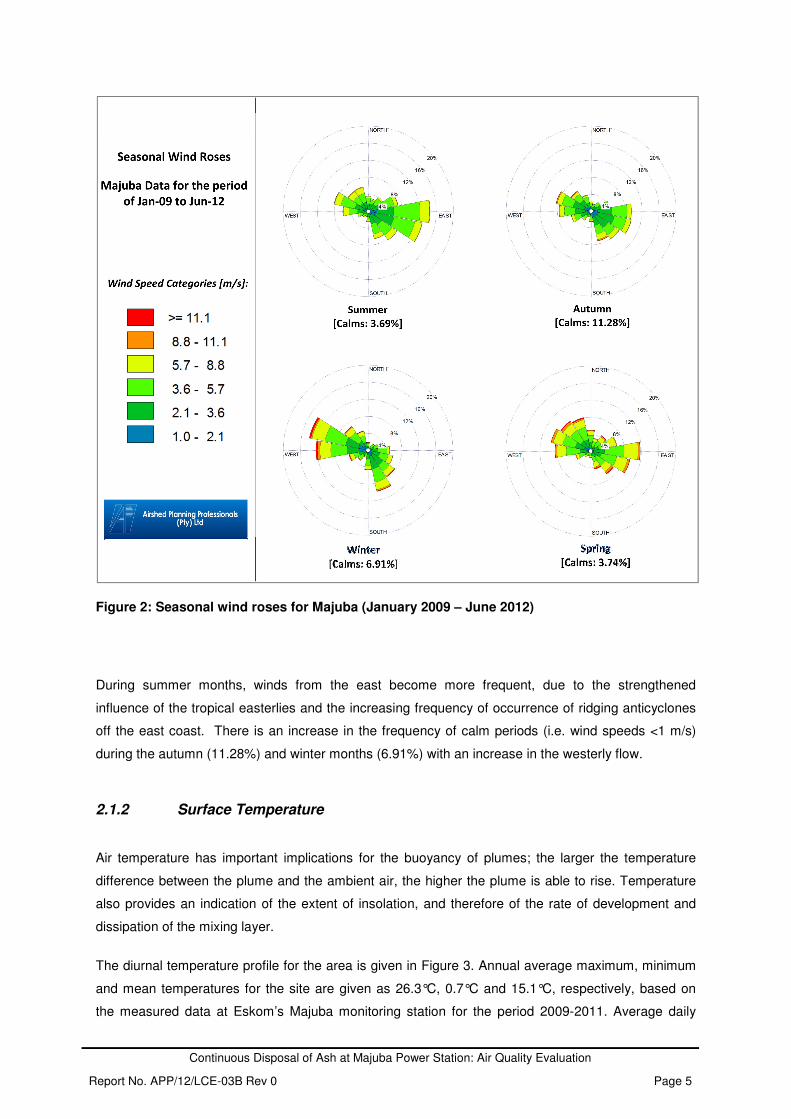
Figure 2: Seasonal wind roses for Majuba (January 2009 – June 2012)
During summer months, winds from the east become more frequent, due to the strengthened
influence of the tropical easterlies and the increasing frequency of occurrence of ridging anticyclones
off the east coast. There is an increase in the frequency of calm periods (i.e. wind speeds <1 m/s)
during the autumn (11.28%) and winter months (6.91%) with an increase in the westerly flow.
2.1.2 Surface Temperature
Air temperature has important implications for the buoyancy of plumes; the larger the temperature
difference between the plume and the ambient air, the higher the plume is able to rise. Temperature
also provides an indication of the extent of insolation, and therefore of the rate of development and
dissipation of the mixing layer.
The diurnal temperature profile for the area is given in Figure 3. Annual average maximum, minimum
and mean temperatures for the site are given as 26.3°C, 0.7°C and 15.1°C, respectively, based on
the measured data at Eskom’s Majuba monitoring station for the period 2009-2011. Average daily

Continuous Disposal of Ash
Report No. APP/12/LCE-03B Rev 0
maximum temperatures range from
minima ranging from 16°C in Janu
Figure 3: Minimum, maximum and average monthly temperatures
during the period 2009-2011
2.1.3 Precipitation
Rainfall represents an effective removal mechanism of atmospheric pollutants and is therefore
frequently considered during air pollution studies.
Monthly rainfall for the site (August 2011 to July 2012
for this period is in the range of 3
85% of the annual rainfall occurring during the October to March period.
Table 1: Monthly rainfall for the site for the period
Month
Aug-11
Sep-11
Oct-11
Nov-11
Dec-11
Jan-12
Continuous Disposal of Ash at Majuba Power Station: Air Quality Evaluation
maximum temperatures range from 25.6°C in February and December to 16.6°C in Ju
January to 0.7°C in July (Figure 3).
Minimum, maximum and average monthly temperatures near Majuba Power Station
represents an effective removal mechanism of atmospheric pollutants and is therefore
frequently considered during air pollution studies.
August 2011 to July 2012) is given in Table 1. Average monthly rainfall
d is in the range of 39 mm. The study area falls within a summer rainfall region, with over
85% of the annual rainfall occurring during the October to March period.
Monthly rainfall for the site for the period August 2011 to July 2012
Precipitation (mm)
5
33
43
35
128
49
Power Station: Air Quality Evaluation
Page 6
°C in June, with daily
near Majuba Power Station
represents an effective removal mechanism of atmospheric pollutants and is therefore
) is given in Table 1. Average monthly rainfall
mm. The study area falls within a summer rainfall region, with over
Precipitation (mm)
Continuous Disposal of Ash at Majuba Power Station: Air Quality Evaluation
Report No. APP/12/LCE-03B Rev 0 Page 7
Month Precipitation (mm)
Feb-12 125
Mar-12 24
Apr-12 21
May-12 0
Jun-12 10
Jul-12 0
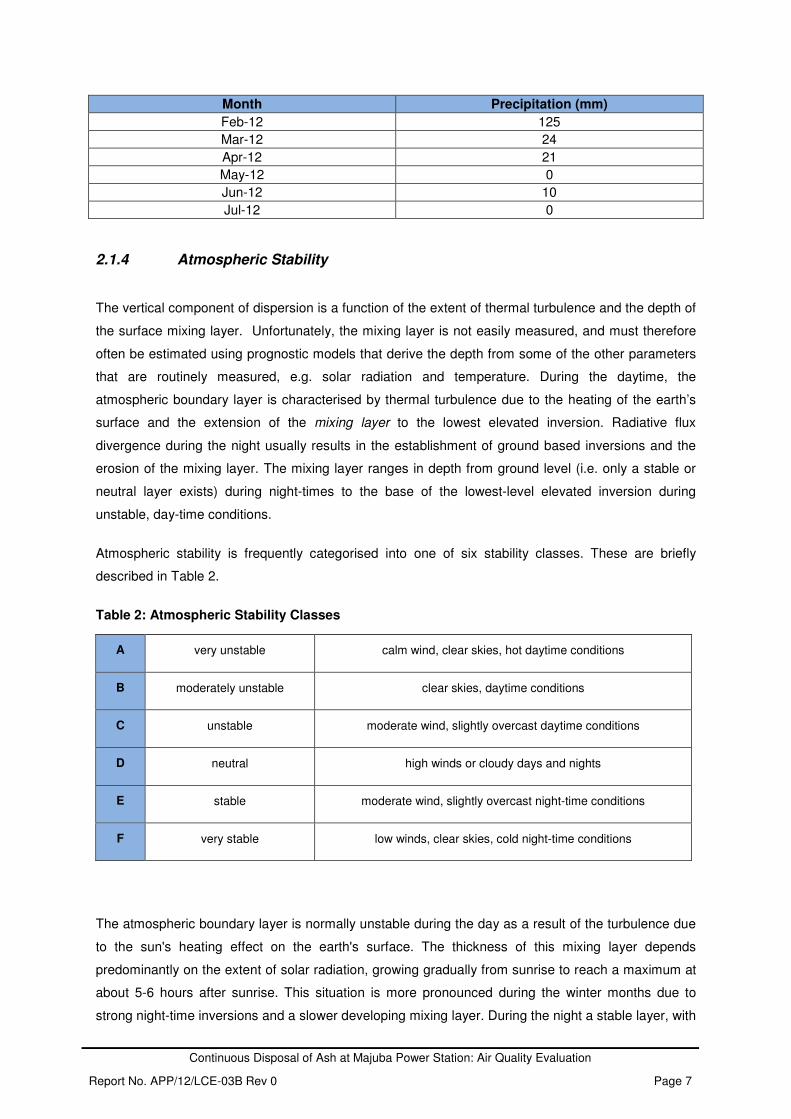
2.1.4 Atmospheric Stability
The vertical component of dispersion is a function of the extent of thermal turbulence and the depth of
the surface mixing layer. Unfortunately, the mixing layer is not easily measured, and must therefore
often be estimated using prognostic models that derive the depth from some of the other parameters
that are routinely measured, e.g. solar radiation and temperature. During the daytime, the
atmospheric boundary layer is characterised by thermal turbulence due to the heating of the earth’s
surface and the extension of the mixing layer to the lowest elevated inversion. Radiative flux
divergence during the night usually results in the establishment of ground based inversions and the
erosion of the mixing layer. The mixing layer ranges in depth from ground level (i.e. only a stable or
neutral layer exists) during night-times to the base of the lowest-level elevated inversion during
unstable, day-time conditions.
Atmospheric stability is frequently categorised into one of six stability classes. These are briefly
described in Table 2.
Table 2: Atmospheric Stability Classes
A very unstable calm wind, clear skies, hot daytime conditions
B moderately unstable clear skies, daytime conditions
C unstable moderate wind, slightly overcast daytime conditions
D neutral high winds or cloudy days and nights
E stable moderate wind, slightly overcast night-time conditions
F very stable low winds, clear skies, cold night-time conditions
The atmospheric boundary layer is normally unstable during the day as a result of the turbulence due
to the sun's heating effect on the earth's surface. The thickness of this mixing layer depends
predominantly on the extent of solar radiation, growing gradually from sunrise to reach a maximum at
about 5-6 hours after sunrise. This situation is more pronounced during the winter months due to
strong night-time inversions and a slower developing mixing layer. During the night a stable layer, with
Continuous Disposal of Ash
Report No. APP/12/LCE-03B Rev 0
limited vertical mixing, exists. During windy and/or cloudy conditions, the atmosphere is normally
neutral.
For low level releases, such as due to vehicle entrainment from unpaved roads, the highest ground
level concentrations will occur during weak wind speeds and sta
conditions. Wind erosion, on the other hand, requires strong winds together with fairly stable
conditions to result in high ground level concentrations i.e. neutral conditions.
2.2 Ambient Air Quality
Eskom manages an ambient air quality m
quality from Majuba Power Station
permission, for the current evaluation study, by Gerhardt de Beer, 2012
station is located 3 km east-south
of ambient concentrations of sulphur dioxide
of particulate size <10 µm in diameter
January 2009 to June 2012 are presented
Figure 4: Daily measured PM
monitoring station (for the period
The current National Ambient Air Quality
exceeded on two occasions during the period reported
Continuous Disposal of Ash at Majuba Power Station: Air Quality Evaluation
cal mixing, exists. During windy and/or cloudy conditions, the atmosphere is normally
For low level releases, such as due to vehicle entrainment from unpaved roads, the highest ground
level concentrations will occur during weak wind speeds and stable (night
conditions. Wind erosion, on the other hand, requires strong winds together with fairly stable
conditions to result in high ground level concentrations i.e. neutral conditions.
Ambient Air Quality near Majuba
ambient air quality monitoring station near Majuba to assess impacts
Power Station and other pollution sources in the area
permission, for the current evaluation study, by Gerhardt de Beer, 2012-09-
south-east of the power station and is equipped for continuous monitoring
sulphur dioxide (SO2), nitrogen dioxide (NO2), and fine particulate matter
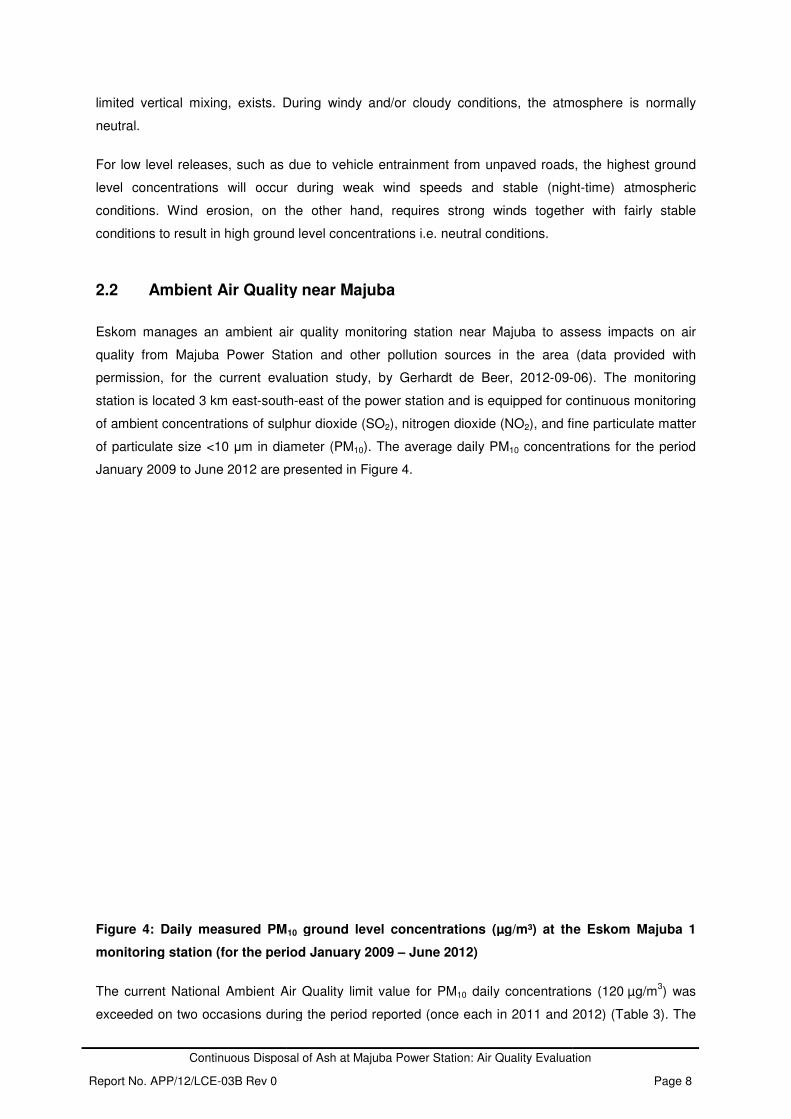
m in diameter (PM10). The average daily PM10 concentrations for the period
are presented in Figure 4.
: Daily measured PM10 ground level concentrations (µg/m³) at the
monitoring station (for the period January 2009 – June 2012)
ational Ambient Air Quality limit value for PM10 daily concentration
exceeded on two occasions during the period reported (once each in 2011 and 2012)
Power Station: Air Quality Evaluation
Page 8
cal mixing, exists. During windy and/or cloudy conditions, the atmosphere is normally
For low level releases, such as due to vehicle entrainment from unpaved roads, the highest ground
ble (night-time) atmospheric
conditions. Wind erosion, on the other hand, requires strong winds together with fairly stable
to assess impacts on air
(data provided with
-06). The monitoring
is equipped for continuous monitoring
and fine particulate matter
concentrations for the period
ground level concentrations (µg/m³) at the Eskom Majuba 1
daily concentrations (120 µg/m3) was
(once each in 2011 and 2012) (Table 3). The
Continuous Disposal of Ash at Majuba Power Station: Air Quality Evaluation
Report No. APP/12/LCE-03B Rev 0 Page 9
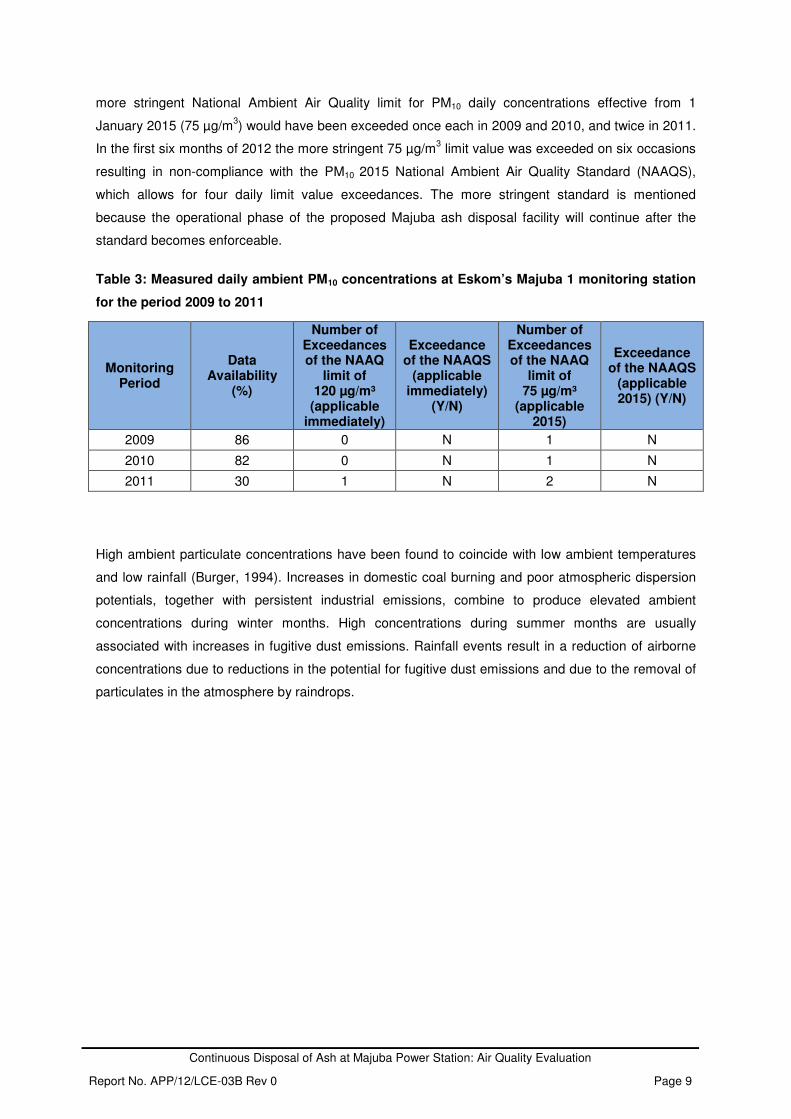
more stringent National Ambient Air Quality limit for PM10 daily concentrations effective from 1
January 2015 (75 µg/m3) would have been exceeded once each in 2009 and 2010, and twice in 2011.
In the first six months of 2012 the more stringent 75 µg/m3 limit value was exceeded on six occasions
resulting in non-compliance with the PM10 2015 National Ambient Air Quality Standard (NAAQS),
which allows for four daily limit value exceedances. The more stringent standard is mentioned
because the operational phase of the proposed Majuba ash disposal facility will continue after the
standard becomes enforceable.
Table 3: Measured daily ambient PM10 concentrations at Eskom’s Majuba 1 monitoring station
for the period 2009 to 2011
Monitoring Period
Data Availability
(%)
Number of Exceedances of the NAAQ
limit of 120 µg/m³
(applicable immediately)
Exceedance of the NAAQS
(applicable immediately)
(Y/N)
Number of Exceedances of the NAAQ
limit of 75 µg/m³
(applicable 2015)
Exceedance of the NAAQS
(applicable 2015) (Y/N)
2009 86 0 N 1 N
2010 82 0 N 1 N
2011 30 1 N 2 N
High ambient particulate concentrations have been found to coincide with low ambient temperatures
and low rainfall (Burger, 1994). Increases in domestic coal burning and poor atmospheric dispersion
potentials, together with persistent industrial emissions, combine to produce elevated ambient
concentrations during winter months. High concentrations during summer months are usually
associated with increases in fugitive dust emissions. Rainfall events result in a reduction of airborne
concentrations due to reductions in the potential for fugitive dust emissions and due to the removal of
particulates in the atmosphere by raindrops.
Continuous Disposal of Ash at Majuba Power Station: Air Quality Evaluation
Report No. APP/12/LCE-03B Rev 0 Page 10
3 Air Quality Evaluation
3.1 Source Identification
The project includes the continuous disposal of ash at the Majuba Power Station ash disposal facility
in the Mpumalanga Province.
Rehabilitation will include the covering of the ash disposal facility with topsoil before vegetation can be
established. Land preparation during progression of the ash disposal facility will generate dust as well
as any freshly exposed topsoil that will be prone to wind erosion before vegetation takes over.
Movement of vehicles will also be a source of pollution.
The main pollutant of concern associated with the current and proposed operations is particulate
matter. Particulates are divided into different particle size categories with Total Suspended
Particulates (TSP) associated with nuisance impacts and the finer fractions of PM10 (particulates with
a diameter less than 10 µm) and PM2.5 (diameter less than 2.5 µm) linked with potential health
impacts. PM10 is primarily associated with mechanically generated dust whereas PM2.5 is associated
with combustion sources. Gaseous pollutants (such as sulphur dioxide, oxides of nitrogen, carbon
monoxide, etc.) derive from vehicle exhausts and other combustions sources. These are however
insignificant in relation to the particulate emissions and are not discussed in detail.
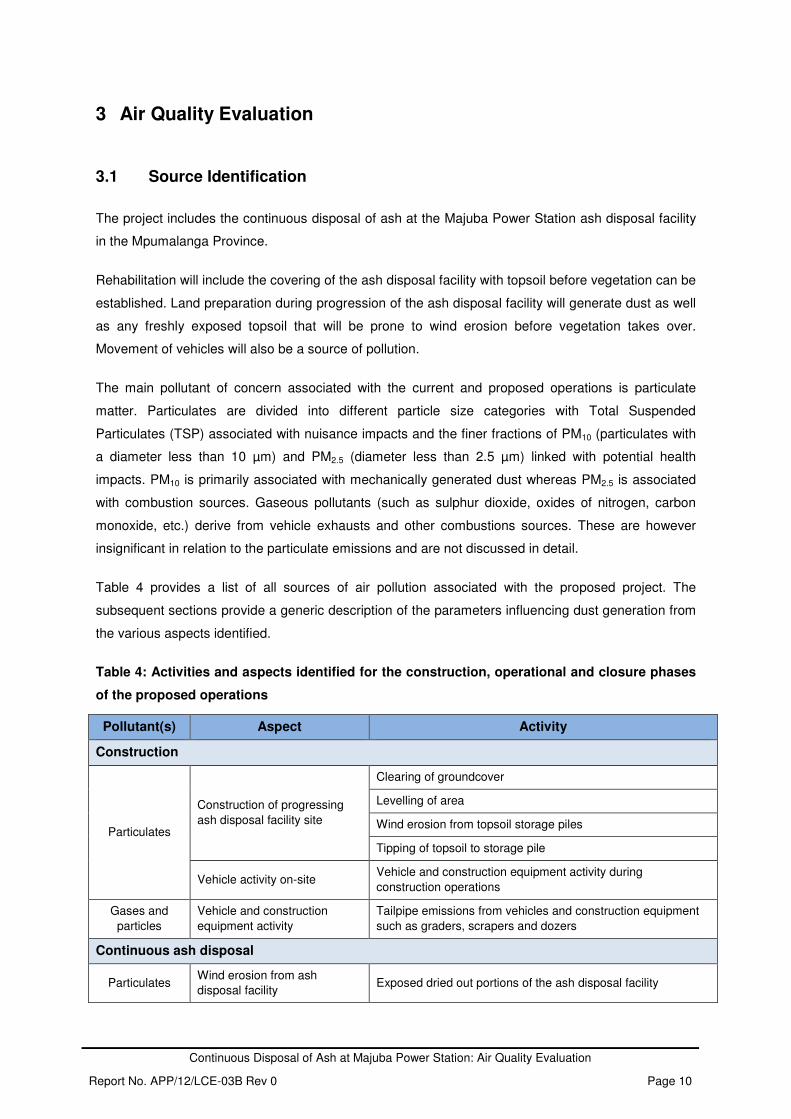
Table 4 provides a list of all sources of air pollution associated with the proposed project. The
subsequent sections provide a generic description of the parameters influencing dust generation from
the various aspects identified.
Table 4: Activities and aspects identified for the construction, operational and closure phases
of the proposed operations
Pollutant(s) Aspect Activity
Construction
Particulates
Construction of progressing
ash disposal facility site
Clearing of groundcover
Levelling of area
Wind erosion from topsoil storage piles
Tipping of topsoil to storage pile
Vehicle activity on-site Vehicle and construction equipment activity during
construction operations
Gases and
particles
Vehicle and construction
equipment activity
Tailpipe emissions from vehicles and construction equipment
such as graders, scrapers and dozers
Continuous ash disposal
Particulates Wind erosion from ash
disposal facility Exposed dried out portions of the ash disposal facility
Continuous Disposal of Ash at Majuba Power Station: Air Quality Evaluation
Report No. APP/12/LCE-03B Rev 0 Page 11
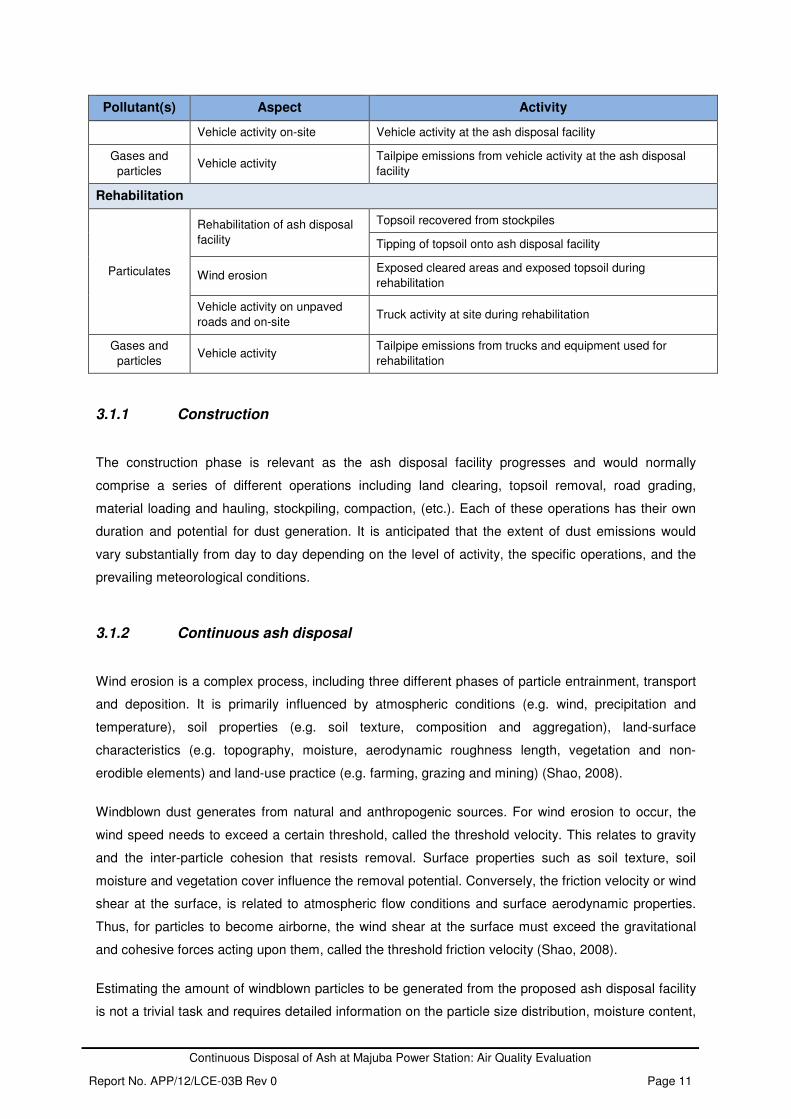
Pollutant(s) Aspect Activity
Vehicle activity on-site Vehicle activity at the ash disposal facility
Gases and
particles Vehicle activity
Tailpipe emissions from vehicle activity at the ash disposal
facility
Rehabilitation
Particulates
Rehabilitation of ash disposal
facility
Topsoil recovered from stockpiles
Tipping of topsoil onto ash disposal facility
Wind erosion Exposed cleared areas and exposed topsoil during
rehabilitation
Vehicle activity on unpaved
roads and on-site Truck activity at site during rehabilitation
Gases and
particles Vehicle activity
Tailpipe emissions from trucks and equipment used for
rehabilitation
3.1.1 Construction
The construction phase is relevant as the ash disposal facility progresses and would normally
comprise a series of different operations including land clearing, topsoil removal, road grading,
material loading and hauling, stockpiling, compaction, (etc.). Each of these operations has their own
duration and potential for dust generation. It is anticipated that the extent of dust emissions would
vary substantially from day to day depending on the level of activity, the specific operations, and the
prevailing meteorological conditions.
3.1.2 Continuous ash disposal
Wind erosion is a complex process, including three different phases of particle entrainment, transport
and deposition. It is primarily influenced by atmospheric conditions (e.g. wind, precipitation and
temperature), soil properties (e.g. soil texture, composition and aggregation), land-surface
characteristics (e.g. topography, moisture, aerodynamic roughness length, vegetation and non-
erodible elements) and land-use practice (e.g. farming, grazing and mining) (Shao, 2008).
Windblown dust generates from natural and anthropogenic sources. For wind erosion to occur, the
wind speed needs to exceed a certain threshold, called the threshold velocity. This relates to gravity
and the inter-particle cohesion that resists removal. Surface properties such as soil texture, soil
moisture and vegetation cover influence the removal potential. Conversely, the friction velocity or wind
shear at the surface, is related to atmospheric flow conditions and surface aerodynamic properties.
Thus, for particles to become airborne, the wind shear at the surface must exceed the gravitational
and cohesive forces acting upon them, called the threshold friction velocity (Shao, 2008).
Estimating the amount of windblown particles to be generated from the proposed ash disposal facility
is not a trivial task and requires detailed information on the particle size distribution, moisture content,
Continuous Disposal of Ash at Majuba Power Station: Air Quality Evaluation
Report No. APP/12/LCE-03B Rev 0 Page 12
silt content and bulk density. Dust will only be generated under conditions of high wind speeds and
from areas where the material is exposed and has dried out (US.EPA, 1995).
3.1.3 Rehabilitation
Rehabilitation will be undertaken continuously throughout the operations and will include the removal
and tipping of topsoil onto the completed ash disposal facility surface areas. Dust may be generated
from the dried out exposed ash surfaces before it is covered with topsoil. Once vegetation is
established the potential for dust generation will reduce significantly. The tipping of topsoil and vehicle
entrainment on associated unpaved roads will also result in dust generation.
It is assumed that all ash disposal activities will have ceased during closure phase, when the power
station has reached end of life. Because most of the rehabilitation is undertaken during the
operations, the ash disposal facility should be almost completely rehabilitated by the closure phase.
The potential for impacts after closure will depend on the extent of continuous rehabilitation efforts on
the ash disposal facility.
3.2 Qualitative Evaluation
3.2.1 Construction Phase
It is not anticipated that the various construction activities will result in higher off-site impacts than the
operational activities. The temporary nature of the construction activities, and the likelihood that these
activities will be localised and for small areas at a time, will reduce the potential for significant off-site
impacts.
According to the Australian Environmental Protection Agency on recommended separation distances
from various activities, a buffer zone of 300 m from the nearest sensitive receptor is required when
extractive-type materials handling activities occur (AEPA, 2007).
3.2.2 Continuous ash disposal
The current air quality at the proposed site is discussed in Section 2.2. The ash disposal facility will
continue to give rise to dust generation as the ash disposal operations progress, and as such should
not result in any additional emissions relative to present operations provided that the ash disposal
facility is properly rehabilitated. These operations, as discussed under Section 3.1.2, are low level
release sources meaning that the dust gets generated at heights of between 0.5 m and 1 m from the
ash disposal facility surface.

Continuous Disposal of Ash at Majuba Power Station: Air Quality Evaluation
Report No. APP/12/LCE-03B Rev 0 Page 13
Wind erosion, will occur during strong wind conditions when wind speeds exceed the critical threshold
required to lift and suspend the coal particles. This threshold is determined by the parameters that
resist removal such as the particle size distribution of the bed material, moisture content and
vegetation. A typical wind speed threshold is given as 5.4 m/s for storage piles (US.EPA, 1995). Wind
data for the proposed ash disposal facility site (2009 to 2012) indicate an average wind speed of 3.79
m/s and a maximum of 15.9 m/s, where the wind speed threshold is exceeded 22.3% of the time.
To provide an indication of the potential distance and significance of impacts from these activities, the
US.EPA screening model (TScreen) is used. This model represents a quick method to calculate and
“flag” the “worst-case” concentration that might occur. Screening models require very little input and
have a built-in set of meteorological conditions based on stability classes (Section 2.1.4). It is a quick
screening tool to identify possible sources that might require more detailed modelling. It is important
to note that these models do not use actual meteorological data, but rather set stability
classes that will produce the highest impacts. The impacts are therefore not related to the
actual wind directions or speeds. More sophisticated Gaussian plume and puff models such as the
US.EPA regulatory AERMOD and CALPUFF models use actual meteorological conditions. For the
purpose of this study, a screening model is sufficient as the focus of this study is merely to provide an
indication of the potential significance of the operations on the surrounding environment.
The particle size distribution of the ash material as obtained at the ash disposal facility at Majuba is
provided in Table 5 with the elemental analysis of the material provided in Table 6
Table 5: Particle size distribution for the ash material at the Majuba Power Station
Size (µm) Fraction
2000 0.0339
1000 0.0193
301 0.0000
140 0.0928
103 0.0677
76 0.0796
56 0.0951
48 0.0529
30 0.1674
16 0.1908
10 0.0942
6 0.0590
3 0.0420
2 0.0049
1 0.0004
Continuous Disposal of Ash at Majuba Power Station: Air Quality Evaluation
Report No. APP/12/LCE-03B Rev 0 Page 14
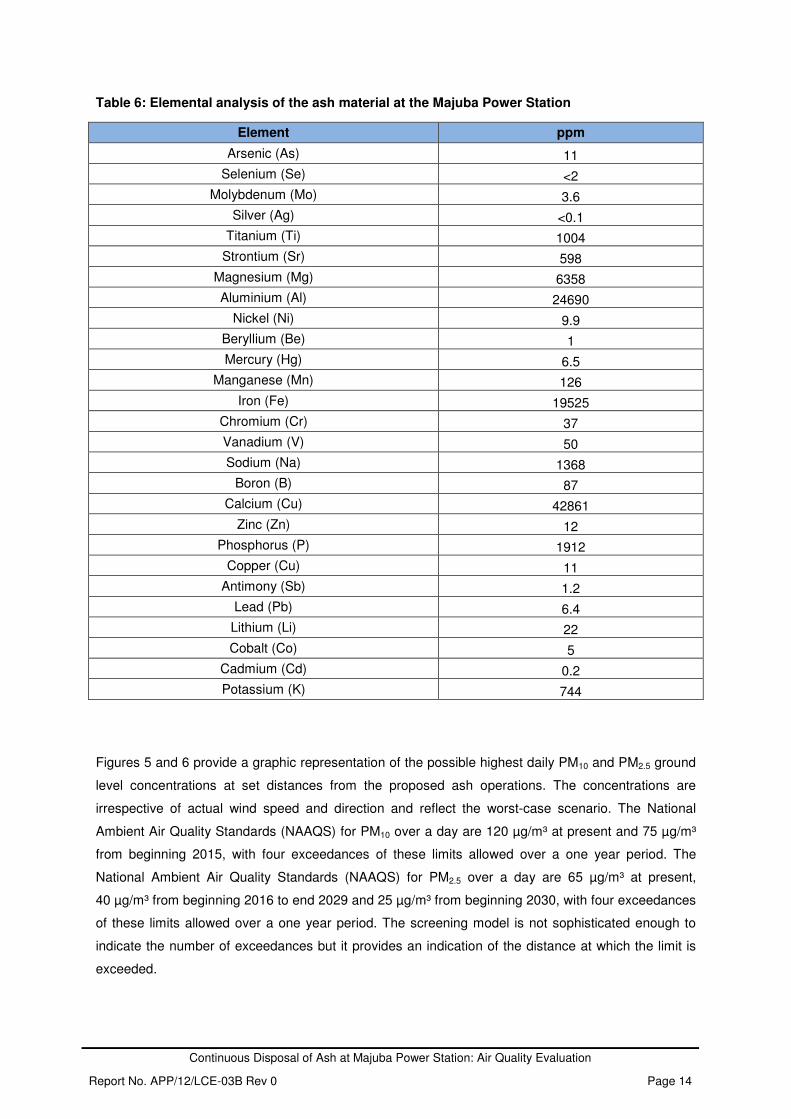
Table 6: Elemental analysis of the ash material at the Majuba Power Station
Element ppm
Arsenic (As) 11
Selenium (Se) <2
Molybdenum (Mo) 3.6
Silver (Ag) <0.1
Titanium (Ti) 1004
Strontium (Sr) 598
Magnesium (Mg) 6358
Aluminium (Al) 24690
Nickel (Ni) 9.9
Beryllium (Be) 1
Mercury (Hg) 6.5
Manganese (Mn) 126
Iron (Fe) 19525
Chromium (Cr) 37
Vanadium (V) 50
Sodium (Na) 1368
Boron (B) 87
Calcium (Cu) 42861
Zinc (Zn) 12
Phosphorus (P) 1912
Copper (Cu) 11
Antimony (Sb) 1.2
Lead (Pb) 6.4
Lithium (Li) 22
Cobalt (Co) 5
Cadmium (Cd) 0.2
Potassium (K) 744
Figures 5 and 6 provide a graphic representation of the possible highest daily PM10 and PM2.5 ground
level concentrations at set distances from the proposed ash operations. The concentrations are
irrespective of actual wind speed and direction and reflect the worst-case scenario. The National
Ambient Air Quality Standards (NAAQS) for PM10 over a day are 120 µg/m³ at present and 75 µg/m³
from beginning 2015, with four exceedances of these limits allowed over a one year period. The
National Ambient Air Quality Standards (NAAQS) for PM2.5 over a day are 65 µg/m³ at present,
40 µg/m³ from beginning 2016 to end 2029 and 25 µg/m³ from beginning 2030, with four exceedances
of these limits allowed over a one year period. The screening model is not sophisticated enough to
indicate the number of exceedances but it provides an indication of the distance at which the limit is
exceeded.

Continuous Disposal of Ash
Report No. APP/12/LCE-03B Rev 0
With no mitigation in place, the 2015
windblown dust from the progressing
Pollution Inventory (NPI) wind erosion can be reduced by 50% through water sprays and up to 30%
by installing wind breaks. With water sprays en
dust will be below the NAAQS limit of 75 µg/m³ at a distance of
Figure 5: Estimated highest daily PM
emission source with and without mitigation
Continuous Disposal of Ash at Majuba Power Station: Air Quality Evaluation
With no mitigation in place, the 2015 PM10 limit of 75 µg/m³ will be exceeded
progressing ash disposal facility only. According to the Australian National
erosion can be reduced by 50% through water sprays and up to 30%
by installing wind breaks. With water sprays ensuring 50% reduction from wind erosion, windblown
dust will be below the NAAQS limit of 75 µg/m³ at a distance of ~200 m from the source.
Estimated highest daily PM10 ground level concentrations at set distances from the
emission source with and without mitigation
Power Station: Air Quality Evaluation
Page 15
exceeded within 500 m due to
According to the Australian National
erosion can be reduced by 50% through water sprays and up to 30%
uring 50% reduction from wind erosion, windblown
from the source.
ground level concentrations at set distances from the
Continuous Disposal of Ash
Report No. APP/12/LCE-03B Rev 0
Figure 6: Estimated highest daily PM
emission source, with and without mitigation
Continuous Disposal of Ash at Majuba Power Station: Air Quality Evaluation
Estimated highest daily PM2.5 ground level concentrations at set distances from the
emission source, with and without mitigation
Power Station: Air Quality Evaluation
Page 16
t set distances from the
Continuous Disposal of Ash at Majuba Power Station: Air Quality Evaluation
Report No. APP/12/LCE-03B Rev 0 Page 17
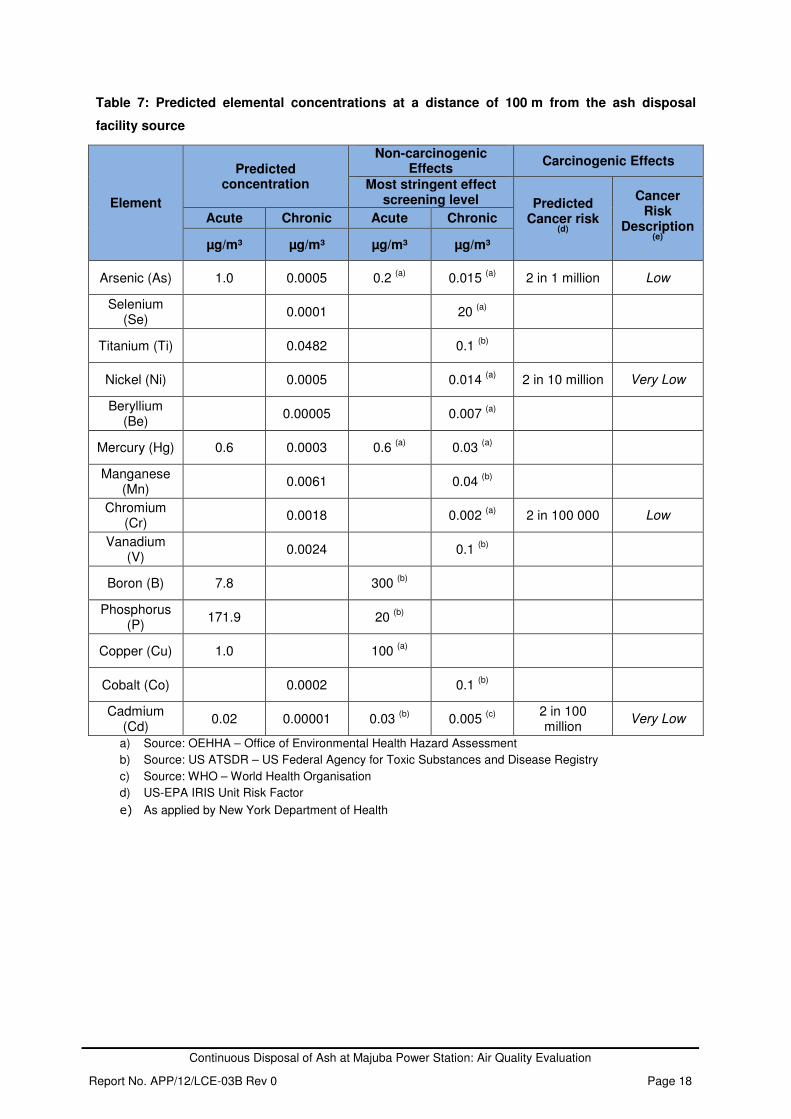
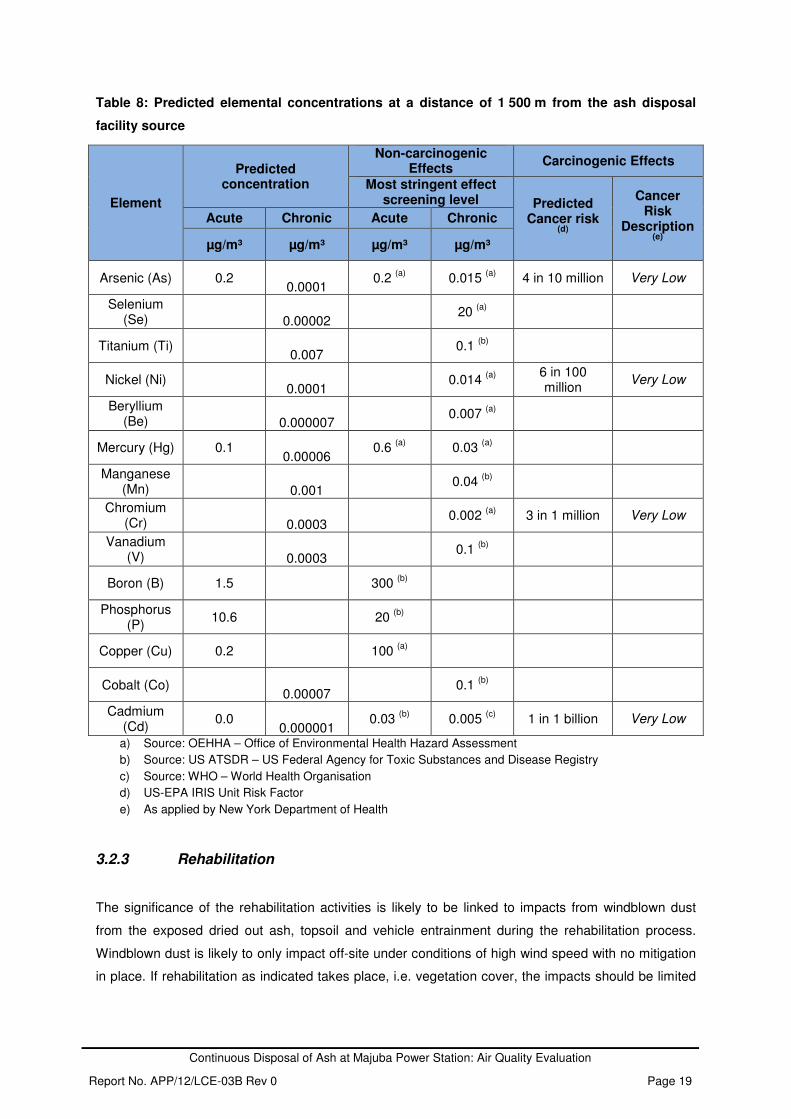
Table 7 and Table 8 provide the predicted elemental concentration due to proposed operations for
which health effect screening levels are available. The elemental concentrations ~100 m from the ash
disposal facility are predicted to exceed the most stringent effect screening levels (non-carcinogenic
effects) for acute exposure to arsenic, mercury, and phosphorus (Table 6). It is unlikely that, even at
the full extent of the ash disposal facility, human settlements will occur within this buffer. At a distance
of 1 500 m from the ash disposal facility, the elemental concentrations due to proposed operations are
predicted to be within all effect screening levels for non-carcinogenic effects (Table 7). From aerial
photography (Google Earth 2009 image) at least one farmstead occurs within 1 500 m from the ash
disposal facility at the full extent. However, with effective application of water sprayers, the distance at
which impacts are within effect screening levels is ~600 m away from the source. Therefore the
predicted cancer risk, due to windblown elements from the ash disposal facility, is predicted to be low
to very low.
Continuous Disposal of Ash at Majuba Power Station: Air Quality Evaluation
Report No. APP/12/LCE-03B Rev 0 Page 18
Table 7: Predicted elemental concentrations at a distance of 100 m from the ash disposal
facility source
Element
Predicted concentration
Non-carcinogenic Effects
Carcinogenic Effects
Most stringent effect screening level Predicted
Cancer risk (d)
Cancer Risk
Description (e)
Acute Chronic Acute Chronic
µg/m³ µg/m³ µg/m³ µg/m³
Arsenic (As) 1.0 0.0005 0.2 (a)
0.015 (a)
2 in 1 million Low
Selenium (Se)
0.0001
20 (a)
Titanium (Ti) 0.0482
0.1 (b)
Nickel (Ni) 0.0005
0.014 (a)
2 in 10 million Very Low
Beryllium (Be)
0.00005
0.007 (a)
Mercury (Hg) 0.6 0.0003 0.6 (a)
0.03 (a)
Manganese (Mn)
0.0061
0.04 (b)
Chromium (Cr)
0.0018
0.002 (a)
2 in 100 000 Low
Vanadium (V)
0.0024
0.1 (b)
Boron (B) 7.8 300 (b)
Phosphorus (P)
171.9 20 (b)
Copper (Cu) 1.0 100 (a)
Cobalt (Co) 0.0002
0.1 (b)
Cadmium (Cd)
0.02 0.00001 0.03 (b)
0.005 (c)
2 in 100 million
Very Low
a) Source: OEHHA – Office of Environmental Health Hazard Assessment
b) Source: US ATSDR – US Federal Agency for Toxic Substances and Disease Registry
c) Source: WHO – World Health Organisation
d) US-EPA IRIS Unit Risk Factor
e) As applied by New York Department of Health
Continuous Disposal of Ash at Majuba Power Station: Air Quality Evaluation
Report No. APP/12/LCE-03B Rev 0 Page 19
Table 8: Predicted elemental concentrations at a distance of 1 500 m from the ash disposal
facility source
Element
Predicted concentration
Non-carcinogenic Effects
Carcinogenic Effects
Most stringent effect screening level Predicted
Cancer risk (d)
Cancer Risk
Description (e)
Acute Chronic Acute Chronic
µg/m³ µg/m³ µg/m³ µg/m³
Arsenic (As) 0.2 0.0001
0.2 (a)
0.015 (a)
4 in 10 million Very Low
Selenium (Se)
0.00002
20 (a)
Titanium (Ti) 0.007
0.1 (b)
Nickel (Ni) 0.0001
0.014 (a)
6 in 100 million
Very Low
Beryllium (Be)
0.000007
0.007 (a)
Mercury (Hg) 0.1 0.00006
0.6 (a)
0.03 (a)
Manganese (Mn)
0.001
0.04 (b)
Chromium (Cr)
0.0003
0.002 (a)
3 in 1 million Very Low
Vanadium (V)
0.0003
0.1 (b)
Boron (B) 1.5
300 (b)
Phosphorus (P)
10.6
20 (b)
Copper (Cu) 0.2
100 (a)
Cobalt (Co) 0.00007
0.1 (b)
Cadmium (Cd)
0.0 0.000001
0.03 (b)
0.005 (c)
1 in 1 billion Very Low
a) Source: OEHHA – Office of Environmental Health Hazard Assessment
b) Source: US ATSDR – US Federal Agency for Toxic Substances and Disease Registry
c) Source: WHO – World Health Organisation
d) US-EPA IRIS Unit Risk Factor
e) As applied by New York Department of Health
3.2.3 Rehabilitation
The significance of the rehabilitation activities is likely to be linked to impacts from windblown dust
from the exposed dried out ash, topsoil and vehicle entrainment during the rehabilitation process.
Windblown dust is likely to only impact off-site under conditions of high wind speed with no mitigation
in place. If rehabilitation as indicated takes place, i.e. vegetation cover, the impacts should be limited

Continuous Disposal of Ash at Majuba Power Station: Air Quality Evaluation
Report No. APP/12/LCE-03B Rev 0 Page 20
to be within the site boundary. As vegetation cover increases, the potential for wind erosion will
decrease.
3.3 Dust Management Plan
Based on the qualitative evaluation of the proposed operations, management objectives are
considered as summarised in Table 9 to Table 11.
Continuous Disposal of Ash at Majuba Power Station: Air Quality Evaluation
Report No. APP/12/LCE-03A Rev 0 Page 21
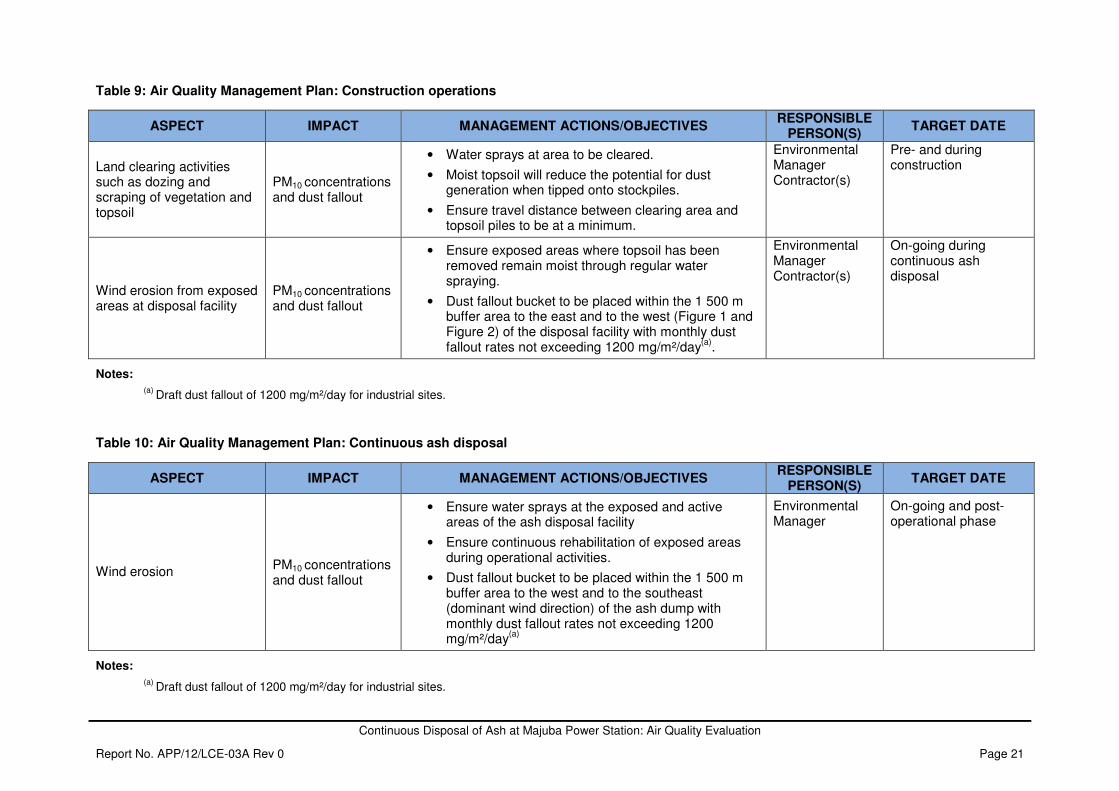
Table 9: Air Quality Management Plan: Construction operations
ASPECT IMPACT MANAGEMENT ACTIONS/OBJECTIVES RESPONSIBLE
PERSON(S) TARGET DATE
Land clearing activities such as dozing and scraping of vegetation and topsoil
PM10 concentrations and dust fallout
• Water sprays at area to be cleared.
• Moist topsoil will reduce the potential for dust generation when tipped onto stockpiles.
• Ensure travel distance between clearing area and topsoil piles to be at a minimum.
Environmental Manager Contractor(s)
Pre- and during construction
Wind erosion from exposed areas at disposal facility
PM10 concentrations and dust fallout
• Ensure exposed areas where topsoil has been removed remain moist through regular water spraying.
• Dust fallout bucket to be placed within the 1 500 m buffer area to the east and to the west (Figure 1 and Figure 2) of the disposal facility with monthly dust fallout rates not exceeding 1200 mg/m²/day
(a).
Environmental Manager Contractor(s)
On-going during continuous ash disposal
Notes:
(a)
Draft dust fallout of 1200 mg/m²/day for industrial sites.
Table 10: Air Quality Management Plan: Continuous ash disposal
ASPECT IMPACT MANAGEMENT ACTIONS/OBJECTIVES RESPONSIBLE
PERSON(S) TARGET DATE
Wind erosion PM10 concentrations and dust fallout
• Ensure water sprays at the exposed and active areas of the ash disposal facility
• Ensure continuous rehabilitation of exposed areas during operational activities.
• Dust fallout bucket to be placed within the 1 500 m buffer area to the west and to the southeast (dominant wind direction) of the ash dump with monthly dust fallout rates not exceeding 1200 mg/m²/day
(a)
Environmental Manager
On-going and post-operational phase
Notes:
(a)
Draft dust fallout of 1200 mg/m²/day for industrial sites.
Continuous Disposal of Ash at Majuba Power Station: Air Quality Evaluation
Report No. APP/12/LCE-03A Rev 0 Page 22
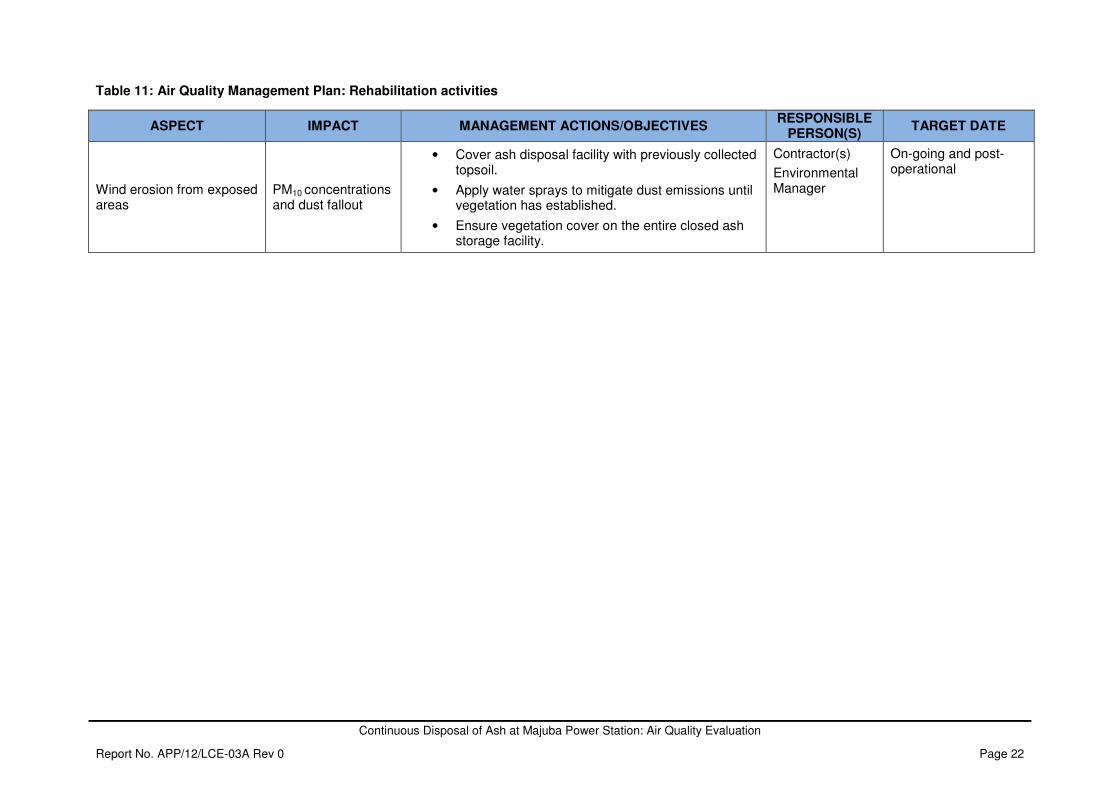
Table 11: Air Quality Management Plan: Rehabilitation activities
ASPECT IMPACT MANAGEMENT ACTIONS/OBJECTIVES RESPONSIBLE
PERSON(S) TARGET DATE
Wind erosion from exposed areas
PM10 concentrations and dust fallout
• Cover ash disposal facility with previously collected topsoil.
• Apply water sprays to mitigate dust emissions until vegetation has established.
• Ensure vegetation cover on the entire closed ash storage facility.
Contractor(s)
Environmental Manager
On-going and post-operational
Continuous Disposal of Ash at Majuba Power Station: Air Quality Evaluation
Report No. APP/12/LCE-03A Rev 0 Page 23
4 Conclusion
As a result of the activities associated with ash disposal, PM10 concentrations are likely to exceed the
NAAQS 2015 limit of 75 µg/m³ within ~500 m of the source. PM2.5 concentrations are likely to exceed
the NAAQS 2030 limit of 25 µg/m³ within ~200 m of the source. The predicted elemental
concentrations from the windblown ash material are predicted to exceed the most stringent effect
screening levels up to a distance of 1 500 m from the source. With water sprays in place and once
vegetation is established, these impacts will reduce significantly. The potential for impacts at the
sensitive receptors will also depend on the wind direction and speed, which could not be accounted
for in this assessment.
In conclusion, if unmitigated, windblown dust from the ash disposal facility may result in exceedances
of effect screening levels up to a distance of ~1 500 m from the source with exceedances of PM10
NAAQ limits up to a distance of 500 m. This applies to the current and proposed future ash disposal
facility operations since the “active” area should essentially remain the same irrespective of the total
footprint of the ash disposal facility.
4.1 Recommendation
It is recommended that mitigation measures at the ash disposal facility continue and even be
improved, where possible, to ensure impacts on the surrounding area remain minimal. Fugitive dust
can easily be mitigated and it is recommended that the dust management measures as stipulated in
Tables 8, 9 and 10 be applied to ensure the proposed activities have an insignificant impact on the
surrounding environment and human health.
It is also recommended that single dust fallout buckets be installed downwind of the ash disposal
facility in order to monitor the impacts from this source.
The following should be considered during the EIA phase:
• Quantitative impact assessment of potential impacts from the proposed expanded
ash disposal facility including:
o calculation of dust emissions resulting from the current and proposed ash
disposal facility;
o simulation of dust emissions applying a Gaussian plume dispersion model
such as AERMOD;
o Evaluation of potential impacts of PM10, PM2.5 and dust fallout rates on the
surrounding environment and human health. This will include compliance
evaluation against the NAAQS and proposed dust fallout limits and health
screening for non-carcinogenic and carcinogenic effects; and
Continuous Disposal of Ash at Majuba Power Station: Air Quality Evaluation
Report No. APP/12/LCE-03A Rev 0 Page 24
o Recommendations on mitigation measures and expansion of the current
monitoring network (if needed).
• Confirmation of the location of human settlements within the 1 500 m buffer of the full
extent of the ash disposal facility. These will be included in the assessment as
receptor points.

Continuous Disposal of Ash at Majuba Power Station: Air Quality Evaluation
Report No. APP/12/LCE-03A Rev 0 Page 25
5 References
AEPA, 2007: Guidelines for Separation Distances. Australian Environmental Protection Agency,
December 2007.
Burger LW (1994). Ash Dump Dispersion Modeling, in Held G: Modeling of Blow-Off Dust From Ash
Dumps, Eskom Report TRR/S94/185, Cleveland, 40 pp.
Cowherd, C., and Englehart, J.; 1984: Paved Road Particulate Emissions, EPA-600/7-84-077, US
Environmental Protection Agency, Cincinnati, OH.
EPA, 1995: Compilation of Air Pollution Emission Factors (AP-42) 6th edition, Volume 1, as contained
in the AirCHIEF (AIR cleaninghouse for inventories and Emission Factors) CD-ROM (compact disk
read only), US Environmental Protection Agency, Research Triangle Park, North Carolina.
Godish, R., 1990: Air Quality, Lewis Publishers, Michigan, 422 pp.
Goldreich, Y. and P.D. Tyson, 1988: Diurnal and Inter-Diurnal Variations in Large-Scale
Atmospheric Turbulence over Southern Africa. South African Geographical Journal, 70(1), 48-56.
NPI, 2001. Emissions Estimation Technique Manual for Mining. Version 2.3. National Pollutant
Inventory (NPI), Environment Australia, 5 December 2001.
Oke, T.T., 1990: Boundary Layer Climates, Routledge, London and New York, 435 pp.
Pasquill F and Smith FB, 1983: Atmospheric Diffusion: Study of the Dispersion of Windborne
Material from Industrial and Other Sources, Ellis Horwood Ltd, Chichester, 437 pp.
Preston-Whyte, R.A. and P.D. Tyson, 1989: The Atmosphere and Weather of Southern Africa,
Oxford University Press, Cape Town.
Shao, Y., 2008: Physics ad Modelling of Wind Erosion. Atmospheric and Oceanographic Science
Library, 2nd
Revised and Expanded Edition, Springer Science.
Shaw RW and Munn RE, 1971: Air Pollution Meteorology, in BM McCormac (Ed), Introduction to the
Scientific Study of Air Pollution, Reidel Publishing Company, Dordrecht-Holland, 53-96.