Embed Size (px)
Citation preview

CONTINUOS SOUND ANALYSIS IN URBAN ENVIRONMENTS SUPPORTED BY FIWARE PLATFORM
Joel Preto Paulo1,2,4, Pedro Fazenda1,3,4, Tiago Oliveira1,3,4, João Casaleiro1,3,4
1Instituto Superior de Engenharia de Lisboa – ISEL, Lisboa, Portugal, [email protected]
[email protected] [email protected] [email protected]
2CAPS - Instituto Superior Técnico, TULisbon, Lisboa, Portugal,
3ETConcept Engenharia de Sistemas, Lda., Loures, Portugal, 4CEDET – ISEL, Lisboa, Portugal,
Abstract Acoustic maps represent an essential element of acoustic expertise and acoustic studies, which involve: planning of urban areas, spatial development plans, vehicle speed limits, rational management of noise emissions, etc. The emerging Internet-of-Things applied to Smart Cities concept can be utilized effectively for managing urban environments since it offers ubiquitous sensing and actuation. The acoustic sensors network is a mean of delivering in real time specific sound features capable of determining the location of sound sources for security and surveillance purposes or just giving tools and mechanisms for control the road traffic in order to maintain the maximum noise allowed in urban areas. The FI-Sonic project consists of developing the necessary low-cost technology to capture sound, using both pressure microphones devices, to integrate existing frameworks in city environments. The project also includes processing this information with intelligent audio analytics, useful to update noise maps and identify and localize a set of different sound events. Localizing sound sources is of vital importance, and applications range from localizing sniper fire in urban scenarios and people in-distress. All this information is used to create quasi-real-time dynamic noise and event maps. The EU is endorsing a set of tools for the IT called FIWARE. The adoption of FIWARE technologies by several stakeholders, such as cites, security forces, will facilitate the integration of FI-Sonic products with the available IT infrastructures.
Keywords: Noise maps, Sound analytics, Internet-of-Things, sound source localization and event identification, FIWARE platform.
PACS no. 43.50.Rq, 43.50.Yw, 43.60.Fg, 43.60.Jn, 43.60.Lq
1 Introduction
Modern cities, especially in Europe, are faced with challenges of greater complexity but also of increased possibilities to offer, manage, monitor and integrate pro-active solutions to their population to promote a better quality of life for all citizens living and working in there. As infrastructures, systems, platforms and tools are going through faster and disruptive innovation processes that promote new communication protocols, deliver better outputs on existing technological frameworks, support greater

EuroRegio2016, June 13-15, Porto, Portugal
2
interconnectivity between citizens and their local stakeholders and erupt a broader and wider range and scope of problems and opportunities. Solutions like the Internet-of-Things remote sensor networks, Big Data analytical tools and more friendly user APPS using APIs and open-source platforms help us provide insights, patterns and trends on how we live, work and evolve as individuals and also as communities. These societal and environmental challenges that emerged within this new mindset stress out that the way in which we perceive data and information, how we capture and integrate it in complex IT solutions is going through a revolution where the level of interaction enhances the level of integration and optimization among all actors in civic life and their technological attachments. We become suppliers and receivers of large amounts of raw data and unfiltered strains of information that need to be analyzed, measured, categorized, assembled, integrated and delivered to intermediate and/or final users, as well as to final outputs that could be reached through artificial intelligence makes this an incredible task to deal with, especially within solutions that are offered through smart cities systems to niche or global communities. Despite substantial improvements in recent decades, environmental health challenges remain considerable to noise pollution, where new health issues are emerging. These are associated with long-term environmental and socio-economic trends, lifestyle and technologies changes. Furthermore, the unequal distribution of environmental and socio-economic conditions contributes to pervasive health inequalities [1]. The Environmental Noise Directive 2002/49/EC compliance to noise exposure, measurement levels and strategic actions requires EU Member States to undertake noise mapping (producing results in terms of common indicators) and to prepare action plans based on the noise maps. These action plans also aim to protect urban quiet areas against an increase in noise. Environmental noise is not only a source of annoyance; it has been linked with increased risk of cardiovascular diseases, including heart attack and stroke. Most recently, exposure to environmental noise has been estimated to contribute around 10 000 cases of premature deaths due to coronary heart disease and stroke each year, with almost 90% of the noise-related health impacts being associated with road traffic noise [2-4]. Having this to account, sound is still a somewhat unexplored environmental measure that hasn’t been greatly integrated in IT solutions because of the lack of efficient hardware, technical support, expert background platforms and tools. There is a vast opportunity to explore new dimensions and interactions in urban environments so the FI-Sonic concept embraces a hardware solution that could work in stand alone mode or be integrated with other smart cities solutions to capture, identify, analyze and provide relevant information to decision makers, urban planners and/or other public or private entities that could profit from this approach which deals with sound measure.
2 The FI-Sonic concept
The main goal of this project is to build a scalable and upgradable monitoring system to analyze the city soundscape in continuous in order to measure sound and identify, triangulate and detect sound events. The integrated solution provides municipalities with the necessary guidelines and tools to assist in the decision making process that will create action plans to improve the quality of life of the city population. FI-Sonic have the necessary robust hardware to support the network of 3D sound capturing nodes, as shown in Figure 1.

EuroRegio2016, June 13-15, Porto, Portugal
Figure 1 – Demonstration of a FI-SONIC S3 network working on urban environments, on a road
traffic application in this case.
As a stand-alone system, sound solutions to measure noise levels usually don’t use an integrated approach with hardware and software solutions to locate and identify sound sources based on events, integrate that information into open-source platforms and identify noise inputs and transform it to intelligible data for further applications. FI-Sonic works with the concept of ambisonics microphones, complying also with the standards for class 1 sound level meters. This allows a basic noise measurement that could be used for strategic noise maps and plans to deal with abnormal levels. Additionally, features like advanced event triggering, sound monitoring, directional virtual microphone, sound source location & identification, audio analytic reports and dynamic event maps by a system enabled with FIWARE, Future Internet platform are provided. Moreover, FI-Sonic can be combined with other sensors, such as air quality, and all the data collected to supply new layers and greater depth to all the analytical information provided to decision makers, stakeholders and citizens in general.
2.1 The choice of FIWARE
FIWARE is the enabling platform that provides us with the necessary set of APIs to deploy and interconnect our audio network services with other stakeholders in the Smart City ecosystem. A widespread community supports FIWARE, it includes open source tools, standards, examples and documentation. It is designed with global ambition in mind, and the adoption of FIWARE technology by different ICT players seems very promising for our company because it minimizes the development costs and time-to-market. FIWARE helps to leverage technology risk management and provides strategic business value. Widespread adoption of FIWARE reduces the time required for us to integrate our audio capturing hardware and services to the different systems used by different customers. The level of interoperability that FIWARE provides, for small business solutions, would be virtually impossible for small companies to accomplish by themselves. Without FIRWARE, limitations in widespread community access to many ICT infrastructures, and the proliferation of closed or restricted proprietary solutions would create crippling barriers for small businesses to operate in the IoT and Smart City ICT market. Therefore, FIWARE fits perfectly to our business project.
2.2 Benefits and accomplishments
FI-Sonic provides a state-of-the art technology solution to support all audio processing requirements for future Smart Cities. This project is quite broad in the sense that it uses the sound to extract the relevant information about the life in the city. In fact, in addition to dealing with matters relating to environmental noise monitoring, supported usually by the EU regulations, Fi-Sonic also provides information on

EuroRegio2016, June 13-15, Porto, Portugal
4
location and identification of sound sources. The latter issues pave the way for an endless amount of possible disruptive new approaches on the governance of a city. For instance, using artificial intelligence in the city CCTV surveillance control rooms with accurate matching of video and sound utilizing oculus rift and auralization to enable faster tracking on the crucial events. Considering the amount of potential applications that FI-Sonic technology has for urban areas, we believe that the growth perspectives of this project are very promising, allowing us to be very optimistic about the results of our market plan. Therefore, we are planning to launch in 2016 the FI-Sonic startup company focused on audio and acoustic engineering. The architecture of the FI-Sonic sound acquisition module is composed by a set of microphones, a multichannel acquisition card, the main processing unit, and the network interface, as shown in Figure 2.
Figure 2 - Smart Sound Station, S3, internal architecture.
2.3 Smart Sound Station Unit, S3, Software Modules
The FI-Sonic sound acquisition module software is programmed using C++ language, for better performance of the signal processing algorithms, with the application running on the Yocto Linux operation system. For the sake of system modularity, the audio acquisition software uses the ALSA to be able to support different audio interfaces. To enable the usage of a custom-built multichannel acquisition card we setup and configure ALSA. Using the ALSA Library API we are acquiring several audio channels connected to the microphone array. We also have simple feature extraction algorithms to generate relevant events. The acquired information will be provided to all the stakeholders via the FIWARE platform. On the FIWARE development all the basic elements are implemented considering the most probable scenario where FI-Sonic acquisition modules are deployed with constricted communication capacity, the sound acquired by the microphones is analysed and features are extracted from the audio into a vector containing several data element attributes (<name>, <type>, <value>). This vector corresponds to context information that is periodically produced and sent to Orion Context Broker (CB) Generic Enabler (GE), based on FIWARE OMA NGSI 10 interface, a RESTful API via HTTP. This audio feature information is then distributed by the CB to different subscribing applications as shown in Figure 7. For that purpose, a number of sound parameters related with the environmental noise measures, based on the international standards and others suggested by us, were chosen for better representation of sound evolution with time and formatted according the NGSI interface (Next Generation Service Interface). This approach follows the tendency of the evolution of the Open Agile Smart Cities concept, OASC. Considering S3 units have to give information about environment noise the acoustical parameters are measured and estimated from sound and sent to the remote central processing room continuously. A list of those parameters are shown:
• LAeq,T – Equivalent Continuous Sound Pressure Level • LAFmax - max sound pressure level, Fast, A-weighted

EuroRegio2016, June 13-15, Porto, Portugal
• LFmax - max sound pressure level, Fast, no weighted • LAFmin - min sound pressure level, Fast, A-weighted • LFmin - min sound pressure level, Fast, no weighted • LCPeak - peak sound pressure level, C-weighted • SEL (LAE) – Sound Exposure Level, Slow, A-weighted • Sound Exposure (SEL linear) • By Frequency Bands (1/1 octave, 1/3 octave), no weighted • Loudness-based Sound Levels • Loudness Metric • Psychoacoustic Metrics
Additionally, some auxiliary parameters of S3 unit are sent to the remote central processing room, • Time label • Time Analysis Length • Mic ID • Geolocation • Direction • Calibration data (Sensitivity) • Height • Temperature
The schematic depicted in Figure 9 is described as follows: The Smart Sound Station buffers the sound parameters (noise levels and sound events) and reports the aggregated results periodically to an Orion server, which can only be accessed within an https authenticated channel (using OAuth2 and a station KeyRock instance), enforced by a PEP-Proxy Wilma instance. The results are taken every second, so reporting them every time would clog our network interface and server. Our Orion instance only have one subscriber: a Cygnus instance using MySQL as the database engine, in which every station report will be stored. For this task we created a custom Cygnus sink to put the information as we need in order to maximize system performance in database queries and database size. There is a Wirecloud widget to visualize the station reports history, able to show the several results provided by the S3 units in a continuous or in aggregated way (e.g. peak levels aggregated by day). The interface between this widget and data is being done on a WebService. The station entity is composed by the following attributes shown in Table 1.
Table 1 – Attributes of Smart Sound Station, S3 Name Type Description type SmartSoundStation, S3 NGSI entity type position coordinates Station location cal_data float Calibration chart, sensitivity height float Station height from the ground (in metres) dir float Station direction (0 represents North, 90 East,
...) report StationReport Station report (more details below) The station report attribute is an array of results taken by several sampling periods. Using this organization allows us to aggregate data before it leaves the station (if needed) and also adding more attributes in the future without changing the field structure, which is mandatory for scalability and upgradability of the system. Every element of the array has: (i) Timestamp: the moment when the first sample was taken (station time), measured in milliseconds since 1 of January of 1970; (ii) Period (in ms): the sampling period (time constant) of those results; (iii) Fields: an array with the name of the fields; (iv) Values: a bi-dimensional array with the results taken. The image example on the right shows a report of 2 samples of LAFmax and LCpeak (sampled at 125ms) and 2 samples of SEL (sampled at 1s). In a real case scenario there will be more attributes and thousands of samples in one request. This basic architecture allows FI-Sonic to distribute context information periodically, according to a predefined time rate. This is used to distribute and store important audio features such as the sound levels and events at a given location over time.

EuroRegio2016, June 13-15, Porto, Portugal
6
The sound measures produced by the S3 units correspond essentially to the ones used on a class 1 Sound Level Meter available on the market. Therefore, the S3 can be used as an equipment for acoustical environment measurements, as a stand alone equipment. Additionally, other measures are included in the list of parameters, namely, Loudness and Psychoacoustic Metrics. Regarding Loudness, the equal loudness-level contours as a dynamic filter that changes with both sound level and frequency instead of using the normative sound measures based on Z, A or C weighting filters is used as an alternative. Although in the current version of the S3, base version, only the measures shown above are implemented, spectral balance (dull, sharp, metallic), fluctuation (unsteady, varying), tones (hum, screech), roughness (rough, smooth) and impulsiveness (startling, sudden) features could be evaluated. Nevertheless, performance issues of S3 signal processing should be analyzed in advance. Those analyses could always be implemented remotely, on the server side, in case of raw data is transmitted. The noise levels, the parameters discussed above, over an area will be varying all the time. For example, noise levels may rise as a vehicle approaches, and reduce again after it has passed. This would cause short-term variations in sound levels. In the slightly longer term, noise levels may be higher in peak periods when the roads are busy, and lower in off-peak periods. Then again, there is a greater volume of activity from more people and traffic in the day-time than in the evening or at night. In the longer term, wind, weather and season all affect noise levels. For these and other reasons, noise mapping is usually done by calculation based on a computerized noise model of an area and certain periods of the day, namely:
• Ld– Sound Pressure Level for day period (7:00h to 20:00h), LAeq,d • Le – Sound Pressure Level for evening period (20:00h to 23:00h), LAeq,e • Ln – Sound Pressure Level for night period (23:00h to 7:00h), LAeq,n • Lden – sound pressure level weighting A day-evening-night
Fi-Sonic makes these all calculations using data already stored in the database on the server, applying the appropriated queries. Other analysis are produced and shown on charts, namely:
• Histograms for LAeq,T , LFmin, LFmax, LCPeak (per minute or multiples, hour, day, month, year periods)
• Histograms for statistics levels measures – L10, L50, L95 percentile levels (per minute or multiples, hour, day, month, year periods)
• Max(LAeq,T) - Max(LAeq,TLd), Max(LAeq,TLe), Max(LAeq,TLn), Max(LAeq,TLden) • Max(LAFmax) • Max(LFmax) • Min(LFmax) • Quietness Suitability Index (QSI)
EuroRegio2016, June 13-15, Porto, Portugal
Figure 3 - Audio Context Production and Application Subscription via Orion server.
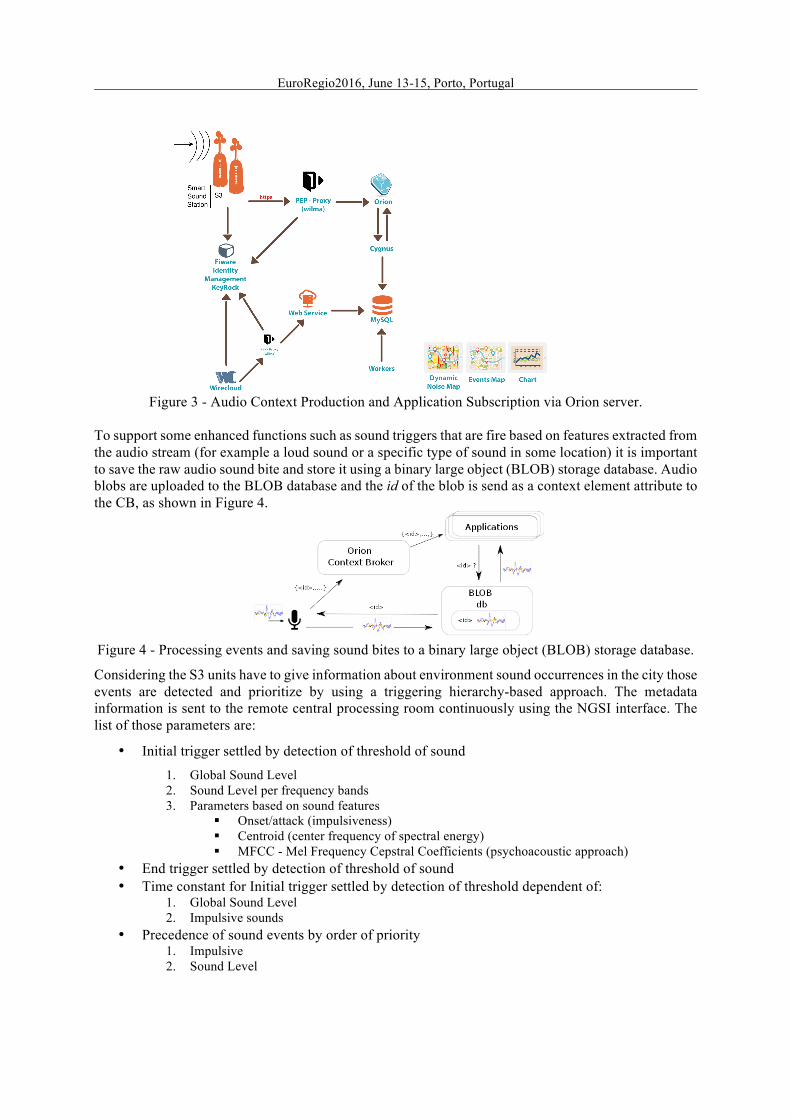
To support some enhanced functions such as sound triggers that are fire based on features extracted from the audio stream (for example a loud sound or a specific type of sound in some location) it is important to save the raw audio sound bite and store it using a binary large object (BLOB) storage database. Audio blobs are uploaded to the BLOB database and the id of the blob is send as a context element attribute to the CB, as shown in Figure 4.
Figure 4 - Processing events and saving sound bites to a binary large object (BLOB) storage database.
Considering the S3 units have to give information about environment sound occurrences in the city those events are detected and prioritize by using a triggering hierarchy-based approach. The metadata information is sent to the remote central processing room continuously using the NGSI interface. The list of those parameters are:
• Initial trigger settled by detection of threshold of sound
1. Global Sound Level 2. Sound Level per frequency bands 3. Parameters based on sound features
§ Onset/attack (impulsiveness) § Centroid (center frequency of spectral energy) § MFCC - Mel Frequency Cepstral Coefficients (psychoacoustic approach)
• End trigger settled by detection of threshold of sound • Time constant for Initial trigger settled by detection of threshold dependent of:
1. Global Sound Level 2. Impulsive sounds
• Precedence of sound events by order of priority 1. Impulsive 2. Sound Level

EuroRegio2016, June 13-15, Porto, Portugal
8
As shown, an event can be fired by different considerations, giving more weight for impulsive sounds (this is because this type of sounds refers usually to danger situations, such as fire arms or traffic accidents). In order to assure the best performance, maintenance interventions and considering a system to work in outdoor conditions, a number of other specifications have to apply, such as:
• Automatic calibration of microphones • Wind information (under developement) • Wind Direction information (under developement) • Fully waterproof body • Integrated Wi-Fi/3G modem for remote operation and automatic data retrieval • Integrated GPS antenna for synchronization between sound stations • Battery with operating time of 10 hours for simplified installation (more autonomy with other
batteries) • Memory card of 2 to 128 GB for almost limitless storage.
3 Pilot installations
At the time this article was written, a number of Smart Sound Stations, S3, units are installed and working in campus of ISEL. This first installation allowed us to obtain results to validate the operation of the system in a real environment. Thus, hardware and software modules for the acquisition and signal conditioning, calibration of the parties related with the acoustic/electric transduction, calculation algorithms of sound levels and via wireless communications (WiFi or 3G) were verified and validated. Putting the equipment working in outdoors was a challenging task due to the possible adverse weather conditions, thus, one should take care with the wind flows protectors, water proofing sealing and temperature variations control. Figure 5 show images of the phases of installing and configuration of the S3 unit.
Figure 5 - Installation procedures of the Smart Sound Station, S3 unit, at the campus of ISEL.
Figure 6 shows the locations for the S3 units inside the campus of ISEL.
Figure 6 - Location of the Smart Sound Station, S3 units, at the campus of ISEL.

EuroRegio2016, June 13-15, Porto, Portugal
3.1 Reports and information to the management team services and to the population
Results of the analysis performed to environment sound in urban areas are shown through a number of charts representing different perspectives. Figure 7 shows the results for three sound level measures (LAE, LAFmax and LFmin) and selected by the user, for a range of time. This data is provided directly by the S3 units and stored in the database MySQL (these sound parameters are processing in S3 unit).
Figure 7 - Frontend chart to show the different sound levels measures.
Similar charts are used to show the results of queries applied to the database MySQL for the analyses: Ld, Le, Ln, Lden, and histograms for LAeq,T , LFmin, LFmax, LCPeak, L10, L50, L95, Max(LAeq,T), Max(LAeq,TLd), Max(LAeq,TLe), Max(LAeq,TLn), Max(LAeq,TLden) and Quietness Suitability Index (QSI). This way, one can easily make comparisons and assessments the results of the noise maps that the municipalities are obligated to produce, under the END directive issued by the Union Community.
4 Conclusions and Final Remarks
A platform to measure noise levels in continuous and analyse sound events for location and identification purposes is presented. We are planning to build a Database of sound events synchronized with video to link with some other topics and information, namely, Immersive Audio, 3D Audio/Video Library. For this purpose, a 360 video camera incorporating the 3D microphone ambisonic is being designed to be developed and placed in production in a near future. This device will provide a significant sound and video material to be used in the context sound analysis modules for the purpose of better performance the location and identification tasks. With respect to CCTV systems for public safety in cities or private security, complex network connections and extensive Control Room and Emergency Planning Suite are usually find. So, which would be required are a large number of video monitors to cover the entire protected area. Thus, a need exists to develop systems that use machine learning algorithms that can provide quick and accurate indications to the operator to improve efficiency. At this time, video surveillance systems use the image taken by the cameras as most important information on the detection and prevention of any disruption of public safety by placing the information in the sound into the background. This relates to practical reasons because it was not desirable to be listening while the sound of each video camera, but also

EuroRegio2016, June 13-15, Porto, Portugal
10
because there are no effective methods for separating/filtering the sound events in a natural way and to see them and hear in a comfortable way, see Figure 24. In this context, we intend to develop complementary systems of support to decision using the features already developed under the FI-Sonic project, including using virtual reality oculus.
Considering the amount of potential applications that FI-Sonic technology has for urban areas, we believe that the growth perspectives of this project are very promising, allowing us to be very optimistic about the results of our market plan. In fact, two patents are pending, one for the smart city S3 unit and a second one with the technology developed for end users regarding immersive audio, for users on the fields of music and virtual reality.
Acknowledgements
The FI-Sonic project, research and development, has been supported by Soul-Fi, Startups Optimizing Urban Life with Future Internet, (Soul-fi is a FIWARE accelerator funded by the European Commission, FP7, aiming to grow web-based, innovative solutions (open data and crowd sourced data) for smarter urban life of EU citizens (topics are quality of life, mobility, resource efficiency, tourism)), acting as a facilitator to deliver innovative and promising products to the market.
References
[1] The European Environment – State and Outlook 2015, European Environment Agency, 2016
[2] Who, 2012, Environmental Health Inequalities In Euroep – Assessment Report, World Health Organization Regional Office For Europe, Copenhagen, Denmark And Eea/Jrc, 2013, Environment And Human Health, Eea Report N.º 5/2013, European Environment Agency And The European Comission’s Joint Research Centre
[3] Eea, 2014, Noise in Europe 2014, EEA Report N.º 10/2014, European Environment Agency, Copenhagen, Denmark
[4] WHO, 2009, Night Noise Guidelines For Europe, World Health Organization, Regional Office For Europe, Copenhagen, Denmark; And Jrc, 2013, Final Report Ennah — European Network On Noise And Health, Scientific And Policy Report By The Joint Research Centre Of The European Commission
[5] WHO/Jrc, 2011, Burden Of Disease From Environmental Noise, World Health Organization, Regional Office For Europe, Copenhagen, Europe
[6] Dimoulas C., Avdelidis K., Kalliris G. andPapanikolaou G., “Sound Source Localization and B-Format Enhancement Using Sound Field Microphone Sets”, in 122nd AES Convention,Preprint Number: 7091, May 2007
[7] Bugalho, M., Portelo, J., Trancoso, I., Pellegrini, T., Abad, A.: Detecting audio events for semantic video search. In: Proc. Interspeech 2009
[8] Alan Dufaux. “Detection and Recognition of Impulsive Sound Signals”. Institute of Microtechnology, University of Neuchatel, Switzerland. PhD thesis 2001
[9] Li, D., Sethi, I. K., Dimitrova, N. and McGee, T. Classification of general audio data for content-based retrieval, Pattern Recognition Letters, 22, 533-544, (2001).
[10] Author, A.; Author, B. Paper title. Journal name, volume (number), year, pages.