Embed Size (px)
Citation preview
Continuing Patent Applications and Performance of the U.S. Patent and
Trademark Office - Extended
Cecil D. Quillen, Jr., Ogden H. Webster, and Richard Eichmann
Published in The Federal Circuit Bar Journal, Vol. 12, No. 1, (August 2002), pages 35-55

Continuing Patent Applications andPerformance of the U.S. Patent andTrademark Office – Extended
Cecil D. Quillen, Jr., Ogden H. Webster, and Richard Eichmann*
Introduction
The earlier study by two of the authors (Quillen and Webster), publishedin the August 2001 issue of The Federal Circuit Bar Journal,1 estimated therigor of the examining activities of the U.S. Patent and Trademark Office(USPTO) for its fiscal years 1993–1998. The study utilized data for continu-ing applications for those years provided by the USPTO2 and data for the samefiscal years from the USPTO’s Annual Reports as published on the USPTO’swebsite.3 Two measures of rigor were determined: Allowance Percentage andGrant Rate.4 Allowance Percentages were also determined for the European
* Mr. Quillen is the former General Counsel of Eastman Kodak Company, where he wasa Senior Vice President and member of the Board of Directors. He is presently a SeniorAdvisor at Cornerstone Research, an economic consulting firm. Mr. Webster is a formerAssistant General Counsel of Eastman Kodak Company where he was Chief Patent Counsel.Mr. Eichmann is a Research Associate at Cornerstone Research. The authors are grateful toJohn Allison and Mark Lemley for use of the database underlying their study Who’s PatentingWhat? An Empirical Exploration of Patent Prosecution, published in the Vanderbilt LawReview, and to Mr. Lemley for his comments. The conclusions expressed herein are those ofthe authors and should not be attributed to Eastman Kodak Company, CornerstoneResearch, or to Mr. Allison or Mr. Lemley. Errors are the authors’ alone.
1 Cecil D. Quillen, Jr. & Ogden H. Webster, Continuing Patent Applications andPerformance of the U.S. Patent and Trademark Office, 11 FED. CIR. B.J. 1 (2001).
2 The continuing applications data for the earlier study were provided by the USPTOpursuant to a request under the Freedom of Information Act (FOIA). See FOIA Request No.00-044.
3 The USPTO website is located at http://www.uspto.gov.4 Allowance Percentage is the number of applications allowed divided by the number filed,
with appropriate corrections to take into account those that are continuing applicationsclaiming benefit of the filing dates of prior applications, and, in a more refined calculation,with a time lag allowance to approximate the time required for examination. Grant Rate is thenumber of applications granted during the reporting period, divided by the number ofdisposals in the reporting period (applications granted plus those abandoned). CorrectedGrant Rates for the USPTO are calculated by correcting the number of applications reportedas abandoned to take into account those in which prosecution of the subject matter of theabandoned application was continued in a continuing application.
36 THE FEDERAL CIRCUIT BAR JOURNAL VOL. 12, NO. 1
Patent Office (EPO) for 1978–1999 and for the Japanese Patent Office (JPO)for 1988–1999. The study also reported Grant Rates for the USPTO, EPO,and JPO, as presented on the Trilateral Website5, as well as corrected GrantRates for the USPTO. The study found that Allowance Percentages andGrant Rates for the USPTO, when corrected for continuing applications, areas high as 95–97%, and are substantially higher (i.e., less rigorous) thancorresponding performance measures for the EPO or JPO.6 Table 7 of theprevious publication summarizes the results of the earlier study.7 Table 7 ofthe earlier publication also reports a determination by Harhoff, Scherer andVopel of the percentage of the 1977 cohort of German patent applicationsthat became patents.8
A number of studies have found discontinuities in various patent-relatedstatistics following formation of the United States Court of Appeals for theFederal Circuit in 1982. For example, John F. Merz and Nicholas M. Pace,in a study published in the August 1994 Journal of the Patent and TrademarkOffice Society, reported significant increases in patent litigation, patentapplication filings, and patent grants attributed to formation of the FederalCircuit.9 Robert Hunt, in 1999, reported similar increases in applicationfilings and patent grants.10 In addition, John H. Barton reported an especiallydramatic increase in the ratio of intellectual property lawyers to research anddevelopment expenditures in the United States subsequent to the formationof the Federal Circuit.11
These studies suggested to the authors the questions of (1) whether therewere changes over time in the rigor of the USPTO’s examining activities, and(2) if so, whether such changes, like those noted in the previously mentionedstudies, could be attributed to formation of the Federal Circuit.12
As a consequence, data were sought from the USPTO to enable the earlierstudy to be extended to include at least the 1975–2000 time period so as to
5 The Trilateral Website is located at http://www.uspto.gov/web/tws/twsindex.htm.6 Quillen & Webster, supra note 1, at 3.7 Id. at 21 tbl.7, “Summary.”8 Id. at 11–12.9 Jon F. Merz & Nicholas M. Pace, Trends in Patent Litigation: The Apparent Influence of
Strengthened Patents Attributable to the Court of Appeals for the Federal Circuit, 76 J. PAT. &TRADEMARK OFF. SOC’Y 579, 587 (1994).
10 Robert Hunt, Patent Reform: A Mixed Blessing for the U.S. Economy?, BUS. REV. FED. RES.BANK PHILADELPHIA, Nov.–Dec. 1999, at 15, 17 fig.2, “Patent Activity.”
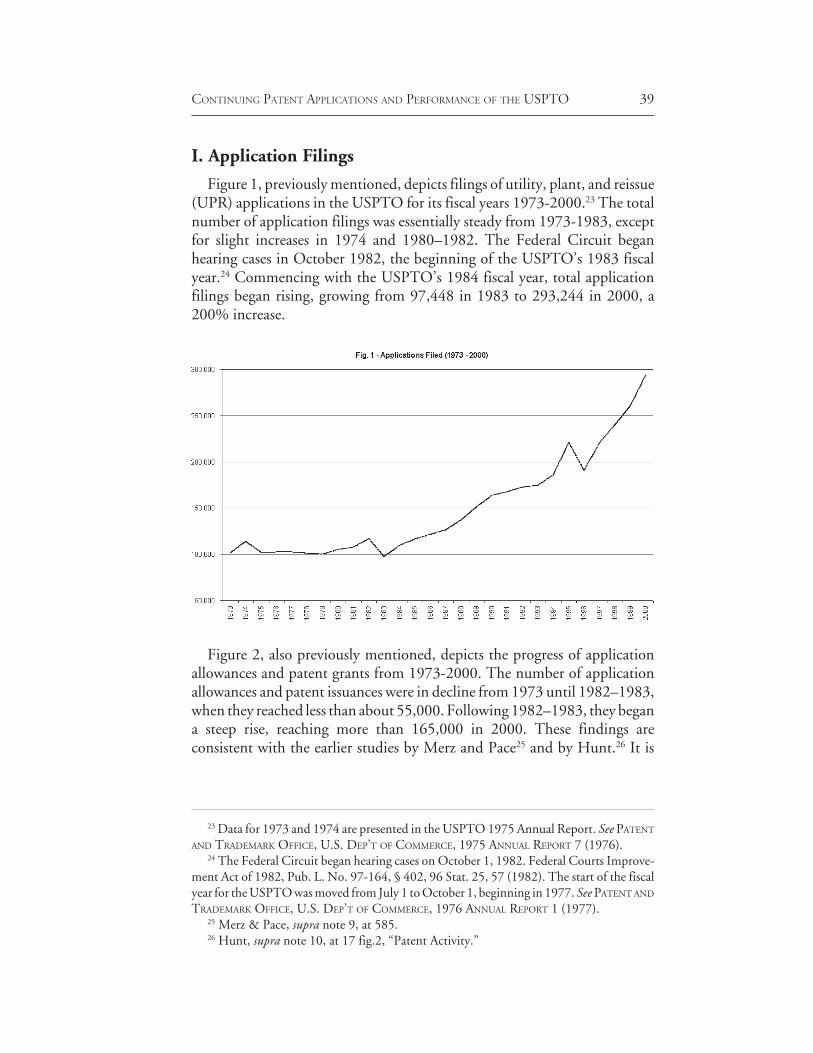
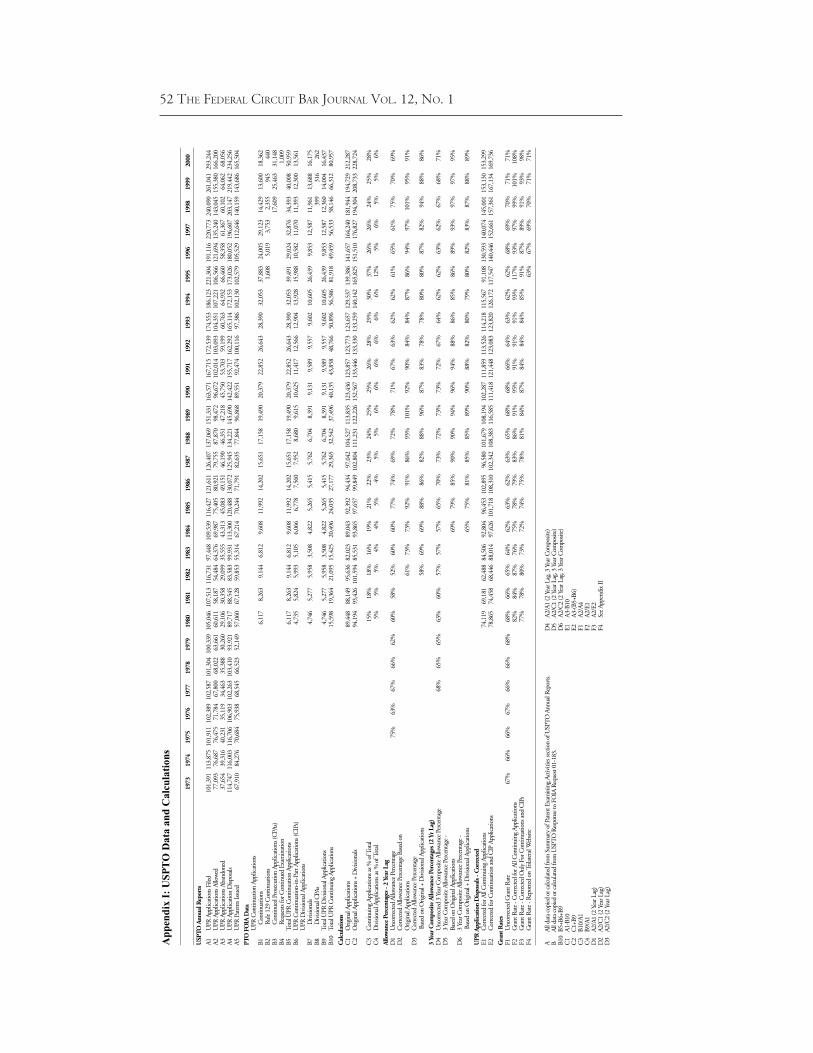
11 John H. Barton, Reforming the Patent System, SCIENCE, Mar. 17, 2000, at 1933, 1933.12 Figures 1 and 2, based on USPTO Annual Report data summarized in Appendix I,
illustrate the discontinuities in application filings (Figure 1) and application allowances andpatent issuances (Figure 2). The plotted numbers are for utility, plant, and reissue (UPR)applications and patents, which is the way much of the data are grouped and reported by theUSPTO.
37CONTINUING PATENT APPLICATIONS AND PERFORMANCE OF THE USPTO
span 1982, the year of formation of the Federal Circuit. Unfortunately,although USPTO Annual Report data for the years 1973–2000 were ob-tained, the USPTO apparently did not begin keeping computerized recordsuntil 1979. Therefore, continuing applications data before 1980 are regardedby the USPTO as incomplete and unreliable, and even the 1980 data may notbe very reliable.13
The absence of complete and reliable data as to continuing patent applica-tions prior to 1980 means that there are insufficient data for years earlier than1982 to be fully confident of conclusions as to the effect of the Federal Circuiton USPTO performance. Nonetheless, this study finds a progressive deterio-ration over time in USPTO performance subsequent to formation of theFederal Circuit as measured by Allowance Percentages and Grant Rates whencorrected for continuing applications. For example, the three-year compositeAllowance Percentage with a two-year lag to allow for prosecution time,corrected for continuing application filings, rose from 69% in 1984 to 95%in 2000.14 Similarly, the Grant Rate, corrected for continuation and continu-ation-in-part application filings, rose from 72% in 1984 (the lowest in theextended study), to 98% in 2000.
It had been suggested in connection with the earlier study that it is possiblefor patents to be granted on both a continuation application and its parentapplication even though both are by definition for the same invention.15 Tothe extent that this may be true, the earlier study may overstate the AllowancePercentages and Grant Rates reported therein. Access to additional data,however, has enabled us to estimate the extent to which such AllowancePercentages and Grant Rates may have been overstated.
John R. Allison and Mark A. Lemley, for their study Who’s Patenting What?An Empirical Exploration of Patent Prosecution, compiled a database of arandom sample of 1000 utility patents issued between 1996 and 1998. 16 It ispossible from their database to identify those patents, among the 1000, thatwere granted on continuing applications (i.e., continuations, continuations-in-part, or divisionals).17 Then, by inspecting the image of the patent copy as
13 The authors are grateful for the work by Robert Fawcett of the USPTO’s Office ofGeneral Counsel and USPTO Information System Specialist Peter Toby Brown for findingand forwarding the data on which this extended study is based. These data were providedpursuant to a FOIA request to the USPTO. See FOIA Request Nos. 01-183, 01-291, and 01-327. Processing fees for obtaining and providing the data were waived by the USPTO.
14 1984 is the first year for which such a three-year composite Allowance Percentage canbe calculated.
15 Quillen & Webster, supra note 1, at 4 n.17.16 John R. Allison & Mark A. Lemley, Who’s Patenting What? An Empirical Exploration of
Patent Prosecution, 53 VAND. L. REV. 2099, 2100 (2000).17 Allison and Lemley were kind enough to loan us use of their database for this purpose.
38 THE FEDERAL CIRCUIT BAR JOURNAL VOL. 12, NO. 1
it appears in the USPTO patent database,18 one can ascertain those in whicha patent has also been granted on the parent application.
Using the Allison and Lemley data, we identified 297 patents (of the 1000)that had been granted on continuing applications (i.e., continuations, con-tinuations-in-part, or divisionals) and determined that the USPTO hadgranted patents on 92 of their parent applications (31%). We also determinedthat 141 patents had been granted on continuation applications, and thatpatents had been granted on 19 of the 141 parent applications (13% of the141, 6.4% of the 297).
The Allison and Lemley data covered calendar years 1996–1998, while ourearlier study dealt with the USPTO’s fiscal years 1993–1998. This overlap issufficient to permit at least an estimate of adjustments that would result fromtaking such continuing applications and patents into account.
Adjusted results are as follows: First, when the earlier results are adjusted totake into account the effect of continuation applications where both theparent application and the continuation application resulted in a patent (19),the two-year lagged Allowance Percentage was reduced from 95% to 92%,19
and the overall Grant Rate was reduced from 97% to 95%.20 Second, whenthe earlier results are adjusted to take into account all continuing applications(i.e., continuations, continuations-in-part, and divisionals) in which patentswere granted on both the parent and the continuing application (92), the two-year lagged Allowance Percentage was reduced from 95% to 83% and theoverall Grant Rate was reduced from 97% to 85%. These latter adjustednumbers are about the same as the numbers obtained in the earlier study whenthe two-year lagged Allowance Percentage and the Grant Rate were deter-mined on the assumption that all divisional applications could be regarded as“original” applications.21 Both are still substantially higher than comparablenumbers in the earlier study for the European and Japanese Patent Offices,22
again suggesting that the U.S. Patent Office is less rigorous than the otherpatent offices, which was a conclusion of the earlier study.
18 See Patent Full-Text and Full-Page Image Databases at http://www.uspto.gov/patft/index.html.
19 See infra app. IV, “Corrected and Adjusted Allowance Percentages.”20 See infra app. V, “Corrected and Adjusted Grant Rates.”21 See Quillen & Webster, supra note 1, at 17 tbl.2, “B - Percentage of Original Plus
Divisional Applications Allowed,” and at 20 tbl.6, “B - Net Abandonments = TotalAbandonment Less Continuation and Continuation-In-Part Applications.”
22 See id. at 21 tbl.7, “Summary.”
39CONTINUING PATENT APPLICATIONS AND PERFORMANCE OF THE USPTO
I. Application Filings
Figure 1, previously mentioned, depicts filings of utility, plant, and reissue(UPR) applications in the USPTO for its fiscal years 1973-2000.23 The totalnumber of application filings was essentially steady from 1973-1983, exceptfor slight increases in 1974 and 1980–1982. The Federal Circuit beganhearing cases in October 1982, the beginning of the USPTO’s 1983 fiscalyear.24 Commencing with the USPTO’s 1984 fiscal year, total applicationfilings began rising, growing from 97,448 in 1983 to 293,244 in 2000, a200% increase.
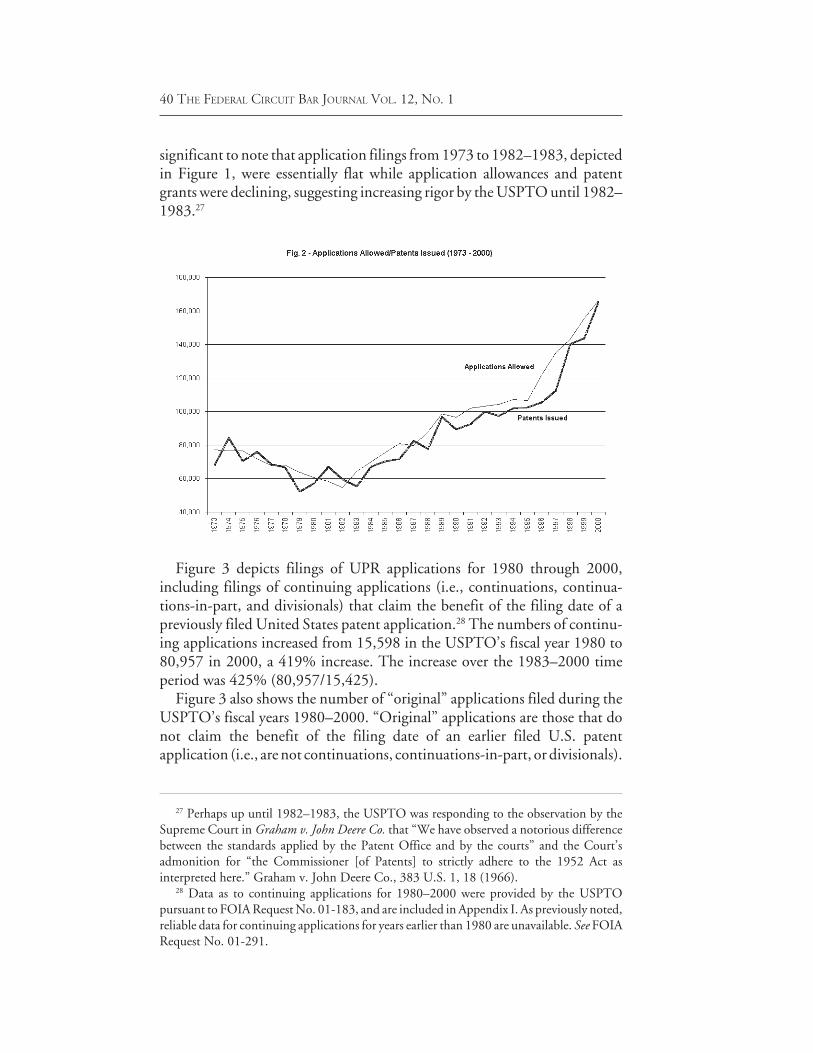
Figure 2, also previously mentioned, depicts the progress of applicationallowances and patent grants from 1973-2000. The number of applicationallowances and patent issuances were in decline from 1973 until 1982–1983,when they reached less than about 55,000. Following 1982–1983, they begana steep rise, reaching more than 165,000 in 2000. These findings areconsistent with the earlier studies by Merz and Pace25 and by Hunt.26 It is
23 Data for 1973 and 1974 are presented in the USPTO 1975 Annual Report. See PATENT
AND TRADEMARK OFFICE, U.S. DEP’T OF COMMERCE, 1975 ANNUAL REPORT 7 (1976).24 The Federal Circuit began hearing cases on October 1, 1982. Federal Courts Improve-
ment Act of 1982, Pub. L. No. 97-164, § 402, 96 Stat. 25, 57 (1982). The start of the fiscalyear for the USPTO was moved from July 1 to October 1, beginning in 1977. See PATENT AND
TRADEMARK OFFICE, U.S. DEP’T OF COMMERCE, 1976 ANNUAL REPORT 1 (1977).25 Merz & Pace, supra note 9, at 585.26 Hunt, supra note 10, at 17 fig.2, “Patent Activity.”
40 THE FEDERAL CIRCUIT BAR JOURNAL VOL. 12, NO. 1
significant to note that application filings from 1973 to 1982–1983, depictedin Figure 1, were essentially flat while application allowances and patentgrants were declining, suggesting increasing rigor by the USPTO until 1982–1983.27
Figure 3 depicts filings of UPR applications for 1980 through 2000,including filings of continuing applications (i.e., continuations, continua-tions-in-part, and divisionals) that claim the benefit of the filing date of apreviously filed United States patent application.28 The numbers of continu-ing applications increased from 15,598 in the USPTO’s fiscal year 1980 to80,957 in 2000, a 419% increase. The increase over the 1983–2000 timeperiod was 425% (80,957/15,425).
Figure 3 also shows the number of “original” applications filed during theUSPTO’s fiscal years 1980–2000. “Original” applications are those that donot claim the benefit of the filing date of an earlier filed U.S. patentapplication (i.e., are not continuations, continuations-in-part, or divisionals).
27 Perhaps up until 1982–1983, the USPTO was responding to the observation by theSupreme Court in Graham v. John Deere Co. that “We have observed a notorious differencebetween the standards applied by the Patent Office and by the courts” and the Court’sadmonition for “the Commissioner [of Patents] to strictly adhere to the 1952 Act asinterpreted here.” Graham v. John Deere Co., 383 U.S. 1, 18 (1966).
28 Data as to continuing applications for 1980–2000 were provided by the USPTOpursuant to FOIA Request No. 01-183, and are included in Appendix I. As previously noted,reliable data for continuing applications for years earlier than 1980 are unavailable. See FOIARequest No. 01-291.

41CONTINUING PATENT APPLICATIONS AND PERFORMANCE OF THE USPTO
The number of original applications is determined by subtracting the numberof applications claiming benefit of the filing date of an earlier application (i.e.,continuations, continuations-in-part, and divisionals) from the total numberof applications filed. The number of original applications increased from89,448 in 1980 to 212,287 in 2000, a 137% increase. Over the 1983–2000time period the increase was about 160% (212,287/82,023).
The disparity in the increase in numbers of continuing applications andoriginal applications (419% vs. 137% for 1980–2000, 425% vs. 160% for1983–2000) means that an increasing proportion of the USPTO examina-tion workload is devoted to the examination of applications whose subjectmatter had already been before the USPTO and was (or could have been)examined by the USPTO. Consequently, a decreasing proportion of theUSPTO’s time is available for the examination of original applications.
Figure 4 illustrates this disparity. It depicts filings of divisional applicationsand all continuing applications in the USPTO for the USPTO’s 1980–2000fiscal years as the percentage of total UPR applications filed in those years. Thetotal number of continuing applications as a percentage of total UPRapplication filings increased from 15% in 1980 to 28% in 2000. The numberof divisional applications remained essentially flat over this time period atabout 5%, except for the “spike” in 1995.29
29 The “spike” in divisional application filings in 1995 is almost certainly due to divisionalapplications being filed in advance of the effective date of the legislation changing the patentterm to twenty years from the earliest claimed U.S. application date so that patents grantedon such divisional applications would be entitled to a term of seventeen years from their issuedate.

42 THE FEDERAL CIRCUIT BAR JOURNAL VOL. 12, NO. 1
As noted previously, continuing applications claim inventions that aredescribed in earlier filed parent applications, and thus, to a considerableextent, represent “rework” for the USPTO, since the inventions of thecontinuing applications were, or could have been, examined in the earlierparent applications. Even if all divisional applications are regarded as directedto inventions that are independent and distinct from those of their parentapplications and claim subject matter not previously examined by theUSPTO, and thus do not represent rework, it is still apparent from Fig. 4 thatthe amount of rework imposed on the USPTO as a consequence of continu-ing application filings has increased over time.
In addition, as pointed out in the earlier publication, the ability to file asuccession of continuing applications enables patent applicants to avoid finaldecisions as to the patentability of their inventions.30 The USPTO is thusplaced in the position of being unable to rid itself of determined applicantsexcept by allowing their applications. Abolition of continuing applicationswould enable the USPTO to obtain final decisions as to patentability andwould allow the USPTO to rid itself of persistent applicants by some methodother than allowing their applications. In addition, abolition of continuingapplications would eliminate the rework imposed on the USPTO by suchcontinuing applications and would enable the USPTO to focus on theexamination of original applications.31 This could result in improved perfor-mance by the USPTO.
30 Quillen & Webster, supra note 1, at 14.31 Abolition of continuing applications would also eliminate, or at least ameliorate, the
“hold-up” problem. Id. at 6 nn.28–29.

43CONTINUING PATENT APPLICATIONS AND PERFORMANCE OF THE USPTO
II. USPTO Performance
A. Allowance Percentages
The earlier study determined two measures of USPTO performance,Allowance Percentage and Grant Rate. Allowance Percentage is the numberof applications allowed divided by the number of applications filed, withappropriate corrections to take into account the number of applications filedthat are continuing applications, and, in our “refined” calculation, with a lagto allow for prosecution pendency.
Figure 5 shows Allowance Percentages, calculated with a two-year lag toallow for prosecution time. The lowest of the three lines is the uncorrectedAllowance Percentage based on all UPR applications filed with the USPTOfor the USPTO’s fiscal years 1973–2000.32 The top line shows the correctedAllowance Percentage for the USPTO’s fiscal years 1980–2000 based onoriginal UPR applications (i.e., UPR applications that do not claim thebenefit of the filing date of an earlier application, determined by subtractingthe number of continuing UPR applications from total UPR applications).33
The intermediate line is the corrected Allowance Percentage for the USPTO’s1980–2000 fiscal years that results from using original UPR applications plusdivisional UPR applications as the denominator (i.e., on the assumption thatthe subject matter of the divisional UPR application had not previously beenexamined by the USPTO).
32 Because of the two-year lag, 1975 is the earliest year for which the uncorrected AllowancePercentage can be determined.
33 Because the USPTO’s 1980 fiscal year is the earliest date for which continuingapplications data are available, 1982 is the earliest year for which such two-year laggedAllowance Percentages can be determined.

44 THE FEDERAL CIRCUIT BAR JOURNAL VOL. 12, NO. 1
The uncorrected Allowance Percentage for the USPTO’s 1982 fiscal yearwas 52%, rising to 77% in 1985, and after 1989, falling to below 70% until1998. Recall that the Federal Circuit began hearing cases in October 1982, thebeginning of the USPTO’s 1983 fiscal year, which suggests the possibility ofa connection between the formation of the Federal Circuit and the decline ofUSPTO rigor that began with its 1983 fiscal year.
Figure 5 reveals a sharp rise in corrected Allowance Percentages, whetherbased on original applications alone or on original plus divisional applica-tions, from their initial values of about 60% in 1982 to about 90% by 1985.Both corrected Allowance Percentage values have remained at high levelssince 1985.
Figure 6 shows two-year lagged Allowance Percentages for a three-yearcomposite time period. The first data point (on the bottom line) is theuncorrected Allowance Percentage determined by dividing the sum of allow-ances for 1975–1977 by the sum of applications filed for 1973–1975.Subsequent determinations follow the same pattern (e.g., the 1984 values aredetermined by dividing the allowances for 1982–1984 by application filingsfor 1980–1982, etc.).
Figure 6 displays the same general pattern as Figure 5. UncorrectedAllowance Percentages are in decline from their initial value in 1977 until1982–1984, suggesting the possibility of increasing rigor by the USPTO.Uncorrected Allowance Percentages rise sharply from their 1984 values tonearly 75% by 1987, suggesting the possibility of declining rigor by theUSPTO. Thereafter the uncorrected Allowance Percentages oscillate be-tween about 60% and about 70%.

45CONTINUING PATENT APPLICATIONS AND PERFORMANCE OF THE USPTO
The Corrected Allowance Percentages as shown in Figure 6 rise sharplyfrom their 1984 values, initially peaking in 1990 at 90% for the AllowancePercentage based on original plus divisional applications, and at 96% for theAllowance Percentage based on original applications.34 Rising AllowancePercentages indicate declining rigor by the USPTO. Following the 1990initial peak, both measures of corrected Allowance Percentage decline andthen rise again. Fiscal year 2000 values are 95% and 89%, respectively.
Comparative Allowance Percentages (three-year composite, two-year lag)for the USPTO, the European Patent Office (EPO), and the Japanese PatentOffice (JPO) are shown in Figure 7. The USPTO Allowance Percentages arebased on original applications. Data for the EPO and JPO determinationswere obtained from their respective websites (except the JPO data for 2000were supplied by MITI).35 All of these data are found in Appendix III.
Allowance Percentages for the USPTO are substantially in excess of thosefor the EPO (approximately 30% or more) from 1984 until 1993 when thosefor the EPO begin a steep rise, exceeding the Allowance Percentage for theUSPTO in 1995 and remaining above the USPTO Allowance Percentagesthrough 1997. The EPO Allowance percentage declined sharply, beginning
34 1984 is the first year for which the corrected two-year lagged, three-year compositeAllowance Percentages can be determined for the USPTO because there is no complete andreliable data for continuing application filings prior to 1980. See FOIA Request No. 01-291.
35 The EPO website is located at http://www.european-patent-office.org. The JPO websiteis located at http://www.jpo.go.jp.

46 THE FEDERAL CIRCUIT BAR JOURNAL VOL. 12, NO. 1
in 1997, to 74% in 2000, while the USPTO Allowance Percentage remainedat 95% in 2000.
The first year for which the three-year composite, two-year lagged Allow-ance Percentage can be determined for the JPO is 1992. The JPO AllowancePercentage is essentially flat to declining for 1992–1995 and rises sharplycommencing in 1996, three years after the sharp rise in the EPO AllowancePercentage. The JPO Allowance Percentage peaks at 90% in 1998, one yearafter the peak in the EPO Allowance Percentage, and then declines sharply to64% in 2000.
To recapitulate, Allowance Percentages are measures of the rigor of patentoffice examination. The higher the Allowance Percentage is, the less rigorousthe examination. These charts reveal that for the periods for which compara-tive Allowance Percentages can be determined (1992–2000 for the JPO and1984–2000 for the EPO), the least rigorous of the patent offices was theUSPTO, except for the EPO in 1995–1997.
B. Grant Rates
As previously indicated, Grant Rate is another measure of the rigor of thepatent examination process. The higher the Grant Rate, the less rigorous theexamination process. Grant Rate is defined on the Trilateral Website as “thenumber of applications that were granted during the reporting period,divided by the number of disposals in the reporting period (applicationsgranted plus those abandoned),” and is reported on the Trilateral Website forthe USPTO, the EPO, and the JPO.36
Grant Rates reported for the USPTO on the Trilateral Website, however,are not corrected for continuing applications, even though continuingapplications claim subject matter that was disclosed in prior applications andmany of them represent renewed attempts to patent subject matter of earlierabandoned applications. Thus, to obtain a true measure of the USPTO’sperformance as measured by the Grant Rate, the number of applicationscounted as abandoned must be corrected to take into account those in whicha continuing application was filed in an attempt to patent the subject matterof its abandoned parent application.
Figure 8 depicts determinations of three Grant Rates for the USPTO. Thebottom line is the uncorrected Grant Rate for the USPTO, calculated fromdata from USPTO Annual Reports, and not corrected for continuingapplication filings. Superimposed for the years 1995–2000 are USPTO GrantRates as reported on the Trilateral Website.
36 See infra app. II, “Grant Rates Reported on the Trilateral Website” at http://www.uspto.gov, http://www.jpo.go.jp, http://www.european-patent-office.org.

47CONTINUING PATENT APPLICATIONS AND PERFORMANCE OF THE USPTO
The top line depicts Grant Rates for the USPTO calculated on theassumption that all continuing applications (i.e., continuations, continua-tions-in-part, and divisionals) represent a renewed effort to seek a patent onthe subject matter of a prior abandoned application. That assumption, at leastwith respect to 1995, 1999, and 2000, is obviously incorrect. The calculatedGrant Rate for those years is above 100%, which is not possible. Thisimpossibility undoubtedly occurs because some of the divisional applicationsclaim subject matter that is genuinely independent and distinct from theinvention claimed in the parent application that was not abandoned.
The intermediate line is the USPTO Grant Rate calculated on theassumption that continuation and continuation-in-part applications, but notdivisional applications, represent an effort to patent the subject matter of aprior abandoned application. Grant Rates by this measure were 77% in 1980,the first year for which corrected grant rates can be calculated, falling to 72%in 1984, and then rising to 98% in 2000. The rise in corrected Grant Ratesover time, which is also apparent from the top line plot, is an indication of thedeclining rigor of the USPTO’s examination activities.
Figure 9 plots Grant Rates for the USPTO, the EPO, and the JPO for1995–2000, as reported on the Trilateral Website. Figure 9 also plots USPTOGrant Rates for those same years, corrected for continuation and continua-tion-in-part applications. The Trilateral Website Grant Rates for all threepatent offices are similar. But the corrected Grant Rates for the USPTO aresubstantially higher (approximately 20%), illustrating the extent to which theuncorrected Grant Rates for the USPTO on the Trilateral Website may bemisleading.

48 THE FEDERAL CIRCUIT BAR JOURNAL VOL. 12, NO. 1
III. Adjustments
As indicated in the introduction, it had been suggested in connection withthe earlier study that it is possible for a patent to be granted on both acontinuation application and its parent even though by definition both are forthe same invention.37 Appendices IV and V set forth the calculationsdescribed in the Introduction using information from the database madeavailable by John Allison and Mark Lemley. Allison and Lemley’s databasewas used to determine whether the number of instances in which a patent hadbeen granted on both a continuation application and its parent was sufficientto significantly affect the results reported in the earlier paper. Appendix IV setsforth calculations to determine the effect on Allowance Percentages, andAppendix V sets forth the calculations for Grant Rates.
Corrected Allowance Percentages (Appendix IV) are measured by subtract-ing the appropriate number of continuing applications from the total numberof UPR applications to determine the number of Original Applications, andthen dividing the number of applications allowed by the number of OriginalApplications. The determination of the two-year lagged Allowance Percent-age from Table 2A of the earlier paper is reproduced as Calculation 1 inAppendix IV using the numbers supplied by the USPTO in 2001 instead ofthe numbers supplied in 2000.38 Calculation 2 in Appendix IV is theadjustment for the number of continuation applications in which a patent was
37 Quillen & Webster, supra note 1, at 4 n.17.38 The numbers supplied by the USPTO in 2001 differ slightly from those supplied in
2000. The differences are so small that the calculated Allowance Percentage remainsunchanged.

49CONTINUING PATENT APPLICATIONS AND PERFORMANCE OF THE USPTO
granted on both the parent application and the continuation application,which, as seen from the Patents Granted on Continuing Applications table,comprised 6.4% of the total number of continuing applications (297).Reducing the number of continuing applications by that percentage yields theAdjusted Continuing Applications line (Total = 330,921). Subtraction of theAdjusted Continuing Applications from the Total UPR Applications filedgives the adjusted number of original applications. Adjustment of thecalculated Allowance Percentage for the six-year period, allowing a two-yearlag for prosecution pendency, reduces the Allowance Percentage to 92%(from 95%). Calculation 3 adjusts on the basis of all continuing applications(i.e., continuations, continuations-in-part, and divisionals) in which a patentwas granted on both the parent application and the continuing application(31%). Adjustment on this basis yields an Allowance Percentage of 83%which is still substantially in excess of the Allowance Percentages determinedfor the EPO and the JPO in the earlier study.
Corrected Grant Rates (Appendix V) are calculated by adjusting thenumber of applications reported as abandoned by the number of refiledcontinuing applications so as to determine a net number of abandonedapplications. Corrected Application Disposals are the sum of allowances andcorrected applications abandoned (reported as Net UPR Applications Aban-doned).39 Net Disposals are the sum of Application Allowances and NetAbandonments, and the Grant Rate is the number of allowances divided byNet Disposals. The determination of the Grant Rate from Table 6A of theearlier paper is reproduced as Calculation 1 in Appendix V. The overallcorrected Grant Rate for the six-year period was determined to be 97%.40
Calculation 2 in Appendix V is a determination of the Corrected Grant Rate,adjusted to take into account the continuation applications on which a patentwas granted on both the parent application and the continuation application(6.4% of the total number of continuing applications). Adjustment of theGrant Rate to take such continuation applications into account reduces theGrant Rate from 97% to 95%. Calculation 3 is the determination of theadjusted Grant Rate taking into account all continuing applications in whicha patent was granted on both the parent application and the continuing
39 The negative numbers in 1995 for Net UPR Applications Abandoned in Calculation 1and for Adjusted Applications Abandoned in Calculation 2 in Appendix V are artifactsresulting from the unusually large number of divisional applications filed in 1995, as is thecorresponding number in Calculation 3. See infra app. V, “Corrected and Adjusted GrantRates.”
40 This determination, like the determination of Allowance Percentages in Appendix IV,used the numbers provided by the USPTO in 2001. Again, the differences between the 2001numbers and the 2000 numbers are so small that the calculated Grant Rates remainunchanged.

50 THE FEDERAL CIRCUIT BAR JOURNAL VOL. 12, NO. 1
application (31% of all continuing applications). The adjusted correctedGrant Rate on this assumption is 85%, which is substantially above the GrantRates reported for the EPO, JPO and USPTO on the Trilateral Website.
Conclusion
Examination performance of the USPTO, whether measured by Allow-ance Percentage or Grant Rate, when corrected for continuing applications,has deteriorated over time. Allowance Percentages (3-year composite, 2-yearlag) corrected for all continuing applications went from 69% in 1984 to 95%in 2000. Grant Rates, corrected for continuation and continuation-in-partapplications, have gone from 77% in 1980 to 98% in 2000. At the same time,the proportion of applications that are continuing applications has risen from15% in 1980 (and 16% in 1983) to 28% in 2000.
One question, suggested but not definitively answered by these data, is theextent to which the increase in continuing application filings is responsible forthe declining rigor of the USPTO. As noted previously, patent applicants canavoid a final decision as to the patentability of the subject matter of theirpatent applications by filing continuing applications. Because applicants arenot limited in the number of continuing applications they may file, theUSPTO can rid itself of determined applicants only by allowing theirapplications. Therefore, the increase in continuing application filings mayitself have caused a decline in the examination performance of the USPTO.41
The policy questions raised in the earlier paper remain valid in light of thefindings herein.42 Namely, is the performance of the USPTO as determinedin this study, and in the earlier study, acceptable. And, if so, why should wenot go to a registration system and avoid the expense of operating anexamination system. If the performance of the USPTO, as revealed in thesestudies, is not satisfactory, then the question becomes what should be done toimprove it. And, if we wish to improve the performance of the USPTO,shouldn’t we abolish continuing applications so that the USPTO will be able
41 Numerous authors have addressed the problem of USPTO quality. See Mark A. Lemley,Rational Ignorance at the Patent Office, 95 NW. U. L. REV. 1495 (2001); Robert P. Merges,As Many As Six Impossible Patents Before Breakfast: Property Rights For Business Concepts AndPatent System Reform, 14 BERKELEY TECH. L.J. 577 (1999); John R. Thomas, Collusion andCollective Action in the Patent System: A Proposal for Patent Bounties, 2001 U. ILL. L. REV. 305(2001); John R. Thomas, The Responsibility of the Rulemaker: Comparative Approaches toPatent Administration Reform, Presented at the Tenth Annual Conference on InternationalIntellectual Property Law & Policy (Apr. 4–5, 2002) and at the Patent System ReformConference (Mar. 1–2, 2002); Harold C. Wegner, Enronesque Patent Bookkeeping: Two-For-One Continuation Double Counting and American Patent Flooding (June 14, 2002)(unpublished manuscript, on file with author at Foley & Lardner).
42 Quillen & Webster, supra note 1, at 13–15.

51CONTINUING PATENT APPLICATIONS AND PERFORMANCE OF THE USPTO
to obtain final decisions as to the patentability of subject matter presented inpatent applications and avoid having rework imposed upon it. Finally, so longas the USPTO grants a patent for virtually every application filed, are thecourts justified in adhering to the clear and convincing evidence standard forovercoming the statutory presumption of validity.
52 THE FEDERAL CIRCUIT BAR JOURNAL VOL. 12, NO. 1
Ap
pen
dix
I:
US
PT
O D
ata
an
d C
alc
ula
tion
s
1973
1974
1975
1976
1977
1978
1979
1980
1981
1982
1983
1984
1985
1986
1987
1988
1989
1990
1991
1992
1993
1994
1995
1996
1997
1998
1999
2000
USP
TO A
nnua
l Rep
orts
A1U
PR A
pplic
atio
ns F
iled
101,
391
113,
875
101,
911
102,
389
102,
587
101,
304
100,
339
105,
046
107,
513
116,
731
97,4
4810
9,53
911
6,42
712
1,61
112
6,40
713
7,06
915
1,33
116
3,57
116
7,71
517
2,53
917
4,55
318
6,12
322
1,30
419
1,11
622
0,77
324
0,09
026
1,04
129
3,24
4A2
UPR
App
licat
ions
Allo
wed
77,0
9376
,687
76,4
7571
,784
67,8
0068
,022
63,6
6160
,611
58,1
8754
,484
64,3
7669
,987
75,4
0580
,921
79,7
5587
,870
98,4
7296
,672
102,
014
103,
093
104,
351
107,
221
106,
566
121,
694
135,
240
143,
045
155,
380
166,
200
A3U
PR A
pplic
atio
ns A
band
oned
37,6
5439
,316
40,2
3135
,119
34,4
6335
,388
30,2
6029
,106
30,3
5829
,099
35,5
5543
,313
45,0
8349
,151
46,1
9046
,351
47,2
1845
,750
53,7
0359
,199
60,7
6364
,932
66,4
6058
,358
61,3
6760
,102
64,0
6268
,056
A4U
PR A
pplic
atio
n D
ispos
als
114,
747
116,
003
116,
706
106,
903
102,
263
103,
410
93,9
2189
,717
88,5
4583
,583
99,9
3111
3,30
012
0,48
813
0,07
212
5,94
513
4,22
114
5,69
014
2,42
215
5,71
716
2,29
216
5,11
417
2,15
317
3,02
618
0,05
219
6,60
720
3,14
721
9,44
223
4,25
6A5
UPR
Pat
ents
Issu
ed67
,910
84,2
7670
,684
75,9
3868
,545
66,5
2352
,149
57,0
6067
,128
59,8
5355
,314
67,2
1470
,244
71,7
9182
,635
77,8
4496
,868
89,5
5192
,474
100,
116
97,3
8610
2,13
010
2,57
910
5,52
911
2,64
614
0,15
914
3,68
616
5,50
4
PTO
FO
IA D
ata
UPR
Con
tinua
tion
Appl
icat
ions
B1C
ontin
uatio
ns6,
117
8,26
39,
144
6,81
29,
608
11,9
9214
,202
15,6
5117
,158
19,4
9020
,379
22,8
5226
,643
28,3
9032
,053
37,8
8324
,005
29,1
2314
,429
13,6
0018
,362
B2R
ule
129
Con
tinua
tions
1,60
85,
019
3,75
32,
355
945
440
B3C
ontin
ued
Pros
ecut
ion
Appl
icat
ions
(CPA
s)17
,609
25,4
6331
,148
B4R
eque
sts f
or C
ontin
ued
Exam
inat
ion
1,00
9B5
Tota
l UPR
Con
tinua
tion
Appl
icat
ions
6,11
78,
263
9,14
46,
812
9,60
811
,992
14,2
0215
,651
17,1
5819
,490
20,3
7922
,852
26,6
4328
,390
32,0
5339
,491
29,0
2432
,876
34,3
9340
,008
50,9
59B6
UPR
Con
tinua
tion-
in-P
art A
pplic
atio
ns (C
IPs)
4,73
55,
824
5,99
35,
105
6,06
66,
778
7,56
07,
952
8,68
09,
615
10,6
2511
,417
12,5
6612
,904
13,9
2815
,988
10,5
8211
,070
11,3
9312
,300
13,5
61U
PR D
ivisi
onal
App
licat
ions
B7D
ivisi
onal
s4,
746
5,27
75,
958
3,50
84,
822
5,26
55,
415
5,76
26,
704
8,39
19,
131
9,58
99,
557
9,60
210
,605
26,4
399,
853
12,5
8711
,961
13,6
8816
,175
B8D
ivisi
onal
CPA
s39
931
626
2B9
Tota
l UPR
Div
ision
al A
pplic
atio
ns4,
746
5,27
75,
958
3,50
84,
822
5,26
55,
415
5,76
26,
704
8,39
19,
131
9,58
99,
557
9,60
210
,605
26,4
399,
853
12,5
8712
,360
14,0
0416
,437
B10
Tota
l UPR
Con
tinui
ng A
pplic
atio
ns15
,598
19,3
6421
,095
15,4
2520
,496
24,0
3527
,177
29,3
6532
,542
37,4
9640
,135
43,8
5848
,766
50,8
9656
,586
81,9
1849
,459
56,5
3358
,146
66,3
1280
,957
Cal
cula
tions
C1
Orig
inal
App
licat
ions
89,4
4888
,149
95,6
3682
,023
89,0
4392
,392
94,4
3497
,042
104,
527
113,
835
123,
436
123,
857
123,
773
123,
657
129,
537
139,
386
141,
657
164,
240
181,
944
194,
729
212,
287
C2
Orig
inal
App
licat
ions
+ D
ivisi
onal
s94
,194
93,4
2610
1,59
485
,531
93,8
6597
,657
99,8
4910
2,80
411
1,23
112
2,22
613
2,56
713
3,44
613
3,33
013
3,25
914
0,14
216
5,82
515
1,51
017
6,82
719
4,30
420
8,73
322
8,72
4
C3
Con
tinui
ng A
pplic
atio
ns a
s % o
f Tot
al15
%18
%18
%16
%19
%21
%22
%23
%24
%25
%25
%26
%28
%29
%30
%37
%26
%26
%24
%25
%28
%C
4D
ivisi
onal
App
licat
ions
as %
of T
otal
5%5%
5%4%
4%5%
4%5%
5%6%
6%6%
6%6%
6%12
%5%
6%5%
5%6%
Allo
wan
ce P
erce
ntag
es -
2 Ye
ar L
agD
1U
ncor
rect
ed A
llow
ance
Per
cent
age
75%
63%
67%
66%
62%
60%
58%
52%
60%
60%
77%
74%
69%
72%
78%
71%
67%
63%
62%
62%
61%
65%
61%
75%
70%
69%
D2
Cor
rect
ed A
llow
ance
Per
cent
age
Base
d on
O
rigin
al A
pplic
atio
ns61
%73
%73
%92
%91
%86
%93
%10
1%92
%90
%84
%84
%87
%86
%94
%97
%10
1%95
%91
%D
3C
orre
cted
Allo
wan
ce P
erce
ntag
e B
ased
on
Orig
inal
+ D
ivisi
onal
App
licat
ions
58%
69%
69%
88%
86%
82%
88%
96%
87%
83%
78%
78%
80%
80%
87%
82%
94%
88%
86%
3 Ye
ar C
ompo
site
Allo
wan
ce P
erce
ntag
es (2
Yr L
ag)
D4
Unc
orre
cted
3 Y
ear C
ompo
site
Allo
wan
ce P
erce
ntag
e68
%65
%65
%63
%60
%57
%57
%57
%65
%70
%73
%72
%73
%73
%72
%67
%64
%62
%62
%63
%62
%67
%68
%71
%D
53
Year
Com
posit
e Al
low
ance
Per
cent
age
- Ba
sed
on O
rigin
al A
pplic
atio
ns69
%79
%85
%90
%90
%94
%96
%94
%88
%86
%85
%86
%89
%93
%97
%97
%95
%D
63
Year
Com
posit
e Al
low
ance
Per
cent
age
- B
ased
on
Orig
inal
+ D
ivisi
onal
App
licat
ions
65%
75%
81%
85%
85%
89%
90%
88%
82%
80%
79%
80%
82%
83%
87%
88%
89%
UPR
App
licat
ion
Dis
posa
ls - C
orre
cted
E1C
orre
cted
for A
ll C
ontin
uing
App
licat
ions
74,1
1969
,181
62,4
8884
,506
92,8
0496
,453
102,
895
96,5
8010
1,67
910
8,19
410
2,28
711
1,85
911
3,52
611
4,21
811
5,56
791
,108
130,
593
140,
074
145,
001
153,
130
153,
299
E2C
orre
cted
for C
ontin
uatio
n an
d C
IP A
pplic
atio
ns78
,865
74,4
5868
,446
88,0
1497
,626
101,
718
108,
310
102,
342
108,
383
116,
585
111,
418
121,
448
123,
083
123,
820
126,
172
117,
547
140,
446
152,
661
157,
361
167,
134
169,
736
Gra
nt R
ates
F1U
ncor
rect
ed G
rant
Rat
e67
%66
%66
%67
%66
%66
%68
%68
%66
%65
%64
%62
%63
%62
%63
%65
%68
%68
%66
%64
%63
%62
%62
%68
%69
%70
%71
%71
%F2
Gra
nt R
ate
- Cor
rect
ed fo
r All
Con
tinui
ng A
pplic
atio
ns82
%84
%87
%76
%75
%78
%79
%83
%86
%91
%95
%91
%91
%91
%93
%11
7%93
%97
%99
%10
1%10
8%F3
Gra
nt R
ate
- Cor
rect
ed O
nly
For C
ontin
uatio
ns a
nd C
IPs
77%
78%
80%
73%
72%
74%
75%
78%
81%
84%
87%
84%
84%
84%
85%
91%
87%
89%
91%
93%
98%
F4G
rant
Rat
e - R
epor
ted
on T
rilat
eral
Web
site
63%
67%
69%
70%
71%
71%
AA
ll da
ta c
opie
d or
cal
cula
ted
from
Sum
mar
y of
Pat
ent E
xam
inin
g Ac
tiviti
es se
ctio
n of
USP
TO
Ann
ual R
epor
ts.
D4
A2/
A1 (2
Yea
r Lag
, 3 Y
ear C
ompo
site)
BA
ll da
ta c
opie
d or
cal
cula
ted
from
USP
TO
Res
pons
e to
FO
IA R
eque
st 0
1-18
3.D
5A
2/C
1 (2
Yea
r Lag
, 3 Y
ear C
ompo
site)
B10
B5+B
6+B9
D6
A2/
C2
(2 Y
ear L
ag, 3
Yea
r Com
posit
e)C
1A
1-B1
0E1
A3-
B10
C2
C1+
B9E2
A3-
(B5+
B6)
C3
B10/
A1
F1A
2/A4
C4
B9/A
1F2
A2/
E1D
1A
2/A1
(2 Y
ear L
ag)
F3A
2/E2
D2
A2/
C1
(2 Y
ear L
ag)
F4Se
e Ap
pend
ix II
D3
A2/
C2
(2 Y
ear L
ag)

53CONTINUING PATENT APPLICATIONS AND PERFORMANCE OF THE USPTO
Ap
pen
dix
II:
Gra
nt
Rate
s R
eport
ed
on
th
e T
rila
teral
Web
site
1995
1996
1997
1998
1999
2000
Ave
rage
Eur
opea
n Pa
tent
Off
ice
67%
67%
68%
67%
64%
57%
65%
Japa
nese
Pat
ent O
ffic
e63
%64
%65
%65
%64
%61
%64
%U
.S. P
aten
t & T
rade
mar
k O
ffic
e63
%67
%69
%70
%71
%71
%69
%
Not
e: N
o va
lue
is r
epor
ted
on th
e Tr
ilate
ral W
ebsi
te fo
r Ja
pan
for
1996
. The
64%
val
ue is
the
aver
age
of th
e re
port
ed 1
995
and
1997
val
ues.
Ap
pen
dix
III
: A
llo
wa
nce
Per
cen
tag
e a
nd
Gra
nt
Ra
te C
om
pa
riso
ns
- U
SP
TO
, E
PO
, a
nd
JP
O
1980
1981
1982
1983
1984
1985
1986
1987
1988
1989
1990
1991
1992
1993
1994
1995
1996
1997
1998
1999
2000
U.S
. Pat
ent
& T
rade
mar
k O
ffic
eC
orre
cted
Allo
wan
ce P
erce
ntag
e 2
Year
Lag
- 3
Yea
r C
ompo
site
69%
79%
85%
90%
90%
94%
96%
94%
88%
86%
85%
86%
89%
93%
97%
97%
95%
Gra
nt R
ate
- C
orre
cted
For
C
ontin
uatio
ns a
nd C
IPs
77%
78%
80%
73%
72%
74%
75%
78%
81%
84%
87%
84%
84%
84%
85%
91%
87%
89%
91%
93%
98%
Gra
nt R
ate
- Tr
ilate
ral W
ebsi
te63
%67
%69
%70
%71
%71
%U
ncor
rect
ed G
rant
Rat
e68
%66
%65
%64
%62
%63
%62
%63
%65
%68
%68
%66
%64
%63
%62
%62
%68
%69
%70
%71
%71
%
Eur
opea
n Pa
tent
Off
ice
App
licat
ions
File
d17
,495
22,4
2125
,318
28,1
3233
,094
33,7
4836
,783
39,9
6144
,755
49,2
8252
,361
45,6
4846
,053
42,7
0941
,374
40,6
5141
,077
45,3
0948
,540
50,1
0454
,626
Pate
nts
Gra
nted
484
3,34
65,
428
9,65
613
,311
15,1
1718
,472
17,1
4419
,749
22,5
5824
,756
26,6
4230
,409
36,6
6442
,000
41,6
0740
,069
39,6
4636
,717
35,3
5727
,523
Allo
wan
ce P
erce
ntag
e (2
Yea
r La
g -
3 Y
r C
ompo
site
)44
%50
%54
%53
%53
%54
%55
%55
%56
%64
%76
%89
%95
%97
%95
%88
%74
%G
rant
Rat
e -
Trila
tera
l Web
site
67%
67%
68%
67%
64%
57%
Japa
nese
Pat
ent
Off
ice
App
licat
ions
339,
399
351,
207
367,
590
369,
396
371,
894
366,
486
353,
301
369,
215
376,
615
391,
572
401,
932
405,
655
436,
865
Exa
min
atio
n R
eque
sts
100,
111
116,
625
128,
172
146,
008
152,
853
223,
546
144,
051
167,
923
186,
415
205,
300
208,
392
217,
389
261,
690
Reg
istr
atio
n D
ecis
ions
50,5
4257
,566
50,4
5766
,637
70,3
6177
,310
81,6
6497
,677
195,
846
122,
386
129,
443
135,
412
116,
279
Pate
nts
Gra
nted
55,3
0063
,301
59,4
0136
,100
92,1
0088
,400
82,4
0010
9,10
021
5,10
014
7,68
614
1,44
815
0,05
912
5,88
0A
llow
ance
Per
cent
age
(2 Y
ear
lag
- 3
Yr
Com
posi
te)
54%
55%
54%
49%
72%
78%
90%
69%
64%
Gra
nt R
ate
- Tr
ilate
ral W
ebsi
te63
%64
%65
%65
%64
%61
%

54 THE FEDERAL CIRCUIT BAR JOURNAL VOL. 12, NO. 1
Appendix IV: Corrected and Adjusted Allowance Percentages
Patents Granted on Continuing Applications
Continuations CIPs Divisionals Total Continuing AppsNumber Percent Number Percent Number Percent Number Percent
Parent is Patented 19 13.5% 27 35.1% 46 58.2% 92 31.0%Parent is Abandoned 111 78.7% 34 44.2% 5 6.3% 150 50.5%Parent Disposition is Undetermined 11 7.8% 16 20.8% 28 35.4% 55 18.5%Total 141 100.0% 77 100% 79 100% 297 100%Parent Patented as % of Total Continuing Apps = 6.4%
Calculation 1 - Corrected Allowance Percentage (2 Yr Lag) Based on Original Applications
1993 1994 1995 1996 1997 1998 Total
UPR Applications Allowed 104,351 107,221 106,566 121,694 135,240 143,045 718,117
Total UPR Applications Filed 174,553 186,123 221,304 191,116 220,773 240,090 1,233,959Continuing UPR Applications 50,896 56,586 81,918 49,459 56,533 58,146 353,538Original UPR Applications Filed 123,657 129,537 139,386 141,657 164,240 181,944 880,421
Allowance Percentage (2 Yr Lag) Based on Original Applications
Original Applications (1993-1996) 534,237 PercentApplications Allowed (1996-1998) 506,545 95%
Calculation 2 - Allowance Percentage (2 Yr Lag) Adjusted for Continuation Applications in Which
Parent is Patented
1993 1994 1995 1996 1997 1998 Total
UPR Applications Allowed 104,351 107,221 106,566 121,694 135,240 143,045 718,117
Total UPR Applications Filed 174,553 186,123 221,304 191,116 220,773 240,090 1,233,959Continuing UPR Applications 50,896 56,586 81,918 49,459 56,533 58,146 353,538Adjusted Continuing Applications 47,640 52,966 76,677 46,295 52,916 54,426 330,921Adjusted Original Applications 126,913 133,157 144,627 144,821 167,857 185,664 903,038
Allowance Percentage (2 Yr Lag) Adjusted for Continuation Applications in which Parent is Patented
Adjusted Original Applications (1993-1996) 549,518 PercentApplications Allowed (1996-1998) 506,545 92%
Calculation 3 - Allowance Percentage (2 Yr Lag) Adjusted for All Continuing Applications in Which
Parent is Patented
1993 1994 1995 1996 1997 1998 Total
UPR Applications Allowed 104,351 107,221 106,566 121,694 135,240 143,045 718,117
Total UPR Applications Filed 174,553 186,123 221,304 191,116 220,773 240,090 1,233,959Continuing UPR Applications 50,896 56,586 81,918 49,459 56,533 58,146 353,538Adjusted Continuing Applications 35,130 39,058 56,543 34,138 39,021 40,134 244,025Adjusted Original Applications 139,423 147,065 164,761 156,978 181,752 199,956 989,934
Allowance Percentage (2 Yr Lag) Adjusted for All Continuing Applications in which Parent is Patented
Adjusted Original Applications (1993-1996) 608,227 PercentApplications Allowed (1996-1998) 506,545 83%
Adjusted Corrected Allowance Percentages

55CONTINUING PATENT APPLICATIONS AND PERFORMANCE OF THE USPTO
Appendix V: Corrected and Adjusted Grant Rates
Patents Granted on Continuing Applications
Continuations CIPs Divisionals Total Continuing AppsNumber Percent Number Percent Number Percent Number Percent
Parent is Patented 19 13% 27 35% 46 58% 92 31%Parent is Abandoned 111 79% 34 44% 5 6% 150 51%Parent Disposition is Undetermined 11 8% 16 21% 28 35% 55 19%Total 141 100% 77 100% 79 100% 297 100%Parent Patented as % of Total Continuing Apps = 6.4%
Calculation 1 - Corrected Grant Rates For The USPTO
1993 1994 1995 1996 1997 1998 Total
UPR Applications Allowed 104,351 107,221 106,566 121,694 135,240 143,045 718,117
Total UPR Applications Abandoned 60,763 64,932 66,460 58,358 61,367 60,102 371,982Total Continuing Applications 50,896 56,586 81,918 49,459 56,533 58,146 353,538Net UPR Applications Abandoned 9,867 8,346 (15,458) 8,899 4,834 1,956 18,444
Net UPR Disposals 114,218 115,567 91,108 130,593 140,074 145,001 736,561Grant Rate 91% 93% 117% 93% 97% 99% 97%
Calculation 2 - Adjusted for Patents Granted On a Continuation Applications and its Parent
1993 1994 1995 1996 1997 1998 Total
UPR Applications Allowed 104,351 107,221 106,566 121,694 135,240 143,045 718,117
Total UPR Applications Abandoned 60,763 64,932 66,460 58,358 61,367 60,102 371,982Total Continuing Applications 50,896 56,586 81,918 49,459 56,533 58,146 353,538Adjusted Continuing Applications 47,640 52,966 76,677 46,295 52,916 54,426 330,921Adjusted Applications Abandoned 13,123 11,966 (10,217) 12,063 8,451 5,676 41,061
Adjusted Net UPR Disposals 117,474 119,187 96,349 133,757 143,691 148,721 759,178Adjusted Grant Rate 89% 90% 111% 91% 94% 96% 95%
Calculation 3 - Adjusted for Patents Granted on a Continuing Application and its Parent
1993 1994 1995 1996 1997 1998 Total
UPR Applications Allowed 104,351 107,221 106,566 121,694 135,240 143,045 718,117
Total UPR Applications Abandoned 60,763 64,932 66,460 58,358 61,367 60,102 371,982Total Continuing Applications 50,896 56,586 81,918 49,459 56,533 58,146Adjusted Continuing Applications 35,130 39,058 56,543 34,138 39,021 40,134 244,025Adjusted Applications Abandoned 25,633 25,874 9,917 24,220 22,346 19,968 127,957
Adjusted Net UPR Disposals 129,984 133,095 116,483 145,914 157,586 163,013 846,074Adjusted Grant Rate 80% 81% 91% 83% 86% 88% 85%
Adjusted Corrected Grant Rates for the USPTO