Embed Size (px)
Citation preview
Contingency funding: back to the future?
Antoaneta Geala Bank Deposit Guarantee Scheme
Romania
High-level Seminar on Challenges for European Deposit Insurance Systems: Funding, Investment Practices and Reimbursement
February 26, 2015, Warsaw, Poland

Contents
2
1. Funding governance
2. Contingency funding – a historical perspective
3. Contingency funding tools’ pros and cons
4. Case studies
5. Stand-by credit lines
6. Lessons learned
7. Contingency funding: Back to the future?
8. Challenges for smaller DGSs outside the eurozone

3
Funding governance
National Bank of Romania (NBR) Board
CEO
Funding policy
Statutory approval on:
• Annual funding policy
• Annual contributions
• Special contributions
• Borrowings from:
•Ministry of Finance
•Financial institutions
•Credit institutions
• Bond issuance
•Any suspension of
contribution payment
FGDBSupervisory Board

4
Over time, FGDB included various contingency funding tools in its funding mix:
- Special contributions
- Borrowing from NBR (when the law allowed it)
- Stand-by credit lines
Contingency funding – a historical perspective
5
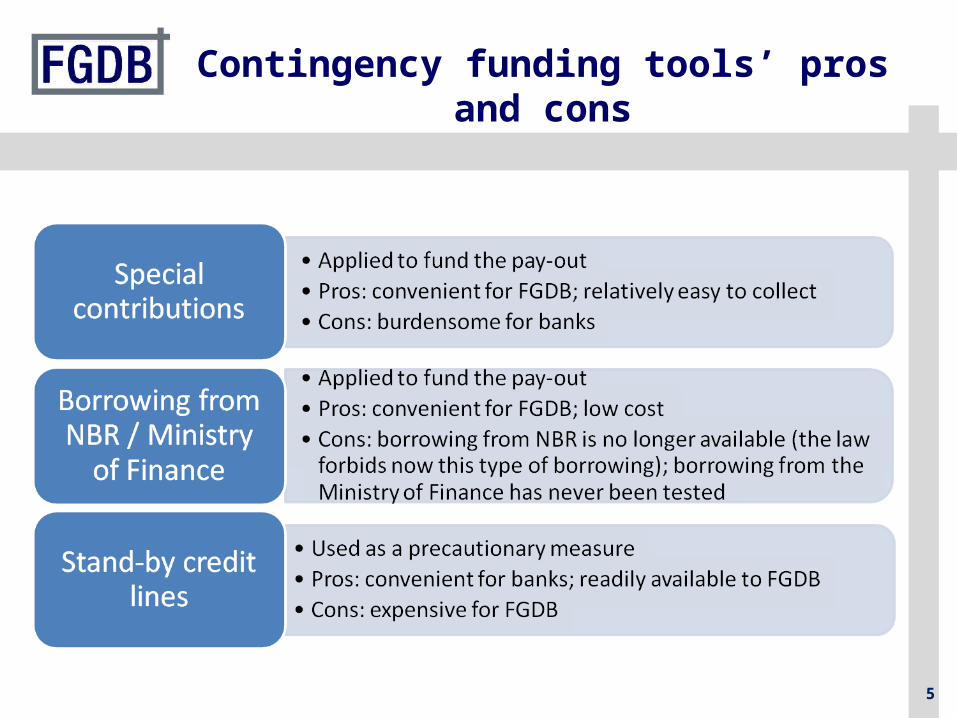
Contingency funding tools’ pros and cons
6
Case studies

7
In 2000 two small-to-medium sized Romanian Banks went bankrupt: Bankcoop and Banca Internationala a Religiilor (BIR)
Covered banks: 32 Romanian banks and 8 branches of foreign banks
Eligible deposits in the banking system (December 31st, 1999) : lei 53,178 bln.
Covered deposits of the two bankrupt banks: lei 4,629.7 bln.
FGDB resources at the time of the first bankruptcy: lei 434.7 bln. (9.4% of pay-out amount)
Covered amount: H1 2000: lei 54.764.000, H2 2000: lei 65.169.000
Cover ratio – elgible deposits (December 31st, 1999): 0.8%
Factsheet

8
Legal provisions (pay-out): Pay-out period: to start at the latest in 2 months from the official bankruptcy
Pay-out period through the agent bank to be decided by FGDB; it may be extended two times by three months each, upon the NBR’s approval; after that, FGDB carries out the pay-out using its own resources
Legal provisions (financing):
Initial contribution: 1% of the bank’s equity capital
Annual contribution: up to 0.8% of the amount of eligible deposits of individuals
The law gave FGDB the power to increase the annual contribution of a bank up to 1.6% if the bank had pursued risky and unhealthy policies
Special contributions from banks: up to two times the level of the annual contributions
Special contribution: up to 1,6% of the amount of eligible deposits of individuals
Incomes from recovery of FGDB’s claims
Incomes from investment of FGDB’s own resources
Borrowing.
Legal framework

9
Share in the banking as at December 31st, 1999: 0.89% of net assets and 9.28% of equity capitalCovered deposits: lei 2,754.9 bln. (5.5% of the covered deposits in the banking system)Amount paid-out: lei 2,728.9 bln.
Funding:FGDB resourcesBorrowing from NBR: lei 2,000 bln.
Maturity 5 years with 2 years grace periodRepayment in 6 half-year equal installments Drawdown during 12th April – 24th May 2000Interest rate (reset every half-year): 1.67% p.a. – 9.30 % p.a.
Special contributions: equal to annual contributions in 2000
Case study no. 1- Bankcoop
Bankruptcy date Pay-out by agent bank
8th February, 2000 12th April 2000 20th June, 2000
Pay-out by FGDB’s own cashier desk and postal cheques
31st December, 2000
Pay-out timeline

10
Share in the banking system as at December 31st, 1999: 2.17% of net assets and 2.09% of equity capitalCovered deposits: Lei 1,874.8 bln. (3.5% of the covered deposits in the banking system)Amount paid-out: Lei 1,848.7 bln.
Funding:FGDB resourcesBorrowing from NBR: lei 1,500 bln.
Maturity 5 yearsRepayment: yearly, equal installments Drawdown during 5th October – 2nd November 2000Interest rate: flat, 15% p.a.
Special contributions: equal to annual contributions in 2000
Case study no. 2- BIR
Bankruptcy date Pay-out by agent bank
10th July, 2000
9th October, 2000
30th November, 2000
Pay-out by FGDB’s own cashier desk and postal cheques
31st December, 2000
Pay-out timeline
1 month delay because the shareholders
contested the NBR’s decision

11
Structure of funding

12
Stand-by credit lines

13
In 2007 FGDB put in place stand-by credit lines with the member banks:
The agreements were renewed annually during 2007 - 2010
FGDB paid 0.5% commitment fee
The total amount was calculated based on the target ratio and the eligible deposits of the banks
The number of banks was reduced gradually to make their management easier
The purpose of their implementation:
To have emergency funding available
To reduce the burden for banks
the annual contribution rate was reduced from 0.3% in 2006 to 0.1% in 2007 and incresed again from 0.2% in 2009 to 0.3% in 2010 when the stand-by credit lines were given up
Contingency funding – stand-by credit lines

14
Stand-by credit lines’ impact
210179
226
172
299 303
387
296
0
50
100
150
200
250
300
350
400
01/01/2007 01/01/2008 01/01/2009 01/01/2010
resources amount (million EUR)
stand-by credit lines (million EUR)
33 banks 32 banks 7 banks 10 banks
1.21.0
0.80.8
2.62.3
1.51.5
0
0.5
1
1.5
2
2.5
3
01/01/2007 01/01/2008 01/01/2009 01/01/2010
cover ratio own resourcescover ratio including stand-by credit lines
15
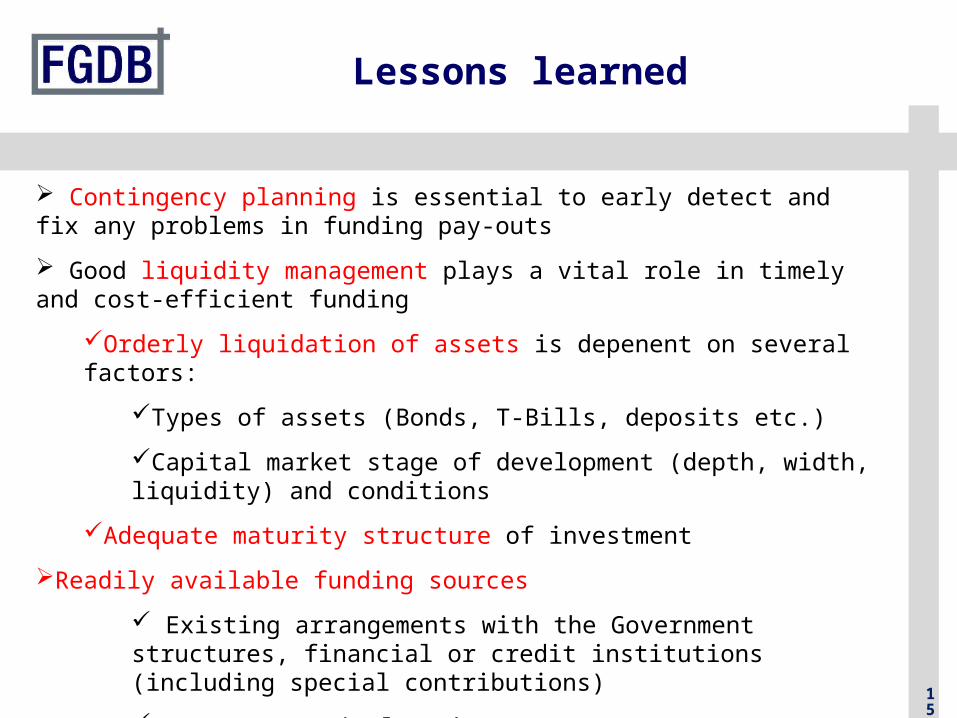
Contingency planning is essential to early detect and fix any problems in funding pay-outs
Good liquidity management plays a vital role in timely and cost-efficient funding
Orderly liquidation of assets is depenent on several factors:
Types of assets (Bonds, T-Bills, deposits etc.)
Capital market stage of development (depth, width, liquidity) and conditions
Adequate maturity structure of investment
Readily available funding sources
Existing arrangements with the Government structures, financial or credit institutions (including special contributions)
Access to capital market
Cost/benefit analysis of alternative sources of funding (if possible)
Lessons learned

16
Contingency funding: Back to the future?
Funding source
Past law
Current law*
Directive 2014/49/EU Comments
Special contributions
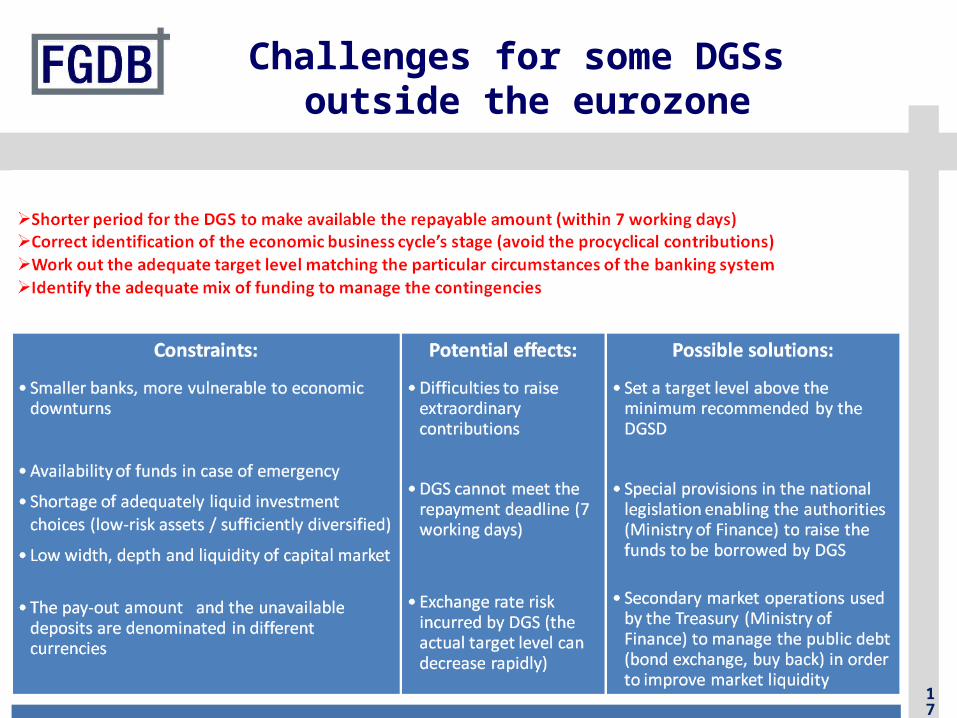
√ √ √ Extraordinary contributions not exceeding 0.5% of the DGS’s covered deposits per calendar year; in exceptional circumstances and upon consent of competent authority, higher extraordinary contributions can be raised.
Borrowing √ √ √ DGSs shall have in place adequate alternative funding arrangements to enable them to obtain short-term funding to meet the claims against them.A DGS is entitled to an amount equal to the amount of the mandatory contributions up to the target level, which the MS will make immediately available to that DGS upon request for use exclusively for the purposes set out in Article 11 (if the competent authority considers that the DGS cannot raise extraordinary contributions). DGS shall repay the amount through contributions from its members.
Payment commitments
X X √ Payment commitments shall not exceed 30% of the total amount of DGS’s available financial means.
Borrowing between DGSs
X X √ They are optional; the amount is capped to 0.5% of the covered deposits of the borrowing DGS.
* The new DGS law to transpose the DGSD in the local legislation has not been adopted yet.
17
Challenges for some DGSs outside the eurozone

Annexes
20
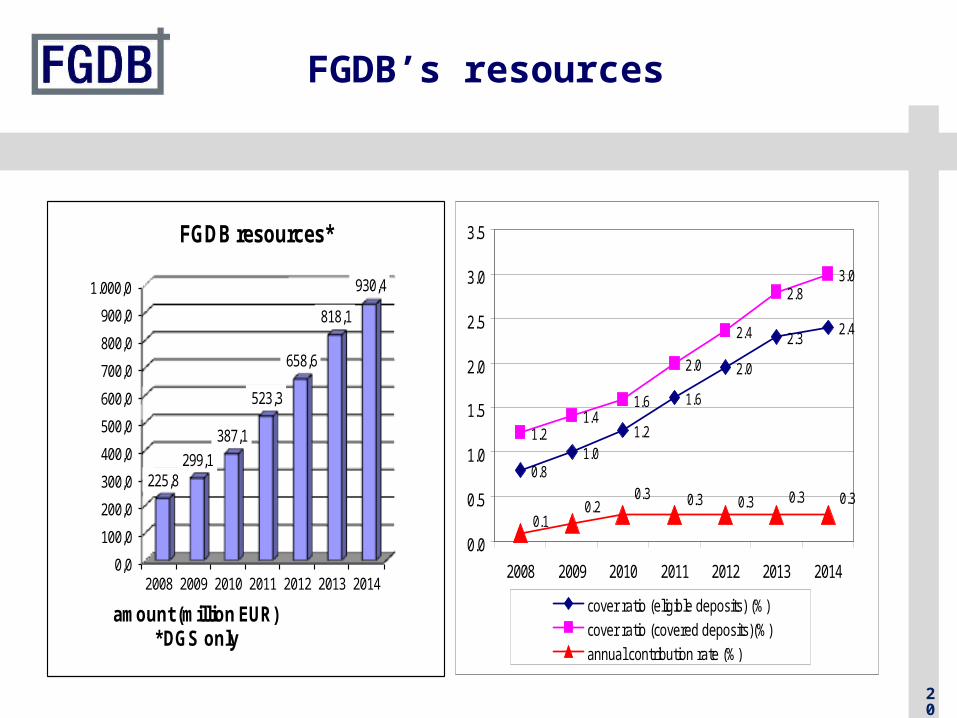
FGDB’s resources
0,0
100,0
200,0
300,0
400,0
500,0
600,0
700,0
800,0
900,0
1.000,0
2008 2009 2010 2011 2012 2013 2014
225,8299,1
387,1
523,3
658,6
818,1
930,4
amount (million EUR)* DGS only
FGDB resources*
0.81.0
1.2
1.6
2.0
2.32.4
1.21.4
1.6
2.0
2.4
2.83.0
0.30.30.30.30.30.2
0.1
0.0
0.5
1.0
1.5
2.0
2.5
3.0
3.5
2008 2009 2010 2011 2012 2013 2014
cover ratio (eligible deposits) (%)
cover ratio (covered deposits)(%)
annual contribution rate (%)

21
FGDB’s borrowing rates – a comparison
40.3
17.1 15.9
34.2
25.6
19.24
9.3 8.73 7.55.05 4.08
1.67 1.95 2.38 2.42 2.03
8.711.113.1
19.8
25.1
31.2
44.9
18.4 19.1 21.3
10.75
35
3535
15.0 15.0 15.0 15.015.0 15.0 15.0
15.0 15.015.0
0
5
10
15
20
25
30
35
40
45
50
annualized inflation rate (%) NBR official rate (%) FGDB interest rate (%) BIR FGDB interest rate (%) Bankcoop

Impact of RON/EUR adverse movement on FGDB’s cover ratio

Net profit / lossin Romanian banking system