Embed Size (px)
Citation preview

RESEARCH ARTICLE
Context effects in haptic perception of roughness
Mirela Kahrimanovic Æ Wouter M. Bergmann Tiest ÆAstrid M. L. Kappers
Received: 2 October 2008 / Accepted: 19 December 2008 / Published online: 21 January 2009
� The Author(s) 2009. This article is published with open access at Springerlink.com
Abstract The influence of temporal and spatial context
during haptic roughness perception was investigated in two
experiments. Subjects examined embossed dot patterns of
varying average dot distance. A two-alternative forced-
choice procedure was used to measure discrimination
thresholds and biases. In Experiment 1, subjects had to
discriminate between two stimuli that were presented
simultaneously to adjacent fingers, after adaptation of one
of these fingers. The results showed that adaptation to a
rough surface decreased the perceived roughness of a
surface subsequently scanned with the adapted finger,
whereas adaptation to a smooth surface increased the per-
ceived roughness (i.e. contrast after effect). In Experiment
2, subjects discriminated between subsequent test stimuli,
while the adjacent finger was stimulated simultaneously.
The results showed that perceived roughness of the test
stimulus shifted towards the roughness of the adjacent
stimulus (i.e. assimilation effect). These contextual effects
are explained by structures of cortical receptive fields.
Analogies with comparable effects in the visual system are
discussed.
Keywords Tactile � Temporal adaptation �Spatial induction � After effect � Assimilation
Introduction
Relevant information that we receive from our environ-
ment must be processed while a large amount of irrelevant
information stimulates our senses. The concept of how
contextual information influences perception is important
for the study of perception and cognition. The large num-
ber of studies concerning contextual influences on
perception in, for example, the visual domain emphasizes
the importance of this concept (e.g. Adelson 1993; Cao and
Shevell 2005; Ware and Cowan 1982; Webster et al. 2002).
In the haptic modality, this concept has received less
attention. However, during daily exploration by touch, we
often perceive a particular object after having been in
contact with some other object(s), or we explore different
materials with different parts of the hand at the same time.
Hence, the context in which haptic perception takes place
may influence the perceptual experience. The current study
was designed to investigate these contextual influences in
the haptic perception of textured surfaces. These influences
can roughly be subdivided into temporal and spatial
influences of the context.
Temporal context
Roughness is one texture property that has been studied in
some detail. Tactile roughness perception has been related
to physical characteristics of the surface, like the spacing
between and the height of surface elements (e.g. Connor
et al. 1990; Connor and Johnson 1992; Lederman 1981;
Lederman 1983; Lederman and Taylor 1972). Further-
more, studies addressing the neural codes underlying the
sensation of tactile roughness showed that subjective
roughness is related to spatial variations in the firing rate
of slowly adapting type I (SAI) mechanoreceptive
M. Kahrimanovic (&) � W. M. Bergmann Tiest �A. M. L. Kappers
Physics of Man, Universiteit Utrecht,
Padualaan 8, 3584 CH Utrecht, The Netherlands
e-mail: [email protected]
123
Exp Brain Res (2009) 194:287–297
DOI 10.1007/s00221-008-1697-x
neurons (Blake et al. 1997; Connor et al. 1990; Connor
and Johnson 1992).
Some ideas about the influence of temporal context in
the perception of textured surfaces can be deduced from
studies investigating the contribution of vibratory adapta-
tion to roughness perception. Lederman et al. (1982)
showed that the perceived magnitude of supraliminal
vibrotactile signals decreased after adaptation to vibrations.
More recently, Hollins et al. (2001) found that adaptation
to vibrotactile signals disrupted the discrimination of very
fine textured surfaces (spatial period \ 200 lm). Further-
more, it has been shown that this type of adaptation had no
effect on roughness perception of coarse surfaces, like
metal gratings (Lederman et al. 1982) and dotted patterns
with spatial periods above 200 lm (Hollins et al. 2001).
Also, when adapting to a spatially textured surface instead
of vibrotactile stimuli, no adaptation effects with coarse
surfaces were found (Hollins et al. 2006).
However, DiCarlo et al. (1998) suggested that texture
adaptation effects should be present in the case of coarse
surfaces. They used random dot stimuli to study the
structure of receptive fields in area 3b of the somatosensory
cortex. The results revealed that most of these receptive
fields have one or two inhibitory regions flanking a region
of excitation. This resembles structures in the primary
visual cortex, where many simple cells also have receptive
fields with an excitatory region surrounded by flanking
inhibitory areas (Hubel and Wiesel 1962). If the structures
are highly similar, then this could indicate that cells from
different brain areas represent information in analogous
ways. Visual cortex cells are highly susceptible to adap-
tation (Blakemore et al. 1973; Jones and Palmer 1987).
Adaptation causes a shift in the neuronal tuning of these
visual neurons away from the level of the adapted value.
Examples of such shifts have been found for dimensions
like contrast (Carandini et al. 1997) and orientation (Dragoi
et al. 2000).
Hence, if analogous processing of information occurs
within different modalities, it should be expected that
somatosensory and visual neurons should also show com-
parable adaptation effects. Consequently, texture adaptation
should influence the perceived roughness of coarse sur-
faces, in apparent contrast to what Hollins et al. (2006)
found. Their stimuli consisted of regular dot patterns with
relatively small distances between dots, whereas DiCarlo
et al. (1998) used random dot patterns with much larger
average distances between dots. It could be that the regular
patterns with smaller dot distances are not appropriate for
activating the neuron types described by Dicarlo et al.
(1998); therefore, no adaptation effects were found in the
Hollins et al. (2001)’s study. Another possibility is that the
adaptation pattern used by Hollins was too weak to cause
significant adaptation effects.
In the first experiment of the current work, we used
random dot patterns with relatively large average distances
between dots and assumed that they will appropriately
activate the neurons that are susceptible to adaptation.
Subjects were asked to discriminate between the roughness
of two surfaces presented simultaneously to two adjacent
fingers, after adapting one of these fingers to a textured
surface. It is hypothesized that texture adaptation will
change the response patterns of neurons, resulting in
changed perceived roughness of a subsequently perceived
surface.
Spatial context
Besides temporal adaptation effects, another frequently
studied concept in vision is the influence of spatial context
on perception. An example is chromatic induction in the
perception of colour (e.g. Cao and Shevell 2005; Shevell
and Wei 2000; Webster et al. 2002). In these studies,
observers had to judge the perceived colour of test surfaces,
while simultaneously viewing inducing backgrounds
composed of different colours. Two different types of
induction were demonstrated: contrast and assimilation.
Contrast occurs when the perceived appearance of the test
shifts away from the appearance of the inducing stimulus;
assimilation occurs when the appearance of the test shifts
towards the appearance of the inducer. It has been proposed
that factors like spatial frequency (Smith et al. 2001),
luminance contrast, width of the inducing ring and recep-
tive-field organization (Cao and Shevell 2005) play an
important role in the transition from chromatic assimilation
to chromatic contrast.
In the haptic modality, spatial context can be described
as the interaction of information simultaneously received
from different parts of the hand or, more specifically, from
different fingers. Using sandpaper as stimuli, Dorsch et al.
(2001) showed that when two fingers scanned surfaces with
different grit numbers, the grit number presented to the
non-attended finger had no effect on perceived roughness
with the attended finger. This result suggests that there is
no interaction between signals from different fingers and,
hence, no influence of the spatial context on roughness
perception.
However, studies using magnetoencephalography
(MEG) and microelectrode recordings demonstrated inter-
actions between finger representations. Researchers found
multi-finger or wide-field receptive fields, which cover
more than one finger, in area 1 neurons of the primary
somatosensory cortex as well as in the medial part of the
cortical finger region (Biermann et al. 1998; Forss et al.
1995; Iwamura et al. 1983). In general, these studies found
an inhibition effect of the cerebral signal when multiple
fingers were stimulated by mechanical stimulations of
288 Exp Brain Res (2009) 194:287–297
123

high-level intensities. When using low-level stimulations,
which are more representative of the signals that we
receive from our natural environment, the input from two
fingers produced additive or facilitatory interactions in the
early component of the cerebral potential (Gandevia et al.
1983). Furthermore, a number of studies have demon-
strated the existence of multi-finger receptive fields in areas
of the second somatosensory cortex (Fitzgerald et al. 2006;
Sinclair and Burton 1993). Together, these results suggest
that spatial context should influence perception. The fact
that no interactions were found in the experiment by
Dorsch et al. (2001) could be due to their use of sandpaper
as stimuli. As argued by Hollins et al. (2006), the use of
abrasive papers can cause damage to the skin and therefore
alter the biophysical response to the stimuli. Consequently,
it is not possible to draw consistent conclusions about
the influences of spatial context on haptic roughness
perception.
Our second experiment was designed to shed new light
on spatial contextual influences in the haptic perception of
roughness. The integration of information received from
different fingers when scanning textured surfaces was
investigated. Subjects were asked to discriminate between
successively scanned surfaces while an adjacent finger
was simultaneously scanning another surface varying in
roughness. Based on neurophysiological studies concerning
multi-finger receptive fields, we hypothesize that roughness
information received from adjacent fingers will cause
interaction effects. These effects will likely resemble
chromatic assimilation rather than contrast effects, as
Gandevia et al. (1983) has shown that low-level stimuli
produces additive interactions.
General methods
Subjects
Ten subjects (six female and four male, mean age
20.2 years) participated in both experiments. To control for
order effects, five subjects performed Experiment 1 before
Experiment 2, and the other five participated in the reverse
order. Nine subjects were strongly right-handed, and one
was strongly left-handed, as established by Coren’s handed-
ness questionnaire (Coren 1993). All subjects were
experimentally naı̈ve and were paid for their participation.
Before starting the first experiment, they provided written
informed consent.
Stimuli
The stimuli used in both experiments were a set of
embossed dot surfaces. The dot patterns were embossed on
paper (weight 160 g/m2) using an Emprint Braille Embos-
ser (ViewPlus Technologies, emboss printing resolution 20
dots/inch). Each pattern was then pasted on 2.6 mm-thick
cardboard. It was necessary that the physical characteristics
of the dots, especially the height profile, remained constant
during the experiment. Therefore, every new condition of
every subject began with a new stimulus set.
A total of 12 different patterns were constructed. Each
pattern consisted of a specific part of 5.08 9 5.08 mm.
This part was repeated 5 times in the horizontal and 20
times in the vertical direction, resulting in a 25.4 mm wide
and 101.6 mm long stimulus pattern. One such specific part
was composed of dots (height 0.4 mm, diameter 0.8 mm)
placed in the centres of a regular 4 9 4 grid (Fig. 1a). The
sequence of the 12 different patterns, with decreasing dot
densities, was constructed by repeatedly removing one
random dot from the previous specific part in the sequence
(Fig. 1b). For each pattern, the average centre-to-centre
distance between dots was calculated by taking the square
root of the inverse dot-density. Consequently, for the
complete stimulus set, the average distances between dots
ranged from 1.27 to 2.27 mm.
As previously demonstrated for embossed dot surfaces,
dot spacing correlates with the subjective roughness of
those surfaces (e.g. Chapman et al. 2002; Connor et al.
1990; Connor and Johnson 1992). These studies have
shown a near linear increase in perceived roughness mag-
nitude with increasing dot distances up to 3 mm (Connor
et al. 1990; Connor and Johnson 1992) and in some studies
for even larger distances (Chapman et al. 2002). Connor
et al. (1990) found that the increase in perceived roughness
for these dot distances is preserved for dots with varying
diameter. This relationship is assumed to hold in the
present study, in which the average distances between dots
are smaller than these aforementioned maxima (see
Fig. 1c). To find support for this assumption, a pilot study
was performed in which blindfolded subjects had to order
the patterns from the current study according to their
perceived roughness. This pilot study demonstrated an
increase in perceived roughness with increasing average
distances between dots. Therefore, in the present study, a
stimulus with a small average distance between dots was
marked as a smooth stimulus, while a stimulus with a large
average distance was marked as a rough stimulus.
Experiment 1: temporal context
This first experiment investigates the influence of temporal
context on the haptic perception of roughness. The effect of
two different adaptation levels (i.e. rough and smooth) on
the perceived roughness of a subsequently scanned surface
was studied.
Exp Brain Res (2009) 194:287–297 289
123
Conditions
The experiment included two adaptation conditions and
one control condition. In the ‘‘rough adaptation condition’’,
subjects first adapted their index finger to a rough stimulus.
Then, they were asked to discriminate between the
roughness of a stimulus perceived with the adapted index
finger and the roughness of another surface perceived with
the non-adapted middle finger of the same hand. In the
‘‘smooth adaptation condition’’, the index finger was
adapted to a smooth stimulus before the test phase. In the
control condition, the test phase was not preceded by
adaptation. The rough and smooth adaptation stimuli had
average distances between dots of 2.27 and 1.27 mm,
respectively. As much as 11 test stimuli with average dot
distances ranging from 1.31 to 2.27 mm and a reference
stimulus of 1.61 mm average distance were used. During
the test phase, each combination of a particular test and
reference stimulus was repeated ten times. Consequently,
each condition consisted of 110 trials, resulting in a total of
330 trials for the entire experiment. The two adaptation
conditions lasted approximately 60 min each, while the
control condition was performed within 30 min. Subjects
performed the three conditions on different days and in a
counterbalanced order.
Procedure
Before the experiment started, the participants were
blindfolded to prevent them from using visual information
5.08 mm
0 1 2 3 4 5 6 7 8 9 10 11 121.0
1.2
1.4
1.6
1.8
2.0
2.2
2.4
Increasing roughness
stimulus number
aver
age
dis
tan
ce (
mm
)
a
b
c
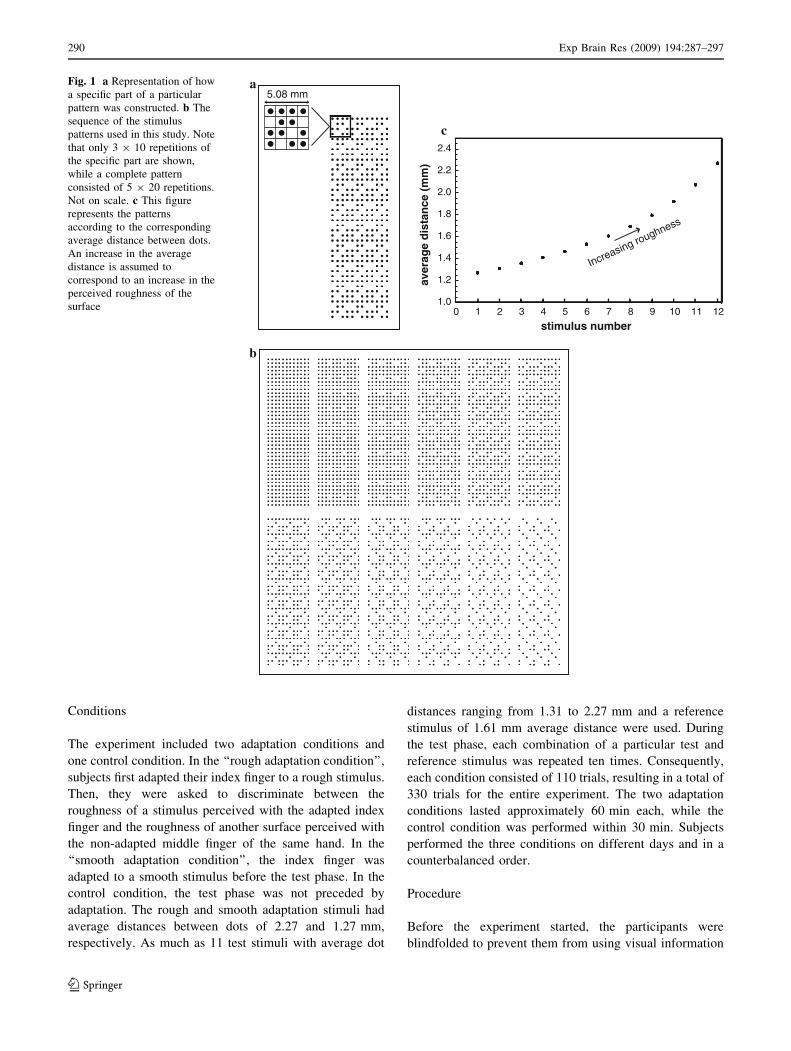
Fig. 1 a Representation of how
a specific part of a particular
pattern was constructed. b The
sequence of the stimulus
patterns used in this study. Note
that only 3 9 10 repetitions of
the specific part are shown,
while a complete pattern
consisted of 5 9 20 repetitions.
Not on scale. c This figure
represents the patterns
according to the corresponding
average distance between dots.
An increase in the average
distance is assumed to
correspond to an increase in the
perceived roughness of the
surface
290 Exp Brain Res (2009) 194:287–297
123
during the experiment. About 25 cm in front of the subject,
a cardboard framework was fixed on the table. The stimuli
could be placed in between the borders of this framework
in such a way that they could not move when the subject
explored them (see Fig. 2). The subjects were instructed to
apply a comfortable level of downward force with the tips
of the index and middle finger and to move with a com-
fortable speed. The required movement was a forward and
backward movement over the stimulus surfaces. Within a
couple of practice trials, this movement pattern was
trained. The subjects were asked to keep this movement
pattern as constant as possible during the experiment. If
large deviations from the trained movements were
observed, instructions were given to correct the movement.
Once the preferred movement pattern was achieved and the
instructions were clear, the experimental runs started.
With regard to the two adaptation conditions, the first
trial was preceded by a pre-adaptation period of 60 s. In
this way, a baseline level of adaptation was established
before the first test trial started. All other test trials were
preceded by an adaptation phase of 20 s. To start the
adaptation, the participant lowered the tip of the index
finger of his/her dominant hand onto the stimulus surface
and moved it over the stimulus surface, as trained during
the practice trials (Fig. 2a). At the end of the adaptation
period, the experimenter gave a vocal signal to stop
adaptation and to move towards the next two stimuli. One
of these stimuli was for the index finger, and the other one
was for the middle finger (Fig. 2b). The position of the test
and reference stimuli (i.e. under index or middle finger) as
well as the order of the different test–reference combina-
tions for each trial were randomized.
Next, the participant simultaneously moved the index
and middle finger forward and backward over the stimuli.
Immediately after completing the exploration, a two-
alternative forced-choice (2AFC) task was conducted; the
subject had to say which of the two stimuli, i.e. the stim-
ulus scanned with the index or middle finger, felt rougher.
After the response, the next adaptation phase began. The
control condition proceeded in the same way, except that
there was no adaptation phase. Hence, the control condition
consisted of only the 2AFC task, which was conducted in
the same way as during the adaptation conditions.
Analysis
The difference between the dot distance values of the
stimuli scanned with the index and middle finger was used
as the independent variable. For all subjects and conditions,
we calculated for each of these differences the fraction with
which the subject selected the stimulus scanned with the
index finger as being rougher compared to the middle
finger stimulus. A cumulative Gaussian distribution (f) as
function of the dot distance differences (x) was fitted to the
data using the following equation:
f ðxÞ ¼ 1
21þ erf
x� l
rffiffiffi
2p
� �� �
;
where r is a measure of the discrimination threshold,
indicating the shallowness of the curve, and l is the
observer’s point of subjective equality (PSE), representing
the location of the curve relative to the point of equal
physical roughness. The discrimination threshold reveals
the sensitivity of the subjects to perceived roughness dif-
ferences within the experiment. The PSE corresponds to
the physical roughness difference between the stimulus
presented to the index finger and the stimulus presented to
the middle finger that are on average judged as being
equal. A shift of the curve in the horizontal direction
can occur when subjects systematically underestimate or
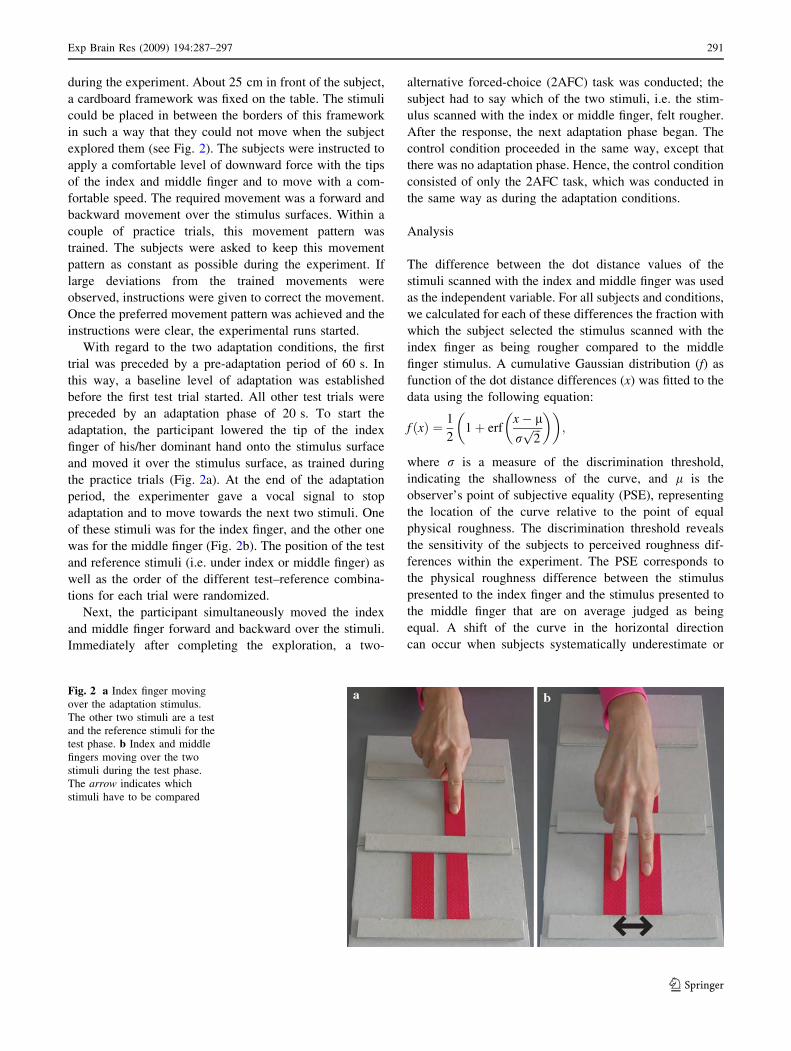
Fig. 2 a Index finger moving
over the adaptation stimulus.
The other two stimuli are a test
and the reference stimuli for the
test phase. b Index and middle
fingers moving over the two
stimuli during the test phase.
The arrow indicates which
stimuli have to be compared
Exp Brain Res (2009) 194:287–297 291
123

overestimate the roughness of the stimulus scanned with
the index finger as compared to the stimulus scanned with
the middle finger. Comparison of PSEs (i.e. the shift of the
curves) under different conditions can reveal a possible
effect of adaptation. Examples of this fitting procedure are
shown in Fig. 3.
To compare the effects of the different adaptation con-
ditions on the PSE, a repeated measures ANOVA was
performed, with condition as the within-subject factor.
Furthermore, the same significance test was performed
with the measured thresholds to determine if there was an
adaptation effect on discrimination ability. If significant
overall effects were found, a paired comparison post hoc
test was performed to reveal pairwise differences. To
correct for multiple comparisons, a Bonferroni adjustment
was done. For all statistic tests, a was set at 5%.
Results
Figure 4 presents the average results for the effect of
texture adaptation on roughness perception. The repeated
measures ANOVA revealed a significant main effect of
adaptation condition (F2,18 = 23.2, P \ 0.001). As shown
in the figure, adaptation to a smooth or rough stimulus
resulted in negative and positive biases, respectively. The
average PSEs for the two adaptation conditions were
-0.09 mm and 0.15 mm, corresponding to 5.3 and 9% of
the average distance between dots of the reference stimu-
lus. The negative bias indicates that the perceived
roughness of the stimulus scanned with the index finger
increased after adapting the index finger to a smooth
stimulus. On the other hand, the positive bias shows that
adapting the index finger to a rough stimulus resulted in a
decrease of the perceived roughness of a subsequently
scanned stimulus. Pairwise comparison showed that
this difference between the two adaptation conditions
was significant at P \ 0.005. Furthermore, significant
differences between the two adaptation conditions and
the control condition were found, with P \ 0.05 and
P \ 0.001 for the smooth and rough conditions,
respectively.
To explore the data in more detail, the complete data set
was divided into a part in which the reference stimulus was
scanned with the index finger and a part in which the
reference stimulus was scanned with the middle finger.
A 3 (condition) 9 2 (position) repeated measures ANOVA
was performed on this data set, to test for significant effects
of stimulus position. However, the effect of position was
not significant (F1,9 = 2.39, P = 0.16). Therefore, there
was no need to distinguish between the locations of the
reference stimulus in the data analysis.
0.2
0.4
0.6
0.8
1
Fra
ctio
n in
dex
ro
ug
her
-0.8 -0.6 -0.4 -0.2 0 0.2 0.4µ
Index - Middle (mm)
data points fitted curve
0.2
0.4
0.6
0.8
1
Fra
ctio
n in
dex
ro
ug
her
-0.8 -0.6 -0.4 -0.2 0 0.2 0.4
Index - Middle (mm)
data points fitted curve
µ
a b
Fig. 3 Two examples of a psychometric function fitted to the data of
a single subject. A data point shows, for a particular roughness
difference, the fraction of times the subject judged the stimulus
presented to the index finger as rougher than the stimulus presented to
the middle finger. The dashed lines indicate the l values. The figures
depict a smooth (a) and a rough (b) adaptation stimulus condition
with negative and positive PSE, respectively
-0.2
-0.1
0
0.1
0.2
Adaptation Condition
PSE
(m
m)
Control Smooth Rough
Fig. 4 Mean points of subjective equality (PSE) for the different
adaptation conditions. The error bars represent the standard errors of
the mean
292 Exp Brain Res (2009) 194:287–297
123
The average discrimination thresholds for the control,
rough adaptation and smooth adaptation conditions were
0.15 (SD 0.01), 0.27 (SD 0.07) and 0.20 mm (SD 0.03),
respectively. A repeated measures ANOVA showed no
significant main effect of condition on these discrimination
thresholds (F2,18 = 2.12, P = 0.15).
Experiment 2: spatial context
The second experiment investigated the spatial contextual
influences on roughness perception. A rough or smooth
inducer stimulus was felt with one finger and its effect on
roughness perception with an adjacent finger was
examined.
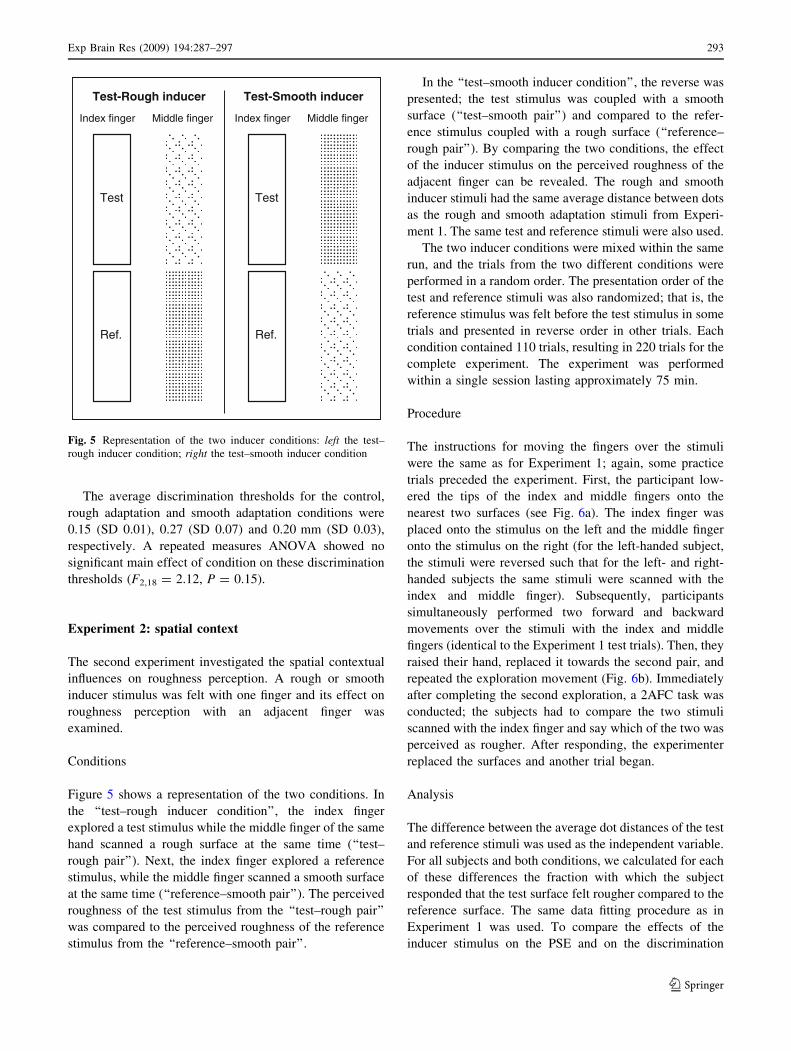
Conditions
Figure 5 shows a representation of the two conditions. In
the ‘‘test–rough inducer condition’’, the index finger
explored a test stimulus while the middle finger of the same
hand scanned a rough surface at the same time (‘‘test–
rough pair’’). Next, the index finger explored a reference
stimulus, while the middle finger scanned a smooth surface
at the same time (‘‘reference–smooth pair’’). The perceived
roughness of the test stimulus from the ‘‘test–rough pair’’
was compared to the perceived roughness of the reference
stimulus from the ‘‘reference–smooth pair’’.
In the ‘‘test–smooth inducer condition’’, the reverse was
presented; the test stimulus was coupled with a smooth
surface (‘‘test–smooth pair’’) and compared to the refer-
ence stimulus coupled with a rough surface (‘‘reference–
rough pair’’). By comparing the two conditions, the effect
of the inducer stimulus on the perceived roughness of the
adjacent finger can be revealed. The rough and smooth
inducer stimuli had the same average distance between dots
as the rough and smooth adaptation stimuli from Experi-
ment 1. The same test and reference stimuli were also used.
The two inducer conditions were mixed within the same
run, and the trials from the two different conditions were
performed in a random order. The presentation order of the
test and reference stimuli was also randomized; that is, the
reference stimulus was felt before the test stimulus in some
trials and presented in reverse order in other trials. Each
condition contained 110 trials, resulting in 220 trials for the
complete experiment. The experiment was performed
within a single session lasting approximately 75 min.
Procedure
The instructions for moving the fingers over the stimuli
were the same as for Experiment 1; again, some practice
trials preceded the experiment. First, the participant low-
ered the tips of the index and middle fingers onto the
nearest two surfaces (see Fig. 6a). The index finger was
placed onto the stimulus on the left and the middle finger
onto the stimulus on the right (for the left-handed subject,
the stimuli were reversed such that for the left- and right-
handed subjects the same stimuli were scanned with the
index and middle finger). Subsequently, participants
simultaneously performed two forward and backward
movements over the stimuli with the index and middle
fingers (identical to the Experiment 1 test trials). Then, they
raised their hand, replaced it towards the second pair, and
repeated the exploration movement (Fig. 6b). Immediately
after completing the second exploration, a 2AFC task was
conducted; the subjects had to compare the two stimuli
scanned with the index finger and say which of the two was
perceived as rougher. After responding, the experimenter
replaced the surfaces and another trial began.
Analysis
The difference between the average dot distances of the test
and reference stimuli was used as the independent variable.
For all subjects and both conditions, we calculated for each
of these differences the fraction with which the subject
responded that the test surface felt rougher compared to the
reference surface. The same data fitting procedure as in
Experiment 1 was used. To compare the effects of the
inducer stimulus on the PSE and on the discrimination
Test
Ref.
Test-Rough inducer Test-Smooth inducer
Index finger Middle finger
Test
Ref.
Index finger Middle finger
Fig. 5 Representation of the two inducer conditions: left the test–
rough inducer condition; right the test–smooth inducer condition
Exp Brain Res (2009) 194:287–297 293
123

thresholds, repeated measures ANOVAs were performed,
with condition as the within-subject factor.
Results
Figure 7 shows the effect of the roughness of an inducer
stimulus scanned with the middle finger on the perceived
roughness of a stimulus scanned simultaneously with the
index finger of the same hand. The average PSEs were
0.10 mm and -0.15 mm for the smooth and rough inducer
conditions, respectively. This corresponds to 6.4 and 9.2%
of the average distance between dots of the reference
stimulus. The repeated measures ANOVA showed a sig-
nificant difference between the smooth and rough inducer
conditions (F1,9 = 16.5, P \ 0.005). As seen in the Fig. 7,
a smooth inducer stimulus on the middle finger caused a
positive bias, meaning that the perceived roughness of the
stimulus scanned simultaneously with the index finger
decreased. The negative bias in the rough inducer condition
indicates that the perceived roughness of the stimulus felt
with the index finger increased when a rough surface was
scanned simultaneously with the middle finger. These
results show that for both conditions, the perceived
roughness of the stimulus felt with the index finger shifted
toward the roughness of the inducer stimulus. The average
discrimination thresholds were 0.10 (SD 0.01) and
0.16 mm (SD 0.04) for the smooth and rough conditions,
respectively. As in Experiment 1, the difference between
these discrimination thresholds was not significant
(F1,9 = 2.85, P = 0.13).
Discussion
The present study investigated the influences of temporal
and spatial context on haptic roughness perception. It was
found that temporal adaptation to a roughly (smoothly)
textured surface resulted in a decrease (increase) of the
perceived roughness of a subsequently scanned surface.
Furthermore, the spatial context exerted its influence by
shifting the perceived roughness of a surface towards the
roughness of a simultaneously scanned inducer stimulus.
These results are important for understanding the mecha-
nisms involved in haptic roughness perception.
Fig. 6 a Index and middle
fingers moving over the first two
stimuli during a trial from
Experiment 2. b Movement
performed during the second
part of the trial. The arrowindicates which stimuli have to
be compared
Smooth Rough-0.25
-0.20
-0.15
-0.10
-0.05
0
0.05
0.10
0.15
0.20
0.25
Inducer Condition
PSE
(m
m)
Fig. 7 Mean points of subjective equality (PSE) for different inducer
conditions. The error bars are the standard errors of the mean
294 Exp Brain Res (2009) 194:287–297
123

Temporal effects
In the first experiment, after scanning a surface for a pro-
longed period of time with the index finger, participants
had to discriminate between the roughness of a surface
scanned with the adapted finger and the roughness of a
surface scanned with an unadapted adjacent finger. The
results showed a temporal context effect. Adaptation to a
rough surface decreased perception of a surface scanned
subsequently with the adapted finger. On the other hand,
adaptation to a smoothly textured surface increased the
perceived roughness of subsequently scanned surfaces.
These texture adaptation effects are in accordance with
results from previous studies showing adaptation after
effects in the haptic modality (Lederman et al. 1982; Van
der Horst et al. 2008; Vogels et al. 2001). These studies
show that adaptation to a physical dimension changes the
perception of a subsequently perceived stimulus. This
change is in the opposite direction to that of the adapting
stimulus. They also proposed that higher levels of pro-
cessing are involved.
The fact that rough and smooth adaptation resulted in
opposite effects indicates that the process involved in
texture adaptation is not simply a peripheral effect. If that
were the case, then scanning either a smooth or rough
surface for a prolonged period of time should cause the
peripheral neurons to be over-stimulated, with the smooth
surface producing relatively less over-stimulation. There-
fore, adaptation to a smooth surface should show an effect
in the same direction as adaptation to a rough surface, with
only a smaller magnitude of that effect. Moreover, if it
were a peripheral effect, then adaptation to a rough stim-
ulus should disturb discrimination performance more than
adaptation to a smooth stimulus. However, no significant
difference between the discrimination thresholds measured
in the three conditions was found, indicating that the ability
of discrimination is not disturbed by adaptation. Therefore,
a peripheral over-stimulation mechanism could not be the
origin for the presented effect. Consequently, these findings
suggest that the texture adaptation effect occurs at a higher
level of processing.
Another relevant point is that adapting the index finger
to a surface may modify the roughness not only of the
stimulus subsequently scanned with the index finger, but
also of the comparison stimulus scanned with the middle
finger. Furthermore, interaction effects are possible
between the signals received from the index and middle
fingers when they were simultaneously scanning a stimulus
during the test phase. These confounding factors can result
in a decrease of the biases. However, the present experi-
ment revealed highly significant effects regardless of these
confounding factors. This shows that the presented effects
are quite robust.
The results of this study indicate that the spatial pattern
is already processed further before the effect is manifested.
The neurons that code for roughness magnitude likely
adapt to the roughness of the scanned surface. This finding
can be explained by structures of the receptive fields of
neurons in the somatosensory cortex. As stated in ‘‘Intro-
duction’’, it has been shown that cells in the somatosensory
and visual cortex have comparable receptive field struc-
tures (Dicarlo et al. 1998; Hubel and Wiesel 1962). Visual
cortex cells show strong adaptation effects (e.g. Blakemore
et al. 1973; Carandini et al. 1997; Dragoi et al. 2000;
Jones and Palmer 1987). Therefore, we suggest that if the
somatosensory cells are stimulated with appropriate sti-
muli, they should show comparable adaptation effects, and
texture adaptation effects on roughness perception should
be found. This was indeed the case. Furthermore, the cor-
relation between our findings and those of Dicarlo et al.
(1998) implies that our stimuli, random dot patterns with
relatively large distances between dots, are appropriate
stimuli for these adaptation neurons. Probably, these neu-
rons do not respond in the same way to patterns with
smaller dot distances, as those used by Hollins et al. (2006),
or these patterns are too weak to cause significant adapta-
tion effects. In general, the texture adaptation effect
presented here supports the argument that visual and haptic
modalities have similar structures and functions.
Spatial effects
The second experiment was based on the spatial influences
of the context during haptic roughness perception. Partic-
ipants had to discriminate between the roughness of two
successively scanned surfaces while scanning a smooth or
rough surface with an adjacent finger. The results showed
that the perceived the roughness of a surface scanned with
the index finger changed in the direction of the inducer
stimulus; e.g. a smooth surface felt smoother (rougher)
when perceived in the context of a smooth (rough)
stimulus.
This spatial contextual effect supports findings from
neurophysiological studies, which show that integration of
information received from different fingers occurs along
the processing pathway (Biermann et al. 1998; Forss et al.
1995; Gandevia et al. 1983; Iwamura et al. 1983). In
addition, the present results show that this integration effect
is also visible when natural stimuli are used and explored
actively. This contrasts with the results from the study by
Dorsch et al. (2001), where exploration of abrasive papers
with two fingers did not result in any integration effects;
however, the use of abrasive papers could have influenced
their result.
The shift in perceived roughness of the adjacent stimu-
lus resembles the visual assimilation effect, which also
Exp Brain Res (2009) 194:287–297 295
123

occurs when the appearance of the test shifts towards the
appearance of the inducer (e.g. Cao and Shevell 2005;
Smith et al. 2001). Some neural mechanisms are proposed
to account for observed assimilation effects in the visual
domain (Cao and Shevell 2005; De Weert and Van
Kruysbergen 1997; Shevell and Wei 2000). One suggested
mechanism is spatial averaging of the neural signals in
combination with the size of the receptive fields. During
presentation of stimuli composed of a test and inducer
rings, only the stimuli containing smaller inducer rings
results in assimilation. It has been proposed that if neural
spatial summation occurs in the centres of the centre-sur-
round receptive fields and the inducer rings are small
enough to fall within the centre of the receptive field that
also registers the test stimulus, then an assimilation effect
will occur. The spatial contextual effect in haptic rough-
ness perception could be explained by a comparable
mechanism in which signals from the index finger and from
the inducer middle finger both fall within the centre of the
same receptive field, producing the assimilation effect.
These receptive fields could be the multi-finger receptive
fields that were found at the level of the somatosensory
cortex where integration of information received from
different fingers occurs (Biermann et al. 1998; Fitzgerald
et al. 2006; Forss et al. 1995; Iwamura et al. 1983; Sinclair
and Burton 1993).
Conclusion
The results from the present two experiments show strong
effects of context during haptic perception of roughness.
Temporal adaptation causes roughness perception to shift
away from the roughness of the adaptation stimulus (i.e.
contrast after effect), while simultaneous stimulation of
the fingers causes the perception to shift towards the
adjacent stimulus (i.e. assimilation effect). Although these
effects seem contradictory, we can explain them using
comparable mechanisms. We suggest that these effects do
not manifest themselves at a lower, peripheral level of
processing, but rather that high-level mechanisms are
involved. Structures of the cortical receptive fields are
proposed as an explanation for the temporal as well as
spatial contextual effects. The analogies with comparable
effects in the visual system emphasize the similarities of
the different modalities.
Acknowledgment This research was supported by a grant from The
Netherlands Organization for Scientific Research (NWO).
Open Access This article is distributed under the terms of the
Creative Commons Attribution Noncommercial License which per-
mits any noncommercial use, distribution, and reproduction in any
medium, provided the original author(s) and source are credited.
References
Adelson EH (1993) Perceptual organization and the judgment of
brightness. Science 262:2042–2044
Biermann K, Schmitz F, Witte OW, Konczak J, Freund HJ, Schnitzler
A (1998) Interaction of finger representation in the human first
somatosensory cortex: a neuromagnetic study. Neurosci Lett
251:13–16
Blake DT, Hsiao SS, Johnson KO (1997) Neural coding mechanisms
in tactile pattern recognition: The relative contributions of
slowly and rapidly adapting mechanoreceptors to perceived
roughness. J Neurosci 17:7480–7489
Blakemore C, Muncey JPJ, Ridley RM (1973) Stimulus specificity in
the human visual system. Vision Res 13:1915–1931
Cao D, Shevell SK (2005) Chromatic assimilation: spread light or
neural mechanism? Vision Res 45:1031–1045
Carandini M, Barlow HB, O’Keefe LP, Poirson AB, Anthony
Movshon J (1997) Adaptation to contingencies in macaque
primary visual cortex. Philos Trans R Soc Lond B Biol Sci
352:1149–1154
Chapman CE, Tremblay F, Jiang W, Belingard L, Meftah EM (2002)
Central neural mechanisms contributing to the perception of
tactile roughness. Behav Brain Res 135:225–233
Connor CE, Hsiao SS, Phillips JR, Johnson KO (1990) Tactile
roughness: neural codes that account for psychophysical mag-
nitude estimates. J Neurosci 10:3823–3836
Connor CE, Johnson KO (1992) Neural coding of tactile texture:
comparison of spatial and temporal mechanisms for roughness
perception. J Neurosci 12:3414–3426
Coren S (1993) The left-hander syndrome. Vintage Books, New York
De Weert CMM, Van Kruysbergen NAWH (1997) Assimilation:
central and peripheral effects. Perception 26:1217–1224
Dicarlo JJ, Johnson KO, Hsiao SS (1998) Structure of receptive fields
in area 3b of primary somatosensory cortex in the alert monkey.
J Neurosci 18:2626–2645
Dorsch AK, Hsiao SS, Johnson KO, Yoshioka T (2001) Tactile
attention: subjective magnitude estimates of roughness using one
or two fingers. In: Society for Neuroscience Abstracts, vol 27
Dragoi V, Sharma J, Sur M (2000) Adaptation-induced plasticity of
orientation tuning in adult visual cortex. Neuron 28:287–298
Fitzgerald PJ, Lane JW, Thakur PH, Hsiao SS (2006) Receptive field
(RF) properties of the macaque second somatosensory cortex:
RF size, shape, and somatotopic organization. J Neurosci
26:6485–6495
Forss N, Jousmaki V, Hari R (1995) Interaction between afferent input
from fingers in human somatosensory cortex. Brain Res 685:68–76
Gandevia SC, Burke D, McKeon BB (1983) Convergence in the
somatosensory pathway between cutaneous afferents from the
index and middle fingers in man. Exp Brain Res 50:415–425
Hollins M, Bensmaı̈a SJ, Washburn S (2001) Vibrotactile adaptation
impairs discrimination of fine, but not coarse, textures. Somato-
sens Mot Res 18:253–262
Hollins M, Lorenz F, Harper D (2006) Somatosensory coding of
roughness: the effect of texture adaptation in direct and indirect
touch. J Neurosci 26:5582–5588
Hubel DH, Wiesel TN (1962) Receptive fields, binocular interaction
and functional architecture in the cat’s visual cortex. J Physiol
160:106–154
Iwamura Y, Tanaka M, Sakamoto M, Hikosaka O (1983) Converging
patterns of finger representation and complex response properties
of neurons in area 1 of the first somatosensory cortex of the
conscious monkey. Exp Brain Res 51:327–337
Jones JP, Palmer LA (1987) The two-dimensional spatial structure of
simple receptive fields in cat striate cortex. J Neurophysiol
58:1187–1211
296 Exp Brain Res (2009) 194:287–297
123
Lederman SJ (1981) The perception of surface roughness by active
and passive touch. Bull Psychon Soc 18:253–255
Lederman SJ (1983) Tactual roughness perception: spatial and
temporal determinants. Can J Psychol 37:498–511
Lederman SJ, Taylor MM (1972) Fingertip force, surface geometry,
and the perception of roughness by active touch. Percept
Psychophys 12:401–408
Lederman SJ, Loomis JM, Williams BA (1982) The role of vibration
in the tactual perception of roughness. Percept Psychophys
32:109–116
Shevell SK, Wei J (2000) A central mechanism of chromatic contrast.
Vision Res 40:3173–3180
Sinclair RJ, Burton H (1993) Neuronal activity in the second
somatosensory cortex of monkeys (Macaca mulatta) during
active touch of gratings. J Neurophysiol 70:331–350
Smith VC, Jin PQ, Pokorny J (2001) The role of spatial frequency in
color induction. Vision Res 41:1007–1021
Van der Horst BJ, Duijndam MJA, Ketels MFM, Wilbers MTJM,
Zwijsen SA, Kappers AML (2008) Intramanual and interman-
ual transfer of the curvature after effect. Exp Brain Res
187:491–496
Vogels IMLC, Kappers AML, Koenderink JJ (2001) Haptic after-
effect of successively touched curved surfaces. Acta Psychol
106:247–263
Ware C, Cowan WB (1982) Changes in perceived color due to
chromatic interactions. Vision Res 22:1353–1362
Webster MA, Malkoc G, Bilson AC, Webster SM (2002) Color
contrast and contextual influences on color appearance. J Vision
2:505–519
Exp Brain Res (2009) 194:287–297 297
123