Embed Size (px)
Citation preview

FONT SHOULD BE TIMES NEW ROMAN – FONT SIZE 12. ONLY MAJOR HEADING SHOULD BE IN 14 BOLD
1. Concept of financial management
Financial management is the managerial activity which is concerned with the planning and controlling of the firm’s financial resources. Financial management is the procurement funds and establishes utilization of funds.
There are so many definitions for financial management, one of the important definition is finance is the art and science of managing money.
Finance may be defined as the provision of money at the time where, it is required. Finance refers to the management flows of money through an organization. It concerns with the application of skills in the use and control of money. Different authorities have interpreted the term “Finance” differently. However there are three main approaches to finance.
1. The first approach views finance as to providing of funds needed by a business on most suitable terms. This approach confines finances to the raising of funds and to the study of financial institutions and instruments from where funds can be procured.
2. The second approach relates finance to cash.
3. The third approach views finance is being concerned with rising of funds and their effective utilization.
1

Definition of Financial Management:
Financial Management as practice by corporate firms can be called corporation finance or business finance, Financial Management refers to that part of the management activity, which is concerned with the planning & controlling of firms financial resources. It deals with finding out various sources for raising funds for the firm. The sources must be suitable and economical for the needs of the business. The most appropriate use of such funds also forms a part of Financial Management.
Objective of Financial Management:
Financial Management is concerned with procurement and use of funds. Its main aim is to use business funds in such a way that the firm’s value / earning are maximized there are various alternatives available for using business funds. The pros & cons of various decisions have to look into before making a final selection. Financial Management provides a framework for selecting a proper cause if action and deciding available commercial strategy. The main objective of the business is to maximize the owner economic welfare. These objectives can be achieved by
1. Profit Maximization and 2. Wealth Maximization
Financial goal of the firm should be share holders wealth maximization as reselected in the market value of the firm shares.
It will come through profit maximization. Profit maximization implies that a firm either produces maximum output for a given amount of input, or uses minimum input for producing a given output.
Shareholders wealth maximization means maximizing the net present value of a course of action to shareholders.
Main important finance functions are:
2

Investments decisionFinancing decisionDividend decisionLiquidity decision
The major areas of finance are:
Financial services Corporate finance/ financial management.
Financial services is concerned with the design and delivery of advise and financial products to individuals, business and governments and with in the areas of the banking and related institutions.
Financial management is concerned with the duties of the financial managers in the business firm. Financial management actively manages the financial affairs of any type of the business
2). Need for Fixed Assets Management: -
3

Fixed Assets plays very important role in relating company’s objectives the firms to which capital investment vested on Fixed Assets. These fixed assets are not convertible or not liquid able over a period of time the total owner funds and long-term liabilities are invested in fixed assets.
Since fixed assets playing dominant role in total business the firms has realized the effective utilization of fixed assets. So ration contribution very much in analyzing and utilized properly it effects long term sustainability of the firms which may affect liquidity and solvency and profitability positions of the company. The idle of fixed assets lead a tremendous in financial cost and intangible coat associate to it. So there is need for the companies to evaluate fixed assets performance analysis time to time by comparing with previous performance, Comparison with similar company and comparison with industry standards. So choose a study to conduct on the fixed assets analysis of KESORAM CEMENT using ratio in comparison with previous year performance. The title of the project is analysis on Fixed Assets Management.
3). Objectives of the study:
4

The study is conducted to evaluate fixed assets performance of KESORAM CEMENT.
The study is conducted to evaluate the fixed assets turnover of KESORAM CEMENT INDUSTRIES.
The study is made to know the amount of capital expenditure made by the company during study period.
The study is conducted to evaluate depreciation and method of depreciation adopted by KESORAM CEMENT INDUSTRIES.
The study is conducted to know the amount of finance made by long-term liabilities and owner funds towards fixed assets.
Study is conducted to evaluate that if fixed assets are liquidated. What is the proportion of fixed assets amount will contribute for payment of owner funds and long-term liabilities.
The study is to evaluate whether the fixed assets are giving adequate returns to the company.
5

4). Sources of the data
The data gathering method is adopted purely from secondary sources.
The theoretical content is gathered from eminent texts books and reference and library at Kesoram Cement Industries.
The Financial data and information is gathered from annual reports of the company internal records.
Interpretation, Conclusions and Suggestions are purely based on my opinion and suggestions provided by the project guide
5). Tools used data analysis: The tools used in data analysis are two they are
Trend percentages and Ratio analysis
Trend percentages:
6

In Financial Analysis the direction of changes over a period of years is of initial importance. Time series or trend analyses of ratios are the indicators of the direction of change. This kind of analysis is particularly applicable to the items of profit and loss account. It is advisable that trends of sales and net income may be studies in the light of two factors. The rate of fixed assets expansion or secular trend in the growth of the business and the general price level. It might be found in practice that a number of firms would be shown price level. It might be found in practice that a number of firms would be shown a persistent growth over period of years. But to get a true trend of growth, the sales figure should be adjusted by a suitable index of general prices. In other words, sales figures should be deflated for rising price level. Another method of securing trend of growth and one which can be used instead of the adjusted sales figure or as check on them is to tabulate and plot the output or physical volume of the sales expressed in suitable units of measure. If the general price level is not considered while analyzing trend of growth, it can be mislead the management so they may become unduly optimistic in period of prosperity and pessimistic in dual periods. For trend analysis, the use of index numbers is generally advocated the procedure followed is to assign the numbers 100 to items of the base year and at calculate percentage change in each items of other years in relation to the base year. The procedure may be called as ‘fixed percentage method’
This margin determines the direction of upward or downward and involves the implementation of the percentage relationship of the each statement item means to the same in the base year. Generally the first year is taken as the base year. The figures of the base year are taken as 100 and trend ratios the other year are calculated on the basis of one year. Here an attempt is made to know the growth of total investment and fixed assets of Kesoram Cement Industries for Five years that is 2001-2002 to 2006-2007.
7

Ratio analysis:
Ratio Analysis is a powerful tool of financial analysis. A ratio is defined as “The indicated quotient of two mathematical expression” and as “The relationship between for evaluating the financial position and performance of a firm. The absolute accounting figure reported in financial statement do not private a meaningful understanding of the performance and financial position of a firm. An accounting figure conveys meaning when it is related to some other relevant information. Ratios help to summarize large quantities of financial data to make qualitative judgment about the firm’s financial performance.
6). Importance of the study:
Fixed Assets are the assets, which cannot be liquidates into cash within one year. The large amount of the
8
company is invested in these assets. Every year the company investment is an additional fund in these assets directly or indirectly the survival and other objectives of the company purely depend on operating performance of management in effective utilization of their assets.
Firm has evaluated the performance of fixed assets with proportion of capital employed on net assets turnover and other parameters, which is helpful for evaluating the performance of fixed assets.
7). Methodology adopted:
9

The data used for analysis and interpretation from annual reports of the company that is secondary forms of data. Ratio analysis is used for calculation purpose.
The project is presented by using tables, graphs and with their interpretations. No survey is undertaken (or) observation study is conducted in evaluating “Fixed Assets” performance of KESORAM CEMENT INDUSTRIES
8). Scope:
10

The project is covered of Fixed Assets of KESORAM CEMENT drawn from Annual Report of the company. The fixed assets considered in the project are which cannot be converted into cash with one year. Ratio analysis is used for evaluating fixed assets performance of KESORAM CEMENT INDUSTRIES.
The subject matter is limited to fixed assets it analysis and its performance but not any other areas of accounting, corporate, marketing and financial matters.
9). Limitations:
The study period of 45 days as prescribed by Osmania University.
The study is limited up to the date and information provided by Kesoram Cement and is annual reports.
11

The report will not provide exact Fixed Assets status and position in Kesoram Cement; it may vary from time to time and situation to situation.
This report is not helpful in investing in Kesoram Cement Industries either through disinvestments or capital market.
The accounting procedure and other accounting principles are limited by the company changes in them may vary the fixed assets performance.
INTRODUCTION TO FIXED ASSETS MANAGEMENT:
The selection of various fixed assets required creating the desired production facilities and the decision regards the determination of the level of fixed assets is primarily the task that at the production technical people. The decision relating to fixed assets involves huge funds a long period of time is generally irreversible nature affecting the long term profitability of a concern, an unsound investment decision may prove to be total to the very existence of the organization. Thus, the management of fixed asset is of vital importance to any organization. The process of fixed asset management involves:
12
(i) Selection of most worthy projects or alternative of fixed assets.
(ii) Arranging the requisite funds / capital for the same.
The first important consideration to be acquire only that much amount of fixed assets which will be just sufficient to ensure and efficient running of the business. In some cases it may be economical to buy certain assets in a lot size. Another important consideration to be kept in mind is possible increase in demand of the firm’s product necessarily expansion of its activities. Hence a firm should have that much amount of fixed assets, which could adjust to increase demand.
The third of fixed assets management is that a firm must ensure buffer stocks of certain essential equipment / services to ensure uninterrupted production in these events of emergencies. Sometime, there may be a breakdown in some equipment or services affecting the entire production. It is always better to have some alternative arrangements to deal with such situations. But at the same time the cost of carrying such buffer stock should also be evaluated. Efforts should also be made to minimize the level of buffer stock of fixed assets be encouraging their maximum utilization during learn period, transferring a part of peak period and living additional capacity.
FIXED ASSETS:
Fixed assets are those, which are required and held permanently for a pretty longtime in the business and are used for the purpose of earning profits. This successful continuance of the business depends upon the maintenance of such assets. They are not meant for release in the ordinary course or business and the utility of these remains so long as they are in working order, so they are also know as capital assets. Land and building, plant and
13
machinery, motor vans, furniture and fixture are some examples of these assets.
Financial transactions are recorded in the book keeping in view the going concern aspect of their business unit. It is assumed the business unit has a reasonable expectation of continuing business at a profit for indefinite period of time. It will continue to operate in the future. This assumption provides much of the justification for recoding fixed assets at original cost and depreciating them in a systematic manner without reference to their current realizable value. It is useless to show fixed assets in the balance sheet at their estimated realizable values if there is no immediate expectation of selling them. Fixed resale, so they are shown at their book values (i.e., cost less depreciation provided) and not at their current realizable values.
The market value of a fixed asset may change with the passage of time, but for accounting purpose it continues to be shown in the books at its book value, i.e., the cost at which it was purchased minus depreciation proved up to date.
The cost concept of accounting, depreciation calculated on the basis of historical costs of old assets is usually lower than that of those calculated at current value or replacement value. These results in more profits on paper, which if distributed in full, will lead to reduction of capital.
NEED FOR VALUATION OF FIXED ASSETS:
Valuation of fixed assets is important in order to have fair measure of profit or loss and financial position of the concern.
14

Fixed assets are meant for use for many years. The value of these assets decreases with their use or with time or for other reasons. A portion of fixed assets reduced by use is converted into cash though charging depreciation. For correct measurement of income proper measurement of depreciation is essential, as depreciation constitutes a part of the total cost of production.
ASSETS:
Assets may be described as valuable resources owned by a business, which were acquired at a measurable money cost. As an economic resource, they satisfy three requirements. In the first place, the resource must be valuable. A resource is valuable if (i) it is cash / convertible into cash; or (ii) it can provide future benefits to the operations of the firm. Secondly, the resource must be owned. Mere possession or control of a resource would not constitute an asset; it must be owned in the legal sense of term. Finally, the resource must be acquired at a measureable money cost. In case where an asset is not acquired for cash/promise to pay cash, the test is what it would have cost had cash been paid for it?
Assets have three essential characteristics;
They embody a future benefit that involves a capacity, singly or in combination with other assets, In the case of profit oriented enterprises, to contribute directly or indirectly to future net cash flows, and in the case of nonprofit organizations, to provide services:The entity can control access to the benefit; and, The transaction or event giving rise to the entity’s right to, or control of, the benefit has already occurred. It is not necessary; in the financial accounting sense of the term, for control of access to the benefit to be legally enforceable for a resource to be an asset, provided the entity can control its use by other means.
15

It is important to understand that in an accounting sense an asset is not the same as ownership. In accounting, ownership is described by the term “equity” plus “liability”.The accounting equation relates assets, liability, and owner’s equity:Assets =Liability+ Owner’s Equity is the mathematical structure of the balance sheet.Assets are usually listed on the balance sheet. It has a normal balance sheet. Asset has recorded in debit side of asset account. (I.e. asset account amount appear on the left side of a ledger).
Similarly, in economics an asset is any form in which wealth can be held. Probably the most accepted accounting definition of asset is the one used by the International Accounting Standards Board. The following is a quotation from the IFRS Framework; “An asset is aResource controlled by the enterprise as a result of past events and from which future economic benefits are expected to flow to the enterprise.”
Assets are formally controlled and managed within larger organization via the use of asset tracking tools. These monitor the purchasing, upgrading, servicing licensing and disposal etc., of both physical and non physical assets.
The assets in the balance sheet are listed either in order of liquidity promptness with which they are expected to be converted into cash or in reserve order, that is, fixity or listing of the least liquid (fixed) first followed by others. All assets are grouped into categories, that is, assets with similar characteristics are put in one category. The assets included in one category are different from those in other categories. The standard classification of assets divides them into
(1) Fixed assets, (2) Current assets, (3) Investments, and
16

(4) Other assets.
Tangible fixed assets are those, which have physical existence and generate goods and services. Included in this category are land, building, plants, machinery, furniture, and so on. They are shown in the balance sheet, in accordance with the cost concept, at their cost to the firm at the time they were purchased. Their cost is allocated to /charged against/spread over their useful life. The yearly charge is referred to as depreciation. As a result, the amount Of such assets shown in the balance sheet every year declines to the extent of amount of depreciation charged in that year and by the end of the useful life of the asset it equals the salvage value, if any. Salvage value signifies the amount realized by the sale of the discarded asset at the end of its useful life.
Intangible assets do not generate goods and services directly. In a way, they reflect the rights of the firm. This category of assets comprises patents, copyrights, trademarks and goodwill. They confer certain exclusive rights to their owners. Patents confer exclusive rights to use an invention, copyrights relates to production and sale of literary, musical and artistic works, trademarks represent exclusive right to use certain names , symbols,labels,designs and so on .intangible fixed assets are also written off over period of time.
Intangible fixed assets lack of physical substance and arise from a right granted by the government or another company. Intangibles may be acquired or developed internally. Examples of rights granted by the government are patents, copyrights and trademarks. While an example of a privilege granted by another company is a franchise. Other types of intangibles include organization costs, leasehold improvements, and goodwill. Organization costs are the expenditure incurred in starting a new company. An example would be legal fees. Leasehold improvements are expenditures made by a tenant to his or her
17

leased property, such as the cost of putting up paneling. Goodwill represents the amount paid.
For another business excess of the fair market value of its tangible net assets. For example, if a company paid $1000000 for a company B’s net assets having a fair market value of $ 84000, the amount paid for goodwill is $ 16000. Goodwill can be recorded only when a company purchases another business. The amount paid for the goodwill of a business may be based upon the acquired firm’s excess earnings over other companies in the industry. Internally developed goodwill (e.g., good customer relations) is not recorded in the accounts.
ACCOUNTING FOR INTANGIBLE ASSETS: APB Opinion 17 specifies the requirements for accounting for intangible assets. “Intangible that has been acquired, such as good will, should be recorded at cost. In the event that an intangible is acquired for other than cash, it should be reflected at either the fair market value of the consideration given or the fair market value of the right received, whichever is more clearly evident. Intangibles should not be arbitrarily written off if they still have values.
When identifiable intangibles are internally developed (e.g., patents), they should be recorded as assets and reflected at cost. If they are not identifiable, they should be expensed.
Intangible assets must be amortized over the period benefited not to exceed 40 years. Amortization is a term used to describe the systematic write-off to expense of an intangible asset’s cost over its economic life. The straight-line method of amortization is used. The amortization entry is
Amortization expense - Dr To Intangible asset
The credit is made directly to the given intangible asset account. However, it would not be incorrect to credit an accumulated amortization account, if desired.
18

Some intangibles have a limited legal life. An example is patents, which have a legal life of 17 years.
DEFERRED CHARGES:
Deferred charges are of a long-term, nonrecurring nature. They are allocated to a number of future periods. Examples are start-up costs and plant rearrangement costs.Deferred charges are customarily listed as the least asset category in the balance sheet since their dollar value is usually insignificant relative to total assets.
OTHER ASSETS:
When noncurrent assets cannot be properly placed into the asset classifications already discussed, they may be included in the Other Assets category. Placement of an item in this classification depends upon its nature and dollar magnitude. However, this classification should be used as a last resort.
COLLECTIBLE ASSETS:
Not surprisingly, periodic disenchantment with returns on marketable securities has led some investors to examine a host of tangible assets that are normally considered only by ‘’collectors’’. The average returns on collectibles such as Chinese ceramics, coins, diamonds, paintings, and stamps have on occasion been quite high, but generally such assets also experience periods of negative returns. This fluctuation is not surprising because if one (or more) type of collectible had provided consistently high returns, many investors would have been attracted to it and would have bid its price up to a level where high returns would no longer have been
19

possible. Indeed, more recent studies of prints and paintings have concluded that their risk and return characteristics make them relatively unattractive investments for risk-averse investors.
In a sense, a collectible asset often provides income to the owner in the form of consumption. For example, an investor can admire a Roberto Clementre rookie baseball Card, sit on a Chippendale chair, gaze upon a Georgia O’ Keefe painting, play a Stradivarius violin, and derive a Stutz Bearcat automobile. Value received in this manner is not subject to income taxation and is thus likely to be especially attractive for those in high tax brackets. However, the value of such consumption depends strongly on one’s preferences.
If markets are efficient, collectible assets will be priced so that those who enjoy them most will find it desirable to hold them in greater than-market-value proportions, whereas those who enjoy them least will find it desirable to hold them in less-than-market-value proportions (or, in many cases, not at all).
Institutional funds and investment pools have been organized to own collectibles of one type or another. These arrangements are subject to serious question if they involve locking such objects in vaults where they cannot be seen by those who derive pleasure from this sort of consumption. On the other hand, if the items are rented to others, the only loss may be that associated with the transfer of a portion of the consumption value to the government in the form of a tax on income.
Investors in collectibles should be aware of two especially notable types of risk. The first is that the bid-ask spread is often very large. Thus an investor must see a large price increase just to recoup the spread and break-even. The second is that collectibles are subject to fads (that risk has been referred to as stylistic risk). For example, Chinese ceramics maybe actively sought by many investors today, leading to high prices and big returns for earlier purchasers. However, they may fall out of favor later on and plunge
20

in value. Unlike financial assets, there is no such thing as fair value for collectibles that can act as a kind of anchor for the market price.
Current Assets The second category of assets included in the balance sheet are current assets. In contrast to fixed assets, they are short-term in nature. They refer to assets/resources, which are either held in the form of cash or ate expected to be realized to cash within the accounting period in the normal operation cycle of the business. The term ‘operating cycle’ means the time span during which cash is converted into inventory, inventory, into receivable/cash sales and receivables into cash. Conventionally, such assets are held for a short period of time, usually not more than a year. These are also know as liquid assets. Current assets include cash, marketable securities, accounts receivable (debtors), notes/bills receivables and inventory.
Cash is the most liquid current asset and includes cash to hand and cash at bank. It provides instant liquidity and can be used to meet obligations/acquire without assets without any delay.
Marketable securities are short-term investments, which are both readily marketable and are expected to be converted into cash within a year. They provide an outlet to invest temporary surplus /idle
Funds/cash : According to generally accepted accounting principles, marketable securities are shown in the balance sheet below the cost or the market price. When, however, show at cost, the current market value is also shown in parenthesis.
21

Accounts receivable represent the amount that the customers owe to the firm, arising from the sale of goods on credit they are shown in the balance sheet at the amount owed less an allowance (bad debts) for the portion which may but be collected.
Notes/bills payable refer to the amounts owned by outsiders for which written acknowledgments of the obligations are available.
Inventory means the aggregate of those items which are (i) held for sale in the ordinary course of business (finished goods), (ii) in the process of production for such sales (work-in-process) or (iii) to be currently consumed in the production of goods and services (raw materials) to be available for sale. It is the least liquid current assets. Included in inventory are raw materials, working process (semi-finished) and finished goods. Each of these serves a useful purpose in the process of production and sale. Inventory is reported in the balance sheet at the cost or market value whichever is lower.
Investments the third category of fixed assets is investments. They represent investments of funds in the securities of another company. They are long-term assets outside the business of the firm. The purpose of such investments is either in earn return or/and to control another company. It is customarily shown in the balance sheet at costs with the market value shown in parenthesis.
Other assets included in this category of assets are what are called a deferred charge that is advertisement expenditure
22

preliminary expenses and so on. They are pre-payments for services/benefits for the periods exceeding the accounting period.
LiabilitiesThe second major content of the balance sheet is liabilities defined as the claims of outsiders that is, other than owners. The assets have to be financed by different sources. One of source of funds is borrowing – long-term as well as short-term. The firms can borrow on a long-term basis from financial institutions/banks or through bonds/mortgages/debentures, and so on. The short-term borrowing may be in the form of purchase of goods and services on credit. These outside sources from which a firm can borrow are termed as liabilities. Since they finance the assets, they are, in a sense, claims against the assets. The amount shown against the liability items is on the basis of the amount owned, not the amount payable. Depending upon the periodicity of the funds, liabilities can be classified into (1) long-term liabilities and (2) current liabilities.
Long-term Liabilities They are so called because the exceeding one year. In other words, such liabilities represent obligations of a firm payable after the accounting period.
Debentures or bonds are issued by a firm to the public to raise debt. A debenture or a bond is a general obligation of the firm to pay interest and return the principal sum as per the agreement. Loan raised through ‘Issue of debentures or bonds may be secured or unsecured.
Secured loans are the long-term borrowings with fixed assets pledged as security. Term loans from financial institutions and commercial banks are secured against the assets of the firm.
23

They have to be repaid/redeemed either in lump sum at the maturity of the loan/debenture or in installments over the life of the loan. Long-term liabilities are shown in the balance sheet net of redemption/repayment.
Current Liabilities In contrast, the long term-liabilities, such liabilities are obligations to outsiders repayable in a short period, usually within the accounting period or the operating cycle of the firm. It can be said to be the counterpart of the current assets. Conventionally, they are paid; out of the current assets; in some cases, however existing current liabilities can be liquidated through the creation of additional current liabilities.
Sundry creditors or accounts payable represent the current liability towards suppliers from whom the firm has purchased raw materials on credit. This liability is shown in the balance sheet till the payment has been made to the creditors.
Bills payable are the promises made in writing by the firm to make payment of a specified sum to creditors at some specific date. Bills are written by creditors over the firm and become bill payable once they are accepted by the firm. Bills payable have a life of less than a year; therefore, they are shown as current liabilities in the balance sheet.
Bank borrowings form a substantial part of current liabilities of a large number of companies in India. Commercial banks advance short-term credit to firms or financing their current assets. Banks advance short-term credit to firms or financing
24
their current assets. Banks may also provide funds (term loans) for a financing a firm’s fixed assets. Such loans will be grouped under long-term liabilities. In India, it is a common practice to include both short and long-term borrowings under loan funds.
Provisions are other types of current liabilities. They include provision for taxes or provision for dividends. Every business has to pay taxes on its income. Usually, it takes some time to finalize the amount of tax with the tax authorities. Therefore, the amount of tax is estimated and shown as provision for taxes or tax liability in the balance sheet. Similarly, provision for paying dividends to shareholders may be created and shown as current liability.
Expenses payable or outstanding expenses are also current liabilities. The firm may owe payments to its employees and others at the end of the accounting period for the services received in the current year. These payments are payable within a very short period. Examples of outstanding expenses are wages payable, rent payable, or commission payable.
Income received in advance is yet another example of current liability. A firm can sometimes receive income for gods or services to be supplied in the future. As goods or services have to be provided within the accounting period, such receipts are shown as current liabilities in the balance sheet.
Installment of long-term loans are payable periodically. That portion of the long-term loan which is payable in the current year will for part of current liabilities.
Deposits from public may be raised by a firm for financing its current assets. These may therefore classified under
25

current liabilities. It may be noted that public deposits may be raised for duration of one year through three years.
How should the changing value of a fixed asset be reflected in a company’s accounts?
The benefits that a business obtains from a fixed asset extend over several years. For example, a company may use the same piece of production machinery for many years, whereas a company-owned motor car used by a salesman probably has a shorter useful life.By accepting that the life of a fixed asset is limited, the accounts of a business need to recognize the benefits of the fixed asset as it is “consumed” over several years. This consumption of a fixed asset is referred to as depreciation.
Definition of depreciation: Financial Reporting Standard 15 (covering the accounting for tangible fixed assets) defines depreciation as follows:
“The wearing out, using up or other reduction in the useful economic life of a tangible fixed asset whether arising from use effusion of time or obsolescence through either changes in technology or demand for goods and services produced by the asset.” A portion of the benefits of the fixed asset will be used up or consumed in each accounting period of its life in order to generate revenue. To calculate profit for a period, it is necessary to match expenses with the revenues they help earn. In determining the expenses for a period, it is therefore important to include an amount to represent the consumption of fixed assets during that period (that is, depreciation). In essence, depreciation involves allocating the cost of the fixed asset (less any residual value) over its useful life. To calculate
26

the depreciation charge for an accounting period, the following factors are relevant:-The cost of the fixed asset;-The (estimated) useful life of the asset;-The (estimated) residual value of the asset.
What is the relevant cost of a fixed asset?
The cost of a fixed asset includes all amounts incurred to acquire the asset and any amount that can be directly attributable to bringing the asset into working condition.Directly attributable cost may include:-Delivery costs-Costs associated with acquiring the asset such as stamp duty and import duties-Costs of preparing the site for installation of the asset-Professional fees, such as legal fees and architects’ fees
Note that general overhead costs or administration costs would not costs of a fixed asset (e.g. the cost of the factory building in which the asset is kept, or the cost of the maintenance team who keep the asset in good working condition)
The cost of subsequent expenditure on a fixed asset will be added to the cost of the asset provided that this expenditure enhances the benefits of the fixed asset or restores any benefits consumed.
This means that major improvements or a major overhaul may be capitalized and included as part of the cost of the asset in the accounts.
However, the costs of repairs or overhauls that are carried out simply to maintain existing performance will be treated as expenses
27

of the accounting period in which the work is done, and charged in full as an expense in that period.
DEPRECIATION AND SALVAGE VALUE:
Although the useful life of equipment (a fixed asset) may be long, it is nonetheless limited. Eventually the equipment will lose all productive worth and will possess only salvage value (Scrap value). Accounting demands a period-by-period matching of costs against income. Hence, the cost of a fixed asset (over and above its salvage value) is distributed over the asset’s estimated lifetime. This spreading of the cost over the periods which receive benefits is known as depreciation.
The depreciable amount of a fixed asset – that is, cost minus salvage value – may be written off in different ways. For example, the amount may be spread evenly over the years affected as in the straight-line method. The units of production method bases depreciation for each period on the amount of output. Two accelerated methods, the double declining balance method and the sum-of-the year’s and digit’s method, provide for greater amounts of depreciation in the earlier years.
DEPRECIATION METHOD:
1. STRAIGHT-LINE METHOD
This is the simplest and most widely used depreciation method. Under this method an equal portion of the cost (above salvage value) of the asset is allocated to each period of use. The periodic depreciation charge is expressed as
Cost – Salvage Value
28

--------------------------= Depreciation Estimated life
2. UNITS OF PRODUCTION METHOD
Where the use of equipment varies substantially from year to year, the units-of-production. This Method is appropriate for determining the depreciation. For example, in some year logging operations may be carried on for 200 days, in other years for 230 days, in still other years for only 160 days, depending on weather conditions. Under this method, depreciation is computed for the appropriate unit of output or production (such as hours, miles, or pounds) by the following formula:
Cost – Salvage = Unit DepreciationEstimated units of production during lifetime
The total number of units used I a year is the multiplied by the unit depreciation to arrive at the depreciation amount for that year.
We can express this as
Unit depreciation × usage = depreciation
Cost - Salvage ________________ × usage = depreciationEstimated life (in units)
This method has the advantage of relating depreciation cost directly to income.
29

3. DOUBLE DECLINING BALANCE METHOD:
The double declining balance method produces the highest amount of depreciation in the earlier years. It does not recognize salvage or scrap values. Instead, the book value of the asset remaining at the end of the depreciation period becomes the salvage or scrap value. Under this method, the straight-line rate is doubled and applied to the declining book balance each year. Many companies prefer the double declining balance method because of the greater “write-off” in the earlier years, a time when the asset contributes most to the business and when the expenditure was actually made.
The procedure is to apply a fixed rate to the declining book value of the asset each year. As the book value declines, the depreciation becomes smaller.
100%
×2 = Depreciation rateEstimated life in years
4. SUM-FO-THE-YEAR’S AND DIGIT’S METHOD
With this method, the years of asset’s lifetime are labeled 1, 2 and 3 and so on, and the depreciation amounts are based on a series of fractions that have the sum of the years, digit as their common denominator. The greatest digit assigned to a year is used as the numerator for the first year, the next greatest digit for the second year, and so forth.
What is the Useful Life of a fixed asset?
30

An asset may be seen as having a physical life and an economic life. Most fixed assets suffer physical deterioration through usage and the passage of time. Although care and maintenance may succeed in extending the physical life of an asset, typically it will, eventually, reach a condition where the benefits have been exhausted. However, a business may not with to keep an asset until the end of its physical life. There may be a point when it becomes uneconomic to continue to use the asset even though there is still some physical life left. The economic life of the asset will be determined by such factors as technological progress and changes in demand. For purposes of calculating depreciation, it is the estimated economic life rather than the potential physical life of the fixed asset that is used.
What about the Residual Value of a fixed asset?
At the end of the useful life of a fixed asset the business will dispose of it and any amounts received from the disposal will represent its residual value. This, again, may be difficult to estimate in practice. However, an estimate has to be made. If it is unlikely to be a significant amount, a residual value of zero will be assumed.
31

Product profile
The 85 years old Indian Cement Industry is one of the cardinal and basic infrastructure industries, which enjoys core sector status and plays a crucial role in the economic development and growth of a country. Being a core sector is industry was subject to price and or distribution controls almost uninterruptedly from world war-II to 1982. When the Government of India announced the partial decontrol of prices and decontrol manufacturing cement became increasingly attractive industry and the industry experienced substantial expansion.
As the supply in its response to the 1982 partial decontrol was significant in March 1989. Price and distribution control were finally dispensed with. It was one o the first major industries in the country to be so deregulated.
32

DEFINATION OF CEMENT:
Cement may be defined, as “it is a mixture of calcium silicate and aluminates which have the property of setting and hardening under water the amount of Silica, Alumns which is present in each crust are sufficient to combine with calcium oxide [Cao] to form the corresponding calcium silicate and aluminates.
CLASSIFICATION OF CEMENT:
Cement is three types1) Puzzolantic Cement2) Natural Cement3) Portland Cement
1) Puzzolantic Cement:
It consists of silicates Calcium and Aluminum; it shows the hydralic properties when it is in the form of powder and being mixed with suitable preparation of lime. The rate of hardening is much slower and the comprehensive strength developed is about a half of Portland cement. Is us found more resistant to the chemical action that others.
2) Natural Cement:
This is natural occurring material. It is obtained form cement rocks. These Cement rocks are claying lime stones containing silicates aluminates of calcium. The selling property of this cement is more than the Portland cement but is comprehensive strength is half of its.
3) Portland Cement:
33

a) Ordinary Portland Cementb) Rapid Hardening Portland Cementc) Low Heat Cementd) White Or Colored Cemente) Water Proof Portland Cementf) Portland Slag Cementg) Portland Puzzolana Cement h) Sulphate Resisting Cementi) Oil Well Cement
CEMENT INDUSTRY PROFILE:
Cement is the basic construction material used extensively all over the world. The per capital consumption of cement is universally acknowledged as one of the measure of the country. The per capital consumption of cement in India is estimated at approximately Rs. 57 kg. and India is the third lowest consumer in the world. Thus there is an excellent potential growth of cement industry in India.
Cement was first patented in 1824 in England. In India, the first cement plant was established by Indian cement industrial growth was continuously increased. By 1961, cement production in the country achieved self sufficiency and import of cement was stopped. In August, 1965 the Government accepted the principle to decontrol the prices and distribution of cement. A scheme of decontrol drawn and brought into effect from January 1996 and a cement allocation and coordination organization (CACO) was
34

formed. As the decontrol scheme did not prove to the satisfaction of the Government, CACO was abolished and its functions over by the cement controller attached by the Government Corporation of India Limited. Prices of cement are revised by the Government from time to time based on studies and reports of Bureau of Industrial cost and prices.
INDIAN CEMENT INDUSTRY – PRESENT STATUS:
After the deli censing of the industry in July 1991 it reacted positively to the policy changes. New capacities created and the volume of the production increased. From a situation of importing cement, the country started exporting due to high quality and cost effectiveness. After liberalization the black market in cement also disappeared. Currently INDIA stands second largest in the cement production worldwide after China after India, Japan and USA stands. On the other hand India’s per capital consumption is only 100 Kgs, as compared to the world average of 260 Kgs. The industry has 59 companies owning 115 plants. In the matter of exports, the Government considers cement as extreme focuses are. However Indian cement in the global market is not very competitive due to high power and full costs. In order to improve its position in the international market.
35

Technological up gradation is essential in terms of process up gradation diversification costs reduction quality control and energy savings.
Kesoram cements profile:
Kesoram Cement Industry is one of the leading manufacturers cement in India, incorporated by the promoters of Birla Group Company. It is a dry process cement plant. The plant capacity is 8.26 lakhs tones per annum; it is located at Basanthnagar in Karimanagar Dist. Of Andhra Pradesh which is 8km away from the Ramagundam Railway Station, linking Madras to New Delhi.
The company’s first unit Basanthnagar with a capacity of 2.1 lakhs tones per annum. Humbolds suspension preheater system was commissioned during the year 1969. The second unit was set up in the year 1971 with a capacity 2.1 lakh tones per annum and the third unit with a capacity of 2.5 lakh tones per annum went on stream in the year 1978. The coal for this company is being supplied by Singareni Colonies and the power is obtained forms APSED. The power demand for the factory is about installed in the year 1987.
Kesoram Cement has set up a 15MW captive power plant to facilitate for uninterrupted power supply for manufacturing of cement, which starts on 24th August, 1997.
36

Kesoram Cement Industry distinguished itself all the cement factories in India by bagging the National Productivity Award Consecutively for two years i.e., for the year 1985-86 and 1986-87.
The Federation of Andhra Pradesh Chambers of Commerce and Industries (FAPCCI) also conferred on Kesoram Cement, an Award for Best Industrial promotion / expansion efforts in the state for the year 1984.Kesoram also bagged FAPCCI award for “Best Family Planning Effort in the State” for the year 1987-88.
One among the industrial giants in the country today, serving the nation on industrial front, Kesroram Industries Ltd., has a eventful history dating back to the twenties when the Industrial House of Birla acquired it. With only a Textile Mill under is banner in 1924, it grew form strength and spread its activities to newer fields like Rayon, Spun Pipes, Transparent Paper, Pulp, Tyres, Refectories and other products.
Cement, which plays an important role in Nation Building activity, the Government of India, had de-keened the cement industry in the year 1966 with a view to attract private entrepreneurs to argument the cement production. Then Kesoram decided to set up a few Cement Plants in the Country.
Birla supreme is popular brand of Kesoram Cement from its prestigious plant of Basanthnagar, in A.P., which has outstanding track record in performance and productivity, serving the nation for the last two and half decades. It has proved its distinction by bagging several national awards and state awards. It also has the distinction of achieving optimum capacity utilization. Kesoram offers a choice of top quality Portland cement for light, heavy constructions and allied applications. Quality is built to every fact of the operations. As is the preference for quality, so is the demand for the product. The limestone is rich in calcium carbonate, a key factor that influences the quality of the final product. The dry
37

process technology used in the late computerized monitoring overseas the manufacturing process. Samples are sent regularly to the bureau of Indian Standards, National Council of Construction and Building Material for certification of derived quality norms.
The company has actively undertaken promotional measures for promoting their product through different media, which includes the use off hoardings. A compliment, Newspapers etc., Kesoram Cement is undertaking the marketing activities extensively in the states of Andhra Pradesh, Karnataka, Tamilnadu, Kerala, Maharashtra and Gujarath. In A.P. sales depots are located in different areas like Karimnagar, Warangal,Nizamabad, Vijayawada and Nellore. In other estates it has opened around 10 depots. The market share of Kesoram Cement in the all India Cement market is 1.19% in A.P. it is a 7.05%.
AWARDS:
Kesoram Cement captured various awards including national awards for productivity technology conservation and several state awards.
For the year 1989, Kesoram bagged ‘Best Family Planning Effort in the State’ by the Federation of A.P. Chambers of Commerce & Industry and National Awards for ‘mines safety’ for two successive years 1985-86 & 1986-87. It also bagged the ‘National Award for Energy Efficiency’ for the year 1989090 fir the best performance among all cement plans in India. This award installed by National Council for Cement and Building and Material (NCBM) in association with the department of power, ministry of energy, Govt. of India.
Kesoram bagged the prestigious ‘A.P. State Productivity Award’ in 1987-89, also annexed the state award for industrial Management’ in the state and ‘ vazamany Ratna’ and ’Best Efforts of an Industrial Unit’ in the state to developed ‘Rural Economy’ was
38

bagged for its contribution towards the social responsibility and rural and community development programs.
For the year 1991 it bagged ‘May Day Award’ of the Gove. Of A.P. “Best Management” and the Pandit J.Nehru ‘Silver Rolling Trophy for the Industrial Productivity effort in the State of A.P., by FAPCCI’. The Indira Gandhi Memorial National Award for excellence in industry. ‘Best Management Award’ of the Govt. of A.P. for the year 1993, and it got the prestigious award “ISO-9002” award for its quality.
During the last years the Govt. of A.P. has given the following awards:
Best Management award for the year 1993. Best Industrial Retain Award for the year 1994. Best Industrial Retain award for the year 1995. Environment and Mineral conversation award for the year 1995. To keep the ecological balance, they have also undertaken massive tree plantation in factory and township areas and they have been nominated by Government of India of “VRIKSHAMITRA AWARD”
Best effort of an industrial unit in the state for Rural Development for the year 1994-95, presented by Chief Minister in March, 1996 and Best Family Welfare Award for the year 1996-97.Best Management award for the year 2007.
39

: KESORAM GROUP OF INDUSTRIES:
a) Textiles Kesoram Industries Ltd.,42, Garden Reach Road,Calcutta—700024.
b) Rayon Kesoram Rayon Triennia (PO),
Dist. Hoogly, West Bengal.c) Spun Pipes Kesoram Spun Pipes &
Foundries,Bansberia (PO) Dist. Hoogly,West Bengal.
d) Cement Kesoram Cement,Basanth Nagar – 505187,Dist. Karimnagar – Andhra Pradesh
e) Cement Vasavadatta Cement,Sedam – 585222,Dist. Gulargah – Karnataka.
f) Tyres Burka Tyres,Shiva Chambers,53, Syed Amir Ali Aenue,Calcutta – 700019.
Data analysis and interpretation
40

The firm should evolve strategies regarding the following two facts.
Trend Analysis:-
In Financial Analysis the direction of changes over a period of years is of initial importance. Time series or trend analysis of ratios indicators the direction of change. This kind of analysis is particularly applicable to the items of profit and loss account. It is advisable that trends of sales and net income may be studies in the light of two factors. The rate of fixed expansion or secular trend in the growth of the business and the general price level. It might be found in practice that a number of firms would be shown price level. It might be found in practice that a number of firms would be shown a persistent growth over period of years. But to get a true trend of growth, the sales figure should be adjusted by a suitable index of general prices. In other words, sales figures should be deflated for rising price level. Another method of securing trend of growth and one which can be used instead of the adjusted sales figure or as check on them is to tabulate and plot the output or physical volume of the sales expressed in suitable units of measure. If the general price level is not considered while analyzing trend of growth, it can be mislead management they may become unduly optimistic in period of prosperity and pessimistic in duel periods.
For trend analysis, the use of index numbers is generally advocated the procedure followed is to assign the numbers 100 to items of the base year and at calculate percentage change in each items of other years in relation to the base year. The procedure may be called as ‘fixed percentage method’.
This margin determines the direction of upward or downward and involves the implementation of the percentage relationship of the each statement item beans to the same in the base year. Generally the first year is taken as the base year. The figure of the base year are taken as 100 and trend ratio he other year are calculated on the basis of one year. Here an attempt is made to
41

know the growth total investment and fixed assets of Kesoram Cement Industries for Five years that is 2001-2002 to 2006-2007.
Table-I
YEAR INVESTMENT TREND PERCENTAGE
2001-2002 44,85,21,386 1002002-2003 39,68,35,265 64.252003-2004 24,99,02,930 56.712004-2005 28,19,24,444 62.852005-2006 29,01,51,000 64.692006-2007 28,87,28,000 64.37
Graph:
Interpretation: -
From the analysis of the above table it can be observed that the growth rate of total investment of Kesoram Cement Industries is in downward trend which shows table of the Kesoram Cement
42

Industries investment in total investment is decreasing from time to time during the year 2001-2002. It was recorded 100%. But it is decreasing in the year 2006-2007 which shows that there is a net decrease to 64.37%. The average investment in total assets was found to be Rs. 3, 33,466.27 during the review period. During the period of 2001-2002 it is Rs. 44, 85, 21,389 and it was decreased in the year 2006-2007 Rs.2, 887.2
GROWTH RATE IN FIXED ASSETS:Table – II
YEAR FIXED ASSETS PERCENTAGE
2001-2002 6,25,64,02,879 100
2002-2003 5,89,55,39,377 94.23
2003-2004 5,69,93,08,565 91.09
2004-2005 5,71,48,37,436 91.34
2005-2006 7,43,21,97,000 118.79
2006-2007 11,05,19,01,00 176.64
Graph:
43

Interpretation:
Growth rate in fixed assets, the examination of the above table reveals analysis and interpretation.
A. During the year 2001-2002 the assets investment was recorded at 62564.03 and it is decreased to Rs.1,10,519.01 in 2006-2007 the fixed assets investment is quite satisfactory.
B. The trend percentage in the year 2001-2002 is taken as the base year as 100% and it was increased to 176.64 in the year 2006-2007.
C. The average growth rate in fixed assets Rs.61996.566 in 6 years
RATIO ANALYSIS:
Ratio Analysis is a powerful tool of financial analysis. A ratio is defined as “The indicated quotient of two mathematical expression” and as “The relationship between for evaluating the financial
44

position and performance of a firm. The absolute accounting figure reported in financial statement do not private a meaningful understanding of the performance and financial position of a firm. An accounting figure conveys meaning when it is related to some other relevant information.
Ratios help to summarize large quantities of financial data to make qualitative judgment about the firm’s financial performance.
1. Fixed Assets to Net Worth Ratio:
This ratio establishes the relationship between Fixed Assets and Net Worth.
Net Worth = Share Capital + Reserves & Surplus + Retained Earnings.
Fixed AssetsFixed Assets to Net Worth Ratio = --------------- X 100
Net Worth
This ratio of “Fixed Assets” to “Net Worth” indicates the extent to which shareholder funds are sunk into the fixed assets. Generally, the purchase of fixed assets should be financed by shareholders, equity including reserves & surpluses and retained earnings. If the ratio is less than 100% it implies that owners funds are more than total Fixed Assets and a part of the working capital is provided by the shareholders. When the ratio is more than 100% it implies that owner’s funds are not sufficient to finance the fixed assets and the finance has to depend upon outsiders to finance the fixed assets. There is no “rule of thumb” to interpret this ratio but 60% to 65% is considered to be satisfactory ratio in case of industrial undertaking.
2. Fixed Assets Ratio:
45

This ratio explains whether the firm has raised adequate long term funds to meet its fixed assets requirements and is calculated as under.
Fixed Assets (Assets Depreciation)------------------------------------------ Capital Employed
This ratio gives an idea as to what part of the capital employed has been used in purchasing the fixed assets for the concern. If the ratio is less than one it is good for the concern.
3. Fixed Assets as a percentage to Current Liabilities:
The ratio measures the relationship between fixed assets and the funded debt and is a very useful so the long term erection. The ratio can be calculated as below.
Fixed Assets as a percentage to Current LiabilitiesFixed Assets
= --------------------- Current Liabilities
4. Total Investment Turnover Ratio:This ratio is calculated by dividing the net sales by the value of
total assets that is (Net Sales / Total Investment) or (Sales / Total Investment). A high ratio is an indicator of over trading of total assets while a low ratio reveals idle capacity. The traditional standards for the ratio in two times. SalesTotal investment turnover ratio = ----------------------
46

Total investment
5. Fixed Assets Turnover Ratio:
This ratio expresses the number of times fixed assets are being turned – over is a state period. It is calculated as under:
Sales ------------------------------------------------ Net Fixed Assets (After Depreciation)
This ratio shows low well the fixed assets are being uses in the business. The ratio is important is case of manufacturing concern because sales are produced not only by use of Current Assets but also by amount invested in Fixed Assets the higher ratio, the better is the performance. On the other hand a low ratio indicated that fixed assets are not being efficiently utilized.
6. Gross Capital Employed:
The term “Gross Capital Employed” usually comprises the total assets, fixed as well as current assets used in a business.
Gross Capital Employed = Fixed Assets + Current Assets7. Return on Fixed Assets:
Profit after Tax------------------- X 100Fixed Assets
This ratio is calculated to measure the profit after tax against the amount invested in total assets to ascertain whether assets are being utilized properly or not.
47

The higher the ratio the better it is for the concern.
Fixed Assets to Net Worth:
NET WORTH = Share Capital + Reserves & Surplus + Retained Earning.
If the ratio is less than 100%, it implies that owner funds are more than the fixed assets and a part of working capital is provided by the share holder and vice-versa.
FixeAssets Fixed Assets to Net worth Ratio = --------------- X100
Net Worth
48

Table – III
(Amt in lakhs)YEAR NETWORTH GROSS FIXED
ASSETSRATO IN %
2001-2002 3,38,81.86 6,25,64.03 184.65
2002-2003 3,38,78.40 5,89,55.40 174.02
2003-2004 3,48,48.27 5,69,93.09 163.54
2004-2005 3,77,14.59 5,71,48.38 151.52
2005-2006 41,605.00 74,321.97 178.63
2006-2007 65,443.44 1,10,519.11 168.87
Graph:
49

Interpretation:
a) The Gross Fixed to Net worth Ratio is fluctuating from year to year. In the year 2001-2002 the gross fixed assets to net worth ratio is 184.65. In the year 2006-2007 fixed assets to net worth to acquire the ratio is 168.87.
b) The average net worth to fixed assets ratio i36385.62s Rs. Or fixed assets average ratio is Rs.61996.668 the average percentage of fixed assets to net worth is 168.06.
c) The highest ratio recorded in 2001-2002 at 184.65 the lowest ratio is recorded at 151.52 in the year 2004-2005.
Fixed Assets as a Percentage to Long Term Liabilities:
Fixed Assets ratio is several of fixed assets to net worth is a ratio of fixed assets to long term funds which is calculated as:Fixed assets to long term liabilities =
Fixed Assets (After Depreciation) =-----------------------------------X 100
Capital Employed
Table – IV (Amt in lakhs)
YEAR FIXED ASSETS
LONG TERM
PERCENTAGE
50

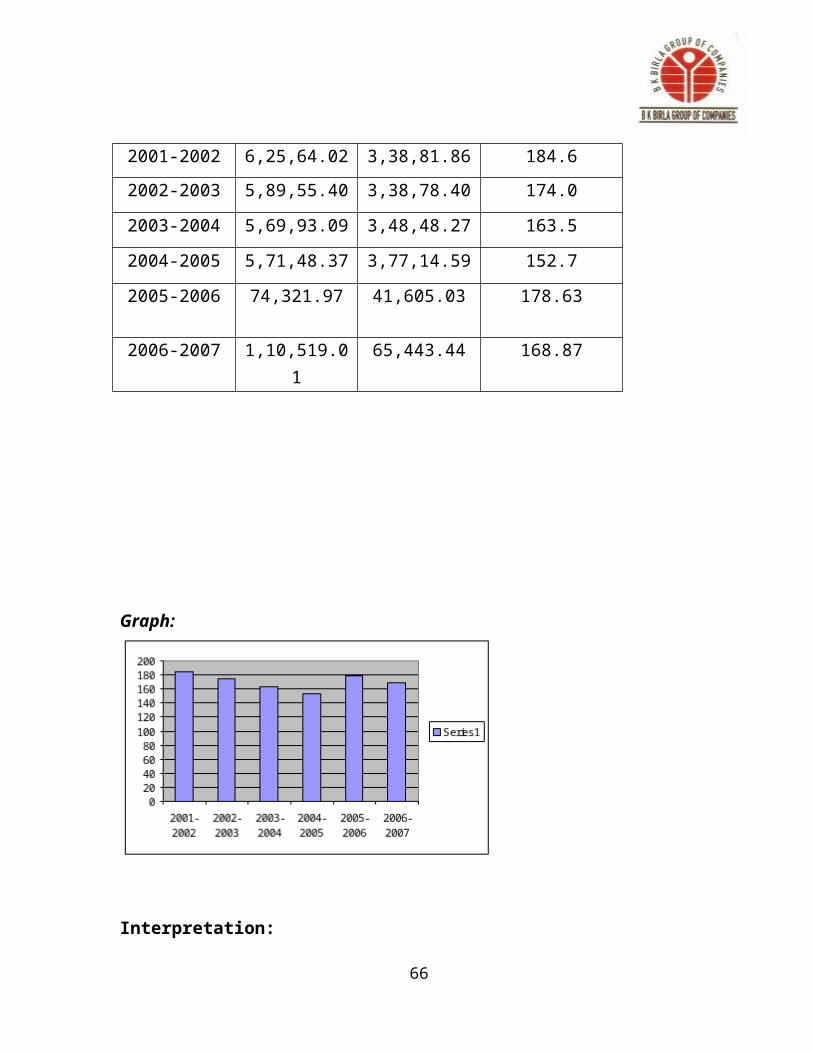
FUNDS2001-2002 6,25,64.02 3,38,81.86 184.62002-2003 5,89,55.40 3,38,78.40 174.02003-2004 5,69,93.09 3,48,48.27 163.52004-2005 5,71,48.37 3,77,14.59 152.72005-2006 74,321.97 41,605.03 178.63
2006-2007 1,10,519.01 65,443.44 168.87
Graph:
Interpretation:
51

a) The fixed assets as a % of long-term liabilities the ratio is functioning from year to year. The fixed assets as a percentage of long term liabilities is recorded at 184.5% in the year 2000 and it is recorded at 152.7% in the year 2004-2005.
b) The highest ratio is recorded at 184.6 % in the 2001-2002 the lowest ratio is 152.7% in 2004-2005.
Fixed Assets as Percentage Current Liabilities: -
Fixed Assets a Percentage to Current Liabilities =
Fixed Assets --------------------- Current Liabilities
Table – V (Amt in lakhs)
YEAR FIXED ASSETS
CURRENT LIABILITIES
RATIOS
2001-2002 6,25,64.03 20,350.59 3.07
2002-2003 5,89,55.40 24,099.52 2.4452

2003-2004 5,69,93.09 21,480.90 2.65
2004-2005 5,71,48.37 23,072.27 2.17
2005-2006 74,321.97 23,745.24 3.12
2006-2007 1,10,519.01 36,253.41 3.04
Graph:
Interpretation:
a) The ratio was fluctuating trend percentage in review period.
b) From the above table it is observed that the ratio was recorded at 3.07 in the 2001-2002 and Its is gradually changing to 3.04 in 2006-2007 which indicates that the current funds are used in the fixed assets which is quite satisfactory.
53

c) The average ratio was recorded at during the 2.25% review period of time.
d) The highest ratio was recorded at 3.12 which are higher that the average ratio.
e) The lowest ratio was recorded at 2.44, which is less than the average ratio.
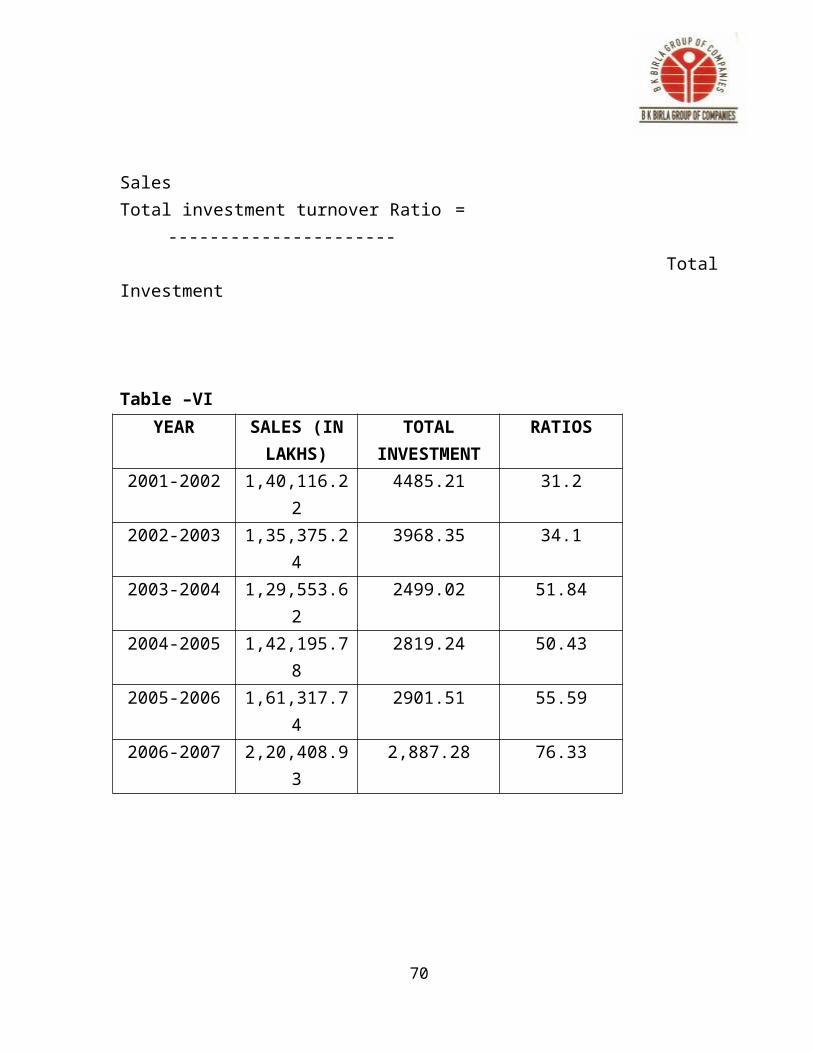
Total Investment Turnover Ratio:
The total invest turnover ration can be calculated by the formula as given under:
SalesTotal investment turnover Ratio = ---------------------- Total Investment
Table –VIYEAR SALES (IN
LAKHS)TOTAL
INVESTMENTRATIOS
2001-2002 1,40,116.22 4485.21 31.2
2002-2003 1,35,375.24 3968.35 34.1
2003-2004 1,29,553.62 2499.02 51.84
2004-2005 1,42,195.78 2819.24 50.43
2005-2006 1,61,317.74 2901.51 55.59
54

2006-2007 2,20,408.93 2,887.28 76.33
Graph:
Interpretation:
a) The ratio was in increasing trend.
b) During the year 2001-2002 the ratio was recorded at 31.2 and in the 2006-2007 the ratio was increasing to 76.33.
c) The highest ratio was recorded at 76.33 in the year 2006-2007 which is more than the average ratio.
55

d) The lowest ratio was 31.2, which is lesser than the average ratio.
56

Fixed Assets Turnover Ratio:
The Fixed Assets turnover ratio is the relationship between the sales or cost of goods/capital assets employed in a business.
Sales Fixed Assets Turnover Ratio= -----------------------X 100
Total Fixed Assets
Table – VIIYEAR SALES(IN
LAKHS)TOTAL FIXED
ASSETS
PERCENTAGE
2001-2002 1,40,116.22 62,564.02 2.23
2002-2003 1,35,375.23 58,955.39 2.29
2003-2004 1,29,553.62 56,993.08 2.27
2004-2005 1,42,195.77 57,148.37 2.40
2005-2006 1,61,317.74 74,321.97 2.17
2006-2007 2,20,408.21 1,10,519.01 1.99
Graph:
57

Interpretation:
a) The fixed assets turnover is fluctuating trend during the review period of time. During the year 2001-2002 the ratio was recorded as 2.23% and in the 2006-2007 the ratio was decreased to 1.99.
b) Average ratio was observed 2.25% during the review period of time.
c) The highest ratio was recorded at 2.40% in 2004-2005, which is more than average.
d) The lowest ratio was 2.29% in the 2001-2002, which is less than average
Fixed Assets as Percentage to Total Assets:
Fixed Assets % Total Assets = Fixed Assets
58

--------------- X 100Total Assets
Table – VIII
YEAR FIXED ASSETS
(IN LAKHS)
TOTAL ASSETS (IN
LAKHS)
PERCENTAGE
2001-2002 62,564.03 112,727.982 55.5
2002-2003 58,955.39 112,725.411 52.3
2003-2004 56,993.08 113,986.16 50.0
2004-2005 57,148.37 124,235.59 46.0
2005-2006 74,321.97 138,222.01 53.77
2006-2007 1,10,519.01 197,708.41 55.19
Graph:
59

Interpretation:
a) Fixed Assets to total assets ratio is fluctuating trend during the review period of time.
b) During the year 2001-2002 the ratio was recorded as 55.5% and the year 2006-2007 the ratio decreased to55.19.
c) Average ratio was observed at 51.14% during the review period of time
d) The highest ratio was observed at 55.5% in the year 2001-2002, which is less than average ratio.
Gross Capital Employed:
60

Gross Capital Employed = Fixed Assets + Current Assets
Table –IX
61
YEAR GROSS CAPITAL EMPLOYEED
2001-2002 1,08,162.05
2002-2003 1,08,668.71
2003-2004 1,10,944.56
2004-2005 1,20,211.89
2005-2006 1,13857.82
2006-2007 1,97,330.50

Profit after Tax:
YEAR PROFIT AFTER TAX (IN LAKHS)
2001-2002 4,137.14
2002-2003 2,814.67
2003-2004 6,299.57
2004-2005 3,351.28
2005-2006 4,570.92
2006-2007 28,568.32
62

Interpretation:
From the above the profits of Kesoram Cement Industries are in increasing which is good for the company. In the year 2006-2007 the PAT is 28,568.32 lakhs and then it is increasing.
In the year 2002-2003 the PAT is the lowest and in 2003-2004 it observed the highest PAT that is 62999.57 over the years.
Return on Gross Capital Employed: The profit for the purpose of calculation on capital employed should be computed according to the concept of capital employed used. The profits taken must be the profit earned on the capital employed in the business.
ProfitafterTax Return on Gross Employed= ------------------------ X 100
Gross Capital Employed
Table – X
YEAR PROFIT AFTER TAX (IN LAKHS)
GROSS CAPITAL EMPLOYED
PERCENTAGE
2001-2002 4,137.14 1,08,162.05 3.8
2002-2003 2,814.67 1,08,668.71 2.563

2003-2004 6,299.57 1,10,944.56 5.7
2004-2005 3,351.28 1,20,211.89 2.8
2005-2006 4,570.92 1,13857.82 4.0
2006-2007 28,568.32 1,97,330.50 14.48
Graph:
Interpretation:
a) Return on Gross Capital Employed ratio is fluctuating trend during the review period of time.
b) During the year 2001-2002 the ratio was recorded at 3.8% and in the year 2006-2007 the ratio was increased to 14.48% and average ratio is 3.9%.
64

c) The highest ratio was recorded at 5.7% in the year 2003-2004 which is more than average ratio.
d) The lowest ratio was recorded at 205% in the year 2002-2003, which is the less than the average ratio.
Return on Fixed Assets:The return on Fixed Assets can be calculated as under:
Profit After TaxReturn on Fixed Assets =------------------- X100
Fixed AssetsTable – XI
YEAR PROFIT AFTER TAX (IN LAKHS)
FIXED ASSETS
PERCENTAGE
2001-2002 4,137.14 62,564.03 6.6
2002-2003 2,814.67 58,955.39 4.7
2003-2004 6,299.57 56,993.08 11.05
2004-2005 3,351.28 57,148.37 5.86
2005-2006 4,570.92 74,321.97 6.15
65
2006-2007 28,568.32 1,10,519.01 24.03
Graph:
Interpretation:
a) Return on fixed assets ratio is decreasing.
b) During the year 2001-2002 the ratio recorded as 6.6% & in the year 2006-2007 the ratio decreased 6.15%.
c) The average ratio is 6.872%.
66

d) The highest ratio is recorded at 11.05% in the year 2003-2004; the lowest ratio is 4.7% in the year 2002-2003.
Findings & Conclusions
After analyzing the financial position of Kesoram Cement Industries and evaluating its Fixed Assets Management or Capital Budgeting Techniques in respect of Components Analysis. Trend Analysis and Ratio Analysis. The following conclusions are drawn from the project preparation.
The financial position of KesoramCement regarding investment it has been decreased.
The total growth rate in fixed assets is increased during the year 2002-2007 from 100% to 176.64%.
Regarding the fixed assets as a percentage of current liabilities it is observed it is decreased.
Regarding the total investment turnover ratio it is observed that it has been increased over the years considerably i.e., 31.2% to 76.33% during the period 2001-07.
Regarding the fixed assets turnover ratio it has been observed that it is satisfactory.
Regarding the fixed assets to total assets it been observed that there was increased. As a result it is said to be that the ratio is quite satisfactory.
67

Regarding the profit and gross capital employed ratio it can be observed that it has been increasing over the year i.e., from 3.82% to14.48%
As a result of the above it can be said that the ratio is steadily increasing.
From the above study it can be said that the Kesoram Cement Industries Financial position on Fixed Assets is quite satisfactory.
SUGGESTIONS
From the financial position of the Kesoram Cement Industry is observed that the ratio fixed assets to turnover is not at all ideal where as a ratio of around 5 is considered as ideal so the company must and should increase the fixed assets turnover ratio.
From the financial position of the Kesoram Cement Industry is observed that return on fixed assets not satisfactory throughout all the years, there was a too much fluctuation in the percentage of return on fixed assets so the company should try to decrease the fluctuations, for that the company should concentrate on sales.
From the financial position of the Kesoram Cement Industry is observed that on the basis of ratio fixed assets as percentage to current liabilities, the current liabilities were increasing as fixed assets increasing gradually. For the purpose of purchasing fixed assets the company is utilizing current liabilities. It may cause the company to bare excess interest
68

compare to long term liabilities, so the company should not depend on the current liabilities to invest in fixed assets.
BIBLIOGRAPHY
1. Financial Management - I.M.Pandey VikasPublishers, 3rd edition
2. Financial Management - PrasannaChandra TataMcGrawhill, 5th Edition
3. Management Accounting -R.K. Sharma &Shashi K.Gupta -Kalyani Publishers, 8th edition
4. Financial Accounting -S.P.Jain & K.L.Narang -KalyanPublishers, 3rd Edition
Web site
www.kesoramcements.co.in
69
Previous records
70