Embed Size (px)
Citation preview

Contents of the Bega-Timis Cannel infrastructure modernization
feasibility study – Timis Basin Water Administration
1. Ecological issues of improving the water management ___________________ 3
1.1. Restrictions to mitigate the degradation of Timis riverbed _____________ 3
1.2. Appropriate flow for maintaining the trout as a umbrella species _______ 3
2. Cost benefit analysis of structural measures ___________________________ 4
2.1. Methodological issues ___________________________________________ 4
2.2. Results ________________________________________________________ 5 1.1.1. Heightening the dike along the right-side bank of Timis river in order to
protect the city of Timisoara and its surroundings from flooding from the Timis
river ____________________________________________________________ 5
1.1.2. Non-permanent storage on Bega Canal between Tiganului Creek and
Gherteamos Creek (10 million cum, 630 hectare) ________________________ 7
1.1.3. Consolidation works at Giarmata and Dumbravita dams (spillways and
energy dissipater), concrete beam 0.75 m height on the top of Dumbarvita dam 8
1.1.4. River management works along the sector Sacu-Slatina Timiş _________ 8
1.1.5. River management works and embaking Bistra River along secor Otelu
Rosu – Iaz _______________________________________________________ 9
1.1.6. Consolidation of the dams, the spillway and the completion of the
pavement of Salcia and Silagiu dams __________________________________ 9
1.1.7. River management works on Bega river and its tributaries, along the water
meadow sector Leucusesti-Curtea ____________________________________ 9
1.1.8. Water management works along the sector Lugoj - Jena ______________ 9
3. Improving the water piping systems _________________________________ 10
3.1. Proposed measures – technical issues _____________________________ 10
3.2. Cost-benefit analysis of having improved the waterpiping and the sewage
systems __________________________________________________________ 12
4. Summary of the feasibility for rehabilitation of the Bega canal ___________ 14
4.1. Hydrotechincal complex Sinmihaiu Roman ________________________ 15
4.2. Hydrotechincal complex Sinmartinu Maghiar ______________________ 15
4.3. Bank protection of the city of Timisoara ___________________________ 15
4.4. Summary costs Bega canal rehabilitation project ___________________ 15
4.5. Function of the Bega canal in its present position ___________________ 16
4.6. Concluding remarks on the sediment pollution _____________________ 16
4.7. Storage of the dredged material __________________________________ 18
4.8. Proposed rehabilitation works ___________________________________ 18
4.9. Rehabilitation of the navigation lock ______________________________ 19
4.10. Repairs of the canal banks _____________________________________ 19
5. methodology to develop economic instruments_________________________ 19

2
5.1. Economic instrument for maintaining appropriate land use __________ 19
5.2. Economic instruments for water management ______________________ 21 1.1.9. Literature review ____________________________________________ 21
Water withdraw taxes ___________________________________________ 21
Water price ___________________________________________________ 21
Sewerage and Effluent Charges (Indirect Emissions) __________________ 22
Tradable Permits _______________________________________________ 22
Liability for Damage to Waters ___________________________________ 23
Subsidies related to environmentally-friendly farming _________________ 25
1.1.10. Proposed measures: unique tradable permits on water use and discharges
combined with revolving bonds _____________________________________ 25
Theoretical background _________________________________________ 25
Designing the tradable revolving bonds system _______________________ 27
Setting up weights on pollutants by AHP ____________________________ 29
Results - Hypothetical example of applying revolving bonds combined with
tradable permits ________________________________________________ 31
SWOT analysis ________________________________________________ 31
6. Literature ______________________________________________________ 34

3
1. Ecological issues of improving the water management
1.1. Restrictions to mitigate the degradation of Timis riverbed
Gravel extraction from the Timis riverbed has reduced the water table. Along the Lugoj section, only in 2002 about 400,000 m3 of gravel was yielded, comparing with an average annual alluvial transport of 350,000 tons, of which only 10-15% stands for the solid flow.
Most of the pits are located between Costei and Sag, where the bottom of the river bed and the water table has decreased over 2 m upstream this section. The consequences are diverse:
positive effects with respect to the efficiency of the existing draining systems, stretched over 22824 hectares (Racovita, Sarbova, Bazos, Surgani, Albina, Unip, Saris draining plant) , and
unfavorable with respect to the stability of the main riverbed: in many places riverbanks have fallen while the bottom of the riverbed has turned out a series of holes and doorsteps.
The value of the crop that would have been harvested at maturity has been assessed by means of the average growth expected meanwhile. This growth is being recorded in yield tables. Multiplying the total growth (600 cum, in total for 2002) and the average price for stumpage harvested as salvage products (about thousand ROL 700), the total indirect loss of the forestry sector amounts billion ROL 420, due to the changes in ground water level only.
Another undesirable side effect is the lack of water in wells: along the river course numerous village wells have dried out. The economic loss cannot be assessed because all these villages are more and more depopulated, due to the negative growth of population (the livestock reduction has many other additional causes and it has never been assessed by means of econometric tools).
All in all, all the pits should be closed, in order to cease all the ecological effects of lowering the underground water table.
1.2. Appropriate flow for maintaining the trout as a umbrella species
Maintaining a minimum water flow beyond a dam has emerged as an important problem since 60s. At that time, according to the area of the basin, three threshold minimum water flows were adopted, without having an ecological reasoning behind them.
In order to maintain the trout as a umbrella species, some quality standards should be envisaged as follows: the biological oxygen demand should exceed 9, the average temperature of 14-16Cº and good conditions for clearing the water after a heavy rain upstream, which means a low turbidity.
4
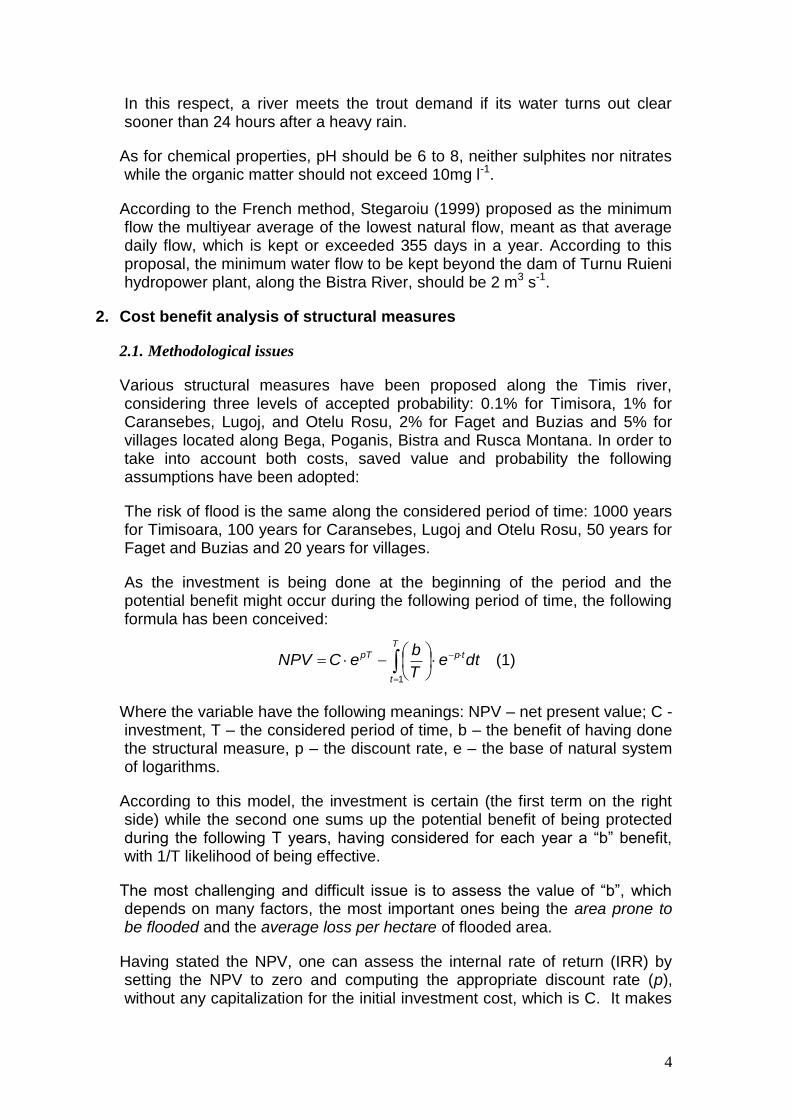
In this respect, a river meets the trout demand if its water turns out clear sooner than 24 hours after a heavy rain.
As for chemical properties, pH should be 6 to 8, neither sulphites nor nitrates while the organic matter should not exceed 10mg l-1.
According to the French method, Stegaroiu (1999) proposed as the minimum flow the multiyear average of the lowest natural flow, meant as that average daily flow, which is kept or exceeded 355 days in a year. According to this proposal, the minimum water flow to be kept beyond the dam of Turnu Ruieni hydropower plant, along the Bistra River, should be 2 m3 s-1.
2. Cost benefit analysis of structural measures
2.1. Methodological issues
Various structural measures have been proposed along the Timis river, considering three levels of accepted probability: 0.1% for Timisora, 1% for Caransebes, Lugoj, and Otelu Rosu, 2% for Faget and Buzias and 5% for villages located along Bega, Poganis, Bistra and Rusca Montana. In order to take into account both costs, saved value and probability the following assumptions have been adopted:
The risk of flood is the same along the considered period of time: 1000 years for Timisoara, 100 years for Caransebes, Lugoj and Otelu Rosu, 50 years for Faget and Buzias and 20 years for villages.
As the investment is being done at the beginning of the period and the potential benefit might occur during the following period of time, the following formula has been conceived:
dteT
beCNPV tp
T
t
pT
1
(1)
Where the variable have the following meanings: NPV – net present value; C - investment, T – the considered period of time, b – the benefit of having done the structural measure, p – the discount rate, e – the base of natural system of logarithms.
According to this model, the investment is certain (the first term on the right side) while the second one sums up the potential benefit of being protected during the following T years, having considered for each year a “b” benefit, with 1/T likelihood of being effective.
The most challenging and difficult issue is to assess the value of “b”, which depends on many factors, the most important ones being the area prone to be flooded and the average loss per hectare of flooded area.
Having stated the NPV, one can assess the internal rate of return (IRR) by setting the NPV to zero and computing the appropriate discount rate (p), without any capitalization for the initial investment cost, which is C. It makes

5
sense to do so because the internal rate of return does not consider the opportunity cost of capital, being just a straightforward method to assess the extent to which an investment worth being done.
Another needed important assumption is the welfare growth rate. On such a wide space of time (1000 years) it is reasonable to consider a positive growth rate of the welfare (r), let it be 1% per year, which is a very conservative approach. Plugging this rate into relation (1), it turns out relation (2), which should be solved in p, that is the IRR:
01
dteT
bC trp
T
t
)( ( 2)
In order to carry out this calculation, the time period has been split into 10 years sub-periods, and the total loss supposed to be brought about was divided by the number of sub-periods considered. For instance, in case of Timisoara city, 100 sub-periods have been considered, the amount of loss being discounted at the end of each period.
As for the expected loss, an average value was considered for the following types of damages: 1) for households, 2) for companies, 3) for the transportation networks (separately for railroads), 4) for the sewage network 5) for public premises (hospitals and schools), and 6) for food stores (considering an average stock of products, likely to be found in such a place).
In order to appraise the damages that might be brought about in all these sites, historical data have been considered and field surveys have been carried out on each site for getting “average figures”; where possible (in Timisoara city only), the Water Authority has provided additional data with respect to the number of building which would have been seriously damaged by flooding their basement.
In order to assess the cost of removing the mud which is eventually carried by a flood, the following input data have been collected: the total length of streets supposed to be affected (in km) and the expected cost of removing the mud per kilometre, having considered the average operation cost for the existing equipment: street sweepers, snow plows (needed to collect the mud) jetters and catch basin cleaners.
2.2. Results
1.1.1. Heightening the dike along the right-side bank of Timis river in
order to protect the city of Timisoara and its surroundings from
flooding from the Timis river
Protection against floods from Timis river Cost of woks (C): ROL 100 billion. Period of time considered, according to accepted probability (T): 1000 years

6
Area supposed to be affected by the flood: about 50% of the city area, that is the southern part, on the left side of Bega canal. The water blade would be about 0.5 m height.
Although not all these companies are seriously threaten by Timis river discharges, some of them may be seriously affected, to the extent to which their premises and outhouses are placed at lower elevation. The companies considered to be affected by floods and their would-be losses are presented in table 1.
Table 1 The most important companies supposed to be affected by floods and expected losses
Company Estimated damages (bill. ROL)
Company Estimated damages (bill. ROL)
ELECTROTIMIS SA 15 Mirton Publishing House 2
ROMACOST SA 10 Filty S.A (Shoe industry) 10
MOBITIM SA, 10 Guban S.A (Shoe industry) 10
MULTIM SA, 15 HERBRETEX TIM SRL 10
ROMACOST SA 12 ModaTim S.A. 3
ABB ROMETRICS SRL 30 Bere Timisoreana 10
AEM SA 30 Coca Cola Timis S.A. 20
STIMEL SA 5 KANDIA S.A. 20
ELECTROMOTOR SA 12 PERFECT RENAISSANCE SRL
3
SPUMOTIM S.A 12 A&B TRADE CO SRL 20
BEGATEHNOMET S.A. 3 ARGOS SA 10
"1 IUNIE" S.A. 3 AXELA CONSTRUCTII SRL 3
COTTONTEX S.A. 6 Electric Grup SRL (electrical equipment for industry)
3
SUPERTEX S.A. 5 ELECTRO M.G.INSTAL SRL 3
AZUR S.A. 12 ELECTRO M.G.INSTAL SRL 5
PROMETAL SA 5 EUROCONSTRUCT SA 5
TICUTTI INTERNATIONAL SRL
5 MECTRANS SA 3
TIMCON SA 10 TOTAL 340
In addition to these losses, one should consider other costs, related to urban facilities and likely damages to occur at other social institutions, such as University of Timisioara and the Central Hospital. These roughly estimated costs are summarized in table 2.

7
Table 2 Additional costs brought about to urban facilities
Type of cost
Value (billion ROL)
Cleaning up the streets 3
Urban transportation 5
Electricity Distribution network 3
Bottled water for 200.000 inhabitants 6
Labor loss for 2 days 28.8
University facilities 1
Central Hospital 1
Damages to 5 gas stations 2
Cleaning up the gas distribution network 2
Damages to households 10
Damages to hotels and restaurants 2
Damages to supermarkets 5
total 68.8
All in all, the total cost of having flooded the city of Timisoara would be about 408.8 billion ROL. Plugging these data into a spreadsheet in which this total cost is equally distributed across 1000 years period of time, and checking the appropriate discount rate for having a zero present value of the project, a 17% IRR has been found.
A sensitivity analysis on these data has shown that the IRR might vary between 14% if the expected damage is 2000 billion ROL and 10%, if the damage would be 1000 billion ROL worth.
1.1.2. Non-permanent storage on Bega Canal between Tiganului Creek
and Gherteamos Creek (10 million cum, 630 hectare)
C= ROL 100 billion; Time =1000 years About 40% of the city area will be flooded by a blade of water 1 m height on both sides.
In such a case a 300-400 m wide corridor will be flooded on both sides along the Bega canal. Besides the damages mentioned before (summed up to 408 billion ROL), the central part of the city would have been flooded, where, in addition to the direct costs of removing the mud and debris carried by the water, two other major losses should be considered: the lack of drinking water, supposed to be replaced for 3 days at least, and the total loss production. The value of supplying bottled drinking water for 200 thousand inhabitants amounts ROL 6bl and 2 days labour loss ROL 28.8bl.
Having the same accepted probability and considering 1% growth rate for all values at risk, the IRR remains almost the same that is 12%.
8
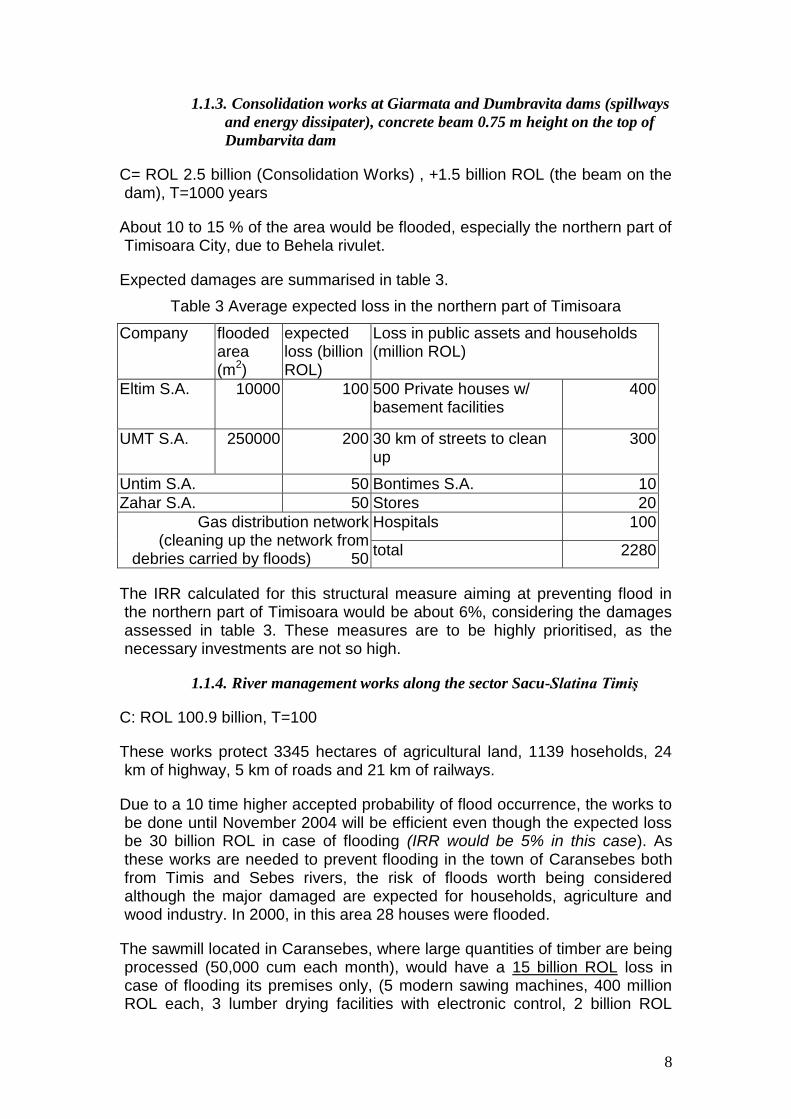
1.1.3. Consolidation works at Giarmata and Dumbravita dams (spillways
and energy dissipater), concrete beam 0.75 m height on the top of
Dumbarvita dam
C= ROL 2.5 billion (Consolidation Works) , +1.5 billion ROL (the beam on the dam), T=1000 years
About 10 to 15 % of the area would be flooded, especially the northern part of Timisoara City, due to Behela rivulet.
Expected damages are summarised in table 3.
Table 3 Average expected loss in the northern part of Timisoara
Company flooded area (m2)
expected loss (billion ROL)
Loss in public assets and households (million ROL)
Eltim S.A. 10000 100 500 Private houses w/ basement facilities
400
UMT S.A. 250000 200 30 km of streets to clean up
300
Untim S.A. 50 Bontimes S.A. 10
Zahar S.A. 50 Stores 20
Gas distribution network (cleaning up the network from
debries carried by floods) 50
Hospitals 100
total 2280
The IRR calculated for this structural measure aiming at preventing flood in the northern part of Timisoara would be about 6%, considering the damages assessed in table 3. These measures are to be highly prioritised, as the necessary investments are not so high.
1.1.4. River management works along the sector Sacu-Slatina Timiş
C: ROL 100.9 billion, T=100
These works protect 3345 hectares of agricultural land, 1139 hoseholds, 24 km of highway, 5 km of roads and 21 km of railways.
Due to a 10 time higher accepted probability of flood occurrence, the works to be done until November 2004 will be efficient even though the expected loss be 30 billion ROL in case of flooding (IRR would be 5% in this case). As these works are needed to prevent flooding in the town of Caransebes both from Timis and Sebes rivers, the risk of floods worth being considered although the major damaged are expected for households, agriculture and wood industry. In 2000, in this area 28 houses were flooded.
The sawmill located in Caransebes, where large quantities of timber are being processed (50,000 cum each month), would have a 15 billion ROL loss in case of flooding its premises only, (5 modern sawing machines, 400 million ROL each, 3 lumber drying facilities with electronic control, 2 billion ROL
9
each, 7 billion ROL the amount of wood which is being processed in 3 days, assuming the whole stock of timber would have been removed by the water flood (ROL 700,000 ROL for each cubic meter of logs, times 10,000 cum, which is the regular stock of row material).
1.1.5. River management works and embaking Bistra River along secor
Otelu Rosu – Iaz
C= ROL 103 bill. T=100 years
The main damages that might be produced by foods would be localised at Gavazzi Steel S.A., the former Otelu Rosu Steelworks. Being a metallurgical company with a remarkable investment ($ 60ml., lend by the European Bank for Reconstruction and Development). Flooding the premises of this steelworks would produce a loss of ROL 30 bl. at least, the IRR would be 8%, due to a much shorter period of time on which such a loss would occur (1% probability of flood occurrence).
1.1.6. Consolidation of the dams, the spillway and the completion of the
pavement of Salcia and Silagiu dams
C= ROL 5 billion T=50 years
The total area of the Buzias town that would be flooded would be about 22% if Silagiu dam was broken, and 29% respectively, in case of Salcia dam braking down. Considering a 1% probability, 35% of Buzias would be flooded.
The main losses would be produced to approximately 60 households. Assuming a million ROL 10 loss per household, the IRR would be 44%, which is based upon a quite realistic assessment in all respects.
1.1.7. River management works on Bega river and its tributaries, along
the water meadow sector Leucusesti-Curtea
C= ROL 105 billion T=50 years
At least three companies would be affected by foods, namely Moebel Poduction, Simultan S.A. and Agrirom Tractors. Assuming a million ROL 20 loss per company (the first two of them produce outfits and having a large stock of raw material), the IRR would be 17%.
1.1.8. Water management works along the sector Lugoj - Jena
C= ROL 106.5 billion T=50 years
These works are to protect 1750 hectares of agricultural land, 195 houses, 8 km of highway and roads, 3,3 km of railway. The latest flood (in 2000) affected 207 houses.
The most severe loss would be produced to the transportation network (railway and highway) where additional costs would be brought about by diverting the transport on other routes.

10
As this route is a bottleneck for transporters, regardless the type of vehicle, the main figure considered for assessing the impact of having blocked the main entrance route from the southeast was the total turnover of all enterprises that transport or store merchandise. This lump sum amounts ROL 9596 billion1 and considering just a 5% loss the saved value of water management works on this section (Lugoj-Jena) would be ROL 479.8 billion. Doing so, the IRR was assessed at 17%.
3. Improving the water piping systems
3.1. Proposed measures – technical issues
Table 4 and 5 shows the measures proposed for Timis and Caras Severin counties with respect to the rehabilitation of the water piping systems.
Table 4 Proposed measures to improve the water piping system in Timis County
Sites Population Connec-ted in 2002
Connec-ted in 2007
% Connec-ted in 2015
% Existing network
Network extension in 2007
Network rehabili-tation in 2007(km)
Invest-ment (€)
Urban 392292 358148 392292 100 392292 100 639.6 172 450 12,638,000 *
Rural 195748 31627 63899 33 - - 143.1 199 46 5,280,000 **
Rural ) 195748 31627 - 146810 ***
75% 143.1 660*** 90*** 1,742,000 ***
*Investment including the treatment plants for Timisoara, Lugoj, and Buzias, having the deadline in 2010, all other objectives having the deadline in 2007 ** Investment including the new treatment station Remetea Mare. ** * numbers, amounts and values presumed for 2015 phase.
Table 5 Proposed measures to improve the water piping system in Caras-Severin County
Population Connected in 2002
Connected in 2015
% Existing network in 2002 (km)
Network extension in 2015 (km)
Network rehabilitation in 2015 (km)
Investment (€)
Urban 42164 29218 42164 100 97.6 66.3 48 26,440,761
Rural 63624 6067 49694 78 54.0 303.0 41,091,326
The efficiency of these improvements is difficult to assess, as long as loss within the actual distribution systems ranges between 20 and 50 %, depending on site.
As for the improvement and extension of the sewage systems in the two counties, which belong to the water quality protection works, data are presented in table 6 and 7. The data regarding the prognoses for 2015 have been provided local authorities, considering the existing plans and assessments.
1 Value reported by the Romanian Yearbook for 2001, without being deflated.

11
Table 6 Proposed measures to improve the sewage system in Timis County
Sites Popula-tion
Connected 2002
Connected 2015
% Existing network in 2002
Extended network in 2015
Rehabi-litation
Investment
Urban 392292 338945 358145 91 489.6 101.2 483.9 € 91.500 Mil
Rural 195748 2509 63900 33*** 11.0 312.8 11.0 € 29.236 Mil
Rural 195748 2509 117450 60*** 11.0 631.0 11.0 € 58.977 Mil
*Investment includes the biological treatment for Timisoara and the treatment plant of Faget, along with retooling the treatment plant of Timisoara, Lugoj, Faget, Buzias. ** Investment including the purification plant (both mechanic and biologic stages) in rural areas. *** Number and percentage assumed for 2015 time horizon.
Rehabilitation of 370 km of waterpipe network in the city of Timisoara and 120 km extension, along with rehabilitation of water treatment plant cost 9,950,000 € (billion ROL 388). The alternative scenario would be the existing situation, that means maintaining a 38% loss within the network. In order to compensate such a loss and to maintain the actual consumption level a supplementary 0.4 m3/second flow must be secured, and a new accumulation would be necessary. The volume of such an accumulation has been assessed at 20 million m3, which means a billion ROL 1,600 investment. The cost saved in such a case would be 1,600-388 billion ROL, that is billion ROL 1,212 savings.
Table 7 Proposed measures to improve the sewage system in Caras-Severin County
Sites Population Connected in 2002
Connected 2015
% Existing network in 2002
Extended network in 2015
Rehabi-litation
Invest-ment
Urban 42164 21358 38370 91 51.6 km 40 km 29 km € 15 Mil*
Rural 63624 2509 47710*** 75*** 15.9 km 221 km NA € 6.577 Mil**
* The investment includes: rehabilitation for the stage B (210 l/s) of the Caransebes waste water purification plant till 2007 and separation of the sewer network and for 2015 time horizon extension of the purification plant with 210 l/s and of sweater network with 18 km. Urgent extension of the Otelu Rosu waste water purification plant with a biological stage (47 l/s) and till 2015 its extension at 97 l/s and also the extension of the waste water network with 22 km.
** Investment including the purification plant (M+B) in rural areas for 2015 time horizon.
*** Number and percentage assumed for 2015 time horizon.

12
3.2. Cost-benefit analysis of having improved the waterpiping and the sewage
systems
The outcomes of extending the waterpiping networks in rural areas of both counties are summarized in table 8, while table 9 refers to the same issue, but for urban localities in Timis county only. In order to recoup the investment, the price of water is supposed to increase in Timis county with 0,53 €/m3 or 0,58 €/m3, according to the considered scenario, but rural areas from Caras Severin county the figures reported by the local water company are not reliable at all: either the total investment has been overestimated, or the expected consume has been underestimated, but paying off about 29 €/m3 won‟t be acceptable in any case.
Table 8 Predicted outcomes of extending the waterpiping system in rural areas
County Population connected in 2002
Losses in 2002
Water consum-ption (Mill m3)
Population connected in 2015
Losses in 2015 Water consum-ption Mill m3
Water price increment
Timis 31627 15.4 (25%)
1.452 63899 23.6 (20%) 2.973 0.58 €/m3
Timis 31627 15.4 (25%)
1.452 146814 54.1 (20%) 6.836 0.53 €/m3
Caras 6067 1.2 (25%)
0.110 49464 11.5 (20%) 1.452 29,28 €/m3 not reliable
In order to recoup the investment required by the extension of waterpiping network in the main cities of Timis county, the marginal price of water would be 0.31 €/m3 in 2015, which would be an affordable increment at that time (table 9)
Table 9 Predicted outcomes of improving the waterpining network in urban areas Timis county (necessary increment for the water price: 0.31 €/m3
City Population connected in 2002
Losses in 2002
Water consumption Mill m3
Industrial water consumption
Population connected in 2015
Losses in 2015
Water consum-ption
Timi-soara 300,000 621 l/s 20.577 11.362 328,263 435 l/s 35.379
Lugoj 46326 77.7 2.133 1.114 48274 57.5 3.579
Buzias 5500 8.2 0.194 0.194 8195 8.8 0.413
Faget 6446 4.1 2.288 0.830 7560 4.6 0.486
Conversely, in Caras Severin County the same figure, that is the marginal price of water which would pay off the investment, is unreasonable (10 €/m3) due to the same overestimations made for the rural areas too (table 10).
Table 10 Predicted outcomes of improving the waterpining network in urban areas of Caras Severin County
City Population connected in 2002
Losses in 2002
Water consumption
Industrial water consum-ption
Population connected in 2015
Losses in 2015
(l/s)
Water con-sum-ption
Necessary increment of water

13
(Mill m3 ) (mil. m3 ) Mil. m3 price
Caransebes 21417 42.3 2.288 0.830 30415 31.1 2.881 10 €/m3
Otelu Rosu 7801 17.4 0.739 0.180 11749 15.5 1.202 10 €/m3
Table 11 summarises the outcomes of having improved the sewage network in urban areas in Timis County, where an increment of 1.28 €/m3 would pay off the investment.
Table 11 Predicted outcomes of extending the sewage system in urban area of Timis county (necessary price increment for sewage 1.28 €/m3
City Population connected in 2002
Restituted flow
Mill m3
Mechanical cleaned flow
Mill m3
Mechanical and biological cleaned flow mill m3
Population connected in 2015
Restituted flow
Mill m3
Cleaned flow
Mill m3
Timisoara 286253 54.220 20.577 328263 62.173 62. 73
Lugoj 46326 7.259 7.259 7.259 48274 7.529 7.259
Buzias 4103 0.388 0.276 0.276 8195 0.827 0.827
Faget 2263 0.285 0.032 0.032 7560 0.581 0.581
When it comes to Caras Severin County, the same overestimation of costs holds for the sewage system too; consequently, the marginal price for discharging the sewage would be 2.77 €/m3, which is also an unreasonable figure for an urban area.
Table 12 Predicted outcomes of extending the sewage syestem in urban areas of Caras Severin County (necesary increment of water price: 2.77 €/m3
)
City Population connected in 2002
Restituted flow
Mill m3
Mechanical cleaned flow
Mill m3
Mechanical and biological cleaned flow mill m3
Population connected in 2015
Restituted flow
Mill m3
Cleaned flow
(Mill m3)
Caransebes 1700 3.118 2.525 2.525 27678 3.929 3.929
Otelu Rosu 4358 1.067 1.067 1.067 10692 1.474 1.474
Total 6058 4.185 3.592 3.592 40385 5.403 5.403
14
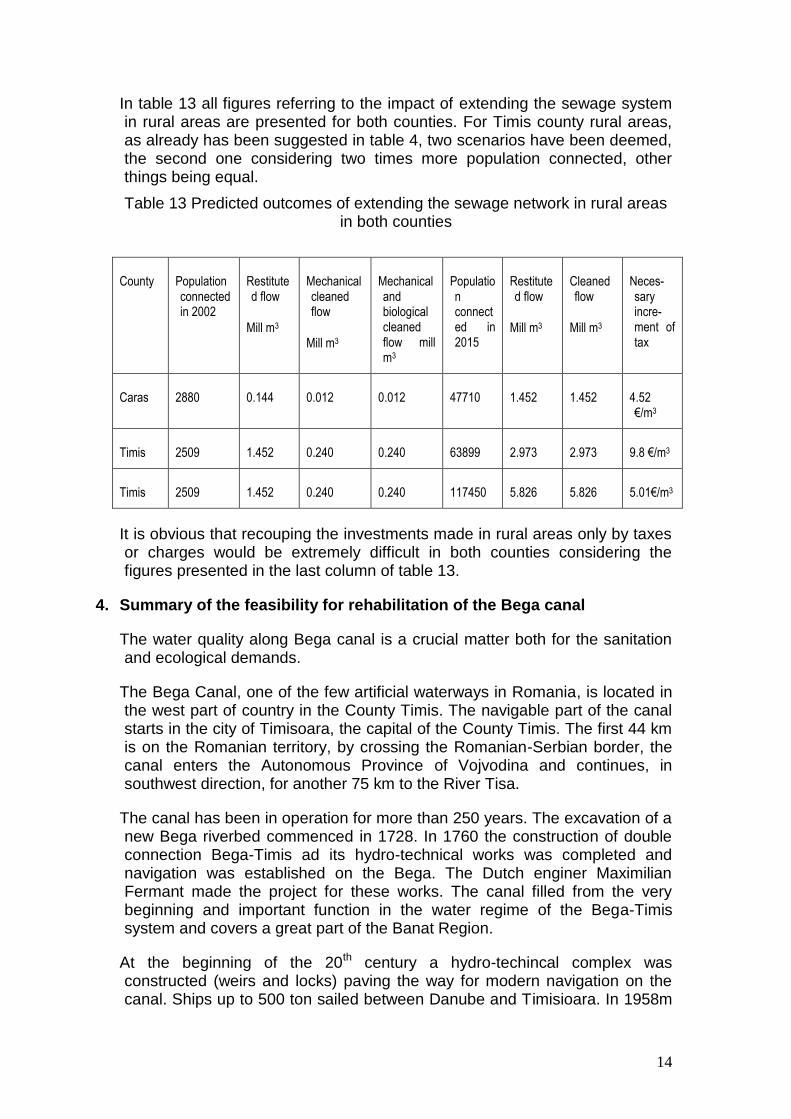
In table 13 all figures referring to the impact of extending the sewage system in rural areas are presented for both counties. For Timis county rural areas, as already has been suggested in table 4, two scenarios have been deemed, the second one considering two times more population connected, other things being equal.
Table 13 Predicted outcomes of extending the sewage network in rural areas in both counties
County Population connected in 2002
Restituted flow
Mill m3
Mechanical cleaned flow
Mill m3
Mechanical and biological cleaned flow mill m3
Population connected in 2015
Restituted flow
Mill m3
Cleaned flow
Mill m3
Neces-sary incre-ment of tax
Caras 2880 0.144 0.012 0.012 47710 1.452 1.452 4.52 €/m3
Timis 2509 1.452 0.240 0.240 63899 2.973 2.973 9.8 €/m3
Timis 2509 1.452 0.240 0.240 117450 5.826 5.826 5.01€/m3
It is obvious that recouping the investments made in rural areas only by taxes or charges would be extremely difficult in both counties considering the figures presented in the last column of table 13.
4. Summary of the feasibility for rehabilitation of the Bega canal
The water quality along Bega canal is a crucial matter both for the sanitation and ecological demands.
The Bega Canal, one of the few artificial waterways in Romania, is located in the west part of country in the County Timis. The navigable part of the canal starts in the city of Timisoara, the capital of the County Timis. The first 44 km is on the Romanian territory, by crossing the Romanian-Serbian border, the canal enters the Autonomous Province of Vojvodina and continues, in southwest direction, for another 75 km to the River Tisa.
The canal has been in operation for more than 250 years. The excavation of a new Bega riverbed commenced in 1728. In 1760 the construction of double connection Bega-Timis ad its hydro-technical works was completed and navigation was established on the Bega. The Dutch enginer Maximilian Fermant made the project for these works. The canal filled from the very beginning and important function in the water regime of the Bega-Timis system and covers a great part of the Banat Region.
At the beginning of the 20th century a hydro-techincal complex was constructed (weirs and locks) paving the way for modern navigation on the canal. Ships up to 500 ton sailed between Danube and Timisioara. In 1958m

15
due to political and economic developments in the region the Bega canal was closed for navigation.
In the spring of 2000, Romanian, Serbian and Hungarian representatives agreed to support a revitalization of the Bega canal to improve the water management and navigation in the Euro region DKMT (Danube-Kris-Mures-Tisa). Also, in 2000 the city of Timisoara took the initiative to prepare a pre-feasibility study. In December 2000 the pre-feasibility report, named “Sustainable development of the Bega Canal and adjacent areas” was completed. The report reflects the vision of all authorities and institutions with an interest in the Bega Canal. It was made under the responsibility of the Town Hall of Timisoara.
4.1. Hydrotechnical complex Sinmihaiu Roman
The hydrological complex of Sinmihaiu Roman consists of weir and navigation lock. The complex dates back to 1910. Rehabilitation works were planned and started in 1988 but stopd in 1995 due to lack of budget. The navigation lock in about 10 m wide and the effective lock chamber length is 68 m and can handle 500 tone ships. All steel elements of rehabilitation are stored in site since 1989.
4.2. Hydrotechnical complex Sinmartinu Maghiar
Also the complex Sinmartinu Maghiar consists of a weir and navigation lock, which dates back to the same period. Rehabilitation of the complex has been completed in 1995. the weir of “Poiret” type. A number of frames are erected and attached to a sill. In general the construction is in good condition. There is some backlog in maintenance (especially corrosion).
4.3. Bank protection of the city of Timisoara
The upper parts of the canal banks in the city have slope protection consisting of concrete slabs (tiles). The quality of the bank protection varies. In the older parts, concrete tiles have a thickness of 20 cm. In recently reconstructed parts the tiles have a thickness of 8 cm, and are damaged to a large extent.
The canal banks downstream Timisoara are covered with an “environmental friendly river bank protection”. Scrubs of willows and bushed keep the soil of the canal bank together. The trees and reed not only top erosion, they even give way to siltation of the sediment carried by the Bega canal water.
4.4. Summary costs Bega canal rehabilitation project
The summarized costs of rehabilitation project are presented in table 14.
Table 14 Summarized costs of rehabilitating the Bega canal
Reconstruction (acquisition of lands for CDF‟s
2, environmental impact assessment,
Permits, commissions, Soil investigations,
€ 1,370,000
2 Cleaning depots founds.
16
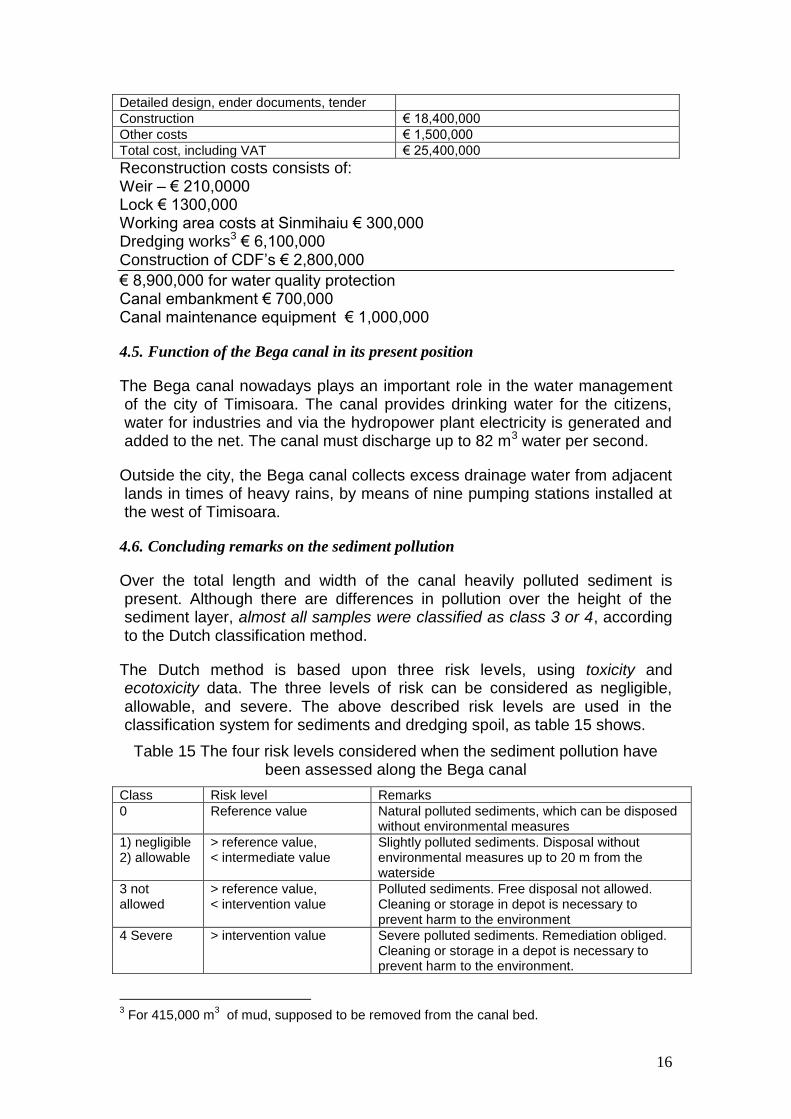
Detailed design, ender documents, tender
Construction € 18,400,000
Other costs € 1,500,000
Total cost, including VAT € 25,400,000
Reconstruction costs consists of: Weir – € 210,0000 Lock € 1300,000 Working area costs at Sinmihaiu € 300,000 Dredging works3 € 6,100,000 Construction of CDF‟s € 2,800,000
€ 8,900,000 for water quality protection Canal embankment € 700,000 Canal maintenance equipment € 1,000,000
4.5. Function of the Bega canal in its present position
The Bega canal nowadays plays an important role in the water management of the city of Timisoara. The canal provides drinking water for the citizens, water for industries and via the hydropower plant electricity is generated and added to the net. The canal must discharge up to 82 m3 water per second.
Outside the city, the Bega canal collects excess drainage water from adjacent lands in times of heavy rains, by means of nine pumping stations installed at the west of Timisoara.
4.6. Concluding remarks on the sediment pollution
Over the total length and width of the canal heavily polluted sediment is present. Although there are differences in pollution over the height of the sediment layer, almost all samples were classified as class 3 or 4, according to the Dutch classification method.
The Dutch method is based upon three risk levels, using toxicity and ecotoxicity data. The three levels of risk can be considered as negligible, allowable, and severe. The above described risk levels are used in the classification system for sediments and dredging spoil, as table 15 shows.
Table 15 The four risk levels considered when the sediment pollution have been assessed along the Bega canal
Class Risk level Remarks
0 Reference value Natural polluted sediments, which can be disposed without environmental measures
1) negligible 2) allowable
> reference value, < intermediate value
Slightly polluted sediments. Disposal without environmental measures up to 20 m from the waterside
3 not allowed
> reference value, < intervention value
Polluted sediments. Free disposal not allowed. Cleaning or storage in depot is necessary to prevent harm to the environment
4 Severe > intervention value Severe polluted sediments. Remediation obliged. Cleaning or storage in a depot is necessary to prevent harm to the environment.
3 For 415,000 m
3 of mud, supposed to be removed from the canal bed.

17
The chainage in accordance to which the sediment layer was assessed is presented in table 16.
Table 16 Chainage positions
Description Chainage position (GH) in km from the Tisa junction
Romanian Serbian border right bank 73+900
Romanian Serbian border left bank 75+700
Otelec bridge 81+200
Otelec railroad bridge 81+850
Uivar bridge 87+300
Lock and weir structure at sinmartinu 88+700
Sinmihaiu bridge 102+950
Lock and weir structure at/near Sinmihaiu 103+920
Utvin bridge 105+680
Industrial waste water discharges left bank 107+000 – 107+500
Aquatin outlets waste water treatment plant 110+500 – 111+000
Railroad bridge near Timisoara city 111+290
Eiffel bridge (Timisoara) 113+695
Hydropower plant (UHE Timisoara) 118+350
As for the amount of sediment assessed on survey basis, the results are summarized in table 17.
Table 17 Amount of sediment in the three sections of the Bega Canal
Description Chainage Length (m) Layer thickness (m)
Quantity (m3)
From To
Section 1
Timisoara city 118+350 116+000 2350 0.1 5000
Timisoara city 116+000 112+000 4000 0.5 60000
Timisora-Sinmihaiu
112+000 103+920 8080 1.0 184000

18
Total section 1 14430 0.3 249000
Section 2 103+920 88+700 15220 0.3 75000
Section 3 88+700 74+315 14385 0.25 91000
Total 44035 415000
Section 1 covers the portion from downstream the hydropower plant UHE to the Sinmihaiu complex, section 2 from Sinmihaiu Roman to the Sinmartin Maghiar complex while section 3 goes from Sinmartin to the border with Serbia.
4.7. Storage of the dredged material
The dredged material will be stored on three sites downstream Timisoara city. The three proposed masses of dredged material will be isolated from the ground with plastic layers in order to prevent any further pollution of the soil or water table.
4.8. Proposed rehabilitation works
The present state of the construction is critical, the rolling gate, dating back from 1910 is in a very bad condition and collapse is forehead. When the weir breaks down, the canal section upstream Sinmihaiu Roman will be emptied to a large extent. That situation is unacceptable; in that case the canal in the city centre will be emptied, discharges of the drinking water plant and wastewater treatment plant must be stopped, and industrial water can no longer be extracted from the canal.
In order to be able to work on the weir construction, first a way of enabling the flow to pass the complex must be assessed. This is solved by using the lock as temporary weir. An overflow dam was projected to be built in the downstream bypass channel of the lock. During the first start of the project in 1989, the first tep has been builiding this temporary. Overflow dam and removing the downstream lock gates. Its present stat is such that it should be removed and rebuilt. The dam will have an earth core, with concrete slabs attached on the top. The top level of the dam will be +84.6 m. in the section upstream (in the city) the water level will be lowered accordingly during the construction period, to 84,8 m at the hydropower plant. Downstream the dam rock protection works will be constructed for energy dissipation and fixing the bottom of the canal.
The flow over the dam is projected to be on average 12m3/s. The design discharge over the dam is 36 m3 /s and the verfying discharge of 82 m3 /s, the flow will be regulated from the control works at Costei.
In order to rehabilitate the weir the old one must be completely demolished (up to the concrete foundation), including the dissipation structure

19
downstream the weir. Afterwards, the reconstruction works mainly consists of: installing anchor and rods for connecting old and new concrete.
Concrete works apron, foundation, piers and abutments; new energy dissipation structures; construction of concrete platform for locating mobile cranes for lifting heavy parts in place.
After being provided with a new anti-corosive protection system or newly ordered, the steel parts will be installed with mobile cranes.
4.9. Rehabilitation of the navigation lock
When the rehabilitation of the weir structure is finished, the dams to keep the working area will be removed and the flow will be sent to the weir. It is envisaged that the foundation of the lock construction, consisting of wooden piles, is still in good condition. A same foundation is used for the lock at Sinmartinu and during the reconstruction of the complex, it appeared the foundation was still in good shape and didn‟t need repairs or renewal. The buttom of the lock was always been in the water, thus the wooden piles will not be affected by rot.
4.10. Repairs of the canal banks
The bank protection works in the city of Timisoara have been globally inspected for their structural state. About 25% of the embankment will be replaced with tiles of 20 cm thickness. For reconstruction works, the level will be lowered to the minimal level accepted.
5. methodology to develop economic instruments
5.1. Economic instrument for maintaining appropriate land use
The latest report has presented a straightforward method to differentiate levies for changes in land use, in order to stop the deforestation process across the Timis Bega basin. Having had the distribution of land uses across the basin, corresponding estimates of runoff coefficients and the lump sum of damages produced in 2000 by foods, it is possible to upraise how much would cost the deforestation across the basin.
According to a rule of thumb the best allocation of land uses must be oriented towards those uses able to ensure smaller runoff coefficients. Having had records about the damages produced in a watershed by floods it is possible to assess to which extent any further change in the pattern of land use may increase expected loss ceteris paribus. This assumption of keeping constant all other factors causing a flood holds irrespective to the size of the basin because the only factor, which is fully controlled is the land use itself.
The method allowing a rough estimation of the economic loss caused by changing the land use is based on a sensitivity analysis of the following model.
20
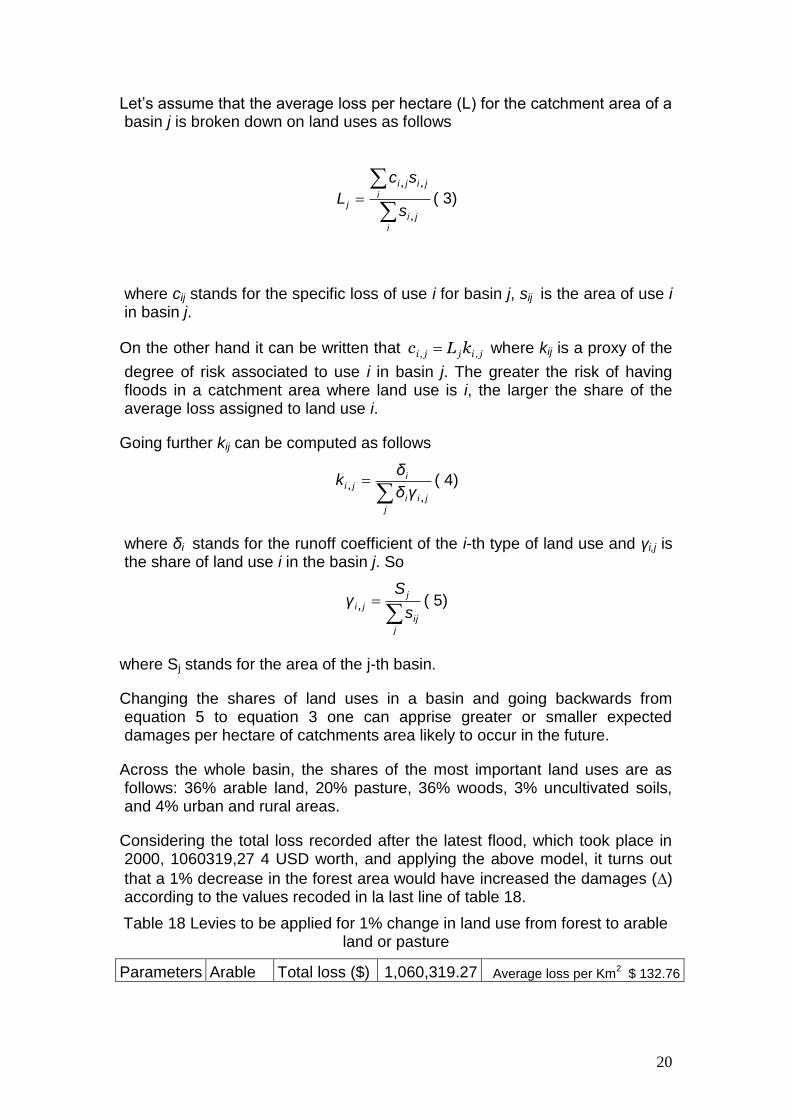
Let‟s assume that the average loss per hectare (L) for the catchment area of a basin j is broken down on land uses as follows
i
ji
i
jiji
js
sc
L,
,,
( 3)
where cij stands for the specific loss of use i for basin j, sij is the area of use i in basin j.
On the other hand it can be written that j,ijj,i kLc where kij is a proxy of the
degree of risk associated to use i in basin j. The greater the risk of having floods in a catchment area where land use is i, the larger the share of the average loss assigned to land use i.
Going further kij can be computed as follows
j
jii
iji
γδ
δk
,
, ( 4)
where δi stands for the runoff coefficient of the i-th type of land use and γi,j is the share of land use i in the basin j. So
j
ij
j
jis
Sγ , ( 5)
where Sj stands for the area of the j-th basin.
Changing the shares of land uses in a basin and going backwards from equation 5 to equation 3 one can apprise greater or smaller expected damages per hectare of catchments area likely to occur in the future.
Across the whole basin, the shares of the most important land uses are as follows: 36% arable land, 20% pasture, 36% woods, 3% uncultivated soils, and 4% urban and rural areas.
Considering the total loss recorded after the latest flood, which took place in 2000, 1060319,27 4 USD worth, and applying the above model, it turns out
that a 1% decrease in the forest area would have increased the damages () according to the values recoded in la last line of table 18.
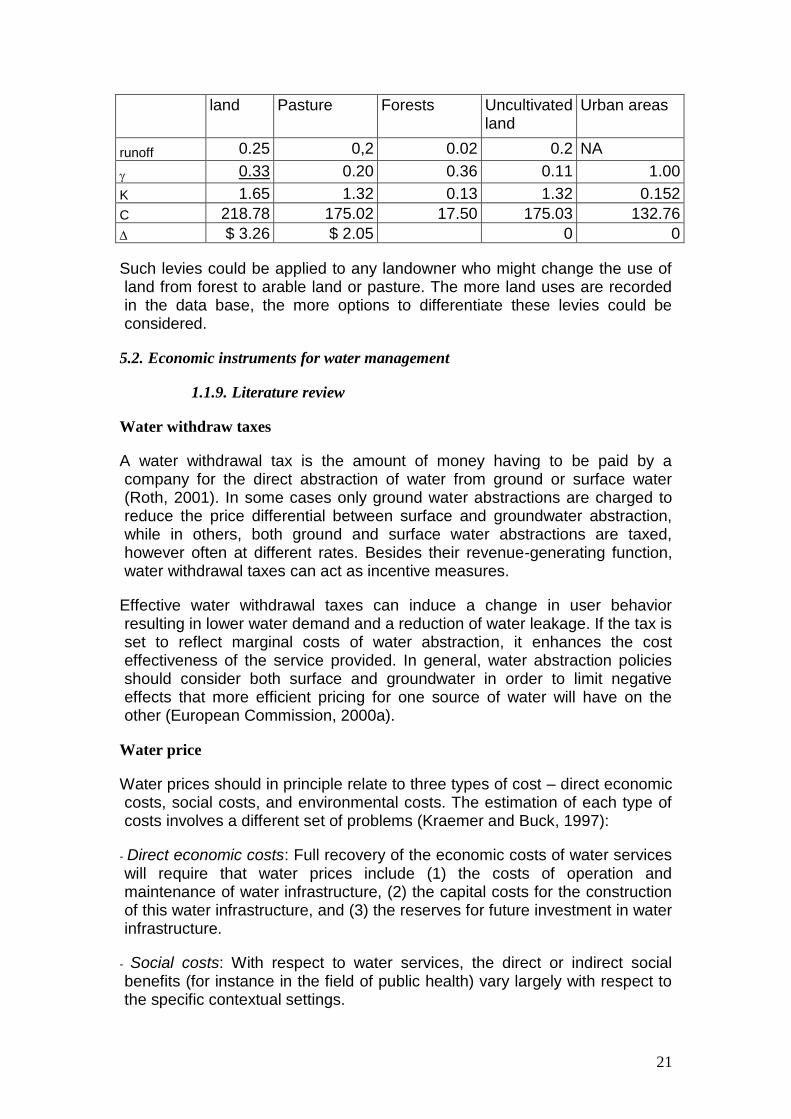
Table 18 Levies to be applied for 1% change in land use from forest to arable land or pasture
Parameters Arable Total loss ($) 1,060,319.27 Average loss per Km2 $ 132.76
21
land Pasture Forests Uncultivated land
Urban areas
runoff 0.25 0,2 0.02 0.2 NA
0.33 0.20 0.36 0.11 1.00
K 1.65 1.32 0.13 1.32 0.152
C 218.78 175.02 17.50 175.03 132.76
$ 3.26 $ 2.05 0 0
Such levies could be applied to any landowner who might change the use of land from forest to arable land or pasture. The more land uses are recorded in the data base, the more options to differentiate these levies could be considered.
5.2. Economic instruments for water management
1.1.9. Literature review
Water withdraw taxes
A water withdrawal tax is the amount of money having to be paid by a company for the direct abstraction of water from ground or surface water (Roth, 2001). In some cases only ground water abstractions are charged to reduce the price differential between surface and groundwater abstraction, while in others, both ground and surface water abstractions are taxed, however often at different rates. Besides their revenue-generating function, water withdrawal taxes can act as incentive measures.
Effective water withdrawal taxes can induce a change in user behavior resulting in lower water demand and a reduction of water leakage. If the tax is set to reflect marginal costs of water abstraction, it enhances the cost effectiveness of the service provided. In general, water abstraction policies should consider both surface and groundwater in order to limit negative effects that more efficient pricing for one source of water will have on the other (European Commission, 2000a).
Water price
Water prices should in principle relate to three types of cost – direct economic costs, social costs, and environmental costs. The estimation of each type of costs involves a different set of problems (Kraemer and Buck, 1997):
- Direct economic costs: Full recovery of the economic costs of water services will require that water prices include (1) the costs of operation and maintenance of water infrastructure, (2) the capital costs for the construction of this water infrastructure, and (3) the reserves for future investment in water infrastructure.
- Social costs: With respect to water services, the direct or indirect social benefits (for instance in the field of public health) vary largely with respect to the specific contextual settings.

22
Sewerage and Effluent Charges (Indirect Emissions)
Sewerage charges are tariffs paid for the discharge of used water. A sewerage charge is the amount of money paid for indirect discharges, that is domestic sewage or effluents discharged into the sewer system. Foremost, sewerage charges have the objective of providing environmental authorities with financial resources for water management activities (financial function). Furthermore, these charges may fulfil an incentive function and are in accordance with the polluter-pays principle by internalizing treatment costs into the decision process of users through adequate price signals (Kraemer and Piotrowski, 1995).
Tradable Permits
If disagreement exists over the allocation of water from shared resources among segments of the population, a potential instrument is the creation of transferable rights to use/pollute water and the creation of efficient markets on which the rights can be traded. The rationale behind water allocation through tradable rights is that in a perfectly competitive market, permits will flow towards their highest value use (Tietenberg, 2000). Permit holders that gain a lower benefit from using their permits (for example due to higher costs) would have an incentive to trade them to someone who would value them more. A sale will result in a situation of mutual benefit: the benefit the permit holder reaps from selling his permit will exceed the benefit he derives from using it, while the buyer gets more value out of the permit than he has to pay for it.
When discussing tradable permits systems relating to water, three fundamentally different fields of application can be discussed (Kraemer and Banholzer, 1999):
Tradable water abstraction rights for quantitative water resource management. These water rights can be permanent and unlimited (property rights to the water resource) or temporary and limited (transferable rights to use water without right of abuse);
Tradable discharge permits, or tradable water pollution rights, for the protection and management of (surface) water quality. Such pollution rights can relate to point or to nonpoint sources, and trades can even be arranged among different kinds of sources;
Tradable permits to use or consume water-borne resources, such as fish or the potential energy of water at height or the kinetic energy of water flowing.
Further distinctions can then be made within each of these fields of application. In relation to tradable water rights, distinctions can be made regarding the “intensity” of trading, which can be permanent or temporary (seasonal) or even one-off. With regard to water pollution rights, further differentiations can be made in relation to the polluting substance (or class of substances) in question (Kraemer and Banholzer, 1999).

23
Several prerequisites must be fulfilled for the successful implementation of a tradable permit system. First of all, property rights must be well-defined and specified in the unit of measurement (Kraemer, Interwies, Kampa, 2002). As a second point, water rights must be enforceable to secure the net benefits flowing from the use of the water rights for the rights holder. In the ideal case, transferable water rights should be separate from land use in order to create exposure to the opportunity to realize higher valued alternatives (Pigram, 1993). Finally, an efficient administrative system must be in place to ensure market working (Armitage, 1999).
Situations in which the conditions may not be adequately met include the possibility for market power, the presence of high transaction costs and insufficient monitoring and enforcement (Tietenberg, 2000). However, even in the presence of these imperfections, tradable permit programs can be designed to mitigate their adverse consequences.
Liability for Damage to Waters
Environmental liability systems intend to internalize and recover the costs of environmental damage through legal action and to make polluters pay for the damage their pollution causes. To that extent environmental liability laws are a fundamental expression of the polluter-pays principle. The intention of environmental liability laws can be twofold: first of all they aim at inducing polluters to make more careful decisions about the release of pollution according to the precautionary principle and second at ensuring the compensation of victims of pollution. While liability systems assess and recover damages ex post, they can nevertheless provide incentives to prevent pollution, as long as the expected damage payments exceed the benefits from noncompliance.
For liability to be effective it needs to be one or more identifiable actors (polluters); the damage needs to be concrete and quantifiable; and a causal link needs to be established between the damage and the identified polluter (European Commission, 2000c). Thus, liability is not a suitable instrument for dealing with pollution of a widespread, diffuse character where it is impossible to link the negative environmental effects with the activities of certain individual actors.
The instrument of environmental liability, therefore, conveys several advantages:
- Liability rules control pollution through the decentralized decisions of polluters to act in their own interest. Polluters will control pollution up to the point where the marginal pollution damage equals the marginal cost of control, thereby minimizing their total costs for compensating victims and controlling pollution;
- The provision that polluters must pay for the damage they cause provides great incentives to avoid environmental damage. The higher the anticipated payment in case of damage the higher the incentive for taking preventive measures would be (precautionary principle);

24
- Environmental liability laws constitute a significant step towards the application of the polluter-pays-principle.
Environmental liability will also be reflected in prices and is thus an important contribution towards realizing the principle of “ecologically honest prices”. All these features are summarized in table 19.
Table 19 Advantages and disadvantages of different types of economic instruments
Economic
instrument
Advantages Disadvantages
Water abstraction
charges
Adjustment of price signals to
reflect actual resource costs;
Encourage new technologies,
flexibility, generation of revenue
that can be used for water
management activities
Low charges/prices
have a minimal
impact on
user/polluter
bahaviiour and can
lead to resource over-
utilization
Pollution charges Same as above Same as above
Subsidies for
Environmental
R&D; tax
differentiation
Include a more eco-friendly
behaviour at any rate; easy
understandable
Rely on measurability
of single components;
regional aspects are
difficult to consider;
high monitoring costs
Pollution taxes Encourage the development of
cleaner technologies; leave the
choice to sources between
paying taxes or investing in
cleaner technologies; fulfil an
additional incentive function
Expensive
monitoring, which
requires appropriate
network and
equipment.
Water prices;
sewerage charges
Are in accordance with the user-
pays principle. May convey any
incentive function in addition to
financing or cost-recovery by
reflecting the true costs of water
Low willingness to
accept by public and
the target group
concerned
Financial subsidies Popular with recipients, promote
desirable activities rather than
prohibiting undesirable ones
Require funding, may
lead to economic
inefficiencies, may
encourage rent-
seeking behaviour
Earmarked taxes or
charges
Reduce the opposition to the tax
as those liable to pay benefit
from revenue in turn
Rely on the
measurability of
single components;
regional aspects are
difficult to consider
Liability
legislation
Assess and recover damages ex-
post but can also act as
prevention incentives; provide
strong incentives
Require an advanced
legal system; high
control costs; burden
of proof

25
Subsidies related to environmentally-friendly farming
In case of Romania, a large amount of subsidies for environmentally-friendly farming is not affordable. Therefore, the focus must be directed towards encouraging farmers to use small amounts of fertilizers and to administrate them appropriately.
1.1.10. Proposed measures: unique tradable permits on water use and
discharges combined with revolving bonds
Theoretical background
According to Tietemberg (1996, p:206), „to achieve an efficient allocation of water resources among the users, the marginal net benefit would have to be equalized across all users (including non-consumtive instream uses) of water”. The issue of water quality can be separate into two problems: water consumption and the pollution brought about by wastewater being discharged. The ecological goal each consumer is facing with might be stated as follows: “less water needed and less discharges with polluted water.
Extensive reviews on tradable permits in a broader context of market-oriented instruments can be found in Stavins, (2000) and Tietemberg (2000). Basically, dynamic efficiency is achieved by encouraging firms to innovate or to improve their technology in order to pay less pollution abatement costs (Burtraw, 2000).
According to different technological processes, that are different types of consumptions, the balance between water input and wastewater output differs on a wide range, and that makes difficult to implement a market-oriented mechanism based on fixed threshold of pollutants. This aspect would be overcome by a more flexible system presented in the next section.

26
Plugged into a reference system, the social cost of having polluted water, the private cost of cleaning water paid by the polluter, and the private cost of cleaning water paid by the water company (figure 1) reveal two optimum level of pollution: a social one (point A), and a private one (point B).
The problem is to determine polluters to discharge less volumes of wastewater in order to move the private optimum level from B to A.
Consider now two polluters, one (B) being more environmentally oriented than the other one (A), as it is shown in figure (figure 2). The marginal cost of cleaning the water is lower for the B Company, which managed to discharge 70% clean water. Its total cost is the triangle area between the origin, point T and point S. Probably, the other company, A, paid the same amount of money for cleaning the water, but its outcome is just 50% of cleaned water, due to a higher marginal cost. Assuming that B would have the right to be in the same position with A (50% cleaning water only), this right could be sold to A, in order to compensate its additional cost for cleaning more water. The “correct income” from such a transaction is given by the area of the trapeze RQTS.
Introducing such an economic instrument among polluting companies, each of them will be interested and motivated to do its best for cleaning water, either for earning some additional income to compensate environmental investments or for paying less for being allowed to further operate.
Certainly, such a mechanism won‟t work on volunteering basis; some regulations are required for ensuring the trade procedures and for preventing the collusion on the market.
100% clean water
discharges
Social cost of water pollution
Private cost of cleaning
water paid by the polluter Private cost of
water company
A B
€/1
000
m3
Figure 1Social optimum pollution level vs. private pollution level

27
According to the pollutants and their concentration in wastewater discharged, some companies may pay more than ecological bond, for being discouraged to pollute, to be penalised, and eventually closed down. The public authority has to set up two issues: 1) the appropriate consumption-based bond for water and 2) different weights for different polluters, in accordance to the extent to which these polluters affect the water quality and quantity. The quantitative aspect is important as to avoid abstracting more water as an input into the process with the view to dilute the wastewater discharged.
Designing the tradable revolving bonds system
When discussing tradable permit systems relating to water, three fundamentally different fields of application can be identified (Kraemer and Banholzer, 1999). Firstly tradable permits for water, or tradable water abstraction rights, can be used for quantitative water resource management. Secondly tradable discharge rights, or tradable water pollution rights, can be use to protect and manage (surface) water quality. Thirdly there are tradable permits to use or consume water borne resources, such as fish or the potential energy of water at height.
Regular tradable permits systems require a threshold level to be achieved by all polluters: those who manage to pollute below that threshold are allowed to sell their rights to pollute to all other companies that did not manage to observe the threshold, the market being left free, without any intervention. Such a mechanism is suitable for controlling a specific polluter produced by a quite homogeneous technology.
Revolving bonds are providing appropriate conditions for such a market: each company deposit a quantity-based bond at the beginning of each year for the amount of water supposed to be consumed. According to each company
70% 50% Clean discharges
A
B
Q
R S
T
€/1000 m3
Figure 2 Two polluters with different marginal cost for cleaning the water

28
pollutants outcome at the end of the year, all the bonds go to the most environmentally-friendly company. In case of the new system, the public authority would collect in advance some money from pollution companies as revolving bonds. The level of the revolving bond plays an important role as it depends on 1) the size of the market, expressed by the total amount of water consumed within one- year period in the basin.
Assume that for each thousand cubic meter of water, the public authority issues η tradable permits. At the end of the year each polluting company will have used up some of the permits it was given, according to the extent to which the discharged water was more or less polluted. All these negative externalities are being taken into account at the end of the year and the public authority is to assess for each company how many tradable permits have been saved for a thousand cubic meter of used water, as follows:
1111
m
i
i
m
i
ii k
Q
qkηN ; ( 6)
where the variables referring to the tract i have the following meanings: N - the number of permits saved at the end of the year;
- the initial number of permits grandfathered by the principal for each 1000 m3 of consumed water; Q - the amount of water consumed during the whole year, in 1,000 m3 ki – the weight of the i-th pollutant, corresponding to the degree to which this pollutant must be faze out. qi – the amount of discharged water polluted with item i. Assuming that a company would have discharged no pollutants, N would be equal to η, which means no consumed permits.
The weights associated to externalities are of crucial importance for compensating the relative advantage caused by different logging conditions. From the principal‟s point of view these weights should reflect the social risk – aversion. The appropriate manner to set up these weights is AHP (analytic hierarchy process) launched by Saaty (1980). The details of this approach, which is very flexible and allows for a objective participative decision making process are being presented in the next section.
Having this information (water consumption, discharges and weights associated with discharges, tradable permits and revolving bonds given per 1000 m3), the benchmark company can be easily designated, as having the greatest number of “saved” permits per thousand cubic meter of consumed water, which is denoted by greatest value of N. For each other polluter the number of permits to be purchased from the benchmark company is the product between the amount of consumed water and the difference between the benchmark (max N) and its own N. Doing so, the minimum income collected (I) by the benchmark company is given by relation (7).

29
j
n
j
j NNQBI
max
1
1
( 7)
where B stands for the bond per 1000 m3 of used water, Qj is the amount of water consumed by the j-th company, Nmax is the number of permits saved by the most environmentally-friendly company while Nj is the number of permits saved by the j-th company. The larger the difference between Nmax and Nj, the more that company owes to the benchmark one; the more water a non-benchmark company used, the more in debt that company would be, irrespective to the amount of water consumed by the benchmark company. This mechanism is very important both for the benchmark company – it secures revenues for retooling and keeping up small discharges – and for non-benchmark companies too, that would pay less if they either consumed less water or discharge less pollutants, or both.
Assume that company X has been assigned as the benchmark one: initially it received five permits per 1000 m3 of water and it consumed just one permit. The company Y used up 1.5 permits per 1000 m3, and consumed 150.000 m3. Y should buy from X 150,000 m3 times 0.5 permits per 1000 m3 (1.5-1), which is 75 permits. If Company Y has deposited at the end of the year a bond say, € 50,000 worth and has to pay € 70,000 for those 75 permits, it will pay just the difference of € 20,000, otherwise he will lose the right to operate next year, along with the € 50,000 bond.
An interesting problem worth discussing in this context is the relationship between the number of permits issued by the environmental competent authority, its ability to learn from the trade and the behaviour of the companies who are trading those permits, on a small market (Andersson, 1997). Assuming that the process is completely transparent for the environmental competent authority, simulations have proved the risk of issuing an insufficient number of permits. In such a case, there could be no differences among polluters in terms of consumed permits, and more than one company would be benchmarks. Therefore, it is recommended to issue more tradable permits in the first year, to be sure that only one company will be the benchmark. The environmental competent authority should be also aware that after a couple of years the number of failures might be lower, and the risk of a “unsure” market might occur again. To prevent this unwanted phenomenon, more permits are required.
Setting up weights on pollutants by AHP
A straightforward approach of setting up the weights for pollutants is considering the legal provisions and the extent to which polluters located in a watershed do or do not comply with those provisions.
Apart of the legal provisions, the assessment of pollutants weights must be based on the experience and judgement of local specialists in environmental protection, considering the risk of accidental spillover, which may neither be recorded nor reported. Such pollutants must be considered more dangerous

30
although their concentrations in the discharged water would be within the normal limits.
Another issue worth being considered is the place wherein used waters are to be discharged: rivers or the sewage network. Two different market, that is two different sets of bonds and permits should be conceived, as standards are different for the two types of discharges.
The AHP method (Saaty, 1980) allows for a reliable assessment of weights associated to each polluter considered, along with the extent to which the pairwise evaluation of pollutants weights is consistent or not. The consistency index is a good proxy of the degree to which pairwise assessments of goals or alternatives are consistent, having adopted the ranking scheme described in table 20.
Table 20 Interpretation of entries in a pairwise comparison matrix
Pairwise comparison of pollutants Note
i and j are equally important 1
i is a little bit more important than j 3
i is more important than j 5
i is much more important than j 7
i is extremely important in comparison with j 9
Having noted with aij the entries in comparison matrix, the following steps are to be followed (WINSTON, 1994):
1. Each aij note is divided by the sum on column i (1 i n), in order to get normalised values.
2. Average across lines all normalised values of A, in order to get proxies of the eigenvalues of matrix A, let WT be array of these eigenvalues. The values of WT array represent the weights associated to each polluter.
3. Multiplying the normalised matrix A with WT in order to get the Q array.
4. Compute I index according to relation (8):
n
iT
i
i
w
q
nI
1
1( 8)
Compute the consistency index, CI, as shown by relation (9):
1
n
nICI ( 9)
Check the consistency by comparing CI with a random index (RI) assumed to characterise a completely random pair-wise assessment. Values for RI are

31
presented in table 21. If CI/RI 0.1 the consistency is satisfactory, otherwise the overall assessment is meaningless.
Table 21 Values of the random index RI (WINSTON, 1994)
N 2 3 4 5 6 7 8 9 10
RI 0 0.58 0.90 1.12 1.24 1.32 1.41 1.45 1.51
Results - Hypothetical example of applying revolving bonds combined with
tradable permits
Consider 13 pollutant companies (table 23) with water consumptions (column 2), discharging three types of pollutants, each type bearing a different weight, according to the degree to which it affects the environment (columns 5-7).
Assuming no discounting, it turns out that the benchmark company income would be at least € 231,097 if the benchmark company didn‟t ask a higher price per permit, which might denote collusion on the market.
The public authority must issue enough permits per 1,000 m3 of water in order to secure such transactions. On the same data, reducing the number of permits to, say, 3 per 1,000 m3 of consumed water, it turns out that not only the total income of the benchmark company would have diminished to € 10,826, but only one company would have to pay more than the bond deposit, that is the company E, which is by far the most important pollutant, ceteris paribus.
The weights assigned to each pollutant should reflect not only their environmental negative impact, but also the cost of being controlled or monitored, considering also the risk of accidental spillover.
Such a mechanism does more than encouraging companies to adopt clean technologies: it provides financial incentives for investing in environmental improvements and makes all non-benchmark companies to internalise the environmental cost. The dotted line in figure 1, which is the private cost of the polluter, goes up, closer to the social cost, irrespective to the private cost of water company.
SWOT analysis
Although the system has just been drafted, without having any feedback from the real economy, a SWOT analysis can be done considering the expected behaviour of both public authority and companies that pollute in a water basin.
Table 22 summarises all expected strengths, weakness, opportunities and threats that may affect the functionality of the new system.
Table 22 SWOT analysis on revolving bonds combined with tradable permits system
Strengths intersectoral effects: cleaner industries are stimulated by the revolving
bonds and tradable permits

32
The best available and cheapest technology can be adopted by the BC
if and appropriate bond is being set up
Weakness Low bond and few permits per 1000 m3
of consumed water may
“flick” the system: a BC may not earn enough money for retooling
and the total bond goes +/- randomly to all companies operating in a
watershed;
Success depends on the monitoring accuracy
Some pollutants that have been neglected when the system was
designed, may turn out into real threats after a couple of years
Opportunities Small size company are encouraged, as they use less water
Heavy polluters are discouraged to the extent to which they threat the
environment by discharging pollutant with high weights
A share of the total bond may be used by the authority to better
control all companies
Saved bonds can be banked and transferred to the next year making
the system more attractive for companies
Threats On a long run, some industries will disappear in a water basin due to
the lack of competitiveness with much cleaner industries
The system may slack without updating from time to time both the
number of permits and the bond – the lower the range of saved
permits is, the less money goes to the BC.

33
Table 23 Simulated transactions for 6 permits and € 60 bond per 1,000 m3 water consumed
Company
Amount of water 1,000 m
3 Bond
Grand-fathered permits
Polluted water with substance…
Saved per 1000 m
3 (N
given by relation 6)
Difference to the benchmark
Value of purchased permits (col. 9 ·col. 2 · € 60 (Benchmark company income)
Bond left for the next year (col. 4 – col. 10)
Additional liability to the benchmark (col. 11- col. 3)
1 2 3
COD K=0,15
BOD K=0,25
Heavy metals K=0,60
1 2 3 4 5 6 7 8 9 10 11 12
A 800 € 48.000 4800 12 11 36 5.80 0.02 € 6,522 € 41,478 € -
B 300 € 18.000 1800 17 38 33 5.36 0.46 € 50,060 € - € 32,060
C 400 € 24.000 2400 45 30 48 5.35 0.47 € 68,007 € - € 44,007
D 600 € 36.000 3600 12 33 36 5,68 0.14 € 30,893 € 5,107 € -
E 100 € 6.000 600 16 21 44 3,96 1.87 € 67,303 € - € 61,303
F 300 € 18.000 1800 19 15 21 5,62 0.21 € 22,736 € - € 4,736
G 240 € 14.400 1440 13 24 27 5,40 0.43 € 37,175 € - € 22,775
H 480 € 28.800 2880 46 31 38 5,53 0.29 € 50,915 € - € 22,115
I 690 € 41.400 4140 30 33 12 5,83 0.00 € - € 41,400 € -
J 250 € 15.000 1500 36 23 30 5,30 0.53 € 47,351 € - € 32,351
K 450 € 27.000 2700 19 50 26 5,59 0.24 € 38,749 € - € 11,749
L 750 € 45.000 4500 23 35 50 5,66 0.16 € 44,313 € 687 € -
M 650 € 39.000 3900 29 21 19 5,81 0.02 € 4,766 € 34,234 € -
total € 231,097
34
6. Literature
Andersson, F., 1997: Small Pollution Markets: Tradable Permits versus Revelation Mechanisms. Journal of Environmental Economics and Management, 32, 38-50
Armitage, R.M.; W.L. Nieuwoudt and G.R. Backeberg 1999: ”Establishing Tradable Water Rights: Case Studies of Two Irrigation Districts in South Africa.” http://www.wrc.org.za/ wrcpublications/ wrcwatersa/ wsa9907c.htm. Water SA, Vol. 25, No. 3, 301-310.
Armitage, R.M.; W.L. Nieuwoudt and G.R. Backeberg 1999: ”Establishing Tradable Water Rights: Case Studies of Two Irrigation Districts in South Africa.” http://www.wrc.org.za/ wrcpublications/ wrcwatersa/ wsa9907c.htm. Water SA, Vol. 25, No. 3, 301-310.
Burtraw, D., 2000: Innovation Under the Tradable Sulfur Dioxide Emission Permits Program in the U.S. Electricity Sector. Resources for the Future, Discussion Paper 00–38, pp: 26.
European Commission 2000a: Pricing policies for enhancing the sustainability of water resources. http://europa.eu.int /comm/ environment/ docum/ 00477_en.htm No. COM(2000) 477 final
European Commission 2002a: Proposal for a Directive of the European Parliament and of the Council on Environmental Liability with Regard to the Prevention and Remedying of Environmental Damage. COM (2002) 17 final. http://europa.eu.int/comm/environment/liability/. Brussels.
European Commission 2002c: Making the Polluter Pay: Commission Adopts Liability Scheme to Prevent and Repair Environmental Damage. Press Release, http://europa.eu.int/comm/environment/liability/.
Kraemer, A. and K. M. Banholzer (1999). "Tradable Permits in Water Resource Management and Water Pollution Control" in OECD Implementing Domestic Tradable Permits for Environmental Protection (Paris: OECD).
Kraemer, R. Andreas and K. Banholzer 1999: "Tradable Permits in Water Resource Management and Water Pollution Control," in: OECD (ed.): Implementing Domestic Tradable Permits for Environmental Protection. Berlin.
Kraemer, R. Andreas and Matthias Buck 1997: Water Subsidies and the Environment. OECD/GD (97) 220. http://www.olis.oecd.org/olis/ 1997doc.nsf/LinkTo/ocde- gd(97)220. Paris: OECD.
Kraemer, R. Andreas and R. Piotrowski 1998a: "Policy Framework - Germany," in: Geerten J. I. Schrama (ed.): Drinking Water Supply and Agricultural Pollution, 93-122. Dordrecht: Kluwer Academic.
Kraemer, R. Andreas; Eduard Interwies and Eleftheria Kampa 2002: "Tradable Permits in Resource Protection and Management: A Review of Experience and Lessons Learned," in: OECD (ed.): Implementing Domestic Tradable Permits - Recent Developments and Future Challenges, 227-265. Paris: OECD.

35
Pigram, J. 1993: ”Property Rights and Water Markets in Australia.” Water Resources Research, Vol. 29, No. 4, 1313-1319.
Roth, Eva 2001: Water Pricing in the EU - A Review. http://www.eeb.org/ publication/Review%20Water%20Pricing%202001.pdf. Brussels: EEB (European Environmental Bureau).
Stavins, R.,N., 2000: Experience with Market-Based Environmental Policy Instruments. Resource for the Future, Discussion Paper 00-09, 67 p.
Tietenberg, Tom 2000: The Tradable Permits Approach to Protecting the Commons: What Have We Learned? Maine Colby College, http://www.colby.edu/personal/t/thtieten/papers.html.
Tietemberg, T., 1996: Environmental and Natural Resource Economics. Harper Collins College Publishers, Ed. IV, 614 p.
Saaty, T., L., 1980: The Analytic Hierarchy Process. Planning, Priority Setting, Resource Allocation. McGraw-Hill, New York, p. 283
Winston, W.,L., 1994: Operations Research. Aplication and Algorithms. Third Ed., Duxbury Press, p: 1277