Embed Size (px)
Citation preview


CONTENTS2 Corporate Information
4 Financial Highlights
6 Chairman’s Statement
10 Management Discussion and Analysis
26 Corporate Governance Report
36 Directors and Senior Management
42 Directors’ Report
54 Independent Auditors’ Report
56 Consolidated Statements of Income
57 Consolidated Statements of Comprehensive Income
58 Consolidated Balance Sheets
60 Company-Alone Balance Sheets
62 Consolidated Statements of Changes in Shareholders’ Equity
63 Consolidated Statements of Cash Flows
64 Notes to the Consolidated Financial Statements
186 Financial Summary
1

2
CORPORATE INFORMATION
Executive DirectorsReinold Geiger(Chairman and Chief Executive Officer)Emmanuel Laurent Jacques Osti(Managing Director)André Joseph Hoffmann(Managing Director Asia-Pacific)Thomas Levilion(Group Deputy General Manager, Finance andAdministration)
Non-executive DirectorsKarl GuenardMartial Thierry LopezPierre Maurice Georges Milet
Independent Non-executive DirectorsCharles Mark BroadleySusan Saltzbart KilsbyJackson Chik Sum Ng
Joint Company SecretariesKenny Yee Hing ChoySylvie Duvieusart-Marquant
Authorised RepresentativesAndré Joseph HoffmannKenny Yee Hing Choy
Company Legal NameL’Occitane International S.A.
Date of Incorporation
22 December 2000
Date of Listing in Hong Kong
7 May 2010
Registered Office
1, rue du Fort RheinsheimL-2419 Luxembourg

3
Headquarter Offices
1, rue du Fort RheinsheimL-2419 Luxembourg
Route de la Galaise 21228 Plan-Les-OuatesGenevaSwitzerland
Principal Place of Business in Hong Kong14/F, Universal Trade Centre3 Arbuthnot RoadCentral, Hong Kong
Stock Code973
Company Websitewww.loccitane.com
Audit CommitteeCharles Mark Broadley (Chairman)Martial Thierry LopezJackson Chik Sum Ng
Remuneration CommitteeEmmanuel Laurent Jacques Osti (Chairman)Charles Mark BroadleySusan Saltzbart Kilsby
Nomination CommitteeAndré Joseph Hoffmann (Chairman)Charles Mark BroadleySusan Saltzbart Kilsby
Principal BankersCrédit Agricole Corporate and Investment BankBNP ParibasCrédit Industriel et CommercialHSBC FranceSociété GénéraleCrédit du NordBRED - Banque Populaire
AuditorsPricewaterhouseCoopersCertified Public Accountants
Compliance AdviserKingsway Capital Limited
Principal Share Registrar and TransferOfficeBanque Privée Edmond de Rothschild20, Boulevard Emmanuel ServaisL-2535, Luxembourg
Hong Kong Share RegistrarComputershare Hong Kong Investor Services LimitedShops 1712-171617th Floor, Hopewell Centre183 Queen’s Road EastWanchaiHong Kong

4
FINANCIALHIGHLIGHTS

5
KEY FINANCIAL HIGHLIGHTSHighlights of results for the year ended 31 March 2010 2009
Net Sales (€ million) 612.2 537.3
Operating profit (€ million) 110.2 80.5
Net profit (€ million) 84.6 59.4
Gross Profit margin 81.2% 80.4%
Operating profit margin 18.0% 15.0%
Net profit margin 13.8% 11.1%
Return on total assets (ROA)(1) 19.4% 14.6%
Return on equity (ROE)(2 51.9% 31.5%
Current ratio (times)(3) 0.90 1.40
Gearing ratio(4) 14.2% 26.8%
Inventory turnover days(5) 230 233
Turnover days of trade receivables(6) 27 28
Turnover days of trade payables(7) 65 60
Total number of own stores(8) 764 687
Profit attributable to equity holders (€ million) 81.6 58.4
Basic earnings per share (€) 0.064 0.046
Notes:(1) Net profit / total assets
(2) Net profit attributable to equity holders of the Company / shareholders’ equity excluding minority interest
(3) Current assets / current liabilities
(4) Total debt / total assets
(5) Average inventory turnover days equals average inventory divided by cost of sales and multiplied by 365. Average inventory equals the average of net inventory at the
beginning and end of a given period.
(6) Turnover days of trade receivable equals average trade receivables divided by net sales and multiplied by 365. Average trade receivables equals the average of net trade
receivables at the beginning and end of a given period.
(7) Calculated using the average of the beginning and ending trade payables balance for the period, divided by total purchases for the period, multiplied by 365. In calculating
turnover days of trade payables, we use total purchases rather than cost of sales as our cost of sales do not take into account certain distribution, general and administrative
expenses that are included in our trade payables, whereas our total purchases include all payments to suppliers.
(8) L’Occitane and Melvita branded boutiques and department stores corners directly managed and operated by us. Net of the discontinuation of 10 Oliviers & Co. stores in the
USA in FY2010.

6
CHAIRMAN’S STATEMENT
Message fromREINOLD GEIGER
STRIVE FORPROFITABLEGROWTH
Over the past ten years we havesucceeded in developing a strongglobal company. This success hasbeen built on the demand for naturalingredient-based cosmetics whichhas been and is growing constantly.Furthermore, we put in place a strongmanagement team and performed agood deal of hard work.
On 7 May 2010 our company waslisted on the Hong Kong StockExchange. This marks for us thebeginning of a new era. We view theIPO as a catalyst for growth, allowingus to expand even more quickly thanin the past.
2009 has been a year of both upsand downs for the world economy.Despite this we achieved goodresults; revenue grew by 13.9% to€612.2 million and profit attributableto equity holders by 39.8% to €81.6million. Because of these goodresults during this difficult period, wedecided that there was no need forus to delay our IPO project anyfurther. The fact that we were veryheavily oversubscribed demonstratesthe extent to which investors haveconfidence in our company.
Continuing to focus on our retailexpertise, we opened a net 270stores and personalized corners thisyear, reaching a total of 1,541 storesof which 764 are operated by us.Through the contribution of our salesstaff around the world, most regionsexperienced positive growth withAsia continuing to lead the path.
Thanks to our R&D, marketing andsupply chain efforts we launched avery successful global high-end anti-aging product, the new L’OccitaneDivine Immortelle Cream. This newproduct was very recently awardedthe Innovation award by the FrenchAvantages women’s magazine, which

7
is the number two monthly women’s magazine in France.
During the year we also continued strengthening ourMelvita and Couvent des Minimes propositions and bothbrands experienced positive growth.
We are now entering the implementation phases of twokey organization projects; namely, the enhancement ofour supply chain capabilities and the implementation ofSAP as our new enterprise resource planning solution.These projects will enable us to maximize our ability togrow profitably in the long term.
We have all the tools in our hands to be even moresuccessful in the future. Today there is no other naturalcosmetic company with a worldwide distribution like
DURING THE YEAR WE ALSO CONTINUEDSTRENGTHENING OUR MELVITA AND COUVENT DES
MINIMES PROPOSITIONS AND BOTH BRANDSEXPERIENCED POSITIVE GROWTH.
ours. No competitor commands the same presence asus throughout the developed countries as well as in allthe emerging countries. Therefore, we have secured astrategic advantage and we will do everything possiblenot only to maintain it but also to increase it.
In summary, we have great potential to continuouslygrow our company worldwide.
DEVELOPED COUNTRIES
We are far from having reached maturity in thesemarkets, where we will significantly increase the numberof stores and further develop other distribution channels;in particular travel retail and e-commerce.

8
CHAIRMAN’S STATEMENT (CONTINUED)

9
BRIC COUNTRIES
Today we have a strong presence in Brazil, Russia and China and weopened our first store in India last December. It was hard work to getorganized and to commence operations in all those markets but today wehave effective management teams in place which can and will accelerateour business development.
We are also a socially responsible company. This is not because today it hasbecome a trendy fashion, but rather because with regard to working withnatural ingredients, having respect for nature, people and traditions, most ofour staff were involved from the beginning in actions to preserve nature andto help disadvantaged people.
With all the employees we form a big team, living an adventure andparticipating in building what will hopefully become a world leader in ourspecial area. You shareholders have now become a part of this team. Weare very proud that you have supported us and we will continue workingvery hard in order not to disappoint you.
Reinold GeigerChairman
24 June 2010

10
MANAGEMENTDISCUSSION ANDANALYSIS
Summary:
• Overall sales reached €612.2 million (FY2009: €537.3 million)
• Operating profit was €110.2 million, or 18.0% of total sales
(FY2009: €80.5 million, or 15.0% of total sales)
• Profit before tax was €112.1 million (FY2009: €76.3 million)
• Effective tax rate was 24.6% (FY2009: 19.6%)
• Profit for the year was €84.6 million, or 13.8% of total sales
(FY2009: €59.4 million, or 11.1% of total sales)
11
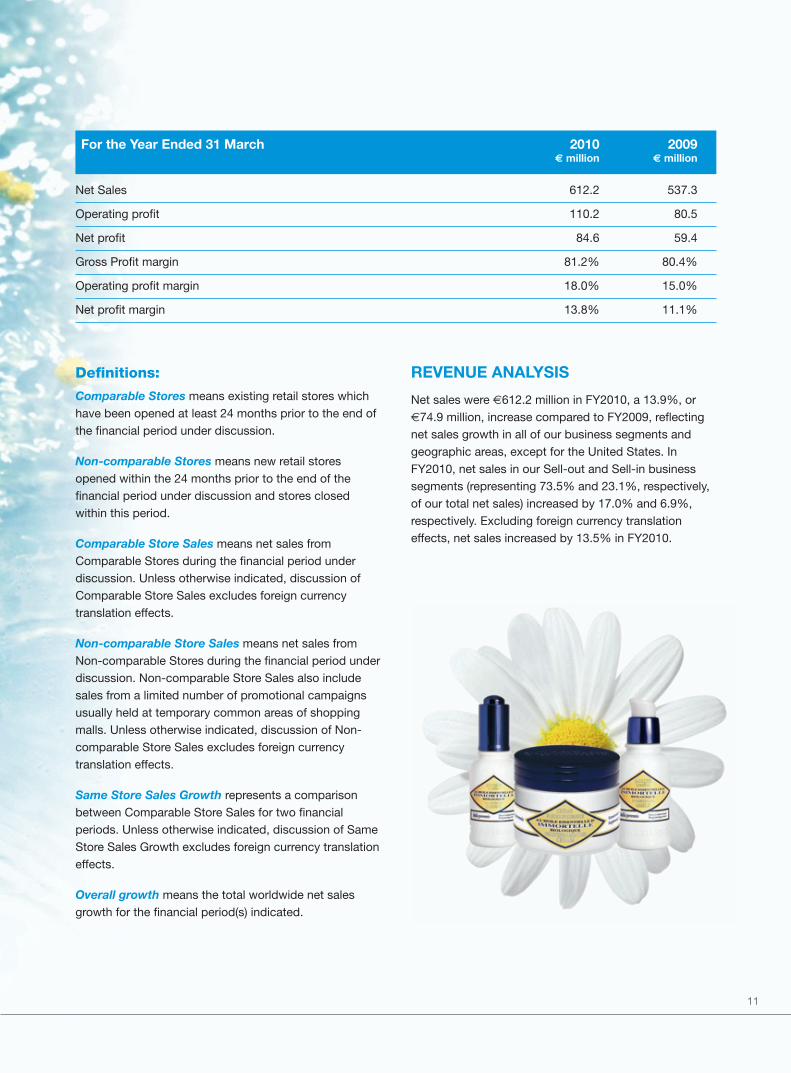
For the Year Ended 31 March 2010 2009€ million € million
Net Sales 612.2 537.3
Operating profit 110.2 80.5
Net profit 84.6 59.4
Gross Profit margin 81.2% 80.4%
Operating profit margin 18.0% 15.0%
Net profit margin 13.8% 11.1%
Definitions:
Comparable Stores means existing retail stores whichhave been opened at least 24 months prior to the end ofthe financial period under discussion.
Non-comparable Stores means new retail storesopened within the 24 months prior to the end of thefinancial period under discussion and stores closedwithin this period.
Comparable Store Sales means net sales fromComparable Stores during the financial period underdiscussion. Unless otherwise indicated, discussion ofComparable Store Sales excludes foreign currencytranslation effects.
Non-comparable Store Sales means net sales fromNon-comparable Stores during the financial period underdiscussion. Non-comparable Store Sales also includesales from a limited number of promotional campaignsusually held at temporary common areas of shoppingmalls. Unless otherwise indicated, discussion of Non-comparable Store Sales excludes foreign currencytranslation effects.
Same Store Sales Growth represents a comparisonbetween Comparable Store Sales for two financialperiods. Unless otherwise indicated, discussion of SameStore Sales Growth excludes foreign currency translationeffects.
Overall growth means the total worldwide net salesgrowth for the financial period(s) indicated.
REVENUE ANALYSIS
Net sales were €612.2 million in FY2010, a 13.9%, or€74.9 million, increase compared to FY2009, reflectingnet sales growth in all of our business segments andgeographic areas, except for the United States. InFY2010, net sales in our Sell-out and Sell-in businesssegments (representing 73.5% and 23.1%, respectively,of our total net sales) increased by 17.0% and 6.9%,respectively. Excluding foreign currency translationeffects, net sales increased by 13.5% in FY2010.
12
MANAGEMENT DISCUSSION & ANALYSIS (CONTINUED)
We increased the total number of retail locations whereour products are sold from 1,271 as at 31 March 2009 to1,541 as at 31 March 2010. Likewise, we increased thenumber of our own retail stores from 687 as at 31 March2009 to 764 as at 31 March 2010, representing acombination of the discontinuation of 10 Oliviers & Co.stores in the USA and a net increase of 87 ownL’Occitane and Melvita stores, including 34 additionalstores in Asia, 36 in Europe and 17 in the Americas.Excluding foreign currency translation effects,
Comparable Store Sales represented 3.9% of our overallgrowth in FY2010 while Non-comparable Store Salesduring the period represented 75.8% of our overallgrowth.
Sales in Japan, Hong Kong, the United Kingdom, Braziland in Other Countries, including China and Russia,were the driving factors of our net sales growth inFY2010.
Business Segments
The following table provides a breakdown of the net sales growth (including and excluding foreign currency translationeffects as indicated) by business segment for FY2010:
% Contribution to(€’000) % Growth % Growth(2) Overall Growth(2)
Sell-out 65,411 17.0 16.4 87.1
Comparable Stores 5,161 1.8 1.0 3.9
Non-comparable Stores 54,454 69.4 70.0 75.8
Other(1) 5,796 25.9 24.2 7.5
Sell-in 9,113 6.9 6.7 12.3
B-to-B 386 1.9 2.0 0.6
Overall Growth 74,910 13.9 13.5 100.0
(1) Includes mail-order, internet and other sales.(2) Excludes the impact of foreign currency translation effects.
Sell-out SegmentSell-out net sales increased by 17.0%, or €65.4 million,to €449.8 million in FY2010, as compared to FY2009,primarily due to our net addition of 77 stores between 31March 2009 and 31 March 2010, including net additionof 5 stores in Japan, 3 stores in Hong Kong, 6 stores inthe United Kingdom and 65 stores in Other Countries, aswell as the discontinuation of 10 Oliviers & Co. stores inthe USA. In Other Countries, we added notably 9 storesin China, 9 stores in Germany, 6 stores each in Russia,Korea and Poland, and 2 stores in Brazil. In addition, weacquired 12 stores from our Canadian distributor. Thenet sales of our own retail stores represented 79.7% ofour overall growth in FY2010 excluding foreign currency
translation effects, as compared to FY2009, with Non-comparable Stores providing 75.8% of the growth andComparable Stores providing 3.9% of the growthexcluding foreign currency translation effects,respectively. We experienced a Same Store SalesGrowth of 1.0% during the period, which was primarilydriven by an increase in sales transactions from bothexisting and new customers offsetting a slight decreasein the average prices of our products. The other sell-outactivities benefited primarily from the strongdevelopment of our internet sales. Our internet salesincreased by 32.1% and represented 6.5% of our overallsales growth excluding foreign currency translationeffects.
13
Excluding foreign currency translation effects, our Sell-out net sales increased by 16.4%, with such an increaserepresenting 87.1% of our overall net sales growth inFY2010, compared to FY2009.
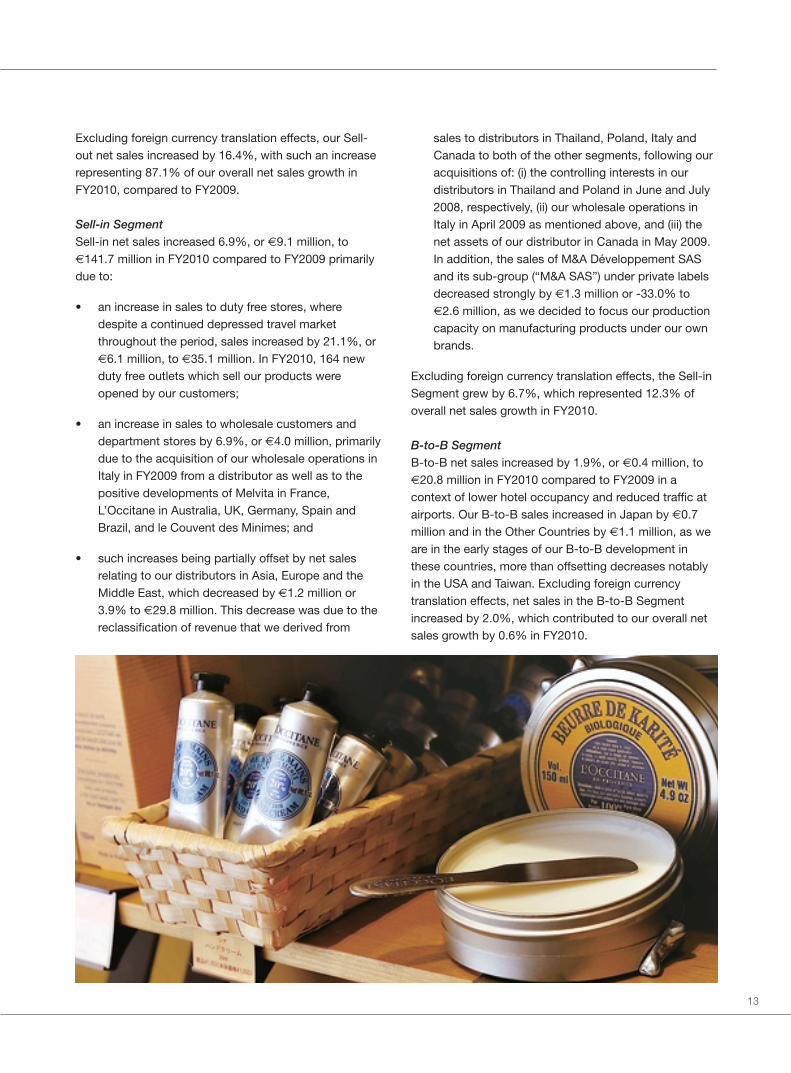
Sell-in SegmentSell-in net sales increased 6.9%, or €9.1 million, to€141.7 million in FY2010 compared to FY2009 primarilydue to:
• an increase in sales to duty free stores, wheredespite a continued depressed travel marketthroughout the period, sales increased by 21.1%, or€6.1 million, to €35.1 million. In FY2010, 164 newduty free outlets which sell our products wereopened by our customers;
• an increase in sales to wholesale customers anddepartment stores by 6.9%, or €4.0 million, primarilydue to the acquisition of our wholesale operations inItaly in FY2009 from a distributor as well as to thepositive developments of Melvita in France,L’Occitane in Australia, UK, Germany, Spain andBrazil, and le Couvent des Minimes; and
• such increases being partially offset by net salesrelating to our distributors in Asia, Europe and theMiddle East, which decreased by €1.2 million or3.9% to €29.8 million. This decrease was due to thereclassification of revenue that we derived from
sales to distributors in Thailand, Poland, Italy andCanada to both of the other segments, following ouracquisitions of: (i) the controlling interests in ourdistributors in Thailand and Poland in June and July2008, respectively, (ii) our wholesale operations inItaly in April 2009 as mentioned above, and (iii) thenet assets of our distributor in Canada in May 2009.In addition, the sales of M&A Développement SASand its sub-group (“M&A SAS”) under private labelsdecreased strongly by €1.3 million or -33.0% to€2.6 million, as we decided to focus our productioncapacity on manufacturing products under our ownbrands.
Excluding foreign currency translation effects, the Sell-inSegment grew by 6.7%, which represented 12.3% ofoverall net sales growth in FY2010.
B-to-B SegmentB-to-B net sales increased by 1.9%, or €0.4 million, to€20.8 million in FY2010 compared to FY2009 in acontext of lower hotel occupancy and reduced traffic atairports. Our B-to-B sales increased in Japan by €0.7million and in the Other Countries by €1.1 million, as weare in the early stages of our B-to-B development inthese countries, more than offsetting decreases notablyin the USA and Taiwan. Excluding foreign currencytranslation effects, net sales in the B-to-B Segmentincreased by 2.0%, which contributed to our overall netsales growth by 0.6% in FY2010.

14
MANAGEMENT DISCUSSION & ANALYSIS (CONTINUED)
Geographic Areas
The following table presents our net sales growth for FY2010 and contribution to net sales growth (including andexcluding foreign currency translation effects as indicated) by geographic area:
Net Sales GrowthFY2010 compared to FY2009
% Contribution to(€’000) % Growth % Growth(1) Overall Growth(1)
Japan 20,355 16.0 11.6 20.4
Hong Kong(2) 6,380 14.7 15.2 9.1
Taiwan 518 2.1 4.7 1.6
France 915 1.2 1.2 1.3
United Kingdom 4,792 18.4 25.1 9.0
United States (1,509) (1.7) (0.5) (0.6)
Brazil 6,242 32.4 23.0 6.1
Other Countries(3) 37,217 28.8 29.8 53.1
All countries 74,910 13.9 13.5 100.0
Notes:(1) Excludes the impact of foreign currency translation effects and reflects growth from all business segments, including growth from our own retail store sales.(2) Includes sales from Macau.(3) Calculated using a weighted average of constituent countries. Includes sales from Luxembourg, Swiss branch.
15
JapanNet sales in Japan increased by 16.0%, or €20.4 million,to €147.8 million in FY2010, as compared to FY2009.This growth primarily reflected higher net sales in ourSell-out segment. Net sales in our Sell-out segment inJapan rose by 15.8%, or €18.6 million, driven by Non-comparable Store Sales which represented 20.8% of ouroverall growth excluding foreign currency translationeffects. Between 31 March 2009 and 31 March 2010, weopened a net 5 stores in Japan. Comparable Store Salesdecreased by 4.9% primarily due to the impact of the
financial crisis on the Japanese economy. ComparableStore Sales negatively impacted upon our overall growthexcluding foreign currency translation effects by 4.7%.
Our Sell-in sales increased by 13.1%, or €1.1 million, inFY2010 compared to FY2009, primarily due to growth inthe corporate gift activity and to sales to QVC (televisionhome shopping) customers. Excluding foreign currencytranslation effects, net sales in Japan increased by11.6%.
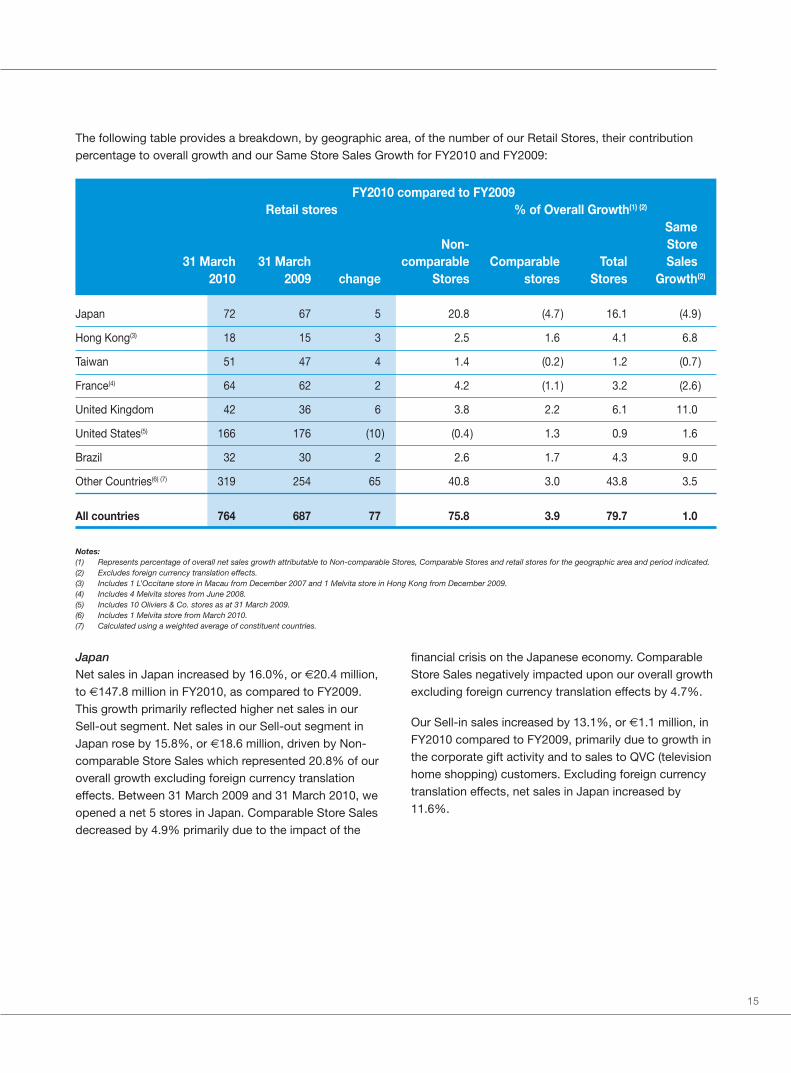
The following table provides a breakdown, by geographic area, of the number of our Retail Stores, their contributionpercentage to overall growth and our Same Store Sales Growth for FY2010 and FY2009:
FY2010 compared to FY2009Retail stores % of Overall Growth(1) (2)
SameNon- Store
31 March 31 March comparable Comparable Total Sales 2010 2009 change Stores stores Stores Growth(2)
Japan 72 67 5 20.8 (4.7) 16.1 (4.9)
Hong Kong(3) 18 15 3 2.5 1.6 4.1 6.8
Taiwan 51 47 4 1.4 (0.2) 1.2 (0.7)
France(4) 64 62 2 4.2 (1.1) 3.2 (2.6)
United Kingdom 42 36 6 3.8 2.2 6.1 11.0
United States(5) 166 176 (10) (0.4) 1.3 0.9 1.6
Brazil 32 30 2 2.6 1.7 4.3 9.0
Other Countries(6) (7) 319 254 65 40.8 3.0 43.8 3.5
All countries 764 687 77 75.8 3.9 79.7 1.0
Notes:(1) Represents percentage of overall net sales growth attributable to Non-comparable Stores, Comparable Stores and retail stores for the geographic area and period indicated.(2) Excludes foreign currency translation effects.(3) Includes 1 L’Occitane store in Macau from December 2007 and 1 Melvita store in Hong Kong from December 2009.(4) Includes 4 Melvita stores from June 2008.(5) Includes 10 Oliviers & Co. stores as at 31 March 2009.(6) Includes 1 Melvita store from March 2010.(7) Calculated using a weighted average of constituent countries.
16
MANAGEMENT DISCUSSION & ANALYSIS (CONTINUED)
Hong KongNet sales in Hong Kong increased by 14.7%, or €6.4million, to €49.7 million in FY2010, as compared toFY2009. This growth was driven by higher net sales inour Sell-out and Sell-in segments. Net sales in our Sell-out segment increased by 16.1% or €2.8 million. Theincrease in Sell-out sales was primarily due to increasednet sales from Non-comparable Stores, as we opened anet 3 new stores in Hong Kong in FY2010 and toincreased sales at our Comparable Stores. The Non-comparable Store Sales represented 2.5% of our overallgrowth excluding foreign currency translation effects.Our Comparable Store Sales grew by 6.8%, primarilydue to an increase in average sales per transactioncombined with an increased number of transactions andrepresented 1.6% of our overall growth excluding foreigncurrency translation effects.
Our Sell-in sales increased by 14.7%, or €3.6 million, inFY2010 as compared to FY2009, essentially due tostrong growth in sales to duty free customers. Stablesales to our Asian distributors (our sales are recordedbased on the location of the invoicing subsidiary) weredue to the acquisition of the controlling rights of ourformer distributor in Thailand in June 2008, offsettingincreased sales to other distributors. Excluding foreigncurrency translation effects, net sales in Hong Kongincreased by 15.2%.
TaiwanNet sales in Taiwan increased by 2.1%, or €0.5 million,to €24.7 million in FY2010, compared to FY2009. Thisincrease was mainly driven by an increase in Non-Comparable Stores Sales, which grew by 29.4% andrepresented 1.4% of our overall growth excluding foreigncurrency translation effects primarily as a result of ournet opening of 3 stores in FY2009 and 4 stores inFY2010. Comparable Store Sales decreased slightly by0.7%.
Our Sell-in sales increased by 218.7%, or €0.4 million, inFY2010 as compared to FY2009, essentially due to theaddition of new Sell-in activities in this country, namelycorporate gifts and distributors. Excluding foreigncurrency translation effects, net sales in Taiwanincreased by 4.7%.
FranceNet sales in France increased by 1.2%, or €0.9 million,to €78.1 million in FY2010, compared to FY2009. Thisgrowth was primarily driven by sales of M&A SAS,acquired in June 2008, which represented €1.3 million,or 1.7%, of our overall growth excluding foreign currencytranslation effects. M&A SAS sales benefited fromincreased sales under the Melvita brand of 16.9%, or€2.6 million, partly offset by lower private label salesrepresenting a decrease of €1.3 million, as a result offocusing our production capacity on the L’Occitane andMelvita branded products. Excluding the effect of M&ASAS’ sales, net sales in France decreased slightly by0.6%, or €0.4 million, to €57.7 million in FY2010 drivenprimarily by our Sell-out activities offset by decreases inthe Sell-in and B-to-B segments. Retail sales increasedby 2.4%, or €0.7 million, primarily due to Non-comparable Store Sales, while Comparable Store Salesdecreased by 2.6% as a result of lower demandthroughout FY2010. In FY2010, we opened a net of 2stores in France with related Non-comparable StoreSales representing 2.1% of our overall growth excludingforeign currency translation effects. Comparable StoreSales reduced our overall growth by 1.1% excludingforeign currency translation effects. Our internet salesgrew by 42.2%, or €0.5 million, which accounted for0.7% of our overall sales growth excluding foreigncurrency translation effects.
Excluding Melvita’s sales, our Sell-in sales fell by 7.6%,or €1.4 million, in FY2010 compared to FY2009, mainlydue to a decrease in sales to our distributor customersby 18.6%, or €1.5 million, as a consequence of theircautious buying and inventory reduction effortsstemming from weak consumer activity. Our B-to-Bsales decreased by 5.0% in FY2010 in the context oflower occupancy at our hotel customers.
17
United KingdomNet sales in the United Kingdom increased by 18.4%, or€4.8 million, to €30.8 million in FY2010, as compared toFY2009, and increased by 25.1% excluding foreigncurrency translation effects. This growth was mainlydriven by higher net sales in the Sell-out and Sell-insegments. Net sales in our Sell-out Segment, excludingforeign currency translation effects improved by 27.5%or €4.9 million due to increased sales at bothComparable Stores and Non-Comparable Stores duringthe period, with Comparable Stores Sales growing by11.0%. The increase in Comparable Store Sales was theresult of increased transactions combined with increasedaverage sales per transaction. Comparable Store Salesrepresented 2.2% of our overall growth excluding foreigncurrency translation effects. During FY2010, we openeda net of 6 stores in the United Kingdom with related Non-comparable Store Sales representing 3.8% of our overallgrowth excluding foreign currency translation effects.
Excluding foreign currency translation effects, our Sell-insales improved by 23.5%, or €1.7 million, in FY2010,compared to FY2009, reflecting the continued increasesin our sales to QVC (television home shopping)customers in the United Kingdom and to increased salesto department stores.
United StatesNet sales in the United States decreased slightly by1.7%, or €1.5 million, to €89.4 million in FY2010,compared to FY2009. Excluding foreign currencytranslation effects, net sales in the United Statesdecreased by 0.5% due to the lower sales of Oliviers &Co. products resulting from our discontinuation of thisactivity during FY2010.
Excluding Oliviers & Co., net sales in the United statesincreased by 0.6% excluding foreign currency translationeffects and contributed for 0.7% to our overall salesgrowth excluding such effects. This increase was drivenby sales in the Sell-out segment, partly offset bydecreases in the Sell-in and B-to-B segments. Net salesin our Sell-out Segment, excluding foreign currencytranslation effects improved by 3.5% or €2.6 million dueto increased sales at both Comparable Stores and Non-Comparable Stores during FY2010, with Comparable
Stores Sales growing by 1.6%. The increase inComparable Store Sales was the result of increasedtransactions partly offset by decreased average salesper transaction. Comparable Store Sales represented1.3% of our overall growth excluding foreign currencytranslation effects. During FY2010, we opened 5 storesbalanced by 5 closings. Combined with our net openingsof 3 stores in FY2009, the increase in related Non-comparable store sales represented 1.7% of our overallgrowth excluding foreign currency translation effects.During FY2010, our internet sales in the United Statesrepresented 8.6% of our total sales in this country andcontributed for 0.7% to our overall sales growthexcluding currency translation effects.
The Sell-in segment was primarily affected by lowersales of corporate gifts and by lower wholesale anddepartment stores sales, which decreased by 4.4% asthese customers reduced their inventories. As a result,net sales in the Sell-in segment decreased by €1.4million, or -16.2% excluding foreign currency translationeffects, contributing negatively for 1.9% to our overallsales growth excluding such effects.
BrazilNet sales in Brazil increased by 32.4%, or €6.2 million,to €25.5 million in FY2010, as compared to FY2009. Thisgrowth was driven primarily by higher net sales in theSell-out and Sell-in Segments. Net sales in our Sell-outSegment increased by 26.1% or €4.5 million due toSame Store Sales Growth of 9.0%, and to increasedNon-comparable Stores Sales. Comparable Store Salesrepresented 1.7% of our overall growth excluding foreigncurrency translation effects. In FY2010, we opened a netof 2 stores in Brazil, contributing to the increase in Non-comparable Store Sales, which represented 2.6% of ouroverall growth excluding foreign currency translationeffects.
Our Sell-in sales improved by €1.6 million in FY2010compared to FY2009 primarily due to our developmentof a network of distributors in Brazil and to increasedsales to local wholesalers. Excluding foreign currencytranslation effects, net sales in Brazil increased by23.0%.
18
MANAGEMENT DISCUSSION & ANALYSIS (CONTINUED)
Other CountriesNet sales in Other Countries increased by 28.8%, or€37.2 million, to €166.3 million in FY2010, as comparedto FY2009. This growth primarily reflected higher netsales in our Sell-out segment. Net sales in our Sell-outsegment grew by €31.7 million, primarily driven by thenet opening of 65 additional stores and Same StoreSales Growth of 3.5% (calculated by using a weightedaverage by country). During FY2010, we increased ourretail stores in, among other countries, China by 9, Koreaby 6, Russia by 6, Mexico by 3, and in the WesternEuropean countries (Belgium, Germany, Switzerland,Italy and Spain) by 15, in accordance with our expansionstrategy. Following the acquisition of the assets of ourdistributor in Canada, 12 stores were added. Non-comparable Store Sales in Other Countries accountedfor 40.8% of our overall growth during FY2010 whileComparable Store Sales accounted for 3.0% of ouroverall growth excluding foreign currency translationeffects. Excluding foreign currencies translation effects,net sales in Other Countries increased by 29.8%(calculated by using a weighted average by country).
PROFITABILITY ANALYSIS
Cost of Sales and Gross Profit
Cost of sales increased by 8.9%, or €9.4 million, to€115.0 million in FY2010 compared to FY2009. Ourgross profit margin increased by 0.9 points to 81.2% inFY2010. The increase in gross profit margin for FY2010mainly reflected:
• a favourable effect of the foreign currencies of 0.1points of net sales primarily due to the strongerJapanese Yen in FY2010;
• an improved brand mix effect as our sales ofL’Occitane brand products increased in FY2010relative to sales of our other brands whose grossprofit margins are generally lower than that ofL’Occitane brand products for 0.1 points; and
• an increase in the gross profit margin of L’Occitanebrand products of 0.6 points of net sales mainly dueto a favourable channel-mix effect as aconsequence of the stronger development of ourSell-out segment, accounting for 0.4 points of netsales and 0.2 points of net sales primarily due tolower freight costs on purchases and improvedproduction costs, partly offset by unfavourableselling price effects.
Distribution Expenses
Distribution expenses increased by 12.9%, or €31.0million, to €270.9 million in FY2010, as compared toFY2009. As a percentage of net sales, our distributionexpenses decreased by 0.4 point to 44.2% of net salesin FY2010, as compared to FY2009. This decrease wasprimarily due to our L’Occitane brand and is attributableto a combination of:
• lower freight on sales resulting notably from reducedair shipments of 0.4 points of net sales;
• reduced pre-opening costs mainly due to feweropenings in Western Europe notably and to highcosts incurred in FY2009 for the opening of spasand cafés representing 0.2 points of net sales;
• the reversal of unused bad debts provisions bookedin FY2009 for 0.4 points of net sales; and
• the above were partially offset for 0.6 points of netsales by increases relating to higher rent andoccupancy costs and personnel expenses as apercentage of net sales primarily due to a highershare of retail sales in our total sales.
19
Marketing Expenses
Marketing expenses increased by 0.4%, or €0.2 million,to €59.6 million in FY2010, as compared to FY2009. Ourmarketing expenses, as a percentage of net sales,decreased by 1.3 points to 9.7% of net sales in FY2010,as compared to FY2009. This reduction of our marketingexpenses by 1.3 points of net sales is attributableprimarily to:
• a reduction of our inventory of promotional goods,including samples and testers, during FY2010,whereas our inventory of promotional goodsincreased in the corresponding period in 2009,which resulted in a reduction in marketing expensesby 1.3 points of net sales;
• lower advertising expenses which resulted in areduction in marketing expenses by 0.4 points as apercentage of net sales, partly due to higherexpenses incurred during FY2009 in Japan for ourspecial investment in the mail order activity in orderto increase our market share, and to lower marketingcosts for the L’Occitane brand partly due to loweradvertising fees during the financial crisis; and
• Such decrease in advertising expenses being offsetby increased direct marketing spending, andpersonnel expenses in relation to the reinforcementof our marketing teams at M&A S.A.S.
General and Administrative Expenses
General and administrative expenses increased by13.0%, or €6.6 million, to €59.4 million in FY2010, ascompared to FY2009 and decreased as a percentage ofnet sales from 9.8% in FY2009 to 9.7% in FY2010. Thisdecrease as a percentage of net sales was primarilyattributable to the reinforcement of our administrativestructures in some subsidiaries and Melvita for 0.1 pointof net sales, and to increased costs of share-basedpayments, more than offset by the costs incurred inFY2009 in relation to the initial public offering (“IPO”)project which was postponed due to the adversefinancial market conditions. As the IPO was not probableas at 31 March 2009, all of the costs attributable to theCompany were expensed in FY2009 for €2.0 million.
Operating Profit
Operating profit increased by 36.9%, or €29.7 million, to€110.2 million in FY2010 as compared to FY2009, andour operating profit margin increased by 3.0 points from15.0% in FY2009 to 18.0% in FY2010. The increase inour operating profit margin was primarily due toimproved gross profit margin by 0.9 points, our decreasein operating expenses by 1.8 points as previouslydiscussed, and also due to increased other gains of €2.0million, which mainly related to the disposal of the keymoney of our store in Soho, New York (USA) in April2009.
Net Finance Costs
Net finance costs decreased by €2.3 million, to €3.5million in FY2010 compared to FY2009. This decreasewas mainly related to reduced borrowings as a result ofthe increase of our cash flow from operations and lowercapital expenditures and lower interest rates applicableto our borrowings in FY2010 as a consequence of lowerinterest rates in general following the recent globalfinancial crisis.
Foreign Currency Gains/Losses
Our net foreign currency gains amounted to €5.5 millionin FY2010. The net gains of €5.5 million in FY2010 weremainly due to:
• realized net gains on inter-company and externaltrading transactions for €3.0 million, primarilyachieved on the US dollar and the Japanese Yen;
• unrealized net gains related to financing in foreigncurrencies, achieved notably on the Korean Won,Russian Ruble, US, Hong Kong and Australiandollars, contributing €2.4 million.
20
MANAGEMENT DISCUSSION & ANALYSIS (CONTINUED)
Income Tax Expense
The effective rate for income taxes was 24.6% in FY2010as compared with 22.2% for FY2009. The increase in theeffective tax rate was mainly a consequence of ourpolicy to decrease our inventories in the distributionsubsidiaries during FY2010. To achieve this objective wehave produced less and have consumed the inventorieslocated in the distribution entities as at 31 March 2009.As the profit generated by these subsidiaries is taxed ata higher rate than the profit generated by our productionand central distribution entities, this led to an increase inthe effective tax rate.
Profit for the Year
For the aforementioned reasons, profit for the yearincreased by 42.4% or €25.2 million to €84.6 million inFY2010, as compared to FY2009. The profit for theperiod attributable to the minority interests increased by€1.9 million, or 193.0%, notably due to the increase ofprofits in our joint-ventures in Taiwan, Korea and Mexico.As a result, the profit for the year attributable to equityholders of the Company increased by 39.8%, or €23.2million. Basic and diluted earnings per Share improvedby 39.8% from €0.046 to €0.064 with the number ofShares used in both calculations remaining unchanged inFY2009 and FY2010 at 1,274,396,391.
BALANCE SHEET REVIEW
Liquidity and Capital Resources
As at 31 March 2010, we had cash and cash equivalents of €41.8 million compared with €27.3 million as at 31 March2009.
The following table sets forth our borrowings as at the dates indicated:
As at 31 March 2010 2009€’000 €’000
Capex facility(2) 36,527 48,275
Revolving facility(2) — 16,507
Other bank borrowings(1) 4,671 5,999
Finance lease liabilities(3) 11,265 7,274
Current accounts with minority shareholders and related parties(4) 5,968 30,561
Bank overdrafts 3,438 351
Total 61,869 108,968
Notes:(1) Certain bank borrowings are secured by key moneys. As at 31 March 2010, the net book value of key moneys was €18.9 million.(2) The capex facility and revolving facility are part of our 2007 credit facility. As at 28 May 2010, all amounts due by L’Occitane Group S.A. (“LOG”), ourselves and L’Occitane S.A.
under the 2007 Credit Facility have been repaid in full and the 2007 credit facility has been terminated.(3) Finance lease liabilities relate primarily to land and building for the Manosque and Lagorce factories and premises. On 30 March 2010, we signed a new finance lease
agreement in connection with (i) the acquisition of the existing land and building of Melvita for an amount of €4.9 million and (ii) the extension and restructuring of the plant foran amount of €9.1 million. As at 30 March 2010, an amount of €4.9 million was drawn.
(4) Current accounts include loans and advances from minority shareholders of certain subsidiaries of the Company.
As at 31 March 2010, the aggregate amount of undrawn borrowing facilities was €125.5 million. In April, May and June2010, we have drawn €110.1 million in bank borrowings on our existing bank facilities to finance principally therepayment of the LOG current account, and €11.5 million to partially finance the repayment in full of our capex facility.

21
Investing Activities
Net cash used in investing activities was €35.6 million inFY2010 compared to €100.1 million in FY2009. The netcash used in FY2010 reflected capital expendituresmainly related to:
• the acquisition of net assets from our distributor inCanada for €4.6 million;
• the acquisition of the remaining minority interests inL’Occitane Do Brasil S/A for €2.7 million. After thistransaction, L’Occitane Do Brasil S/A is now whollyheld by our Company;
• the additions of leasehold improvements and othertangible assets related to the opening of new storesfor €12.0 million;
• the additions of machinery and equipment, land andbuildings, other tangible assets and tangible assetsin progress for €16.3 million, primarily for ourpremises at Manosque, Lagorce and the USA. Thetangible assets in progress are mainly related to therefurbishment of the plant’s store, the furniturerelated to stores that are not yet opened and to theextension of the plant in Lagorce;
• additions in intangible assets of €7.5 million,reflecting the acquisition of additional key moneysprimarily in France, Brazil, and Mexico for €2.3million, and the additions of other intangible assetsand intangible assets in progress primarily in ITsoftware for €5.1 million;
• the net increase in deposits and key moneys paid tolandlords of €1.5 million; and
• proceeds from the disposal of fixed assets for €3.1million primarily related to the disposal of the keymoney of our Soho store in New York, USA.
As at 31 March 2010, we had capital expenditurescontracted for but not yet incurred of €7.5 million forimprovements to our manufacturing facilities. We arealso in the process of implementing worldwide SAP asour ERP (Enterprise Resource Planning) system tosupport, in an efficient and integrated way, our supplychain and financial processes. The estimated overallexpenses relating to the SAP project is approximately€16 million.
Financing Activities
Net cash used in financing activities was €88.5 million inFY2010 compared to cash generated from financingactivities of €36.9 million in FY2009 and mainly reflectedthe following:
• a €32.0 million dividend paid to L’Occitane GroupeS.A. (“LOG”) , our controlling shareholder, related toscheduled repayments and interests due by LOG inrelation to our 2007 credit facility;
• the repayment in full of the financing from our parentcompany for €24.4 million;
• a net decrease in bank borrowings and other financeleases of €31.1 million, notably reflecting therepayment in full of our Revolving facility for €16.5million and a part repayment of our capex facility for€11.8 million.

22
MANAGEMENT DISCUSSION & ANALYSIS (CONTINUED)
Inventories
The following table sets out a summary of our average inventory days for the periods indicated:
For the year ended 31 March 2010 2009
Average Inventory turnover days(1) 230 233
Note:(1) Average inventory turnover days equals average inventory divided by cost of sales and multiplied by 365. Average inventory equals the average of net inventory at the
beginning and end of a given period.
Inventory turnover days decreased 3 days between FY2009 and FY2010, primarily due to decreased raw materials andwork in progress and increased allowances relative to the cost of sales.
Trade Receivables
The following table sets out a summary of our turnover of trade receivables for the periods indicated:
For the year ended 31 March 2010 2009
Turnover days of trade receivables(1) 27 28
Note:(1) Turnover days of trade receivable equals average trade receivables divided by net sales and multiplied by 365. Average trade receivables equals the average of net trade
receivables at the beginning and end of a given period.
Turnover of trade receivables decreased by 1 day from FY2009 to FY2010 primarily due to improved collection of tradereceivables in our Sell-In Segment and to a favourable channel-mix effect as a consequence of the strongerdevelopment of our Sell-out Segment.
Trade Payables
The following table sets out a summary of our average trade payables, total purchases and turnover of trade payablesfor the periods indicated:
For the year ended 31 March 2010 2009€’000 €’000
Average trade payables(1) 55,321 52,202
Total purchases 311,345 316,300
Turnover days of trade payables(2) 65 60
Notes:(1) Average trade payables equals to the average of the beginning and ending balance of trade payables for the respective period.(2) Calculated using the average of the beginning and ending trade payables balance for the period, divided by total purchases for the period, multiplied by 365. In calculating
turnover days of trade payables, we use total purchases rather than cost of sales as our cost of sales do not take into account certain distribution, general and administrativeexpenses that are included in our trade payables, whereas our total purchases include all payments to suppliers.

23
From FY2009 to FY2010, our trade payables increased by €9.2 million or 5 turnover days of purchases. This increasewas mainly related to increased payables in relation to purchases at Melvita and in the UK, Hong Kong and L’OccitaneInternational, partly offset by a decrease at L’Occitane SA (France). The increase at L’Occitane International was mainlydue to accrued expenses in relation to our IPO, whilst the decrease of turnover days in France was partly attributable toa new law passed in France effective 1 January 2009 that automatically entitles suppliers to charge financial penaltieswhere a supplier is paid later than 60 days net (or 45 days after the end of the month of the invoice), thereby leading usto pay our suppliers in France earlier starting in 2009.
Balance Sheet Ratios
The Group considers that its financial position is strong and improved in FY2010 notably as a result of the increasedprofitability of its assets, its lower working capital, and its strong net cash position following its successful IPO.
For the year ended 31 March 2010 2009
Profitability
Return on total assets (ROA)(1) 19.4% 14.6%
Return on equity (ROE)(2) 51.9% 31.5%
Liquidity
Current ratio (times)(3) 0.90 1.40
Quick ratio (times)(4) 0.58 0.78
Capital adequacy
Gearing ratio(5) 14.2% 26.8%
Debt to equity ratio(6) 12.4% 43.6%
Notes:(1) Net profit / total assets(2) Net profit attributable to equity holders of the Company / shareholders’ equity excluding minority interest(3) Current assets / current liabilities(4) Current assets - inventories / current liabilities(5) Total debt / total assets(6) Net debt / total assets - total liabilities * 100%
24
MANAGEMENT DISCUSSION & ANALYSIS (CONTINUED)
Foreign Exchange Risk Management
We enter into forward exchange contracts to hedgeanticipated transactions, as well as receivables andpayables not denominated in our presentation currency,the Euro, for periods consistent with our identifiedexposures. As at 31 March 2010, we had foreignexchange derivatives net liabilities of €1.3 million in theform of forward exchange contracts (in accordance withfair market valuation requirements under IFRS). Thenotional principal amounts of outstanding forwardexchange derivatives as at 31 March 2010 were Japaneseyen 4,038 million, US dollars 2.8 million, Canadian dollar0.9 million, Australian dollar 2.9 million, Mexican peso 11.8million, Thai baht 40.8 million and British pound 2.8 million.
Interest Rate Risk Management
We enter into interest rate derivative contracts to managethe exposure to fluctuations of interest rates on our long-term borrowings. As at 31 March 2010, we had interestrate derivative liabilities of €1.6 million. The notionalprincipal amount of outstanding interest rate derivatives asat 31 March 2010 was €26.3 million.
Dividends
In FY2009, we paid a dividend of €0.024 per share toshareholders of record at the close of business on 1October 2008. The total dividend of €30,000,000 was paidto LOG on 1 October 2008.
On 29 June 2009, our Board proposed a dividend of€0.025 per share representing a total dividend of€32,000,000 subject to shareholders’ approval. Theshareholders approved this dividend at a meeting whichoccurred on 30 September 2009. The total dividend of€32,000,000 was paid to LOG on 16 November 2009.
On 9 April 2010, our Board approved the payment of anexceptional dividend of €0.063 per share, representing atotal dividend of €80.0 million, out of our distributablereserves of €112.3 million as of 31 March 2009 calculatedbased on Luxembourg Generally Accepted AccountingPrinciples. The dividend payment was funded from ourinternal financial resources. The shareholders approvedthis dividend at a meeting held on 31 March 2010. Thedividend was paid on 4 May 2010.
The Board does not recommend the payment of adividend for the year ended 31 March 2010.
POST-BALANCE SHEET EVENTS
On 7 May 2010, the Company was listed on the mainboard of the Hong Kong stock exchange. 364,120,000shares of the Company were sold at a unit price ofHKD 15.08. Out of these 364,120,000 shares,182,060,000 shares were sold by LOG and182,060,000 were newly issued shares as provided forby the Shareholders’ Meeting held on 31 March 2010.Consequently, the Company received gross proceedsof HKD 2,745,465,000 and the shareholding of LOG inthe share capital was reduced to 75%.
On 28 May 2010, the underwriters to the global offeringexercised their over-allotment option for a total numberof shares of 41,017,000. Out of these 41,017,000 shares,20,508,500 shares were sold by LOG and 20,508,500were newly issued shares as provided for by theShareholders’ Meeting held on 31 May 2010.Consequently, the Company received additional grossproceeds of HKD 309,268,000 and the shareholding ofLOG in the share capital was reduced to 72.57%.
In April, May and June 2010, an additional amount of€110.1 million in bank borrowings was drawn on ourexisting bank facilities to finance principally therepayment of the LOG current account and therepayment in full of our capex and revolving facilities.
In FY2007, LOG, the Company, and L’Occitane S.A., aFrench subsidiary, entered into a senior credit facilityagreement in the principal amount of €280.0 million (the2007 Credit Facility) made up of a medium term seniorloan of €205.0 million that can be drawn only by LOG(the Acquisition Facility), a capital expenditures facility of€50.0 million (the Capex Facility), and a multi-currencyrevolving facility of €25.0 million (the Revolving Facility).As at 28 May 2010, all amounts due by LOG, theCompany and L’Occitane S.A. under the 2007 CreditFacility have been repaid in full and the 2007 CreditFacility has been terminated.
The amendment to the articles of association ofL’Occitane International S.A has been approved by theShareholder’s meeting held on 15 April 2010 and a list ofundistributable reserves has been added.
On 9 April 2010, the sole shareholder of the Company,LOG resolved that a value of €0.03 be designated as thepar value per ordinary share in the share capital of the

25
Company so that the subscribed share capital of theCompany amounting to €38,232,000 be represented by1,274,396,391 shares having a par value of €0.03. Inaccordance with IAS 33, the calculation of basic anddiluted earnings per share for all periods presented hasbeen adjusted retrospectively.
On 28 May 2010, the Company signed a term sheet withone of its banks, under which this bank will arrange anew syndicated credit facility in favour of the Companyfor a minimum amount of €300.0 million with a 5 yearsmaturity, as approved by the Company’s Board ofDirectors on 24 June 2010.
STRATEGY AND FUTURE PROSPECTS
Looking forward to FY2011, the Group will focus on theexecution of its expansion plan, taking advantage of itsincreased financial resources as a result of its successfulIPO.
We will continue to increase the number of our RetailStores internationally, and in particular, in countrieswhere we believe there is likely to be a growth in demandfor our products. These may include high growthemerging markets such as China, Brazil, Russia, Indiaand Mexico as well as developed countries where westill have significant potential for opening new storessuch as Japan, the US, the UK, Germany and Korea. Ouroverall sales will also benefit from a recovery of our
same stores sales growth and the further expansionof our non-retail activities, particularly in travel retailand internet sales. We plan to develop our internet salesin countries where we have not yet started to leverageour know-how in this domain.
Our sales expansion strategy will be supported byfurther efforts in marketing and R&D, particularly inthe face care segment, and by the success of some ofour recent product launches like Divine Immortelle andPeony.
We will execute our plans for the extension andimprovement of our manufacturing plants inManosque and in Lagorce, and to build a new centralwarehouse. These extensions and improvements to ourmanufacturing plants are needed principally in order tocomply with new ISO standards that will apply to us andto improve our production quality and efficiency. Thebuilding of a new warehouse is needed principally toincrease our warehousing capacity. The first parts of thenew premises in Lagorce and Manosque are planned tostart operating at the end of FY2011.
The strategic driver of our operational excellence willbe the implementation of SAP as our future EnterpriseResource Planning system. FY2011 will see go-lives ofthe central and French sales and distribution modules,whilst the first distribution subsidiaries will go livebeginning of FY2012.

26
CORPORATEGOVERNANCE REPORT
27
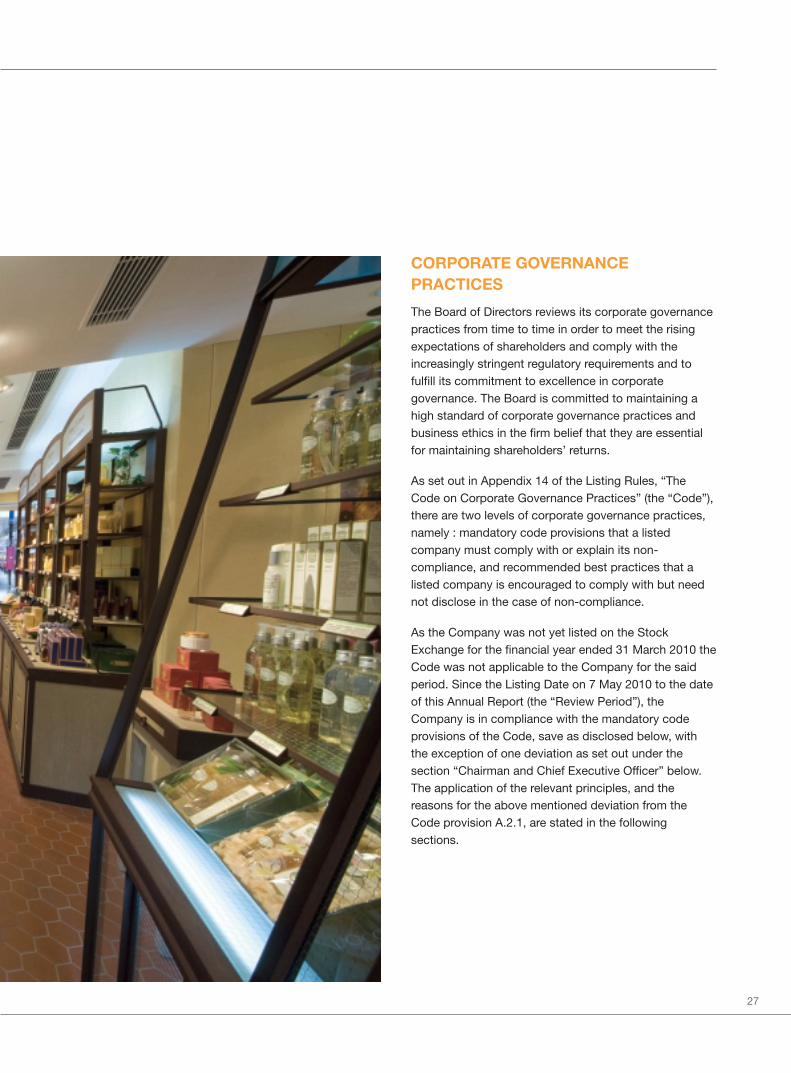
CORPORATE GOVERNANCEPRACTICES
The Board of Directors reviews its corporate governancepractices from time to time in order to meet the risingexpectations of shareholders and comply with theincreasingly stringent regulatory requirements and tofulfill its commitment to excellence in corporategovernance. The Board is committed to maintaining ahigh standard of corporate governance practices andbusiness ethics in the firm belief that they are essentialfor maintaining shareholders’ returns.
As set out in Appendix 14 of the Listing Rules, “TheCode on Corporate Governance Practices” (the “Code”),there are two levels of corporate governance practices,namely : mandatory code provisions that a listedcompany must comply with or explain its non-compliance, and recommended best practices that alisted company is encouraged to comply with but neednot disclose in the case of non-compliance.
As the Company was not yet listed on the StockExchange for the financial year ended 31 March 2010 theCode was not applicable to the Company for the saidperiod. Since the Listing Date on 7 May 2010 to the dateof this Annual Report (the “Review Period”), theCompany is in compliance with the mandatory codeprovisions of the Code, save as disclosed below, withthe exception of one deviation as set out under thesection “Chairman and Chief Executive Officer” below.The application of the relevant principles, and thereasons for the above mentioned deviation from theCode provision A.2.1, are stated in the followingsections.

28
CORPORATE GOVERNANCE REPORT (CONTINUED)
DIRECTORS’ SECURITIESTRANSACTIONS
The Company has adopted the Model Code for
Securities Transactions by the Directors of Listed Issuers
(the “Model Code”) set out in Appendix 10 of the Listing
Rules. Having made specific enquiry of all Directors, they
have confirmed that they have complied with the Model
Code throughout the Review Period.
BOARD OF DIRECTORS
The Board is responsible for long term development and
strategy as well as controlling and evaluating the
Company’s daily operations. In addition, the Board has
appointed a Chairman who is responsible for ensuring
that the Board of Directors receives regular reports
regarding the Group’s business development, its results,
financial position and liquidity and events of importance
to the Group. Directors are elected for a period of three
years, but can serve any number of consecutive terms.
The duties of the Board are partly exercised through its
three committees:
– The audit committee
– The nomination committee
– The remuneration committee
The Board appoints each of the committee members
from amongst the Board members. The Board of
Directors and each committee have the right to engage
external expertise either in general or in respect to
specific matters, if deemed appropriate.
29
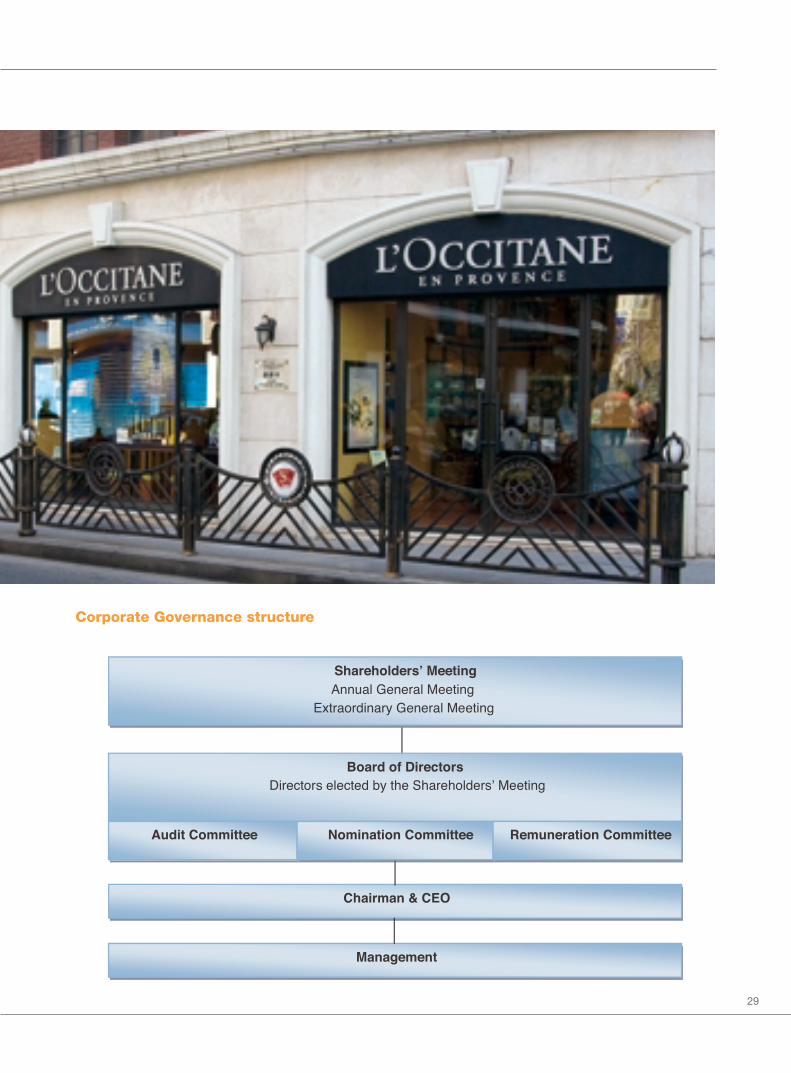
Corporate Governance structure

30
CORPORATE GOVERNANCE REPORT (CONTINUED)
Composition of the Board, Number of Board Meetings and Directors’ Attendance
As at the date of this annual report, the Board consists of ten Directors, comprising four executive directors (“ED”),three non-executive directors (“NED”) and three independent non-executive directors (“INED”). All directors havedistinguished themselves in their field of expertise, and have exhibited high standards of personal and professionalethics and integrity. The biographical details of each director are shown on pages 36 to 41 of the Annual report.
The following is the attendance record of the Board during the year ended 31 March 2010 and committee meetings heldduring the Review Period:
Attendance:Board of audit nomination remuneration
Name Category directors committee committee committee
Reinold Geiger ED 6/6
Emmanuel Osti ED 6/6 1/1
Andre Hoffmann ED 6/6 0/0
Thomas Levilion ED 6/6
Martial Lopez** ED 1/1
Bernard Chevilliat* ED 3/3
Nicolas Veto* ED 3/3
Peter Reed* ED 2/3
Martial Lopez** NED 3/5 1/1
Karl Guenard NED 6/6
Mark Broadley INED 5/6 1/1 0/0 1/1
Yves Chezeaud* NED 3/3
Elise Lethuiller* NED 3/3
Olivier Courtin* NED 3/3
Pierre Milet*** NED 3/3
Susan Kilsby*** INED 1/3 0/0 1/1
Jackson Ng*** INED 3/3 1/1
* On 25 January 2010, the extraordinary general shareholders meeting approved the termination of the mandate of these Directors.** Mr. Martial Lopez was an executive Director up to 30 September 2009. Since that date, he is a consultant of the Group and is non executive Director.*** On 25 January 2010, the extraordinary general shareholders meeting also approved the appointment of Mr. Pierre Milet, Mrs. Susan Kilsby and Mr. Jackson Ng.
Minutes of the Board meetings are kept by the Company Secretary; all Directors have a right to access board papersand related materials and are provided with adequate information in a timely manner; this enables the Board to makeinformed decision on matters placed before it.
31
Responsibilities of the Board
The Board is responsible for:
– Reviewing and approving the strategic direction ofthe Group established by ED in conjunction with themanagement;
– Reviewing and approving objectives, strategies andbusiness development plans;
– Monitoring the performance of the CEO and seniormanagement;
– Assuming responsibility for corporate governance;and
– Reviewing the effectiveness of the internal controlsystem of the Group.
Responsibilities of the SeniorManagement
The senior management under the leadership of the CEOis responsible for:
– Formulating strategies and business developmentplans and submitting to the Board for approval andimplementing such strategies and businessdevelopment plans thereafter;
– Submitting annual budgets to the Board on regularbasis;
– Reviewing salary increment proposals andremuneration policy and submitting to the Board forapproval; and
– Assisting the Board in conducting the review of theeffectiveness of the internal control system of theGroup.
CHAIRMAN AND CHIEF EXECUTIVEOFFICER
In the opinion of the Board, the Group has complied withthe Code during the Review Period, except that the roleof the Chief Executive Officer (CEO) of the Group hasbeen assumed by Mr. Reinold Geiger (“Mr. Geiger”), theChairman of the Board. Such deviation from Codeprovision A.2.1 is deemed appropriate as it is consideredto be more efficient to have one single person as theChairman of the Company as well as to discharge theexecutive functions of a CEO, and it provides the Groupwith strong and consistent leadership. The Board ofDirectors believes that the balance of power andauthority is adequately ensured by the operations of theBoard which comprises highly experienced individuals.There are three independent non-executive Directors onthe Board. All of them possess adequate independenceand therefore the Board considers the Company hasachieved balance and provided sufficient protection ofits interests. Moreover, Mr. Geiger is not a member ofany of the committees (Audit Committee, NominationCommittee, Remuneration Committee) and eachcommittee is composed of a majority of independentnon-executive Directors. Nevertheless, the Board willregularly review the management structure to ensure thatit meets the business development requirements of theGroup.
Furthermore, Mr. Geiger is supported by Mr. EmmanuelOsti, Managing Director, and Mr. André Hoffmann,Managing Director Asia Pacific. Mr. Geiger is responsibleto the Board and focuses on Group strategies and Boardissues, ensures a cohesive working relationship betweenmembers of the Board and the management. The twoManaging Directors have full executive responsibilities inthe business directions and operational efficiency of thebusiness units under their respective responsibilities andare accountable to Mr. Geiger.

32
CORPORATE GOVERNANCE REPORT (CONTINUED)
NON-EXECUTIVE DIRECTORS
All the non-executive Directors of the company havetheir respective terms of appointment coming to an endthree years after appointment to the Board, subject to re-election to the end of the respective three year term.
The three independent non-executive Directors arepersons of high experience, with academic andprofessional qualifications in the field of accounting andfinance. With their experience gained from varioussectors, they provide strong support towards theeffective discharge of the duties and responsibilities ofthe Board. Each independent non-executive Directorgives an annual confirmation of his/her independence tothe Company, and the Company considers them to beindependent under Rule 3.13 of the Listing Rules.
COMMITTEES
As an integral part of good corporate governance, theBoard has established the following committees. Theauthorities, functions, composition and duties of eachcommittee are set out below:
Remuneration Committee
The Remuneration Committee was established on 9 April2010. The terms of reference of the RemunerationCommittee are aligned with the provisions set out in theCode. The Remuneration Committee has threemembers, namely Mr. Emmanuel Osti (Chairman of theRemuneration Committee), Mr. Mark Broadley and Mrs.Susan Kilsby. Except for Mr. Emmanuel Osti, they are allindependent non-executive directors.
The primary duties of the Remuneration Committee areto evaluate the performance of and makerecommendations on the remuneration packages of ourDirectors and senior management and evaluate andmake recommendations on employee benefitarrangements.
The following is a summary of the work performed by theRemuneration Committee during the Review Period:
i. Consideration of reviewing the Company’s globalcompensation guidelines with the help of an externalconsultant and recommendation to the Board forhiring a Group human resources director;
ii. Review of the Directors’ and key executives’compensation, with a recommendation to the Boardfor approval;
iii. Consideration of future long term incentive planswith recommendation to the Boards for generalguidelines.
There has been one meeting of the RemunerationCommittee since its establishment.
The following is a general description of the emolumentpolicy and long term incentive schemes of the group aswell as the basis of determining the emoluments payableto the Directors:
i. The remuneration of our Directors is determined by ourBoard which, since our listing, receivesrecommendations from our Remuneration Committee.Under our current compensation arrangements, ourexecutive Directors receive compensation in the formof salaries and bonuses subject to performancetargets. Our non-execuive Director and consultant, Mr.Martial Lopez, receives a consultancy fee whilst othernon-executive Directors, Mr. Karl Guenard and Mr.Pierre Milet do not receive any remuneration. Weintend to pay our independent non-executive Directorsa fee for their services in the future.
The remuneration our Directors have received(including fees, salaries, discretionary bonus, sharebased payments, housing and other allowances, andother benefits in kind) for the year ended 31 March2010 was approximately €2,977,000. The aggregateamount of fees, salaries, discretionary bonus, share-based payments, housing and other allowances, andother benefits in kind paid to our five highest paidindividuals of our Company, including certain Directors,for the year ended 31 March 2010 was approximately€2,811,000. We have not paid any remuneration to ourDirectors or the five highest paid individuals as aninducement to join or upon joining us or as acompensation for loss of office in respect of the yearended 31 March 2010. Further, none of our Directorshas waived any remuneration during the same period.
Save as disclosed above, no other payments havebeen paid or are payable, in respect of the yearended 31 March 2010, by us or any of oursubsidiaries to our Directors.

33
ii. Within the context of our international developmentand for the purpose of incentivisation of our staff, wehave in the past implemented stock-options grantsand employees reward schemes in respect of sharesin our parent company LOG to the staff of ourvarious subsidiaries located in relevant jurisdictions.As of the date of this Annual Report, there are nooutstanding options over any of the shares of theCompany. If we decide to establish any schemes forthe grant of options over the shares in the future,further to recommendations from our RemunerationCommittee, these will comply with applicableprovisions of the Listing Rules.
Nomination Committee
The Nomination Committee was established on 9 April2010 with specific terms of reference as recommendedunder the Code. The Nomination Committee has threemembers, namely Mr. André Hoffmann (Chairman of theNomination Committee), Mr. Mark Broadley and Mrs.Susan Kilsby. Except for Mr. André Hoffmann, they are allindependent non-executive Directors.
The primary function of the Nomination Committee is tomake recommendations to our Board on theappointment and removal of Directors of our Company.
There has been no meeting of our NominationCommittee since its establishment.
Audit Committee
The Audit Committee was established on 21 June 2007and specific terms of reference that specify itsauthorities and duties were adopted on 9 April 2010. TheAudit Committee is composed of three members, namelyMr. Mark Broadley (Chairman of the Audit Committee),Mr. Jackson Ng and Mr. Martial Lopez. Except for Mr.Martial Lopez, who is a non-executive director, they areall independent non-executive directors.
In compliance with Rule 3.21 of the Listing Rules, atleast one member of the Audit Committee possessesappropriate professional qualifications in accounting orrelated financial management expertise in dischargingthe responsibilities of the Audit Committee.
All members have sufficient experience in reviewingaudited financial statements as aided by the auditors ofthe Group whenever required.
The primary duties of the Audit Committee are to assistour Board in providing an independent view of theeffectiveness of our financial reporting process, internalcontrol and risk management system, to oversee theaudit process and to perform other duties andresponsibilities as assigned by our Board.
The following is a summary of the work performed by theAudit Committee during the Review Period:
i. Review of the report from auditors from auditing offinal results of the Group for the year ended 31March 2010;
ii. Review of the draft financial statements of the Groupfor the year ended 31 March 2010 with arecommendation to the Board for approval;
iii. Review of the draft results announcement andannual report of the Group for the year ended 31March 2010 with a recommendation to the Board forpublication and approval;
iv. Review of the internal control system and report ofthe Audit Committee’s review to the Board;
v. Review of the audit fees payable to the externalauditors for the year ended 31 March 2010 with arecommendation to the Board for approval;
vi. Review of the external auditors’ independence, witha recommendation to the Board for the re-appointment of the external auditors at theforthcoming annual general meeting.
There has been one meeting of the Audit Committeesince its authorities and duties were adopted.
34
CORPORATE GOVERNANCE REPORT (CONTINUED)
AUDITORS’ REMUNERATION
The fees in relation to the audit and other services for the year ended 31 March, 2010 provided byPricewaterhouseCoopers, the external auditors of the Company amounted to approximately €649,000 and €1,591,000respectively.
€’000
Annual audit and interim review services 649
Non Audit services:
IPO 1,444
Other services 147
TOTAL 2,240
DIRECTORS’ RESPONSIBILITIES FORTHE CONSOLIDATED FINANCIALSTATEMENTS
The Board acknowledges that it holds responsibility for:
– Overseeing the preparation of the financialstatements of the Group with a view to ensuringsuch financial statements give a true and fair view ofthe state of affairs of the Group; and
– Selecting suitable accounting policies and applyingthe selected accounting policies consistently withthe support of reasonable and prudent judgmentand estimates.
The Board ensures the timely publication of the financialstatements of the Group.
The management provides explanation and informationto the Board to enable it to make an informedassessment of the financial and other information to beapproved.
The Board endeavours to ensure a balanced, clear andunderstandable assessment of the Group’s position andprospects to extend the Group’s financial reportingincluding annual and interim reports, other price-sensitive announcements and other financial disclosuresrequired under the Listing Rules, and reports toregulators as well as to information required to bedisclosed pursuant to statutory requirements andapplicable accounting standards.
The statement of the auditors of the Company abouttheir reporting responsibilities on the financial statementsof the Group is set out in the Independent Auditors’Report on pages 54 to 55 of this annual report.
The Board is responsible for keeping proper accountingrecords, for safeguarding the assets of the Company andthe Group and for taking reasonable steps for theprevention of fraud and other irregularities.
The Board is not aware of any material uncertaintiesrelating to events or conditions that may cast significantdoubt upon the Company’s ability to continue as a goingconcern.
INTERNAL CONTROL
The Board places great importance on internal controland is responsible for establishing and maintainingadequate internal control over financial reporting for theCompany and assessing the overall effectiveness ofthose internal controls.
The Internal Audit Department provides an independentreview of the adequacy and the effectiveness of theinternal control system. The audit plan is discussed andagreed every year with the Audit Committee. In additionto its agreed annual schedule of work, the Internal AuditDepartment conducts other special reviews as required.Internal Audit reports are sent to the Chairman & CEO,the Group Managing director, the Chief Financial Officer,external auditors and the relevant management of theauditee department.
35
The system of internal control is designed to providereasonable assurance against human errors, materialmisstatements, losses, damages, or fraud and tomanage rather than eliminate risks of failure inoperational systems and achievement of the Group’sobjectives. During the year ended 31 March 2010, noirregularity or material weakness was noted within anyfunction or process. The Audit Committee was satisfiedthat the internal control system has functioned effectivelyas intended.
The Board considers that the internal control system iseffective and adequate for the Group as a whole. TheBoard further considers that there was no issue relatingto the material controls, including financial, operationaland compliance controls and risk management functionsof the Group.
COMMUNICATIONS WITHSHAREHOLDERS AND INVESTORRELATIONS
The Company endeavours to maintain a high level oftransparency in communication with shareholders andinvestors in general . The various channels throughwhich the Company communicates with its shareholderswill include interim and annual reports, information onthe Stock Exchange and Company websites, andgeneral meetings.
The Company encourages its shareholders to attendAnnual General Meetings and other general meetings, ifany, to ensure a high level of accountability and to stayinformed of the Group’s strategy and goals.
The financial and other information relating to the Groupis disclosed on the Company’s website,www.loccitane.com, where up-to-date information andupdates on the Company’s business developments andoperations and financial information are available forpublic access.

36
DIRECTORS AND SENIOR MANAGEMENT
EXECUTIVE DIRECTORS
Directors
Our board of Directors is responsible for and has general powers over the management and conduct of our business.The table below shows certain information in respect of our Board:
Name Age Position
Reinold Geiger 62 Executive Director, Chairman and Chief Executive Officer
Emmanuel Laurent Jacques Osti 45 Executive Director and Managing Director
André Joseph Hoffmann 53 Executive Director and Managing Director
Thomas Levilion 50 Executive Director and Group Deputy General Manager,Finance and Administration
Karl Guenard 42 Non-Executive Director
Martial Thierry Lopez 49 Non-Executive Director
Pierre Maurice Georges Milet 67 Non-Executive Director
Charles Mark Broadley 46 Independent Non-Executive Director
Susan Saltzbart Kilsby 51 Independent Non-Executive Director
Jackson Chik Sum Ng 49 Independent Non-Executive Director
Mr. Reinold Geiger wasappointed as an executiveDirector with effect from 22December 2000 and is ourChairman and ChiefExecutive Officer. Mr. Geigeris primarily responsible forour Group’s overall strategicplanning and themanagement of our Group’sbusiness. Mr. Geiger joined
our Group in 1996 as Chairman and controllingshareholder. Mr. Geiger is a director and managingdirector (“administrateur délégué”) of our Company andLOG, a director of L’Occitane (Suisse) S.A., L’OccitaneInc., L’Occitane Australia Pty Ltd., L’Occitane Japon KK,L’Occitane Russia and L’Occitane Mexico S.A. de C.V., amember of the board of managers of L’Occitane LLCand Oliviers & Co. LLC, a member of the strategic board(“conseil stratégique”) of Les Minimes SAS and adirector (“membre du conseil d’administration”) of theFondation d’entreprise L’Occitane. Since joiningL’Occitane, Mr. Geiger has developed our Group from alargely domestic operation based in France to an
international business. He has spent time travelling toour worldwide locations in order to implement thisgrowth strategy, where he has established oursubsidiaries and strong relationships with the localmanagement. In June 2008, Mr. Geiger was awarded theaccolade of “INSEAD entrepreneur of the year” for hisinternational development strategy of our Group. Mr.Geiger began his career at the American Machine andFoundry Company in 1970. In 1972 he left to start hisown business, involved in the distribution of machineryused in the processing of rubber and plastic, which hesold in 1978. Mr. Geiger then established and developedAMS Packaging SA, which specialised in packaging forthe high end perfumes and cosmetics market. Thiscompany was floated on the Paris stock exchange in1987 and Mr. Geiger left the company entirely in 1990.Between 1991 and 1995, he worked for a packagingcompany with operations primarily based in France anddeveloped it into an international business. Mr. Geigergraduated from the Swiss Federal Institute of Technologyin Zürich, Switzerland with a degree in engineering in1969 and from INSEAD in Fontainebleu, France with amaster’s in business administration in 1976.
37
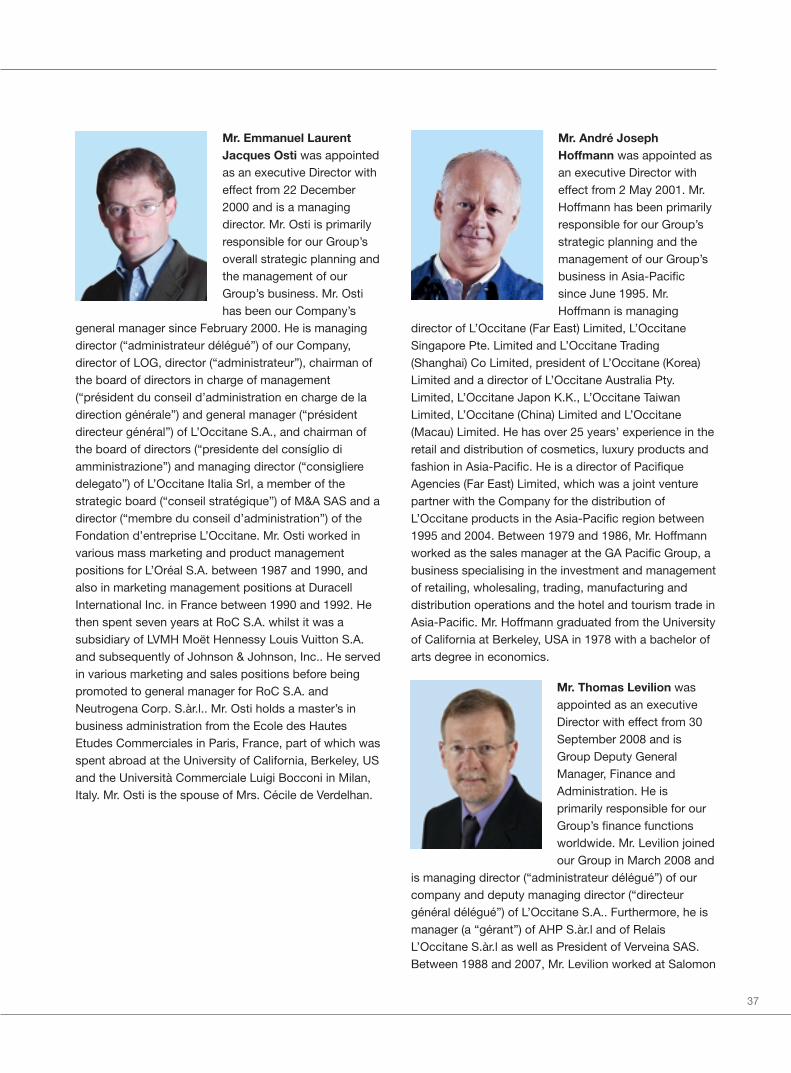
Mr. Emmanuel LaurentJacques Osti was appointedas an executive Director witheffect from 22 December2000 and is a managingdirector. Mr. Osti is primarilyresponsible for our Group’soverall strategic planning andthe management of ourGroup’s business. Mr. Ostihas been our Company’s
general manager since February 2000. He is managingdirector (“administrateur délégué”) of our Company,director of LOG, director (“administrateur”), chairman ofthe board of directors in charge of management(“président du conseil d’administration en charge de ladirection générale”) and general manager (“présidentdirecteur général”) of L’Occitane S.A., and chairman ofthe board of directors (“presidente del consíglio diamministrazione”) and managing director (“consiglieredelegato”) of L’Occitane Italia Srl, a member of thestrategic board (“conseil stratégique”) of M&A SAS and adirector (“membre du conseil d’administration”) of theFondation d’entreprise L’Occitane. Mr. Osti worked invarious mass marketing and product managementpositions for L’Oréal S.A. between 1987 and 1990, andalso in marketing management positions at DuracellInternational Inc. in France between 1990 and 1992. Hethen spent seven years at RoC S.A. whilst it was asubsidiary of LVMH Moët Hennessy Louis Vuitton S.A.and subsequently of Johnson & Johnson, Inc.. He servedin various marketing and sales positions before beingpromoted to general manager for RoC S.A. andNeutrogena Corp. S.àr.l.. Mr. Osti holds a master’s inbusiness administration from the Ecole des HautesEtudes Commerciales in Paris, France, part of which wasspent abroad at the University of California, Berkeley, USand the Università Commerciale Luigi Bocconi in Milan,Italy. Mr. Osti is the spouse of Mrs. Cécile de Verdelhan.
Mr. André JosephHoffmann was appointed asan executive Director witheffect from 2 May 2001. Mr.Hoffmann has been primarilyresponsible for our Group’sstrategic planning and themanagement of our Group’sbusiness in Asia-Pacificsince June 1995. Mr.Hoffmann is managing
director of L’Occitane (Far East) Limited, L’OccitaneSingapore Pte. Limited and L’Occitane Trading(Shanghai) Co Limited, president of L’Occitane (Korea)Limited and a director of L’Occitane Australia Pty.Limited, L’Occitane Japon K.K., L’Occitane TaiwanLimited, L’Occitane (China) Limited and L’Occitane(Macau) Limited. He has over 25 years’ experience in theretail and distribution of cosmetics, luxury products andfashion in Asia-Pacific. He is a director of PacifiqueAgencies (Far East) Limited, which was a joint venturepartner with the Company for the distribution ofL’Occitane products in the Asia-Pacific region between1995 and 2004. Between 1979 and 1986, Mr. Hoffmannworked as the sales manager at the GA Pacific Group, abusiness specialising in the investment and managementof retailing, wholesaling, trading, manufacturing anddistribution operations and the hotel and tourism trade inAsia-Pacific. Mr. Hoffmann graduated from the Universityof California at Berkeley, USA in 1978 with a bachelor ofarts degree in economics.
Mr. Thomas Levilion wasappointed as an executiveDirector with effect from 30September 2008 and isGroup Deputy GeneralManager, Finance andAdministration. He isprimarily responsible for ourGroup’s finance functionsworldwide. Mr. Levilion joinedour Group in March 2008 and
is managing director (“administrateur délégué”) of ourcompany and deputy managing director (“directeurgénéral délégué”) of L’Occitane S.A.. Furthermore, he ismanager (a “gérant”) of AHP S.àr.l and of RelaisL’Occitane S.àr.l as well as President of Verveina SAS.Between 1988 and 2007, Mr. Levilion worked at Salomon

38
DIRECTORS AND SENIOR MANAGEMENT (CONTINUED)
S.A., which was a subsidiary of Adidas AG and was
subsequently acquired by the Amer Sports Corporation,
where he was the controller and the VP controller and
subsequently the chief financial officer. During this time
he gained experience in global supply chains, turn-
arounds, re-engineering of organisations and mergers
and acquisitions. He has a master’s in business
administration from the Ecole des Hautes Etudes
Commerciales in Paris, France, where he majored in
finance, and a postgraduate degree in scientific decision
making methods from the University of Paris-Dauphine,
France.
Mr. Karl Guenard was appointed as a non-executive
Director with effect from 30 June 2003. Mr. Guenard has
been a director of our Company since June 2003. Mr.
Guenard spent three years as senior vice president of
the financial enginery department at Banque Privée
Edmond de Rothschild Europe from April 2000. Between
1998 and 2000, he was a manager of the financial
enginery department at Banque de Gestion Privée
Luxembourg (a subsidiary of Crédit Agricole Indosuez
Luxembourg). Prior to this, between 1993 and 1998, Mr.
Guenard was a funds and corporate auditor. Mr. Guenard
is a chartered accountant. He holds a master’s degree in
economic and management sciences from the University
of Strasbourg, France.
Mr. Martial Thierry Lopez was appointed as a non-
executive Director with effect from 30 September 2009
and is a consultant of our Group. Prior to that Mr. Lopez
had been an executive Director since 22 December
2000. Mr. Lopez takes care of specific finance projects.
Mr. Lopez joined our Group in April 2000 as our Group’s
chief financial officer and was promoted to senior vice
president in charge of audit and development in 2008
before he became consultant of the Group. Mr. Lopez
gained over 15 years’ audit experience prior to joining
our Group. He spent three years at Ankaoua & Grabli in
Paris, France and 12 years at Befec-Price Waterhouse in
Marseille, France as a senior manager. Between 1996
and 1998, he was the senior manager in charge of Price
Waterhouse, Marseille until the merger between Price
Waterhouse and Coopers & Lybrand. Mr. Lopez
graduated from the Montpellier Business School (“Ecole
Supérieure de Commerce”) in France in 1983 and holds
a diploma in accounting and finance (“Diplôme d’Etudes
Supérieures Comptables et Financières”).
Mr. Pierre Maurice Georges Milet was appointed as a
non-executive Director with effect from 25 January 2010.
Mr. Milet has been a member of the executive board and
managing director of Clarins from 1988 until 10 March
2010. Mr. Milet continues to be a board member of many
of the Clarins’ subsidiaries. On 8 February 2010, Mr.
Milet has been appointed deputy managing director of
Financière FC, the holding company of Clarins and as
the representative of Financière FC, in its capacity as a
member of the supervisory board of Clarins. Clarins is a
French cosmetics company that was listed on the Paris
Stock Exchange from 1984 to 2008, and is now a
privately owned company controlled by the Courtin-
Clarins family and is no longer listed on any stock
exchange. He also served as company secretary of
Clarins from 1983 to 1988 when he was appointed
corporate chief financial officer of Clarins. In these
capacities, Mr. Milet oversaw all accounting and financial
aspects of the Clarins Group’s business, as well as
negotiated acquisitions and joint ventures. Mr. Milet also
has substantial experience in the cosmetics industry
39
gained partly from experience at Max Factor, serving
successively as chief financial officer and president of
their French subsidiary from1975 to 1982. Mr. Milet has a
masters degree in business administration from Ecole
des Hautes Etudes Commerciales (France) where he
majored in finance.
Mr. Charles Mark Broadley was appointed as an
independent non-executive Director with effect from 30
September 2008. Mr. Broadley is currently a founder and
partner of Voyager Partners Limited, a private equity firm
focused on the hotel and leisure industry. He is also an
independent non-executive director of Société Fermière
du Casino Municipal de Cannes, a listed French
company, where he also chairs the audit committee. Mr.
Broadley was the finance director of The Hong Kong and
Shanghai Hotels Limited, which owns the Peninsula
Hotels, between November 2003 and March 2008. Prior
to this, Mr. Broadley worked in the investment banking
industry in the UK and Hong Kong. He began his career
at Philips & Drew, and then was subsequently at HSBC
Investment Banking and N M Rothschild & Sons. Mr.
Broadley has a master of arts degree in law from
Cambridge University, UK.
Ms. Susan Saltzbart Kilsby was appointed as an
independent non-executive Director with effect from 25
January 2010. Mrs. Kilsby is currently a senior advisor to
Credit Suisse, based in London. She is chairman of the
European Mergers & Acquisitions Group at Credit Suisse
and was previously head of their European Mergers &
Acquisitions Group. Mrs. Kilsby joined The First Boston
Corporation, a predecessor company of Credit Suisse, in
1980, working in their Mergers and Acquisitions Group in
New York until 1992. She later moved to London as head
of Credit Suisse’s European Consumer, Retail & Services
Group in Investment Banking and was named head of
mergers & acquisitions and strategic advisory in April
2002. Mrs. Kilsby graduated from Wellesley College,
USA in 1980 with a bachelor of arts degree in economics
and received a master’s degree in business
administration from the Yale School of Management,
USA in 1984.
Mr. Jackson Chik Sum Ng was appointed as an
independent non-executive Director of the Company
with effect from 25 January 2010. Mr. Ng has extensive
experience in accounting and financial management. He
is currently the chief financial officer of Modern Terminals
Limited. Mr. Ng previously worked at Coopers & Lybrand
and also served as group financial controller of Lam
Soon Group, as finance director of East Asia of Allergan
Inc., a United States pharmaceutical company. Mr. Ng is
a fellow of both the Association of Chartered Certified
Accountants and the Hong Kong Institute of Certified
Public Accountants. Mr. Ng was a non-executive director
of Tradelink Electronic Commerce Limited and is
currently an independent non-executive director of
Computech Holdings Limited. He holds a master of
science degree in Finance from the Chinese University of
Hong Kong and a master’s degree in business
administration from Hong Kong University of Science
and Technology.
40
DIRECTORS AND SENIOR MANAGEMENT (CONTINUED)
SENIOR MANAGEMENT
Mr. Bernard Chevilliat, aged 57, is the Managing
Director of Melvita and M&A SAS and our Head of
Research and development. Mr. Chevilliat joined our
Group in June 2008 when we acquired Melvita. Mr.
Chevilliat has extensive experience in the natural and
organic cosmetics industry, having founded M&A SAS in
1983. Mr. Chevilliat was president of Cosmébio, a French
association of professionals involved in the ecological
and organic cosmetics industry, between December
2007 and June 2008, when he became vice-president.
Mr. Chevilliat graduated from the University of Bordeaux,
France in 1976 with a master’s degree in biology.
Mr. Jean-François Gonidec, aged 53, is our Deputy
General Manager principally in charge of supply chain
management. Mr. Gonidec joined our Group in March
2009 and has extensive experience in project
management and in managing a production plant and its
supply chain. In addition, he has also assumed
responsibilities as financial controller in the course of his
career. After having worked in different functions and for
different legal entities of the Danone Group during a time
period of 18 years, he gained further experience at other
organisations including the Group Madrange between
March 2007 and February 2009 and at Pierre Fabre
Dermo Cosmétique between March 2001 and February
2007. Mr. Gonidec graduated from INSA LYON with a
degree in engineering in 1981.
Mrs. Cécile de Verdelhan, aged 37, is our Head of
Marketing and is primarily responsible for L’Occitane’s
worldwide marketing strategy. Mrs. de Verdelhan has
been our international marketing, communications and
merchandising director since March 2001, when she
joined our Group. Mrs. de Verdelhan has over 14 years’
experience in the cosmetics industry, having spent four
years as a product manager at Beiersdorf AG and three
years as an international product manager in charge of
product development for Yves Rocher S.A. prior to
joining our Group. Mrs. de Verdelhan graduated from the
Ecole des Hautes Etudes Commerciales in Paris, France
with a master’s degree in business administration in
1994. Mrs. de Verdelhan is the spouse of Mr. Emmanuel
Osti.
Mr. Emmanuel de Courcel, aged 37, is our general
manager for Continental Western Europe and is primarily
responsible for our Group’s business and strategy in
Continental Western Europe. Mr. de Courcel joined our
Group in September 2004 as director of operational
marketing in Continental Western Europe, prior to
becoming general manager for the region in 2005.
Between 1996 and 2004, Mr. de Courcel worked as a
consultant in the retail sector at The Boston Consulting
Group. He was based in New York for two years and
Paris for six years during which time he spent two years
as a recruiting director. In 1996, Mr. de Courcel
graduated from the ESSEC Business School in Paris,
France.
41
Mr. Marcin Jasiak, aged 42, is our Managing Director
International. He is primarily responsible for overseeing
the export and travel retail divisions of our Group and
supervises the following subsidiaries of our group: Brazil,
Russia, Central Europe, Mexico and Poland. Mr. Jasiak
joined our Group in March 2003 as director for export in
Geneva and subsequently became managing director in
Geneva in 2005. Prior to joining our Group, Mr. Jasiak
was a junior consultant at KPMG specialising in due
diligence and audit. He joined Procter & Gamble, Inc. in
1993 for ten years, based in Poland, Germany and
Switzerland, where he served as a brand manager for
Poland, Central Europe and Western Europe and as a
category manager for cosmetics export, working in
Poland, Germany and Switzerland. Mr. Jasiak graduated
from the University of Warsaw, Poland with two master’s
degrees, in English philology and management and
marketing, respectively, and from the University of Illinois
at Urbana-Champaign, USA with a master’s in business
administration.
Mr. Olivier Ceccarelli, aged 47, is our Head of Strategy.
He joined our Group in December 2003. In December
2004, he became managing director of AHP S.àr.l. and in
May 2008 became director of strategy and development
for L’Occitane S.A.. Mr. Ceccarelli has around 20 years’
experience in the marketing of cosmetics industry. He
worked at L’Oréal Paris as a product manager between
1992 and 1994, as marketing director for L’Oréal Tokyo
between 1994 and 1999 and as marketing director in
charge of the hair colour market at L’Oréal New York
between 1999 and 2002. Mr. Ceccarelli graduated from
Ecole des Hautes Etudes Commerciales in Paris, France
with a degree in business administration in 1986.
Mrs. Shiho Takano, aged 45, is head of our operations
in Japan and is primarily responsible for our Group’s
strategic planning and the management of our Group’s
business in Japan. Mrs. Takano joined our Group in
January 2001 as general manager for Lavender Japon
K.K. before being promoted to president representative
director for L’Occitane Japon KK. Prior to joining our
Group, Mrs. Takano held various managerial roles in the
cosmetics industry. Between 1990 and 1996, Mrs.
Takano worked at Yves Saint Laurent Japan, where her
last position was as marketing manager. She then joined
Coca-Cola Japan in 1996 as activation manager where
she was responsible for drinks aimed at the female
market with a focus on natural products and beauty. And
finally from 1998 to 2001, she was buying and marketing
manager for the beauty division of Boots MC in Japan.
Mr. David Boynton, aged 47, is general manager of our
North Atlantic region, supervising UK, USA and Canada.
Mr. Boynton joined our Group in August 2006 as
marketing and retail operations director for our
operations in the UK prior to being appointed managing
director in the UK in April 2007. Mr. Boyton has over
twenty years’ experience in the retail sector. He worked
for Safeway Stores Plc as operations manager for the
South of England and other senior roles between 1987
and 2000 and subsequently joined Watsons the Chemist,
the health and beauty subsidiary of Hutchison
Whampoa, initially as operations director for Hong Kong,
then director for buying and marketing in Taiwan before
being promoted to the position of managing director of
Hong Kong and Macau between 2003 and 2005. Mr.
Boynton graduated from the University of Leeds with a
bachelor of science degree in 1985.

42
DIRECTORS’ REPORT
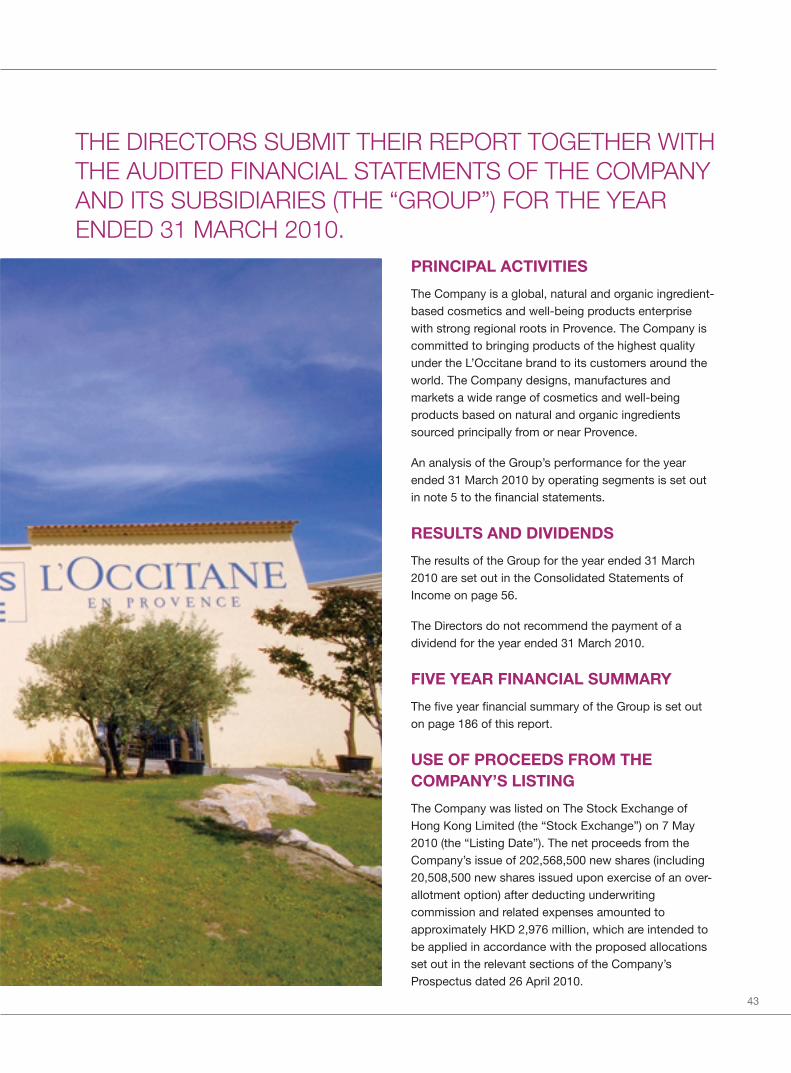
43
PRINCIPAL ACTIVITIES
The Company is a global, natural and organic ingredient-based cosmetics and well-being products enterprisewith strong regional roots in Provence. The Company iscommitted to bringing products of the highest qualityunder the L’Occitane brand to its customers around theworld. The Company designs, manufactures andmarkets a wide range of cosmetics and well-beingproducts based on natural and organic ingredientssourced principally from or near Provence.
An analysis of the Group’s performance for the yearended 31 March 2010 by operating segments is set outin note 5 to the financial statements.
RESULTS AND DIVIDENDS
The results of the Group for the year ended 31 March2010 are set out in the Consolidated Statements ofIncome on page 56.
The Directors do not recommend the payment of adividend for the year ended 31 March 2010.
FIVE YEAR FINANCIAL SUMMARY
The five year financial summary of the Group is set outon page 186 of this report.
USE OF PROCEEDS FROM THECOMPANY’S LISTING
The Company was listed on The Stock Exchange ofHong Kong Limited (the “Stock Exchange”) on 7 May2010 (the “Listing Date”). The net proceeds from theCompany’s issue of 202,568,500 new shares (including20,508,500 new shares issued upon exercise of an over-allotment option) after deducting underwritingcommission and related expenses amounted toapproximately HKD 2,976 million, which are intended tobe applied in accordance with the proposed allocationsset out in the relevant sections of the Company’sProspectus dated 26 April 2010.
THE DIRECTORS SUBMIT THEIR REPORT TOGETHER WITHTHE AUDITED FINANCIAL STATEMENTS OF THE COMPANYAND ITS SUBSIDIARIES (THE “GROUP”) FOR THE YEARENDED 31 MARCH 2010.

44
DIRECTORS’ REPORT (CONTINUED)
RESERVES
Details of the movements in the reserves of the Groupand the Company during the year are set out in theConsolidated Statement of Changes in Shareholders’Equity page 62 and note 16 to the financial statements.
DISTRIBUTABLE RESERVES
As at 31 March 2010, the Company’s reserves availablefor distribution to shareholders in accordance with theCompany’s Articles of Association as amended on 15April 2010 amounted to approximately €70,817,000.
PROPERTY, PLANT AND EQUIPMENT
Details of the movements in the property, plant andequipment of the Group during the year ended 31 March2010 are set out in note 7 to the financial statements.
DONATIONS
Charitable and other donations made by the Groupduring the year ended 31 March 2010 amounted to€887,000.
PRE-EMPTIVE RIGHTS
There is no provision for pre-emptive rights under theCompany’s Articles of Association or the laws of theGrand-Duchy of Luxembourg.
PURCHASE, SALE OR REDEMPTIONOF SECURITIES
Neither the Company nor any of its subsidiariespurchased, sold or redeemed any of the listed securitiesof the Company during the year ended 31 March 2010.
SUBSIDIARIES
Details of the Company’s principal subsidiaries as at 31March 2010 are set out in note 32 to the financialstatements.
DIRECTORS
The Directors of the Company during the year ended 31March 2010 and up to the date of this report were:
Executive DirectorsMr. Reinold Geiger
(Chairman and Chief Executive Officer)(appointed on 22 December 2000)
Mr. Emmanuel Laurent Jacques Osti
(appointed on 22 December 2000)Mr. André Joseph Hoffmann
(appointed on 2 May 2001)Mr. Thomas Levilion
(appointed on 30 September 2008)
Non-Executive DirectorsMr. Martial Thierry Lopez
(appointed on 22 December 2000 and designated asNon-Executive Director on 30 September 2009)
Mr. Karl Guenard(appointed on 30 June 2003)
Mr. Pierre Maurice Georges Milet(appointed on 25 January 2010)
Independent Non-executive DirectorsMr. Charles Mark Broadley
(appointed on 30 September 2008)Mrs. Susan Saltzbart Kilsby
(appointed on 25 January 2010)Mr. Jackson Chik Sum Ng
(appointed on 25 January 2010)
Mr Bernard Chevilliat, Mr. Nicolas Veto and Mr. PeterYoung Reed resigned as Executive Directors of theCompany on 25 January 2010. Mr. Yves Chezeaud, Mrs.Elise Lethuillier and Mr. Olivier Courtin resigned as Non-Executive Directors of the Company on 25 January 2010.
In accordance with code provision A.4.2 as set out inAppendix 14 to the Listing Rules, every Director,including those appointed for a specific term, should besubject to retirement by rotation at least once every threeyears. In addition, all Directors appointed to fill a casualvacancy should be subject to election by shareholders atthe first general meeting after their appointment. Inaccordance with Article 10.1 of the articles of associationof the Company, the Directors shall be elected by theshareholders at a general meeting, which shall determinetheir number and term of office. The term of the office ofa Director shall be not more than three years, upon theexpiry of which each shall be eligible for re-election.
Accordingly, Mr. Reinold Geiger, Mr. Emmanuel LaurentJacques Osti, Mr. Andre Joseph Hoffmann and Mr. KarlGuenard shall retire by rotation, and being eligible, haveoffered themselves for re-election as Directors at theforthcoming annual general meeting.
BIOGRAPHICAL INFORMATION OFDIRECTORS
Brief biographical information of the Directors of theCompany are set out in the “Directors and SeniorManagement” section on pages 36 to 41 of this report.

45
DIRECTORS’ SERVICE CONTRACTS
Mr. Thomas Levilion, an executive Director, entered intoan employment contract with L’Occitane S.A., theCompany’s wholly owned subsidiary, dated 29 January2008 pursuant to which Mr. Levilion is engaged asDeputy CEO in charge of finance, control andadministration. This employment contract came intoeffect on 18 February 2008 and is for an indefinite term.This employment contract is governed by the laws ofFrance.
Other than the foregoing, none of our Directors has or isproposed to have a service contract with any member ofthe Group (other than contracts expiring or determinableby the employer within one year without the payment ofcompensation (other than statutory compensation).
DIRECTORS’ INTERESTS INCOMPETING BUSINESS
During the year, none of the Directors of the Companyhad any interests in a business which competes, eitherdirectly, or indirectly, with the business of the Companyor the Group.
DIRECTORS’ AND CHIEF EXECUTIVE’SINTERESTS IN SHARES ANDUNDERLYING SHARES
As at the date of this report, the following Directors orchief executive of the Company had or were deemed tohave interests or short positions in the shares, underlyingshares or debentures of the Company and its associatedcorporations (within the meaning of Part XV of theSecurities and Futures Ordinance (Chapter 571 of theLaws of Hong Kong) (the “SFO”)) (i) which were requiredto be notified to the Company and the Stock Exchangepursuant to Divisions 7 & 8 of Part XV of the SFO(including interests or short positions which they havetaken or deemed to have taken under such provision ofthe SFO), (ii) which were required, pursuant to section352 of the SFO, to be entered into the register referred totherein, or (iii) which were required to be notified to theCompany and the Stock Exchange pursuant to theModel Code for Securities Transactions by Directors ofListed Issuers (the “Model Code”) contained in theListing Rules:
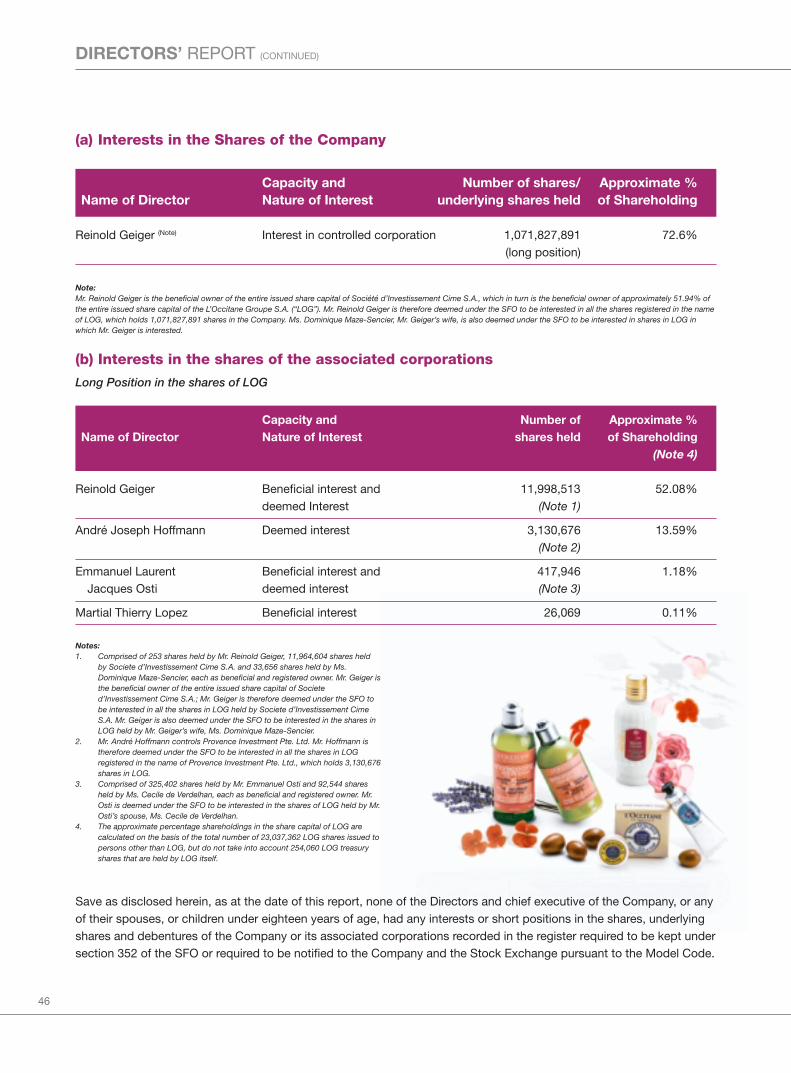
46
DIRECTORS’ REPORT (CONTINUED)
(a) Interests in the Shares of the Company
Capacity and Number of shares/ Approximate %Name of Director Nature of Interest underlying shares held of Shareholding
Reinold Geiger (Note) Interest in controlled corporation 1,071,827,891 72.6% (long position)
Note:Mr. Reinold Geiger is the beneficial owner of the entire issued share capital of Société d’Investissement Cime S.A., which in turn is the beneficial owner of approximately 51.94% ofthe entire issued share capital of the L’Occitane Groupe S.A. (“LOG”). Mr. Reinold Geiger is therefore deemed under the SFO to be interested in all the shares registered in the nameof LOG, which holds 1,071,827,891 shares in the Company. Ms. Dominique Maze-Sencier, Mr. Geiger’s wife, is also deemed under the SFO to be interested in shares in LOG inwhich Mr. Geiger is interested.
(b) Interests in the shares of the associated corporations
Long Position in the shares of LOG
Capacity and Number of Approximate %Name of Director Nature of Interest shares held of Shareholding
(Note 4)
Reinold Geiger Beneficial interest and 11,998,513 52.08%deemed Interest (Note 1)
André Joseph Hoffmann Deemed interest 3,130,676 13.59%(Note 2)
Emmanuel Laurent Beneficial interest and 417,946 1.18%Jacques Osti deemed interest (Note 3)
Martial Thierry Lopez Beneficial interest 26,069 0.11%
Notes:1. Comprised of 253 shares held by Mr. Reinold Geiger, 11,964,604 shares held
by Societe d’Investissement Cime S.A. and 33,656 shares held by Ms.Dominique Maze-Sencier, each as beneficial and registered owner. Mr. Geiger isthe beneficial owner of the entire issued share capital of Societed’Investissement Cime S.A.; Mr. Geiger is therefore deemed under the SFO tobe interested in all the shares in LOG held by Societe d’Investissement CimeS.A. Mr. Geiger is also deemed under the SFO to be interested in the shares inLOG held by Mr. Geiger’s wife, Ms. Dominique Maze-Sencier.
2. Mr. André Hoffmann controls Provence Investment Pte. Ltd. Mr. Hoffmann istherefore deemed under the SFO to be interested in all the shares in LOGregistered in the name of Provence Investment Pte. Ltd., which holds 3,130,676shares in LOG.
3. Comprised of 325,402 shares held by Mr. Emmanuel Osti and 92,544 sharesheld by Ms. Cecile de Verdelhan, each as beneficial and registered owner. Mr.Osti is deemed under the SFO to be interested in the shares of LOG held by Mr.Osti’s spouse, Ms. Cecile de Verdelhan.
4. The approximate percentage shareholdings in the share capital of LOG arecalculated on the basis of the total number of 23,037,362 LOG shares issued topersons other than LOG, but do not take into account 254,060 LOG treasuryshares that are held by LOG itself.
Save as disclosed herein, as at the date of this report, none of the Directors and chief executive of the Company, or anyof their spouses, or children under eighteen years of age, had any interests or short positions in the shares, underlyingshares and debentures of the Company or its associated corporations recorded in the register required to be kept undersection 352 of the SFO or required to be notified to the Company and the Stock Exchange pursuant to the Model Code.
47
INTERESTS IN THE SHARES AND UNDERLYING SHARES OF SUBSTANTIALSHAREHOLDERS
As at the date of this report, the register of substantial shareholders maintained under section 336 of the SFO showsthat the Company had been notified of the following substantial shareholders’ interests or short positions, other than aDirector or chief executive of the Company, in the shares or underlying shares of the Company:
Capacity and Number of shares/ Approximate %Name of shareholders Nature of Interest underlying shares held of Shareholding
Société d’Investissement Interest in controlled 1,071,827,891 72.6%Cime S.A. corporation (long position)
(Note a)
LOG Interest in controlled 1,071,827,891 72.6%corporation (long position)
(Note a)
Note:a. Société d’Investissement Cime S.A. is the beneficial owner of approximately 51.94% of the entire issued share capital of LOG, which held 1,071,827,891 shares. Société
d’Investissement Cime S.A. is therefore deemed under the SFO to be interested in all the shares registered in the name of LOG.
Save as disclosed herein, as at the date of this report, the Company had not been notified of any substantialshareholder (other than a Director or chief executive of the Company) who had an interest or short position in the sharesor underlying shares of the Company that were recorded in the register required to be kept under section 336 of theSFO.
SHARE CAPITAL
Details of the movements in the share capital of theCompany during the year ended 31 March 2010 are setout in the Consolidated Statement of Changes inShareholders’ Equity page 62 and note 16 to thefinancial statements.
SHARE OPTION SCHEME
As at 31 March 2010 the Company had no concrete planto establish any option scheme, nor does the Companyplan to issue any options under any scheme previouslyestablished, in respect of the Company’s shares. There iscurrently no option scheme in respect of the Company’sshares, nor outstanding options over the Company’sShares.
The Company currently has Share-based payments inforce to incentivise eligible participants who contribute tothe success of the Group.
Main characteristics of the Share-basedpayments
LOG (the parent company of the Company) grantedrights to its own equity instruments direct to theCompany and its subsidiaries’ employees.
• Options, granted in July 2009 (formally authorized inJanuary 2010) are conditional on the employeecompleting four years’ service (the vesting period)and there are no performance conditions. Theexercise price of the options is € 23.20. Optionshave a contractual option term of 6 years.
• Options, granted on February 2008, are conditionalon the employee completing four years’ service (thevesting period) and there are no performanceconditions. The exercise price of the options is€26.10. Options have a contractual option term of 6years.
48
DIRECTORS’ REPORT (CONTINUED)
• The free shares, granted on July 2009, June 2008and February 2008 are conditional upon theemployee completing four years’ service (the vestingperiod).
• On 27 December 2007, 60,651 shares of LOG havebeen issued to the benefit of FCPE L’OccitaneActionnariat which is a fund held by employees ofthe French subsidiaries of the Group. The shareswere issued for a subscription price with a discountof 20% as compared to the fair value at that date.There is no vesting condition. However the sharesare subject to restrictions on transfer over a periodof 5 years.
At the time they become LOG shareholders, employeesare subject to a liquidity agreement signed with CIME,which is controlled by Mr. Reinold Geiger, a Director ofthe Company.
DIRECTORS’ RIGHTS TO ACQUIRESHARES OR DEBT SECURITIES
Other than as disclosed in the paragraph headed“DIRECTORS’ AND CHIEF EXECUTIVE’S INTERESTSIN SHARES AND UNDERLYING SHARES” and“SHARE OPTION SCHEME” in this report, at no timeduring the year was the Company or any of itssubsidiaries a party to any arrangement to enable theDirectors or chief executive of the Company (includingtheir spouses or children under 18 years of age) to haveany right to subscribe for securities of the Company orany of its associated corporations as defined in the SFOor to acquire benefits by means of acquisition of sharesin, or debentures of, the Company or any other bodycorporate.
DIRECTORS’ INTERESTS INCONTRACTS OF SIGNIFICANCE
At the end of the year or at any time during the yearended 31 March 2010, there was no contract ofsignificance in relation to the Company’s business, towhich the Company or any of its subsidiaries was aparty, and in which a Director had, whether directly orindirectly, a material interest.
CONNECTED TRANSACTIONS
During the year ended 31 March 2010, the Company hadthe following non-exempt continuing connectedtransaction, which, prior to 3 June 2010 whenamendments to Chapter 14A of the Listing Rules cameinto effect, was subject to the reporting andannouncement requirements set out in Rules 14A.45 to14A.47 of the Listing Rules and the annual reviewrequirements set out in Rules 14A.37 to 14A.40 of theListing Rules and is exempt from the independentshareholders’ approval requirements set out in Chapter14A of the Listing Rules.
Sale of products to Courtin-ClarinsAssociates
Clarins Canada Inc., Clarins Sdn Bhd and MonarimportSpA are each a subsidiary of Clarins BV, a substantialshareholder of the Company’s subsidiaries, L’Occitane(Suisse) S.A., L’Occitane (Korea) Limited and L’OccitaneMexico S.A. de CV. Further, Clarins BV holds 40% of theequity interest in L’Occitane Nederland BV (a company inwhich the Company does not have any direct or indirectshareholding interest). Each of Clarins Canada Inc.,Clarins Sdn Bhd, Monarimport SpA and L’OccitaneNederland BV (together, the “Courtin-ClarinsAssociates”) is therefore an associate of Clarins BV anda connected person of the Company.
The Company sells L’Occitane products, includingregular products as well as samples and products to bedistributed as gifts and L’Occitane branded carry bagsand similar packaging products, to the Courtin-ClarinsAssociates. The Courtin-Clarins Associates (other thanClarins Canada Inc.) are distributors for the Company’sL’Occitane products in Malaysia, Italy and theNetherlands respectively. The Company has in the pastsold our products to Clarins Canada Inc., who wouldthen distribute them in Canada to retailers such asdepartment stores. However, with effect from 31 March2010, the Company no longer conducts such sales toClarins Canada Inc. and instead the Company will itselfdo so, through the entire business undertaking andoperations of Stroms’ Enterprises Limited, which theCompany acquired on 14 May 2009.
For the year ended 31 March 2010, the aggregate salesmade by the Company of such products to the Courtin-Clarins Associates was approximately €3.3 million.
49
Further details of the sale of products to the Courtin-Clarins Associates are set out in note 30 to the financialstatements. Please also refer to the Company’sannouncement to be issued late July 2010 for thechanges to the Company’s existing non-exemptconnected transactions as a result of the amendments toChapter 14A of the Listing Rules (effective as of 3 June2010).
During the year ended 31 March 2010, the Company hadthe following non-exempt continuing connectedtransaction, which, prior to 3 June 2010 whenamendments to Chapter 14A of the Listing Rules cameinto effect, was subject to the reporting andannouncement requirements set out in Rules 14A.45 to14A.47 of the Listing Rules and the annual reviewrequirements set out in Rules 14A.37 to 14A.40 of theListing Rules and the independent shareholders’approval requirements set out in Chapter 14A of theListing Rules.
Clarins Shareholders’ Loans
Clarins BV holds 49.9% of the issued share capital ineach of the Company’s subsidiaries, L’Occitane (Suisse)S.A., L’Occitane (Korea) Limited and L’Occitane MexicoS.A. de CV. Clarins BV is therefore a connected personof the Company. Each of its subsidiaries, L’Occitane(Suisse) S.A., L’Occitane (Korea) Limited and L’OccitaneMexico S.A. de CV is also a connected person of theCompany. The Company and Clarins Groupe Sarl havemade shareholders’ loans to these subsidiaries in equalshares, as further described below (the ClarinsShareholders’ Loans). The Clarins Shareholders’ Loansare therefore connected transactions of the Company.
Pursuant to loan contracts dated 22 December 2008 and18 December 2009 and promissory notes dated 18December 2008 and 18 December 2009, the Companyand Clarins Groupe Sarl each contributed, in both SwissFrancs and Euros, the Euro equivalent of approximately€1,261,000 and €1,190,000 respectively, amounting toan aggregate of approximately €2,451,000, to oursubsidiary, L’Occitane (Suisse) S.A., as a shareholders’loan. For the year ended 31 March 2010, the Euroequivalent of €45,000 and €45,000 were paid to theCompany and Clarins Groupe Sarl respectively asinterest payment. Outstanding principal loan amountspayable by L’Occitane (Suisse) S.A. to the Company and
Clarins Groupe Sarl were the Euro equivalent of€1,278,000 and €1,190,000 respectively as at 31 March2010. Each of the loans made by the Company andClarins Groupe Sarl’s to L’Occitane (Suisse) S.A. are duefor repayment on 20 December 2010.
Pursuant to loan contracts dated 17 December 2008 and16 October 2009 and promissory notes dated 16October 2008, 17 December 2008 and 16 October 2009,the Company, our wholly owned subsidiary L’OccitaneSingapore Pte Ltd and Clarins Groupe Sarl eachcontributed €1,220,000, €288,000 and 1,502,000respectively, amounting to an aggregate of €3,010,000,to our subsidiary, L’Occitane (Korea) Limited, asshareholders’ loans. For the year ended 31 March 2010,€44,000, €14,000 and €48,000 were paid to theCompany, L’Occitane Singapore Pte Ltd and ClarinsGroupe Sarl, respectively, as interest payment.Outstanding principal loan amounts payable byL’Occitane (Korea) Limited to the Company, L’OccitaneSingapore Pte Ltd and Clarins Groupe Sarl were€1,233,000, €288,000 and €1,502,000 respectively asat 31 March 2010. The loans made by the Company aredue for repayment on 15 October 2010. The loans madeby L’Occitane Singapore Pte Ltd were fully repaid on 14April 2010. Part of the loans made by Clarins GroupeSarl in the amount of €286,850 were repaid on 14 April2010 and the remaining €1,215,150 is due for repaymenton 18 October 2010.
Pursuant to loan contracts dated 22 December 2008, 5January 2009, 23 March 2009 and 22 December 2009and promissory notes dated 22 December 2008, 22October 2009 and 22 December 2009, the Company andClarins Groupe Sarl each contributed in US dollars theEuro equivalent of approximately €2,315,000 and€2,303,000 respectively, amounting to approximately€4,618,000, to our subsidiary, L’Occitane Mexico S.A.de CV, as shareholders’ loans. For the year ended 31March 2010, the Euro equivalent of €82,000 and€88,000 were paid to the Company and Clarins GroupeSarl respectively as interest payment. Outstandingprincipal loan amounts payable by L’Occitane MexicoS.A. de CV to the Company and Clarins Groupe Sarlwere €2,437,000 and €2,419,000 respectively as at 31March 2010. Both the loans made by the Company andClarins Groupe Sarl to L’Occitane Mexico S.A. de CV aredue for repayment on 22 December 2010.
50
DIRECTORS’ REPORT (CONTINUED)
Further details of the Clarins Shareholders’ Loans are setout in note 30 to the financial statements. Please alsorefer to the Company’s announcement to be issued lateJuly 2010 for the changes to the Company’s existingnon-exempt connected transactions as a result of theamendments to Chapter 14A of the Listing Rules(effective as of 3 June 2010).
For the year ended 31 March 2010, the aggregateprincipal amount owing and annual interest paid byL’Occitane (Suisse) S.A., L’Occitane (Korea) Limited andL’Occitane Mexico S.A. de CV to the Company,L’Occitane Singapore Pte Ltd and Clarins Groupe Sarl inrespect of the Clarins Shareholders’ Loans was€5,119,000, €302,000 and €5,292,000 respectively.
The aforesaid continuing connected transactions havebeen reviewed by independent non-executive directorsof the Company. The independent non-executivedirectors confirmed that the aforesaid connectedtransactions were entered into (a) in the ordinary andusual course of business of the Group; (b) either onnormal commercial terms or on terms no less favorableto the Group than terms available to or from independentthird parties; (c) in accordance with the relevantagreements governing them on terms that are fair andreasonable and in the interests of the shareholders of theCompany as a whole.
In accordance with paragraph 14A.38 of the ListingRules, the Board of Directors engaged the auditors ofthe Company to perform certain factual findingprocedures on the above continuing connectedtransactions on a sample basis in accordance withInternational Standard on Related Services 4400“Engagements to Perform Agreed-Upon ProceduresRegarding Financial Information” issued by theInternational Auditing and Assurance Standards Board.The auditors have reported their factual findings on theselected samples based on the agreed procedures to theBoard of Directors and confirmed that the aforesaidconnected transactions:
(i) have received the approval of the Company’s boardof directors;
(ii) are in accordance with the pricing policies of theCompany, where applicable; and
(iii) have been entered in accordance with the relevantwritten agreements governing the transactions.
As no cap amounts have been set out in the Company’sprospectus dated 26 April 2010 for the year ended 31March 2010, the auditors did not report on this point.
BANK LOANS AND OTHERBORROWINGS
Details of the Group’s bank loans and other borrowingsas at 31 March 2010 are set out in note 17 to thefinancial statements.
MAJOR CUSTOMERS AND SUPPLIERS
The aggregate sales to the five largest customers of theGroup accounted for approximately 3.1% of the Group’stotal revenue and sales to the largest customeraccounted for approximately 0.7% of the Group’s totalrevenue for the year ended 31 March 2010. Theaggregate purchases from the five largest suppliers ofthe Group accounted for approximately 13.7% of theGroup’s total cost of goods sold and purchases from thelargest supplier accounted for approximately 3.9% of theGroup’s total cost of goods sold for the year ended 31March 2010.
None of the Directors, their associates, or anyshareholder who to the knowledge of the Directors ownmore than 5% of the Company’s issued share capitalhas any interest in the Group’s five largest suppliers orthe Group’s five largest customers.
RETIREMENT BENEFIT SCHEMES
Details of the retirement benefit schemes of the Groupare set out in note 18 to the financial statements.
MODEL CODE FOR SECURITIESTRANSACTIONS
The Company has adopted the Model Code as set out inAppendix 10 of the Listing Rules. Having made specificenquiry to all Directors, all Directors have confirmed thatthey have complied with the required standard of theModel Code throughout the period from the Listing Dateand up to the date of this report.
51
CODE ON CORPORATE GOVERNANCEPRACTICES (THE “CODE”)
As the Company was not listed on the Stock Exchangefor the financial year ended 31 March 2010, the Codewas not applicable to the Company for the year ended31 March 2010. Since the Listing Date, the Company isin compliance with all the mandatory provisions of theCode, save for deviation from provision A.2.1.
For details of the Corporate Governance Report, pleaserefer to pages 26 to 35 of this report.
POST BALANCE SHEET EVENTS
Details of significant events occurring after the balancesheet date are set out in note 31 to the financialstatements.
MATERIAL LEGAL PROCEEDINGS
As at 31 March 2010, no member of our Group wasengaged in any litigation, arbitration or claim of materialimportance and no litigation, arbitration or claim ofmaterial importance was known to the directors to bepending or threatened against any member of the Group.
SUFFICIENCY OF PUBLIC FLOAT
Based on the information that is publicly available to theCompany and within the knowledge of the Directors atthe date of this annual report, there was a sufficientprescribed public float of more than 25% of the issuedshare capital of the Company under the Listing Rulesduring the period from the Listing Date to the date of thisreport.
AUDITORS
The financial statements were audited byPricewaterhouseCoopers who will retire as auditors ofthe Company at the conclusion of the forthcomingannual general meeting and being eligible, offerthemselves for re-appointment. A resolution for the re-appointment of PricewaterhouseCoopers as auditors ofthe Company will be proposed at the forthcoming annualgeneral meeting of the Company.
By order of the Board
Reinold GeigerChairman
24 June 2010

52
INDEPENDENT AUDITORS’ REPORT
CONSOLIDATEDFINANCIALSTATEMENTS

53
INDEPENDENT AUDITORS’ REPORT
54
INDEPENDENT AUDITORS’ REPORT
PricewaterhouseCoopersSociété à responsabilité limitée400, Route d’EschB.P. 1443L-1014 LuxembourgTelephone +352 494848-1Facsimile +352 494848-2900www.pwc.com/[email protected]
To the Shareholders ofL’Occitane International S.A.
Report on the consolidated financial statements
We have audited the accompanying consolidated financial statements of L’Occitane International S.A. and itssubsidiaries (the “Group”), which comprise the consolidated balance sheet as at March 31, 2010 and the consolidatedincome statement and consolidated statements of comprehensive income, changes in equity and cash flows for theyear then ended and a summary of significant accounting policies and other explanatory notes.
Board of Directors’ responsibility for the consolidated financial statements
The Board of Directors is responsible for the preparation and fair presentation of these consolidated financialstatements in accordance with International Financial Reporting Standards as issued by the International AccountingStandards Board and as adopted by the European Union. This responsibility includes: designing, implementing andmaintaining internal control relevant to the preparation and fair presentation of consolidated financial statements thatare free from material misstatement, whether due to fraud or error; selecting and applying appropriate accountingpolicies; and making accounting estimates that are reasonable in the circumstances.
Responsibility of the “Réviseur d’entreprises agréé” (“Registered Auditor”)
Our responsibility is to express an opinion on these consolidated financial statements based on our audit. Weconducted our audit in accordance with International Standards on Auditing as issued by the International Auditing andAssurance Standards Board and as adopted for Luxembourg by the “Commission de Surveillance du SecteurFinancier”. Those standards require that we comply with ethical requirements and plan and perform the audit to obtainreasonable assurance whether the consolidated financial statements are free from material misstatement. An auditinvolves performing procedures to obtain audit evidence about the amounts and disclosures in the consolidatedfinancial statements. The procedures selected depend on the judgment of the “Réviseur d’entreprises agréé” includingthe assessment of the risks of material misstatement of the consolidated financial statements, whether due to fraud orerror. In making those risk assessments, the “Réviseur d’entreprises agréé” considers internal control relevant to theentity’s preparation and fair presentation of the consolidated financial statements in order to design audit proceduresthat are appropriate in the circumstances, but not for the purpose of expressing an opinion on the effectiveness of theentity’s internal control.
An audit also includes evaluating the appropriateness of accounting policies used and the reasonableness ofaccounting estimates made by the Board of Directors, as well as evaluating the overall presentation of the consolidatedfinancial statements.
We believe that the audit evidence we have obtained is sufficient and appropriate to provide a basis for our auditopinion.

55
Opinion
In our opinion, these consolidated financial statements give a true and fair view of the consolidated financial position ofthe Group as of March 31, 2010, and of its consolidated financial performance and its consolidated cash flows for theyear then ended in accordance with International Financial Reporting Standards as issued by the InternationalAccounting Standards Board and as adopted by the European Union.
Report on other legal and regulatory requirements
The Directors’ report, which is the responsibility of the Board of Directors, is consistent with the consolidated financialstatements.
PricewaterhouseCoopers S.à r.l. Luxembourg, June 24, 2010Represented by
Pascal Rakovsky
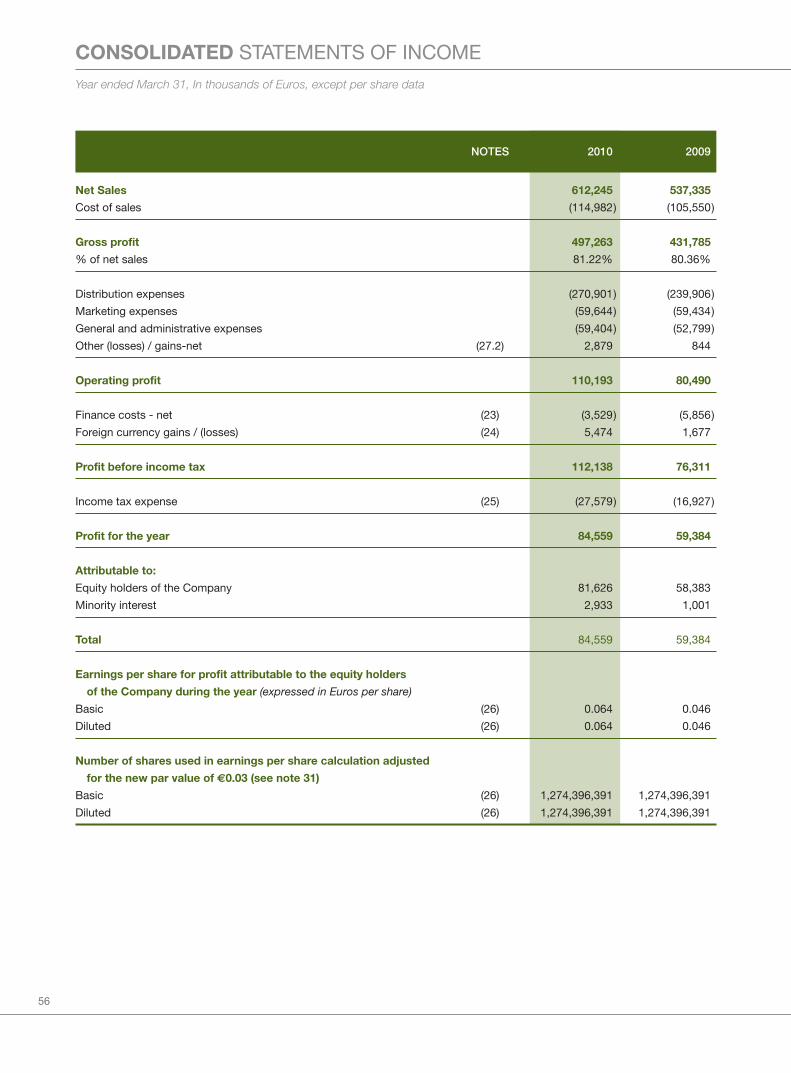
56
CONSOLIDATED STATEMENTS OF INCOME
Year ended March 31, In thousands of Euros, except per share data
NOTES 2010 2009
Net Sales 612,245 537,335
Cost of sales (114,982) (105,550)
Gross profit 497,263 431,785
% of net sales 81.22% 80.36%
Distribution expenses (270,901) (239,906)
Marketing expenses (59,644) (59,434)
General and administrative expenses (59,404) (52,799)
Other (losses) / gains-net (27.2) 2,879 844
Operating profit 110,193 80,490
Finance costs - net (23) (3,529) (5,856)
Foreign currency gains / (losses) (24) 5,474 1,677
Profit before income tax 112,138 76,311
Income tax expense (25) (27,579) (16,927)
Profit for the year 84,559 59,384
Attributable to:
Equity holders of the Company 81,626 58,383
Minority interest 2,933 1,001
Total 84,559 59,384
Earnings per share for profit attributable to the equity holders
of the Company during the year (expressed in Euros per share)
Basic (26) 0.064 0.046
Diluted (26) 0.064 0.046
Number of shares used in earnings per share calculation adjusted
for the new par value of €0.03 (see note 31)
Basic (26) 1,274,396,391 1,274,396,391
Diluted (26) 1,274,396,391 1,274,396,391

57
CONSOLIDATED STATEMENTS OF COMPREHENSIVE INCOME
Year ended March 31, In thousands of Euros, except per share data
NOTES 2010 2009
Profit for the year 84,559 59,384
Other comprehensive income:
Cash flow hedges fair value gains / (losses) net of tax (14) (1,610) 237
Currency translation differences 4,044 4,080
Other comprehensive income / (loss) for the year, net of tax 2,434 4,317
Total comprehensive income for the year 86,993 63,701
Attributable to:
– Equity holders of the Company 83,337 62,291
– Minority interest 3,656 1,410
Total 86,993 63,701
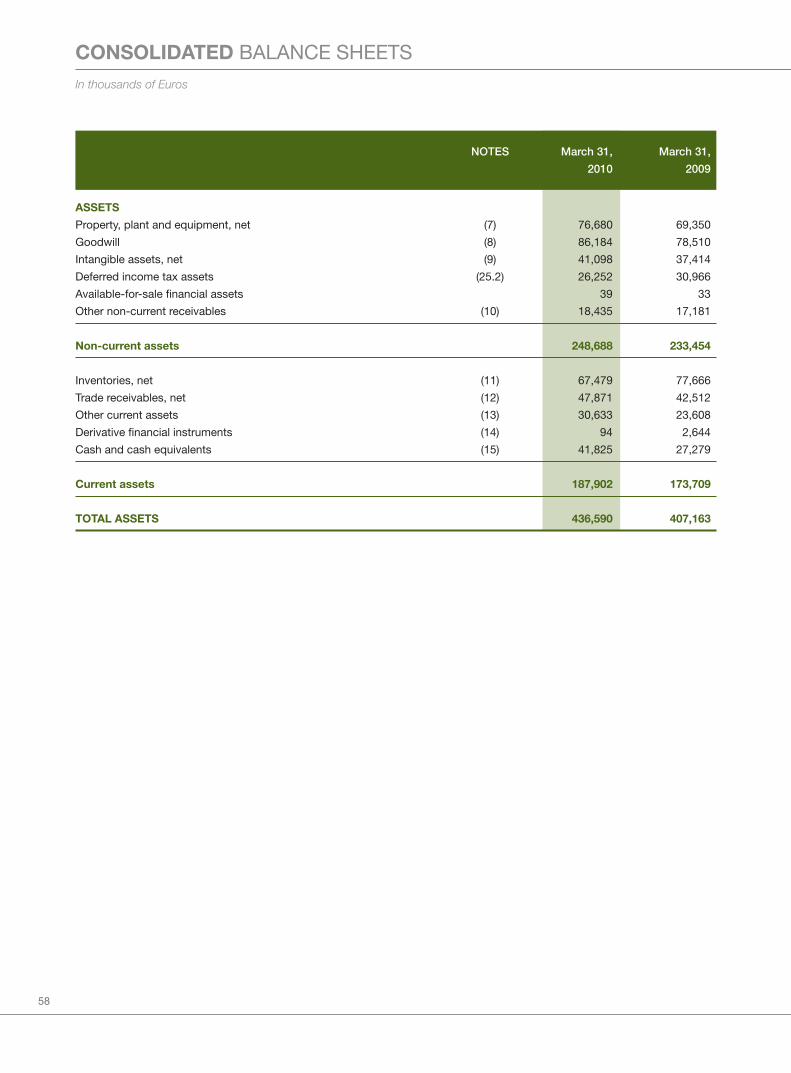
58
CONSOLIDATED BALANCE SHEETS
In thousands of Euros
NOTES March 31, March 31,
2010 2009
ASSETS
Property, plant and equipment, net (7) 76,680 69,350
Goodwill (8) 86,184 78,510
Intangible assets, net (9) 41,098 37,414
Deferred income tax assets (25.2) 26,252 30,966
Available-for-sale financial assets 39 33
Other non-current receivables (10) 18,435 17,181
Non-current assets 248,688 233,454
Inventories, net (11) 67,479 77,666
Trade receivables, net (12) 47,871 42,512
Other current assets (13) 30,633 23,608
Derivative financial instruments (14) 94 2,644
Cash and cash equivalents (15) 41,825 27,279
Current assets 187,902 173,709
TOTAL ASSETS 436,590 407,163
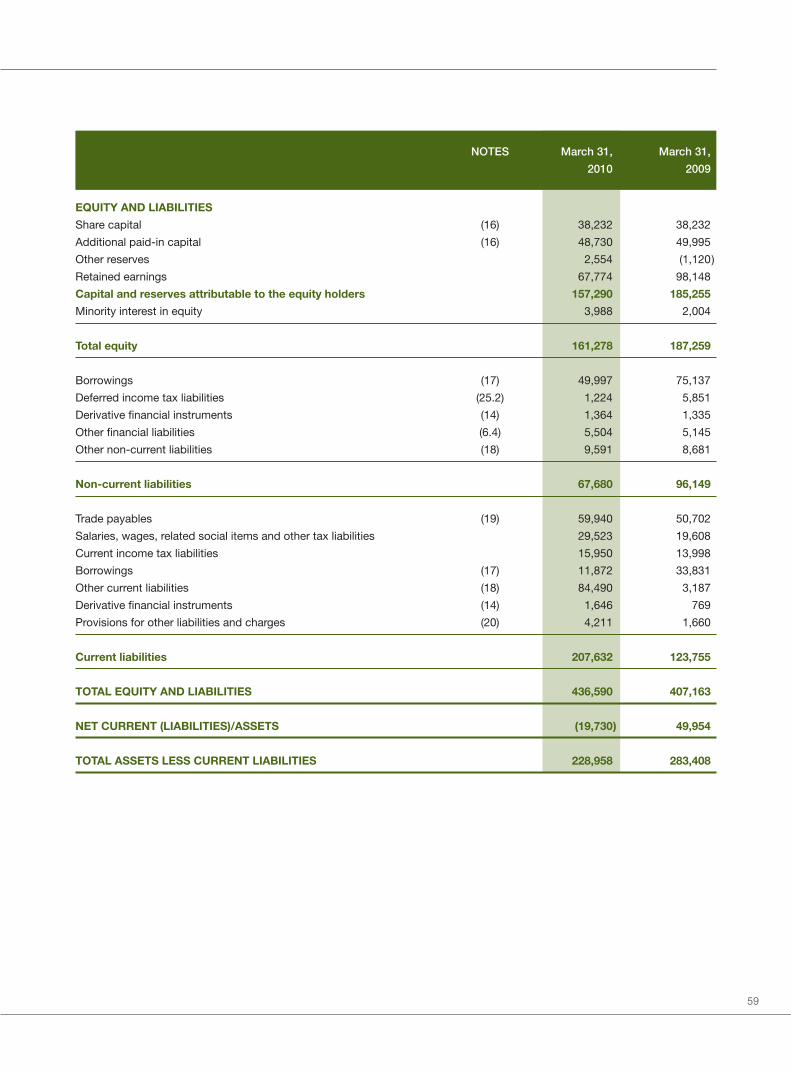
59
NOTES March 31, March 31,
2010 2009
EQUITY AND LIABILITIES
Share capital (16) 38,232 38,232
Additional paid-in capital (16) 48,730 49,995
Other reserves 2,554 (1,120)
Retained earnings 67,774 98,148
Capital and reserves attributable to the equity holders 157,290 185,255
Minority interest in equity 3,988 2,004
Total equity 161,278 187,259
Borrowings (17) 49,997 75,137
Deferred income tax liabilities (25.2) 1,224 5,851
Derivative financial instruments (14) 1,364 1,335
Other financial liabilities (6.4) 5,504 5,145
Other non-current liabilities (18) 9,591 8,681
Non-current liabilities 67,680 96,149
Trade payables (19) 59,940 50,702
Salaries, wages, related social items and other tax liabilities 29,523 19,608
Current income tax liabilities 15,950 13,998
Borrowings (17) 11,872 33,831
Other current liabilities (18) 84,490 3,187
Derivative financial instruments (14) 1,646 769
Provisions for other liabilities and charges (20) 4,211 1,660
Current liabilities 207,632 123,755
TOTAL EQUITY AND LIABILITIES 436,590 407,163
NET CURRENT (LIABILITIES)/ASSETS (19,730) 49,954
TOTAL ASSETS LESS CURRENT LIABILITIES 228,958 283,408
60
COMPANY-ALONE BALANCE SHEETS
In thousands of Euros
NOTES March 31, March 31,
2010 2009
ASSETS
Property, plant and equipment, net 1,241 1,097
Intangible assets, net 1,503 951
Investments in subsidiaries (32) 113,463 109,464
Deferred income tax assets 667 —
Other non-current receivables due from subsidiaries 4 1,647
Non-current assets 116,878 113,159
Inventories, net 1,808 1,959
Trade receivables due from subsidiaries, net 36,332 31,743
Trade receivables, net (12) 7,009 6,331
Other current assets due from subsidiaries 126,005 132,967
Other current assets 2,474 1,953
Derivative financial instruments (14) 94 2,644
Cash and cash equivalents (15) 14,482 10,095
Current assets 188,204 187,692
TOTAL ASSETS 305,082 300,851
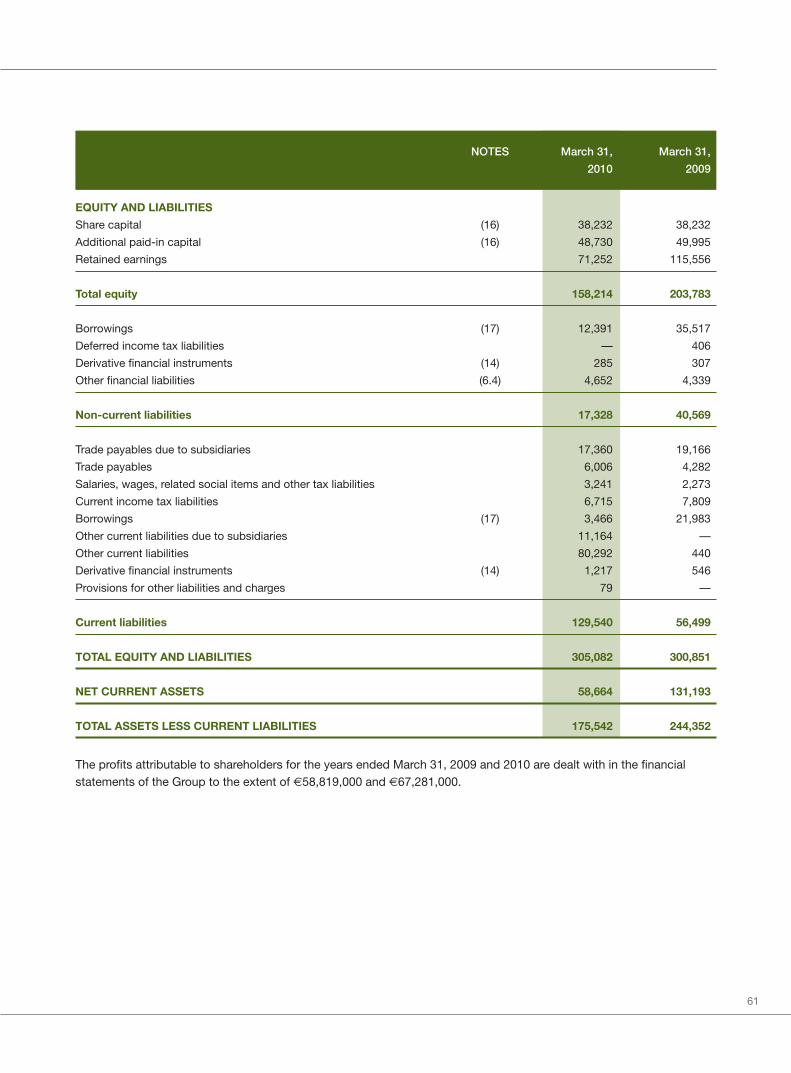
61
NOTES March 31, March 31,
2010 2009
EQUITY AND LIABILITIES
Share capital (16) 38,232 38,232
Additional paid-in capital (16) 48,730 49,995
Retained earnings 71,252 115,556
Total equity 158,214 203,783
Borrowings (17) 12,391 35,517
Deferred income tax liabilities — 406
Derivative financial instruments (14) 285 307
Other financial liabilities (6.4) 4,652 4,339
Non-current liabilities 17,328 40,569
Trade payables due to subsidiaries 17,360 19,166
Trade payables 6,006 4,282
Salaries, wages, related social items and other tax liabilities 3,241 2,273
Current income tax liabilities 6,715 7,809
Borrowings (17) 3,466 21,983
Other current liabilities due to subsidiaries 11,164 —
Other current liabilities 80,292 440
Derivative financial instruments (14) 1,217 546
Provisions for other liabilities and charges 79 —
Current liabilities 129,540 56,499
TOTAL EQUITY AND LIABILITIES 305,082 300,851
NET CURRENT ASSETS 58,664 131,193
TOTAL ASSETS LESS CURRENT LIABILITIES 175,542 244,352
The profits attributable to shareholders for the years ended March 31, 2009 and 2010 are dealt with in the financialstatements of the Group to the extent of €58,819,000 and €67,281,000.
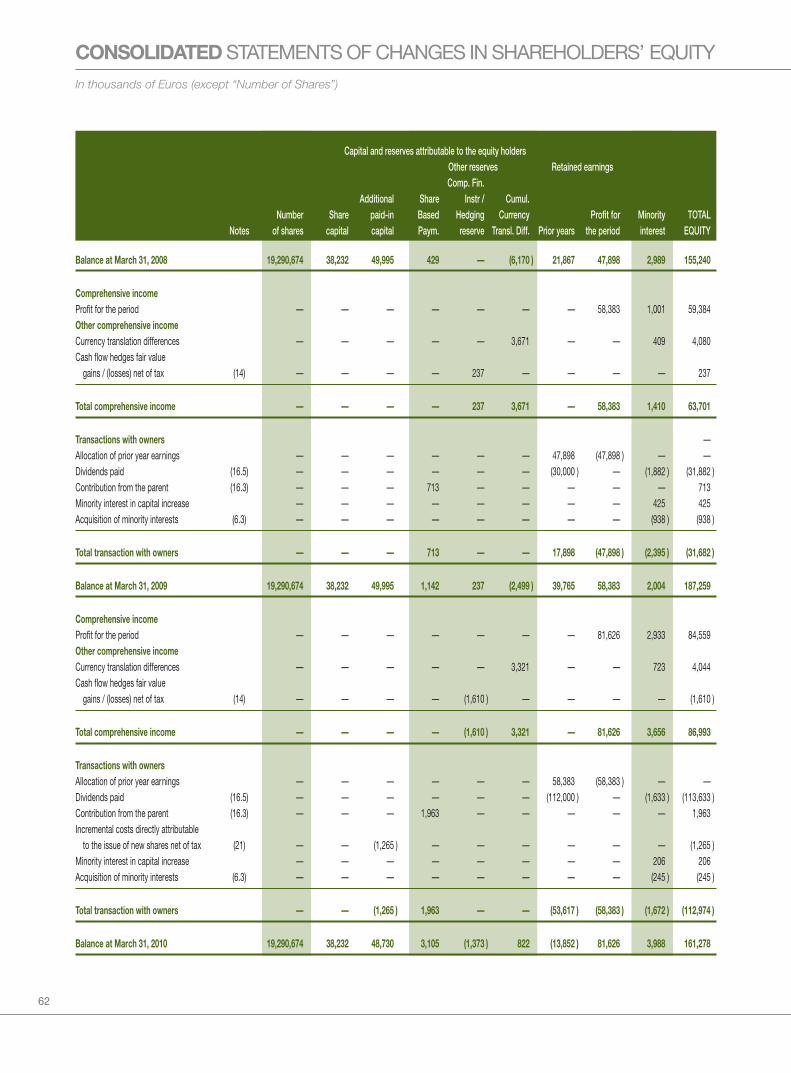
62
CONSOLIDATED STATEMENTS OF CHANGES IN SHAREHOLDERS’ EQUITY
In thousands of Euros (except “Number of Shares”)
Capital and reserves attributable to the equity holdersOther reserves Retained earningsComp. Fin.
Additional Share Instr / Cumul.Number Share paid-in Based Hedging Currency Profit for Minority TOTAL
Notes of shares capital capital Paym. reserve Transl. Diff. Prior years the period interest EQUITY
Balance at March 31, 2008 19,290,674 38,232 49,995 429 — (6,170 ) 21,867 47,898 2,989 155,240
Comprehensive incomeProfit for the period — — — — — — — 58,383 1,001 59,384Other comprehensive incomeCurrency translation differences — — — — — 3,671 — — 409 4,080Cash flow hedges fair value
gains / (losses) net of tax (14) — — — — 237 — — — — 237
Total comprehensive income — — — — 237 3,671 — 58,383 1,410 63,701
Transactions with owners —Allocation of prior year earnings — — — — — — 47,898 (47,898 ) — —Dividends paid (16.5) — — — — — — (30,000 ) — (1,882 ) (31,882 )Contribution from the parent (16.3) — — — 713 — — — — — 713Minority interest in capital increase — — — — — — — — 425 425Acquisition of minority interests (6.3) — — — — — — — — (938 ) (938 )
Total transaction with owners — — — 713 — — 17,898 (47,898 ) (2,395 ) (31,682 )
Balance at March 31, 2009 19,290,674 38,232 49,995 1,142 237 (2,499 ) 39,765 58,383 2,004 187,259
Comprehensive incomeProfit for the period — — — — — — — 81,626 2,933 84,559Other comprehensive incomeCurrency translation differences — — — — — 3,321 — — 723 4,044Cash flow hedges fair value
gains / (losses) net of tax (14) — — — — (1,610 ) — — — — (1,610 )
Total comprehensive income — — — — (1,610 ) 3,321 — 81,626 3,656 86,993
Transactions with ownersAllocation of prior year earnings — — — — — — 58,383 (58,383 ) — —Dividends paid (16.5) — — — — — — (112,000 ) — (1,633 ) (113,633 )Contribution from the parent (16.3) — — — 1,963 — — — — — 1,963Incremental costs directly attributable
to the issue of new shares net of tax (21) — — (1,265 ) — — — — — — (1,265 )Minority interest in capital increase — — — — — — — — 206 206Acquisition of minority interests (6.3) — — — — — — — — (245 ) (245 )
Total transaction with owners — — (1,265 ) 1,963 — — (53,617 ) (58,383 ) (1,672 ) (112,974 )
Balance at March 31, 2010 19,290,674 38,232 48,730 3,105 (1,373 ) 822 (13,852 ) 81,626 3,988 161,278

63
CONSOLIDATED STATEMENTS OF CASH FLOWS
Year ended March 31, In thousands of Euros
Notes 2010 2009
Cash flows from operating activitiesProfit for the year from continuing operations 84,559 59,384Adjustments to reconcile profit for the year to
net cash from operating activitiesDepreciation, amortization and impairment (27.3) 26,725 23,370Deferred income taxes (25.1) 2,203 (4,932)Share of (gain) / loss in associates and joint-ventures — —Unwinding of discount on other financial liabilities (23) 359 595Share based payment (22) 1,963 713Change in the fair value of derivatives (14) 1,257 (1,878)Other (losses) – net (27.2) (2,292) (253)Net movements in provisions (27.4) 2,648 (100)
Changes in working capital (excluding the effects of acquisitionsand exchange differences on consolidation)Inventories 11,712 (12,030)Trade receivables (3,611) 5,452Trade payables 6,564 (9,227)Salaries, wages, related social items and other tax liabilities 9,168 1,260Current income tax liabilities 520 (2,593)Unpaid finance costs (13) 292Other assets and liabilities, net (3,648) (3,721)
Net cash generated from operating activities 138,114 56,332
Cash flows from investing activitiesAcquisition of subsidiary, net of cash acquired (6.3) (7,274) (57,018)Purchases of property, plant and equipment (7) (22,795) (30,587)Purchases of intangible assets (9) (7,465) (8,473)Proceeds from sale of fixed assets (27.2) 3,123 742Proceeds from sale of investment in associates and joint-ventures — —Change in deposits and key moneys paid to the landlords (1,499) (4,684)Change in non-current receivables and liabilities 296 (83)
Net cash used in investing activities (35,614) (100,103)
Cash flows from financing activitiesPayments directly attributable to the issue of new shares (21) (661) —Proceeds from the capital contributed by the minority shareholders 206 425Change in other financing items 719 —Dividends paid to shareholders (16.5) (32,000) (30,000)Dividends paid to minority shareholders (1,633) (1,882)Proceeds from borrowings (17),(27.7) 10,331 69,338Change in financing from parent (17.3) (23,953) 5,280Repayments of borrowings (17),(27.7) (40,367) (5,037)Repayments on obligations under finance leases (17) (1,104) (1,175)
Net cash generated from / (used in) financing activities (88,462) 36,949
Effects of the exchange rate changes (27.5) (2,580) (4,130)
Net increase/(decrease) in cash and bank overdrafts ofdiscontinued operations — —
Net (decrease)/ increase in cash, cash equivalents and bank overdrafts 11,458 (10,952)
Cash, cash equivalents and bank overdrafts at beginning of the year 26,928 37,880
Cash 27,279 39,073Bank overdrafts (351) (1,193)
Cash, cash equivalents and bank overdrafts at end of the year 38,387 26,928
Cash 41,825 27,279Bank overdrafts (3,438) (351)
64
NOTES TO THE CONSOLIDATED FINANCIAL STATEMENTS
1. THE GROUP ................................................................................................................................................... 672. SUMMARY OF SIGNIFICANT ACCOUNTING POLICIES ............................................................................... 672.1. Basis of preparation ....................................................................................................................................... 672.2. Principles of consolidation ............................................................................................................................. 742.3. Foreign currency translation ........................................................................................................................... 762.4. Segment reporting .......................................................................................................................................... 772.5. Intangible assets ............................................................................................................................................. 772.6. Property, Plant and Equipment ....................................................................................................................... 792.7. Impairment of non-financial assets ................................................................................................................ 792.8. Deposits .......................................................................................................................................................... 802.9. Assets held for sale and assets directly associated with discontinued operations ....................................... 802.10. Inventories ...................................................................................................................................................... 812.11. Trade receivables ............................................................................................................................................ 812.12. Financial assets .............................................................................................................................................. 812.13. Derivative financial instruments and hedging activities .................................................................................. 832.14. Cash and cash equivalents ............................................................................................................................ 852.15. Share capital ................................................................................................................................................... 852.16. Dividend distribution ....................................................................................................................................... 852.17. Trade payables ............................................................................................................................................... 852.18. Provisions ....................................................................................................................................................... 862.19. Employee benefits .......................................................................................................................................... 872.20. Borrowings and compound financial instruments .......................................................................................... 892.21. Revenue recognition ....................................................................................................................................... 892.22. Distribution expenses ..................................................................................................................................... 922.23. Marketing expenses ....................................................................................................................................... 922.24. Accounting of rent expenses .......................................................................................................................... 922.25. Start-up and pre-opening costs of stores ...................................................................................................... 922.26. Foreign currency gains / (losses) .................................................................................................................... 932.27. Income taxes .................................................................................................................................................. 932.28. Earnings per share .......................................................................................................................................... 943. FINANCIAL RISK MANAGEMENT .................................................................................................................. 943.1. Financial risk factors ....................................................................................................................................... 943.2. Capital risk management ................................................................................................................................ 983.3. Fair value estimation ....................................................................................................................................... 984. CRITICAL ACCOUNTING ESTIMATES AND JUDGEMENTS ......................................................................... 1014.1. Impairment test of non-current assets ........................................................................................................... 1014.2. Depreciation and amortization periods .......................................................................................................... 1014.3. Allowance on inventories ................................................................................................................................ 1024.4. Legal claims .................................................................................................................................................... 1024.5. Income taxes .................................................................................................................................................. 1025. SEGMENT INFORMATION ............................................................................................................................. 1025.1. Operating segments ....................................................................................................................................... 1035.2. Geographic areas ........................................................................................................................................... 1056. INFORMATION RELATING TO CHANGES IN THE GROUP STRUCTURE ..................................................... 1066.1. For the year ended March 31, 2010 ............................................................................................................... 1066.2. For the year ended March 31, 2009 ............................................................................................................... 1066.3. Cash used in acquisitions and fair value of the net assets acquired ............................................................. 1096.4. Other financial liabilities .................................................................................................................................. 112

65
7. PROPERTY, PLANT AND EQUIPMENT, NET ................................................................................................. 1137.1. Year ended March 31, 2010 ........................................................................................................................... 1147.2. Year ended March 31, 2009 ........................................................................................................................... 1157.3. Classification of the depreciation of the tangible assets in the statement of income .................................... 1167.4. Impairment tests for property, plant and equipment ...................................................................................... 1178. GOODWILL ..................................................................................................................................................... 1188.1. Year ended March 31, 2010 ........................................................................................................................... 1198.2. Year ended March 31, 2009 ........................................................................................................................... 1208.3. Impairment test for goodwill ........................................................................................................................... 1209. INTANGIBLE ASSETS, NET ............................................................................................................................ 1209.1. Year ended March 31, 2010 ........................................................................................................................... 1219.2. Year ended March 31, 2009 ........................................................................................................................... 1229.3. Classification of the amortization of the intangible assets in the statement of income ................................. 1239.4. Impairment tests for intangible assets ........................................................................................................... 12310. OTHER NON-CURRENT RECEIVABLES ........................................................................................................ 12411. INVENTORIES, NET ........................................................................................................................................ 12412. TRADE RECEIVABLES, NET........................................................................................................................... 12513. OTHER CURRENT ASSETS ........................................................................................................................... 13014. DERIVATIVE FINANCIAL INSTRUMENTS ...................................................................................................... 13115. CASH AND CASH EQUIVALENTS.................................................................................................................. 13416. CAPITAL AND RESERVES .............................................................................................................................. 13616.1. Share capital and Additional paid-in capital ................................................................................................... 13616.2. Treasury shares ............................................................................................................................................... 13616.3. Share-based payments .................................................................................................................................. 13716.4. Distributable reserves ..................................................................................................................................... 14116.5. Dividend per share .......................................................................................................................................... 14216.6. Additional paid in capital ................................................................................................................................ 14217. BORROWINGS ............................................................................................................................................... 14317.1. Maturity of non-current borrowings ................................................................................................................ 14517.2. Senior credit facilities agreement ................................................................................................................... 14617.3. Current accounts with minority shareholders and related parties .................................................................. 14817.4. Finance lease liabilities ................................................................................................................................... 15017.5. Effective interest rates .................................................................................................................................... 15017.6. Exposure to interest rate changes .................................................................................................................. 15117.7. Exposure to debt covenants ........................................................................................................................... 15217.8. Denomination in currencies ............................................................................................................................ 15317.9. Borrowing facilities ......................................................................................................................................... 15418. OTHER CURRENT AND NON-CURRENT LIABILITIES .................................................................................. 15518.1. Provision for retirement indemnities ............................................................................................................... 15518.2. Liabilities linked to operating leases ............................................................................................................... 15718.3. Provision for dismantling and restoring .......................................................................................................... 15718.4. Grants to a foundation .................................................................................................................................... 15818.5. Deferred revenue ............................................................................................................................................ 15819. TRADE PAYABLES .......................................................................................................................................... 15920. PROVISIONS FOR OTHER LIABILITIES AND CHARGES .............................................................................. 15920.1. Year ended March 31, 2010 ........................................................................................................................... 16020.2. Year ended March 31, 2009 ........................................................................................................................... 16021. DIRECT COSTS RELATED TO THE PROJECTED IPO - NET......................................................................... 16122. EXPENSES BY NATURE ................................................................................................................................. 162
66
NOTES TO THE CONSOLIDATED FINANCIAL STATEMENTS (CONTINUED)
23. FINANCE COSTS, NET................................................................................................................................... 16324. FOREIGN CURRENCY GAINS / (LOSSES) .................................................................................................... 16325. INCOME TAX EXPENSE ................................................................................................................................. 16425.1. Income tax expense ....................................................................................................................................... 16425.2. Components of deferred income tax assets and liabilities ............................................................................ 16525.3. Movements in deferred tax assets and liabilities, net .................................................................................... 16625.4. Income tax on unremitted earnings ................................................................................................................ 16626. EARNINGS PER SHARE ................................................................................................................................. 16727. SUPPLEMENTAL DISCLOSURE ON CASH FLOW INFORMATION ............................................................... 16827.1. Cash paid for interest and income taxes ........................................................................................................ 16827.2. Proceeds from sale of assets ......................................................................................................................... 16827.3. Depreciation, amortization and impairment ................................................................................................... 16927.4. Net movement in provisions ........................................................................................................................... 16927.5. Other non cash items ..................................................................................................................................... 17027.6. Effects of the exchange rate changes on the net (decrease) / increase in cash and cash equivalents ......... 17027.7. Cash flows reported on a net basis ................................................................................................................ 17028. CONTINGENCIES ........................................................................................................................................... 17128.1. Legal proceedings .......................................................................................................................................... 17128.2. Contingent liabilities ....................................................................................................................................... 17129. COMMITMENTS ............................................................................................................................................. 17229.1. Capital expenditure commitments ................................................................................................................. 17229.2. Lease commitments ....................................................................................................................................... 17229.3. Other commitments ........................................................................................................................................ 17330. TRANSACTIONS WITH RELATED PARTIES ................................................................................................... 17430.1. Key management compensation .................................................................................................................... 17430.2. Sales of products and services ...................................................................................................................... 17730.3. Purchases of goods and services .................................................................................................................. 17830.4. Borrowings from related parties (note 17.3) ................................................................................................... 17930.5. Transactions with other related parties ........................................................................................................... 18030.6. Formation of joint ventures/acquisition of additional interests in a subsidiary ............................................... 18030.7. Commitments and contingencies ................................................................................................................... 18031. POST BALANCE SHEET EVENTS .................................................................................................................. 18132. LIST OF SUBSIDIARIES AND ASSOCIATES .................................................................................................. 18233. ULTIMATE HOLDING COMPANY ................................................................................................................... 185
67
NOTES TO THE CONSOLIDATED FINANCIAL STATEMENTS
1. THE GROUP
L’Occitane International S.A. (the “Company”) and its consolidated subsidiaries (hereinafter referred to as the“Group”) design, manufacture and market, under the trademarks L’Occitane and Melvita, a wide range of cosmeticproducts, perfumes, soaps and fragrant products for the home based on natural or organic ingredients.
The Group also designs and markets another range of fragrant products for the home, cosmetic products,perfumes, soaps and natural products, under the trademark “Couvent des Minimes”. These products are marketedprimarily through external distribution.
The Group markets a range of olive oil based foodstuffs under the brand “Olivier & Co”.
L’Occitane International S.A. is a Luxembourg Société Anonyme registered in the Luxembourg Trade andCommercial Register, Grand Duchy of Luxembourg under the R.C.S. Number: B-80 359. The address of theCompany is as follows: 1, rue du Fort Rheinsheim, L-2419 Luxembourg.
These consolidated financial statements have been approved by the Board of Directors for issue on June 24, 2010.
2. SUMMARY OF SIGNIFICANT ACCOUNTING POLICIES
The principal accounting policies applied in the preparation of these Consolidated Financial Statements are set outbelow. These policies have been consistently applied to all the years presented, unless otherwise stated.
2.1.Basis of preparation
The consolidated financial statements of the Group have been prepared in accordance with InternationalFinancial Reporting Standards (IFRS) which are similar, for operations conducted by the Group, to InternationalFinancial Reporting Standards as adopted by the European Union. IFRS are available in the internet site of theEuropean Committee as follows:
http://ec.europa.eu/internal_market/accounting/ias_en.htm
The consolidated financial statements have been prepared under the historical cost convention, as modified bythe revaluation of certain financial assets and financial liabilities (including derivatives instruments) at fair value.
The preparation of financial statements in conformity with IFRS requires the use of certain critical accountingestimates. It also requires management to exercise its judgment in the process of applying the Group’saccounting policies. Although these estimates are based on management’s best knowledge of current eventsand actions, actual results ultimately may differ from these estimates. The areas involving a higher degree ofjudgment or complexity, or areas where assumptions and estimates are significant to the consolidated financialstatements are disclosed in note 4.
68
NOTES TO THE CONSOLIDATED FINANCIAL STATEMENTS (CONTINUED)
2. SUMMARY OF SIGNIFICANT ACCOUNTING POLICIES (continued)
2.1.Basis of preparation (continued)
(a) Standards, amendments and interpretations published that are effective for the period ended on December31, 2009 and that are relevant for Group’s operations:
The following amendments have been published by IASB / IFRIC and approved by the European Union.They are mandatory for the Group’s accounting periods beginning on or after January 1, 2009 or laterperiods:
• IAS 1 (Revised), ‘Presentation of financial statements’ (effective for annual periods beginning on orafter January 1, 2009). The revised standard prohibits the presentation of items of income andexpenses (that is, ‘non-owner changes in equity’) in the statement of changes in equity, requiring ‘non-owner changes in equity’ to be presented separately from owner changes in equity. All non-ownerchanges in equity are required to be shown in the statement of comprehensive income. The Group haselected to present two statements: an income statement and a statement of comprehensive income.Where entities restate or reclassify comparative information, they are required to present a restatedbalance sheet at the beginning of the first comparative period in addition to the current requirement topresent balance sheets at the end of the current period and comparative period. These financialstatements have been restated for applying the amendment IAS 38 and therefore present a restatedbalance sheet as at April 1, 2006.
• IAS 38 (Amendment), ‘Intangible assets’ (effective for annual periods beginning on or after January 1,2009). For the Group, this amendment is effective for the first time for the fiscal year beginning on April1, 2009. According to this revised standard, a prepayment may only be recognised in the event thatpayment has been made in advance of obtaining right of access to goods or receipt of services. Thismeans that an expense is recognised for distribution and marketing promotional goods when theGroup has access to these goods and not when the goods are distributed to customers or used, aswas the Group’s accounting policy as at March 31, 2009 and before. The Group applied IAS 38(Amendment) from April 1, 2009 by writing-off the prepayments related to the promotional goods. Thenet of taxes impact as at April 1, 2008 amounted to 4,786,000, and has been recognized as adeduction of retained earnings. Those promotional goods that are to be sold to third parties have beenreclassified from Other current assets to Inventories.
• IFRS 8, ‘Operating segments’ (effective for annual periods beginning on or after January 1, 2009). IFRS8 replaces IAS 14 and aligns segment reporting with the requirements of the US standard SFAS 131,‘Disclosures about segments of an enterprise and related information’. The new standard requires a‘management approach’, under which segment information is presented on the same basis as is usedfor internal reporting purposes. The number of reportable segments, as well as the manner in whichthe segments are reported, have not materially changed as the former segment reporting wasconsistent with the internal reporting provided to the chief operating decision-maker. The chiefoperating decision maker has been identified as the President and the Chief Executive Officer thatmakes strategic decisions. There was no change in the allocation of goodwill that is still allocated bymanagement to groups of cash-generating units on a geographic segment level. Therefore IFRS 8 hasnot resulted in any goodwill impairment and there has been no further impact on the measurement ofthe Group’s assets and liabilities.

69
2. SUMMARY OF SIGNIFICANT ACCOUNTING POLICIES (continued)
2.1.Basis of preparation (continued)
(a) Standards, amendments and interpretations published that are effective for the year ended March 31, 2010and that are relevant for Group’s operations: (continued)
• IFRS 7 (Amendment), ‘Financial instruments: disclosure’ (effective for annual periods beginning on orafter January 1, 2009) related to financial instruments disclosure. The amendment requires enhanceddisclosures about fair value measurement and liquidity risk. In particular, it requires disclosure of fairvalue measurements by level of a fair value measurement hierarchy.
IASB also published the following standards and amendments that have been adopted by the EuropeanUnion and that have not a material impact on the Groups’ financial statements.
• IAS 8 (Amendment), ‘Accounting policies, changes in accounting estimates and errors’ (effective forannual periods beginning on or after January 1, 2009) related to the statute of application guides.
• IAS 19 (Amendment), ‘Employee benefits’ (effective for annual periods beginning on or after January 1,2009):
• The amendment clarifies that a plan amendment that results in a change in the extent to whichbenefit promises are affected by future salary increases is a curtailment, while an amendment thatchanges benefits attributable to past service gives rise to a negative past service cost if it results ina reduction in the present value of the defined benefit obligation.
• The definition of return on plan assets has been amended to state that plan administration costsare deducted in the calculation of return on plan assets only to the extent that such costs havebeen excluded from measurement of the defined benefit obligation.
• The distinction between short term and long term employee benefits will be based on whetherbenefits are due to be settled within or after 12 months of employee service being rendered.
• IAS 37, ‘Provisions, contingent liabilities and contingent assets’, requires contingent liabilities to bedisclosed, not recognised. IAS 19 has been amended to be consistent.
• IFRIC 14, ‘IAS 19 – The limit on a defined asset, minimum funding requirements and their interaction’(effective for annual periods beginning on or after January 1, 2009). The interpretation providesguidance on assessing the limit in IAS19 on the amount of the surplus that can be recognized as anasset. It also explains how the pension asset or liability may be affected by a statutory or contractualminimum funding requirement.
• IAS 23 (Revision), ‘Borrowing costs’ (effective for annual periods beginning on or after January 1,2009). It requires an entity to capitalize borrowing costs directly attributable to the acquisition,construction or production of a qualifying asset (one that takes a substantial period of time to getready for use or sale) as part of the cost of that asset. The option of immediately expensing thoseborrowing costs will be removed.
• IAS 23 (Amendment), ‘Borrowing costs’ (effective for annual periods beginning on or after January 1,2009). The definition of borrowing costs has been amended so that interest expense is calculatedusing the effective interest method defined in IAS 39 ‘Financial instruments: Recognition andmeasurement’. This eliminates the inconsistency of terms between IAS 39 and IAS 23.

70
NOTES TO THE CONSOLIDATED FINANCIAL STATEMENTS (CONTINUED)
2. SUMMARY OF SIGNIFICANT ACCOUNTING POLICIES (continued)
2.1.Basis of preparation (continued)
(a) Standards, amendments and interpretations published that are effective for the year ended March 31, 2010and that are relevant for Group’s operations: (continued)
• IAS 28 (Amendment), ‘Investments in associates’ (and consequential amendments to IAS 32, ‘FinancialInstruments: Presentation’ and IFRS 7, ‘Financial instruments: Disclosures’) (effective for annualperiods beginning on or after January 1, 2009). An investment in associate is treated as a single assetfor the purposes of impairment testing and any impairment loss is not allocated to specific assetsincluded within the investment, for example, goodwill. Reversals of impairment are recorded as anadjustment to the investment balance to the extent that the recoverable amount of the associateincreases.
• IAS 34 (Amendment), ‘Interim financial reporting’ (effective for annual periods beginning on or afterJanuary 1, 2009) related to the earning per share in the interim financial reporting.
• IAS 36 (Amendment), ‘Impairment of assets’ (effective for annual periods beginning on or after January1, 2009). Where fair value less costs to sell is calculated on the basis of discounted cash flows,disclosures equivalent to those for value-in-use calculation should be made.
• IAS 38 (Amendment), ‘Intangible assets’, (effective for annual periods beginning on or after January 1,2009). The amendment deletes the wording that states that there is ‘rarely, if ever’ support for use of amethod that results in a lower rate of amortisation than the straight line method.
• IFRS 2 (Amendment), ‘Share-based payment’ (effective for annual periods beginning on or afterJanuary 1, 2009). The amended standard deals with vesting conditions and cancellations. It clarifiesthat vesting conditions are service conditions and performance conditions only. Other features of ashare-based payment are not vesting conditions. As such these features would need to be included inthe grant date fair value for transactions with employees and others providing similar services, that is,these features would not impact the number of awards expected to vest or valuation thereofsubsequent to grant date. All cancellations, whether by the entity or by other parties, should receivethe same accounting treatment.
(b) Standard, amendments and interpretations published that are effective for the year ended March 31, 2010and that are not relevant for Group’s operations:
The following amendments and interpretations have been published by IASB / IFRIC and approved by theEuropean Union. They are mandatory for the Group’s accounting periods beginning on or after January 1,2009 or later periods but are not relevant for Group’s operations:
• IAS 1 (Amendment), ‘Presentation of financial statements’ (effective for annual periods beginning on orafter January 1, 2009) related to the presentation of financial assets and liabilities classified as held fortrading in accordance with IAS 39.
• IAS 10 (Amendment), ‘Events after the reporting period’ (effective for annual periods beginning on orafter January 1, 2009) related to the vote of dividends after the closing date.

71
2. SUMMARY OF SIGNIFICANT ACCOUNTING POLICIES (continued)
2.1.Basis of preparation (continued)
(b) Standard, amendments and interpretations published that are effective for the year ended March 31, 2010and that are not relevant for Group’s operations: (continued)
• IAS 16 (Amendment), ‘Property, plant and equipment’ (and consequential amendment to IAS 7,‘Statement of cash flows’) (effective for annual periods beginning on or after January 1, 2009). Entitieswhose ordinary activities comprise renting and subsequently selling assets present proceeds from thesale of those assets as revenue and should transfer the carrying amount of the asset to inventorieswhen the asset becomes held for- sale. A consequential amendment to IAS 7 states that cash flowsarising from purchase, rental and sale of those assets are classified as cash flows from operatingactivities.
• IAS 18 (Amendment), ‘Revenue’ (effective for annual periods beginning on or after January 1, 2009)and related amendments to IFRS 1 and IAS 27, related to the cost of investments in subsidiaries,jointly controlled entities and associates in the separate financial statements.
• IAS 20 (Amendment), ‘Accounting for government grants and disclosure of government assistance’(effective for annual periods beginning on or after January 1, 2009). The benefit of a below-market rategovernment loan is measured as the difference between the carrying amount in accordance with IAS39, ‘Financial instruments: Recognition and measurement’, and the proceeds received with the benefitaccounted for in accordance with IAS 20.
• IAS 27 (Amendment), ‘Consolidated and separate financial statements’ (effective for annual periodsbeginning on or after January 1, 2009). Where an investment in a subsidiary that is accounted for underIAS 39, ‘Financial instruments: recognition and measurement’ is classified as held for sale under IFRS5, ‘Non-current assets held for sale and discontinued operations’, IAS 39 would continue to beapplied.
• IFRS 1 (Amendment), ‘First time adoption of IFRS’ and IAS 27 ‘Consolidated and separate financialstatements’ (effective for annual periods beginning on or after January 1, 2009). The amendedstandard allows first-time adopters to use a deemed cost of either fair value or the carrying amountunder previous accounting practice to measure the initial cost of investments in subsidiaries, jointlycontrolled entities and associates in the separate financial statements. The amendment also removesthe definition of the cost method from IAS 27 and replaces it with a requirement to present dividendsas income in the separate financial statements of the investor.
• IAS 28 (Amendment), ‘Investments in associates’ (and consequential amendments to IAS 32, ‘FinancialInstruments: Presentation’ and IFRS 7, ‘Financial instruments: Disclosures’) (effective for annualperiods beginning on or after January 1, 2009). Where an investment in associate is accounted for inaccordance with IAS 39 ‘Financial instruments: recognition and measurement’ only certain, rather thanall disclosure requirements in IAS 28 need to be made in addition to disclosures required by IAS 32,‘Financial Instruments: Presentation’ and IFRS 7 ‘Financial Instruments: Disclosures’.
• IAS 29 (Amendment), ‘Financial reporting in hyperinflationary economies’ (effective for annual periodsbeginning on or after January 1, 2009). The guidance has been amended to reflect the fact that anumber of assets and liabilities are measured at fair value rather than historical cost.

72
NOTES TO THE CONSOLIDATED FINANCIAL STATEMENTS (CONTINUED)
2. SUMMARY OF SIGNIFICANT ACCOUNTING POLICIES (continued)
2.1.Basis of preparation (continued)
(b) Standard, amendments and interpretations published that are effective for the year ended March 31, 2010and that are not relevant for Group’s operations: (continued)
• IAS 31 (Amendment), ‘Interests in joint ventures (and consequential amendments to IAS 32 and IFRS 7)(effective for annual periods beginning on or after January 1, 2009). Where an investment in jointventure is accounted for in accordance with IAS 39, only certain rather than all disclosure requirementsin IAS 31 need to be made in addition to disclosures required by IAS 32, ‘Financial instruments:Presentation’ and IFRS 7 ‘Financial instruments: Disclosures’.
• IAS 32 (Amendment), ‘Financial instruments: Presentation’, and IAS 1 (Amendment), ‘Presentation offinancial statements’ – ‘Puttable financial instruments and obligations arising on liquidation’ (effectivefor annual periods beginning on or after January 1, 2009). The amended standards require entities toclassify puttable financial instruments and instruments, or components of instruments that impose onthe entity an obligation to deliver to another party a pro rata share of the net assets of the entity onlyon liquidation as equity, provided the financial instruments have particular features and meet specificconditions.
• IAS 39 (Amendment), ‘Financial instruments: Recognition and measurement (effective for annualperiods beginning on or after January 1, 2009):
• This amendment clarifies that it is possible for there to be movements into and out of the fair valuethrough profit or loss category where a derivative commences or ceases to qualify as a hedginginstrument in cash flow or net investment hedge;
• The definition of financial asset or financial liability at fair value through profit or loss as it relates toitems that are held for trading is also amended. This clarifies that a financial asset or liability that ispart of a portfolio of financial instruments managed together with evidence of an actual recentpattern of short-term profit-taking is included in such a portfolio on initial recognition;
• The current guidance on designating and documenting hedges states that a hedging instrumentneeds to involve a party external to the reporting entity and cites a segment as an example of areporting entity. This means that in order for hedge accounting to be applied at segment level, therequirements for hedge accounting are currently required to be met by the applicable segment.The amendment removes this requirement so that IAS 39 is consistent with IFRS 8, ‘Operatingsegments’ which requires disclosure for segments to be based on information reported to the chiefoperating decision maker;
• When remeasuring the carrying amount of a debt instrument on cessation of fair value hedgeaccounting, the amendment clarifies that a revised effective interest rate (calculated at the date fairvalue hedge accounting ceases) are used.
73
2. SUMMARY OF SIGNIFICANT ACCOUNTING POLICIES (continued)
2.1.Basis of preparation (continued)
(b) Standard, amendments and interpretations published that are effective for the year ended March 31, 2010and that are not relevant for Group’s operations: (continued)
• IAS 40 (Amendment), ‘Investment property’ (and consequential amendments to IAS 16) (effective forannual periods beginning on or after January 1, 2009). Property that is under construction ordevelopment for future use as investment property is within the scope of IAS 40. Where the fair valuemodel is applied, such property is, therefore, measured at fair value. However, where fair value ofinvestment property under construction is not reliably measurable, the property is measured at costuntil the earlier of the date construction is completed and the date at which fair value becomes reliablymeasurable.
• IAS 41 (Amendment), ‘Agriculture’ (effective for annual periods beginning on or after January 1, 2009).It requires the use of a market-based discount rate where fair value calculations are based ondiscounted cash flows and the removal of the prohibition on taking into account biologicaltransformation when calculating fair value.
• IFRIC 15, ‘Agreements for constructing of real estates’. (effective for annual periods beginning on orafter January 1, 2009). The interpretation clarifies whether IAS 18 or IAS 11 should be applied toparticular transactions.
(c) Standard, amendments and interpretations published that are not effective for the year ended March 31,2010 and that are relevant for Group’s operations:
The following new standards, amendments to standards and interpretations have been issued, but are noteffective for the period ended December 31, 2009 and have not been early adopted:
• IAS 17 (Amendment), ‘Leases” (effective for annual periods beginning on or after January 1, 2010)related to the classification of leases of land, so as to eliminate inconsistency with the generalguidance on lease classification.
• IAS 27 (Revised), ‘Consolidated and separate financial statements’ (effective for annual periodsbeginning on or after July 1, 2009).The revised standard requires the effects of all transactions withnon-controlling interests to be recorded in equity if there is no change in control and these transactionswill no longer result in goodwill or gains and losses. The standard also specifies the accounting whencontrol is lost. Any remaining interest in the entity is re-measured to fair value and a gain or loss isrecognised in profit or loss. The Group will apply IAS 27 (Revised) prospectively to transactions withnon-controlling interests from April 1, 2010.
• IFRS 3 (Revised), ‘Business combinations’ (effective for annual periods beginning on or after July 1,2009). The revised standard continues to apply the acquisition method to business combinations, withsome significant changes. For example, all payments to purchase a business are to be recorded at fairvalue at the acquisition date, with contingent payments classified as debt subsequently re-measuredthrough the income statement. There is a choice on an acquisition-by-acquisition basis to measure thenon-controlling interest in the acquiree either at fair vale or at the non-controlling interest’sproportionate share of the acquiree’s net assets. All acquisition-related costs should be expensed. TheGroup will apply IFRS 3 (Revised) prospectively to all business combinations from April1, 2010.
74
NOTES TO THE CONSOLIDATED FINANCIAL STATEMENTS (CONTINUED)
2. SUMMARY OF SIGNIFICANT ACCOUNTING POLICIES (continued)
2.1.Basis of preparation (continued)
(c) Standard, amendments and interpretations published that are not effective for the year ended March 31,2010 and that are relevant for Group’s operations: (continued)
• IAS 38 (Amendment), ‘Intangible assets’, (effective for annual periods beginning on or after January 1,2010) clarifies the description of valuation techniques commonly used by entities when measuring thefair value of intangible assets acquired in a business combination that are not traded in active markets.
• IAS 39 (Amendment), ‘Financial instruments: Recognition and measurement (effective for annualperiods beginning on or after January 1, 2010): the amendment clarifies that gains or losses should bereclassified from equity to profit or loss in the period in which the hedged forecast cash flow affectsprofit and loss.
• IFRIC 16, ‘Hedges of a net investment in a foreign operation’ (effective for annual periods beginning onor after October 1, 2008). The interpretation clarifies the accounting treatment in respect of netinvestment hedging. This includes the fact that net investment hedging relates to differences infunctional currency not presentation currency, and hedging instruments may be held anywhere in theGroup.
• IFRS 9, ‘Financial Instruments’. This is the first instalment of a 3 phased project to replace the existingstandard on financial instruments, IAS39. IFRS 9 deals with classification and measurement of financialassets. The standard is effective for annual periods beginning on or after January 1, 2013.
2.2.Principles of consolidation
The accounts of all companies included within the scope of consolidation are closed on March 31st.
(a) SubsidiariesSubsidiaries are all entities over which the Group has the power to govern the financial and operatingpolicies generally accompanying a shareholding of more than one half of the voting rights. The existenceand effect of potential voting rights that are currently exercisable or convertible are considered whenassessing whether the Group controls another entity. Subsidiaries are fully consolidated from the date onwhich control is transferred to the Group. They are de-consolidated from the date that control ceases.
The Group uses the purchase method of accounting to account for the acquisition of subsidiaries. The costof an acquisition is measured as the fair value of the assets given, equity instruments issued and liabilitiesincurred or assumed at the date of exchange, plus costs directly attributable to the acquisition. Identifiableassets acquired and liabilities and contingent liabilities assumed in a business combination are measuredinitially at their fair values at the acquisition date, irrespective of the extent of any minority interest. Theexcess of the cost of acquisition over the fair value of the Group’s share of the identifiable net assetsacquired is recorded as goodwill. If the cost of acquisition is less than the fair value of the net assets of thesubsidiary acquired, the difference is recognized directly in the statement of income.
Inter-company transactions, in particular the internal profits included in the inventories at the balance sheetdate, balances and unrealized gains on transactions between group companies are eliminated. If any,unrealized losses are also eliminated but considered as an impairment indicator of the asset transferred.
75
2. SUMMARY OF SIGNIFICANT ACCOUNTING POLICIES (continued)
2.2.Principles of consolidation (continued)
(a) Subsidiaries (continued)
Accounting policies of subsidiaries have been changed where necessary to ensure consistency with thepolicies adopted by the Group.
(b) Transactions with minority interestsThe Group applies a policy of treating transactions with minority interests as transactions with partiesexternal to the Group. Disposals of minority interests result in gains and losses for the Group that arerecorded in the statement of income. Purchases from minority interests result in goodwill, being thedifference between any consideration paid and the relevant share acquired of the carrying value of netassets of the subsidiary.
When the minority interests have the right to sell the remaining shares through a put option, a liability isrecognized for the put option. The liability is measured at present value of the redemption amount. Whenthe put option is written as part of a business combination and when control over the subsidiary isacquired, no minority interest is recognized in respect of the shares subject to the put option and thegoodwill arising on the business combination includes the goodwill related to the shares subject to the putoption.
Subsequently to the initial recognition, the changes in the financial liability are recorded as follows;
• The unwinding of discount is recorded in finance costs,
• If any, the change in estimates in the redemption amount is recorded against goodwill.
(c) AssociatesAssociates are all entities over which the Group has significant influence but not control, generallyaccompanying a shareholding of between 20% and 50% of the voting rights. Investments in associates areaccounted for using the equity method of accounting and are initially recognized at cost.
The Group’s investment in associates includes goodwill identified on acquisition, if any (net of anyimpairment loss).
The Group’s share of its associates’ post-acquisition profits or losses is recognized in the statement ofincome, and its share of post-acquisition movements in reserves is recognized in the Group’s reserves. Thecumulative post-acquisition movements are adjusted against the carrying amount of the investment. Whenthe Group’s share of losses in an associate equals or exceeds its interest in the associate, including anyother unsecured receivables, the Group does not recognize further losses, unless it has incurredobligations or made payments on behalf of the associate.
Unrealized gains on transactions between the Group and its associates are eliminated to the extent of theGroup’s interest in the associates. Unrealized losses are also eliminated unless the transaction providesevidence of an impairment of the asset transferred. Accounting policies of associates have been changedwhere necessary to ensure consistency with the policies adopted by the Group.
Dilution gains and losses arising in investments in associates are recognized in the statement of income.

76
NOTES TO THE CONSOLIDATED FINANCIAL STATEMENTS (CONTINUED)
2. SUMMARY OF SIGNIFICANT ACCOUNTING POLICIES (continued)
2.2.Principles of consolidation (continued)
(d) Interest in joint-venturesThe Group’s interests in jointly controlled entities are accounted for using the equity method of accountingand are initially recognized at cost.
2.3.Foreign currency translation
(a) Functional and presentation currencyItems included in the Consolidated Financial Statements of each of the Group’s entities are measuredusing the currency of the primary economic environment in which the entity operates (“the functionalcurrency”). The Consolidated Financial Statements are presented in euros.
(b) Transactions and balancesForeign currency transactions are translated into the functional currency using the exchange ratesprevailing at the dates of the transactions. The exchange rates prevailing at these dates are approximatedby a single rate per currency for each month (unless these rates are not reasonable approximations of thecumulative effect of the rates prevailing on the transaction dates). Foreign exchange gains and lossesresulting from the settlement of such transactions and from the translation at year-end exchange rates ofmonetary assets and liabilities denominated in foreign currencies are recognized in the statement ofincome under the line “Foreign currency gains / (losses)”, except when those monetary assets andliabilities are qualifying as cash flow hedges; they are then deferred in equity.
Foreign exchange gains and losses that relate to borrowings and cash and cash equivalents are presentedin the statement of income within “Finance costs-net”.
(c) Group companiesNone of the Group’s entities has the functional currency of a hyperinflationary economy. The results andfinancial position of all the Group entities that have a functional currency different from the presentationcurrency are translated into the presentation currency as follows:
i. Assets and liabilities for each balance sheet presented are translated at the closing rate at the date ofthat balance sheet;
ii. Income and expenses for each statement of income are translated at an estimated monthly averageexchange rate (unless this rate is not a reasonable approximation of the cumulative effect of the ratesprevailing on the transaction dates, in which case income and expenses are translated at the dates ofthe transactions); and
iii. All resulting exchange differences are recognized as a separate component of shareholders’ equitywithin “Cumulative currency translation differences”.

77
2. SUMMARY OF SIGNIFICANT ACCOUNTING POLICIES (continued)
2.3.Foreign currency translation (continued)
(c) Group companies (continued)
On consolidation, exchange differences arising from the translation of the net investment in foreignoperations including monetary items that form part of the reporting entity’s net investment in foreignentities, and of borrowings and other currency instruments designated as hedges of such investments, areincluded in “Cumulative currency translation differences” within shareholders’ equity. When a foreignoperation is sold, exchange differences that were recorded in equity are recognized in the statement ofincome as part of the gain or loss on sale.
Goodwill and fair value adjustments arising on the acquisition of a foreign entity are treated as assets andliabilities of the foreign entity and translated at the closing rate.
2.4.Segment reporting
Operating segments are reported in a manner consistent with the internal reporting provided to the chiefoperating decision-maker. The chief operating decision-maker, who is responsible for allocating resources andassessing performance of the operating segments, has been identified as the Chairman & Chief ExecutiveOfficer (CEO) and the Managing Director that make strategic decisions.
2.5.Intangible assets
(a) GoodwillGoodwill represents the excess of the cost of an acquisition over the fair value of the Company’s share ofthe net identifiable assets of the acquired subsidiary/associate at the date of acquisition. Goodwill onacquisitions of subsidiaries is presented on the Consolidated Balance Sheet under the line “Goodwill”.Goodwill on acquisitions of associates is included in investments in associates. Separately recognizedgoodwill is tested annually for impairment and carried at cost less impairment losses. Gains and losses onthe disposal of an entity include the carrying amount of goodwill relating to the entity sold.
Goodwill is allocated to cash-generating units for the purpose of impairment testing. The allocation is madeto those cash-generating units or groups of cash generating units that are expected to benefit from thebusiness combination in which the goodwill arose.
(b) Key moneysKey moneys are entry rights to be paid prior to starting up a store. When the key money is paid to theprevious tenant, it is classified within intangible assets and is amortized using the straight-line method overa period of 10 years (which is deemed to approximate the average lease term) or over the lease term ifshorter, and is tested for impairment at each balance sheet date, or whenever events or changes incircumstances indicate that the carrying value may not be recoverable.
In case the key money is paid to the landlord, then it is deemed to be linked to the rent and is classified asa prepaid expense (current and non current) and amortized on a straight-line basis over the rent period.
78
NOTES TO THE CONSOLIDATED FINANCIAL STATEMENTS (CONTINUED)
2. SUMMARY OF SIGNIFICANT ACCOUNTING POLICIES (continued)
2.5.Intangible assets (continued)
(c) Contractual customer relationshipThese assets result from business combinations when the Group, at the acquisition date, allocates the costof the business combination by recognizing the acquiree’s identifiable intangible assets that meet thedefinition of intangible assets and when the fair value can be measured reliably. The contractual customerrelationship is amortized using the straight-line method over the average period of the expectedrelationship with the client which usually ranges between 3 years and 5 years.
(d) TrademarksThese assets result from business combinations when the Group, at the acquisition date, allocates the costof the business combination by recognizing the acquiree’s identifiable intangible assets that meet thedefinition of intangible assets and when the fair value can be measured reliably. When the Group intends tosell products under the acquired trademarks and when there is no foreseeable limit to the period overwhich the trademarks are expected to generate net cash inflows for the Group, then it is considered thattrademarks have an indefinite useful life. Therefore, trademarks are not amortized but tested annually forimpairment.
Trademark is allocated to cash-generating units for the purpose of impairment testing. The allocation ismade to those cash-generating units or group of cash generating units that are expected to benefit fromthe trademark.
(e) Computer softwareAcquired computer software licenses are capitalized on the basis of the costs incurred to acquire and bringto use the specific software. These costs are amortized using the straight-line method over their estimateduseful lives (not exceeding 5 years).
Costs that are directly associated with the production of identifiable and unique software productscontrolled by the Group, and that will probably generate economic benefits exceeding costs beyond oneyear, are recognized as intangible assets. Directly attributable costs include the software developmentemployee costs and an appropriate portion of relevant overheads. These costs are amortized using thestraight-line method over their estimated useful lives (not exceeding 5 years).
Other development expenditures that do not meet these criteria are recognized as an expense as incurred.Development costs previously recognized as an expense are not recognized as an asset in a subsequentperiod.
(f) Development costsGiven the nature of the products developed and sold by the Group (products manufactured with naturalingredients), research and development costs for the products are non-significant and are expensed whenincurred.
79
2. SUMMARY OF SIGNIFICANT ACCOUNTING POLICIES (continued)
2.6.Property, Plant and Equipment
All property, plant and equipment (PP&E) are stated at historical cost less depreciation and impairment loss.Historical cost includes expenditure that is directly attributable to the acquisition of the items.
Subsequent costs are included in the asset’s carrying amount or recognized as a separate asset, asappropriate, only when it is probable that future economic benefits associated with the item will flow to theGroup and the cost of the item can be measured reliably. All other repairs and maintenance are charged to thestatement of income during the financial period in which they are incurred.
Land is not depreciated. Depreciation on other tangible assets is calculated using the straight-line method toallocate their cost to their residual values over their estimated useful lives, as follows:
• Buildings 20 years• Equipment and machinery between 5 and 10 years• Information system equipments and cash registers 3 years• Leasehold improvements 5 and 10 years• Furniture and office equipment 5 years
The assets’ residual values and useful lives are reviewed, and adjusted if appropriate, at each balance sheetdate. An asset’s carrying amount is written down immediately to its recoverable amount if the asset’s carryingamount is greater than its estimated recoverable amount (see note 2.7).
Gains and losses on sales are determined by comparing proceeds with the carrying amount. These areincluded in the statement of income under “Other (losses) / gains-net”.
The Group leases certain property, plant and equipment. Leases of property, plant and equipment where theGroup has all the substantial risks and rewards of ownership are classified as finance leases. Finance leasesare capitalized at the start of the lease at the lower of the fair value of the leased property and the present valueof the minimum lease payments. The corresponding rental obligations, net of finance charges, are included incurrent and non-current obligations under finance leases. The interest element of the finance cost is charged tothe statement of income over the lease period so as to produce a constant periodic rate of interest on theremaining balance of the liability for each period. The property, plant and equipment acquired under financeleases are depreciated over the shorter of the useful life of the asset or the lease term.
2.7.Impairment of non-financial assets
(a) Intangible assets (other than goodwill and trademarks) and property, plant and equipmentIntangible assets that are subject to amortization and property, plant and equipment are reviewed forimpairment whenever events or changes in circumstances indicate that the carrying amount may not berecoverable. An impairment loss is recognized for the amount by which the asset’s carrying amountexceeds its recoverable amount. The recoverable amount is the higher of an asset’s fair value less costs tosell and value in use. In assessing the value in use, the estimated future cash flows are discounted to theirpresent value using a discount rate that reflects current market assessment of the time value of money andthe risks specific to the asset for which the estimates of future cash flows have not been adjusted. Inassessing the fair value, an external valuation is obtained or management’s best estimate is used to theextent the assumptions used by management reflect market expectations.

80
NOTES TO THE CONSOLIDATED FINANCIAL STATEMENTS (CONTINUED)
2. SUMMARY OF SIGNIFICANT ACCOUNTING POLICIES (continued)
2.7.Impairment of non-financial assets (continued)
For the purposes of assessing impairment, assets are grouped at the lowest levels for which there areseparately identifiable cash inflows (cash-generating units: CGU):
• For testing the asset’s carrying amount of the stores (mainly: key moneys, architect / decorator costs,leasehold improvements, furniture), the cash-generating unit is the store.
• For the corporate assets where a reasonable and consistent basis of allocation can be identified,corporate assets are allocated to individual CGU, or otherwise they are allocated to the smallest groupof CGU for which a reasonable and consistent allocation basis can be identified.
Intangible assets (other than goodwill and trademarks) and property, plant and equipment that have beensubject to impairment in the previous period are reviewed for a possible reversal of the impairment at eachreporting date (notes 7, 8 and 9). Where an impairment loss subsequently reverses, the carrying amount ofthe asset (or cash generating unit) is increased to the revised estimate of its recoverable amount, but sothat the increased carrying amount does not exceed the carrying amount that would have been determinedhad no impairment loss been recognized for the asset (or cash generating unit) in prior years.
(b) Goodwill and trademarksGoodwill and trademarks are allocated to cash generating units either by operating segment or byoperating segment and by country. Cash generating units to which goodwill and trademarks have beenallocated are tested for impairment annually, or more frequently when there is an indication that the unitmay be impaired. If the recoverable amount of the cash generating unit is less than the carrying amount ofthe unit, an impairment loss is recognized. An impairment loss recognized for goodwill or trademarks is notreversed in a subsequent period.
2.8.Deposits
Deposits are recorded at their historical value. Impairment is recorded if the net present value is higher than theestimated recoverable amount. The impact for not discounting is not material.
A provision for impairment of deposits is established when there is objective evidence that the Group will notbe able to collect all amounts due according to the original terms of deposits.
2.9.Assets held for sale and assets directly associated with discontinued operations
Non current assets or disposal groups are classified as assets held for sale or directly associated withdiscontinued operations and stated at the lower of carrying amount and fair value less costs to sell if theircarrying amount is recovered principally through a sale transaction rather than through a continuing use.

81
2. SUMMARY OF SIGNIFICANT ACCOUNTING POLICIES (continued)
2.10.Inventories
Inventories are carried at the lower of cost or net realizable value (net realizable value is the estimated sellingprice in the ordinary course of business, less applicable variable selling expenses); with cost being determinedprincipally on the weighted average cost basis. The cost of inventories comprises the cost of raw materials,direct labour, depreciation of machines and production overheads (based on normal operating capacity). Itexcludes borrowing costs.
Inventories also include distribution and marketing promotional goods that are intended to be sold to thirdparties.
The Group regularly reviews inventory quantities on hand for excess inventory, discontinued products,obsolescence and declines in net realizable value below cost and records an allowance against the inventorybalance for such declines.
2.11.Trade receivables
Trade receivables are amounts due from customers for merchandise sold or services performed in the ordinarycourse of business. If collection is expected in one year or less, they are classified as current assets. If not, theyare presented as non-current assets.
Trade receivables are recognized initially at fair value and subsequently measured at amortized cost using theeffective interest method, less provision for impairment. A provision for impairment of trade receivables isestablished when there is objective evidence that the Group will not be able to collect all amounts dueaccording to the original terms of receivables. Significant financial difficulties of the debtor, probability that thedebtor will enter bankruptcy or financial reorganization, and default or delinquency in payments are consideredindicators that the trade receivable is impaired. The amount of the provision is the difference between theasset’s carrying amount and the present value of estimated future cash flows, discounted at the originaleffective interest rate. The carrying amount of the asset is reduced through the use of an allowance accountand the amount of the loss is recognized in the income statement within “Distribution expenses”. When a tradereceivable is uncollectible, it is written off against the allowance account for trade receivables. Subsequentrecoveries of amounts previously written off are credited against “Distribution expenses” in the statement ofincome.
2.12.Financial assets
Classification of financial assetsThe Group classifies its financial assets in the following categories: at fair value through profit and loss, loansand receivables and available-for-sale. The classification depends on the purpose for which the financial assetswere acquired. Management determines the classification of its financial assets at initial recognition.
(a) Financial assets at fair value through profit and loss
Financial assets at fair value through profit or loss are financial assets held for trading. A financial asset isclassified in this category if acquired principally for the purpose of selling in the short term. Derivatives areclassified as held for trading unless they are designated as hedges. Assets in this category are classified ascurrent assets.
82
NOTES TO THE CONSOLIDATED FINANCIAL STATEMENTS (CONTINUED)
2. SUMMARY OF SIGNIFICANT ACCOUNTING POLICIES (continued)
2.12.Financial assets (continued)
(b) Loans and receivables
Loans and receivables originating from the Group are non-derivative financial assets with fixed ordeterminable payments that are not quoted in an active market. They are included in current assets, exceptfor maturities greater than 12 months after the balance sheet date. These are classified as non-currentassets. The Group’s loans and receivables comprise “trade receivables” and “other current assets” in theconsolidated balance sheets.
(c) Available-for-sale financial assets
Available-for-sale financial assets are non-derivatives that are either designated in this category or notclassified in any of the other categories. They are included in non-current assets unless managementintends to dispose of the investment within 12 months of the balance sheet date.
Recognition and measurementRegular purchases and sales of financial assets are recognized on trade-date: the date on which the Groupcommits to purchase or sell the asset. Investments are initially recognized at fair value plus transaction costsfor all financial assets not carried at fair value through profit and loss. Financial assets carried at fair valuethrough profit and loss are initially recognized at fair value, and transaction costs are expensed in the incomestatement. Financial assets are derecognized when the rights to receive cash flows from the investments haveexpired or have been transferred and the Group has transferred substantially all risks and rewards ofownership. Available for-sale financial assets and financial assets at fair value through profit and loss aresubsequently carried at fair value. Loans and receivables are carried at amortized cost using the effectiveinterest method.
Gains or losses arising from changes in the fair value of the “Financial assets at fair value through profit andloss” category are presented in the statement of income within “Finance costs” for interest derivatives andwithin “Foreign currency gains / (losses)” for currency derivatives in the period in which they arise.
Changes in the fair value of monetary securities denominated in a foreign currency and classified as available-for-sale are analyzed between translation differences resulting from changes in amortized cost of the securityand other changes in the carrying amount of the security. The translation differences on monetary securities arerecognized in profit or loss, translation differences on non-monetary securities are recognised in othercomprehensive income. Changes in the fair value of monetary and non-monetary securities classified asavailable-for-sale are recognized in other comprehensive income.
When securities classified as available-for-sale are sold or impaired, the accumulated fair value adjustmentsrecognized in equity are included in the statement of income as “Other (losses) / gains - net”. Interest onavailable-for-sale securities calculated using the effective interest method is recognized in the statement ofincome. Dividends on available-for-sale equity instruments are recognised in the statement of income as part ofother income when the Group’s right to receive payments is established.
83
2. SUMMARY OF SIGNIFICANT ACCOUNTING POLICIES (continued)
2.12.Financial assets (continued)
Impairment of financial assetsThe Group assesses at each balance sheet date whether there is objective evidence that a financial asset or agroup of financial assets is impaired. In the case of equity securities classified as available for sale, a significantor prolonged decline in the fair value of the security below its cost is considered as an indicator that thesecurities are impaired. If any such evidence exists for available-for-sale financial assets, the cumulative loss -measured as the difference between the acquisition cost and the current fair value, less any impairment loss onthat financial asset previously recognized in profit or loss - is removed from equity and recognized in theincome statement. Impairment losses recognized in the income statement on equity instruments are notreversed through the income statement. Impairment testing of trade receivables is described in note 2.11.
2.13.Derivative financial instruments and hedging activities
Derivatives are initially recognized at fair value on the date a derivative contract is entered into and aresubsequently remeasured at their fair value. The method of recognising the resulting gain or loss depends onwhether the derivative is designated as a hedging instrument, and if so, the nature of the item being hedged.The Group designates certain derivatives as either:
• Hedges of the fair value of recognised assets or liabilities or a firm commitment (fair value hedge);
• Hedges of a particular risk associated with a recognised asset or liability or a highly probable forecasttransaction (cash flow hedge) ;or
• Hedges of a net investment in a foreign operation (net investment hedge).
The Group documents at the inception of the transaction the relationship between the hedging instruments andthe hedged items, as well as its risk management objectives and strategy for undertaking various hedgingtransactions. The Group also documents its assessment, both at hedge inception and on an ongoing basis, ofwhether the derivatives used in hedging transactions are highly effective in offsetting changes in fair values orcash flows of hedged items.
The fair value of the various derivative instruments used for hedging purposes is disclosed in note 16.Movements on the hedging reserve in shareholders’ equity are shown in the consolidated statement of changesin shareholders’ equity.
The full fair value of a hedging derivative is classified as a non-current asset or liability when the hedged item ismore than 12 months; it is classified as a current asset or liability when the maturity of the hedged item is lessthan 12 months. Trading derivatives are classified as a current asset or liability.
(a) Fair value hedge
Changes in the fair value of derivatives that are designated and qualify as fair value hedges are recorded inthe statement of income, together with any changes in the fair value of the hedged asset or liability that areattributable to the hedged risk.
The Group does not use fair value hedges.
84
NOTES TO THE CONSOLIDATED FINANCIAL STATEMENTS (CONTINUED)
2. SUMMARY OF SIGNIFICANT ACCOUNTING POLICIES (continued)
2.13.Derivative financial instruments and hedging activities (continued)
(b) Cash flow hedge
The effective portion of changes in the fair value of derivatives that are designated and qualify as cash flowhedges is recognized in other comprehensive income. The gain or loss relating to the ineffective portion isrecognized immediately in the statement of income within “Finance costs” for interest derivatives andwithin “Foreign currency gains / (losses)” for currency derivatives.
Amounts accumulated in equity are reclassified in the statement of income in the periods when the hedgeditem affects profit or loss (for example, when the forecast sale that is hedged takes place). The gain or lossrelating to the effective portion of interest rate swaps hedging variable rate borrowings is recognized in thestatement of income within ‘finance costs’. The gain or loss relating to the ineffective portion is recognizedin the statement of income within “Finance costs” for interest derivatives and within “Foreign currencygains / (losses)” for currency derivatives.
When a hedging instrument expires or is sold, or when a hedge no longer meets the criteria for hedgeaccounting, any cumulative gain or loss existing in equity at that time remains in equity and is recognizedwhen the forecast transaction is ultimately recognized in the statement of income. When a forecasttransaction is no longer expected to occur, the cumulative gain or loss that was reported in equity isimmediately transferred to the statement of income within “Finance costs” for interest derivatives andwithin “Foreign currency gains / (losses)” for currency derivatives.
(c) Net investment hedge
Hedges of net investments in foreign operations are accounted for similarly to cash flow hedges.
Any gain or loss on the hedging instrument relating to the effective portion of the hedge is recognised inother comprehensive income. The gain or loss relating to the ineffective portion is recognised immediatelyin the statement of income within “Foreign currency gains / (losses)”.
Gains and losses accumulated in equity are included in the statement of income when the foreignoperation is partially disposed of or sold.
The Group does not use net investment hedges.
(d) Derivatives at fair value through profit and loss
Certain derivative instruments do not qualify for hedge accounting. Changes in the fair value of thesederivative instruments are recognized immediately in the statement of income within ‘Finance costs – net”or “Foreign currency gains / (losses)”.
85
2. SUMMARY OF SIGNIFICANT ACCOUNTING POLICIES (continued)
2.14.Cash and cash equivalents
Cash and cash equivalents include cash in hand, short-term deposits and other short-term highly liquidinvestments with original maturities of three months or less.
Bank overdrafts are shown within borrowings in current liabilities on the balance sheet.
All significant cash deposits are made with major financial institutions having an investment grade rating andinvested in euro money market fixed term deposits or mutual funds that have a maturity of three months orless. The Group has temporary exposure to non-investment grade institutions on payments made bycustomers in certain countries, until the Group transfers such amounts to investment grade institutions.
2.15.Share capital
Ordinary shares are classified as equity. If any, mandatory redeemable preference shares are classified asliabilities.
Incremental costs directly attributable to the issuance of new shares or options are shown in equity as adeduction, net of tax, from the proceeds.
Where any Group’s entity purchases the Group’s equity share capital (treasury shares), the consideration paid,including any directly attributable incremental costs (net of income taxes) is deducted from equity attributableto the Group’s equity holders until the shares are cancelled or reissued. Where such shares are subsequentlyreissued, any consideration received, net of any directly attributable incremental transaction costs and therelated income tax effects, is included in equity attributable to the Group’s equity holders.
2.16.Dividend distribution
Dividend distribution to the Group’s shareholders is recognized as a liability in the Group’s financial statementsin the period in which the dividends are approved by the Group’s shareholders.
2.17.Trade payables
Trade payables are obligations to pay for goods or services that have been acquired in the ordinary course ofbusiness from suppliers. Accounts payable are classified as current liabilities if payment is due within one yearof less. If not, they are presented as non-current liabilities.
Trade payables are recognized initially at fair value and subsequently measured at amortized cost using theeffective interest method.

86
NOTES TO THE CONSOLIDATED FINANCIAL STATEMENTS (CONTINUED)
2. SUMMARY OF SIGNIFICANT ACCOUNTING POLICIES (continued)
2.18.Provisions
Provisions for customer and warranty claims, dismantling and restoring obligations, restructuring costs andlegal claims are recognized when:
— The Group has a present legal or constructive obligation as a result of past events;
— It is probable that an outflow of resources will be required to settle the obligation;
— And the amount has been reliably estimated.
If any, restructuring provisions comprise lease termination penalties and employee termination payments.Provisions are not recognized for future operating losses.
Provisions are measured at the present value of the best estimate of the expenditure expected to be required tosettle the obligation using a pre-tax rate that reflects current market assessment of the time value of moneyand the risks specific to the obligation. The increase in the provisions due to passage of time is recognized asinterest expense.
Provision for costs of dismantling and restoringWhen the lease agreement includes an obligation to restore the leased property into original condition at theend of the lease term or to compensate for dilapidation, a provision for the estimated discounted costs ofdismantling and restoring or settlement is recorded over the length of the lease.
Depending upon the nature of the obligation in the lease agreement, it may be considered that the alterationsoccurred when entering the lease. In this case the liability is immediately recorded at the inception of the leaseand the same amount is included in property, plant and equipment. This item is then depreciated over the leaseterm.
Provision for onerous contractsThe lease contracts used by the Group are mostly lease contracts for the stores. The store is the cashgenerating unit used for testing the asset’s carrying amount of the non-financial assets (note 2.7). Certainoperating lease contracts are onerous contracts when the unavoidable costs of meeting the obligations underthe contract exceed the economic benefits expected to be received from it. In this case, in addition to theimpairment loss recognised on the non-current assets dedicated to that contract, the present obligation isrecognised and measured as a provision.
87
2. SUMMARY OF SIGNIFICANT ACCOUNTING POLICIES (continued)
2.19.Employee benefits
(a) Pension obligationsThe Group operates various pension schemes under both defined benefits and defined contribution plans:
• A defined benefit plan is a pension plan that defines an amount of pension benefit that an employeewill receive on retirement, usually dependent on one or more factors such as age, years of service andcompensation;
• A defined contribution plan is a pension plan under which the Group pays fixed contributions into aseparate entity. In a defined contribution plan, the Group has no legal or constructive obligations topay further contributions if the fund does not hold sufficient assets to pay all employees the benefitsrelating to employee service in the current and prior periods.
Defined benefit plans
The only significant regime with defined benefits concerns the retirement indemnities in France. Theemployees receive a lump sum which varies according to the seniority and the other elements of thecollective agreement from which they depend.
The liability recognized in the balance sheet in respect of defined benefit pension plans is the present valueof the defined benefit obligation at the balance sheet date less the fair value of plan assets, together withadjustments for unrecognized actuarial gains or losses and past service costs. The defined benefitobligation is calculated annually using the projected unit credit method. The present value of the definedbenefit obligation is determined by discounting the estimated future cash outflows using interest rates ofhigh-quality corporate bonds that are denominated in the currency in which the benefits will be paid, andthat have terms to maturity approximating to the terms of the related pension liability.
Actuarial gains and losses arising from experience adjustments and changes in actuarial assumptions arecharged or credited to the statement of income in the period in which they arise.
Past-service costs are recognized immediately in income, unless the changes to the pension plan areconditional on the employees remaining in service for a specified period of time (the vesting period). In thiscase, the past-service costs are amortized on a straight-line basis over the vesting period.
Defined contribution plans
For defined contribution plans, the Group pays contributions to publicly or privately administered pensioninsurance plans on a mandatory, contractual or voluntary basis. The Group has no further paymentobligations once the contributions have been paid. The contributions are recognized as employee benefitexpense when they are due. Prepaid contributions are recognized as an asset to the extent that a cashrefund or a reduction in the future payments is available.
88
NOTES TO THE CONSOLIDATED FINANCIAL STATEMENTS (CONTINUED)
2. SUMMARY OF SIGNIFICANT ACCOUNTING POLICIES (continued)
2.19.Employee benefits (continued)
(b) Other post-employment obligationsThe Group does not provide any other post-employment obligations.
(c) Share-based compensationFollowing decisions approved on September 28, 2007, L’Occitane Groupe S.A., the parent of theCompany, operates a number of equity-settled, share-based compensation plans which are granted toemployees of the Group and its subsidiaries. The fair value of the employee services received in exchangefor the grant of the equity instruments is recognized as an expense. The expense is determined byreference to the fair value of the equity instruments at grant date, excluding the impact of any service andnon-market performance conditions if any. Service and non-market performance conditions are included inassumptions about the number of options that are expected to vest. The total amount expensed isrecognised over the vesting period, which is the period over which all of the specified vesting conditionsare to be satisfied. At each balance sheet date, the entity revises its estimates of the number of equityinstruments that are expected to vest based on the non-marketing vesting conditions. It recognizes theimpact of the revision to original estimates, if any, in the income statement, with a correspondingadjustment to equity (contribution from the parent).
The proceeds received net of any directly attributable transaction costs are credited to share capital(nominal value) and share premium when the equity instruments are exercised.
(d) Termination benefitsTermination benefits are payable when employment is terminated before the normal retirement date orwhenever an employee accepts voluntary redundancy in exchange for these benefits. The Grouprecognizes termination benefits when it is demonstrably committed to either: terminating the employmentof current employees according to a detailed formal plan without possibility of withdrawal; or providingtermination benefits as a result of an offer made to encourage voluntary redundancy. Benefits falling duemore than 12 months after the balance sheet date are discounted to present value.
(e) Profit-sharing and bonus plansThe Group recognizes a provision where legally, contractually obliged or where there is a past practice thathas created a constructive obligation.

89
2. SUMMARY OF SIGNIFICANT ACCOUNTING POLICIES (continued)
2.20.Borrowings and compound financial instruments
Borrowings are recognized initially at fair value, net of transaction costs incurred. Borrowings are subsequentlystated at amortized cost; any difference between the proceeds (net of transaction costs) and the redemptionvalue is recognized in the statement of income over the period of the borrowings using the effective interestmethod.
Fees paid on the establishment of loan facilities are recognised as transaction costs of the loan to the extentthat it is probable that some or all of the facility will be drawn down. In this case, the fee is deferred until thedrawn-down occurs. To the extent there is no evidence that it is probable that some or all of the facility will bedrawn down, the fee is capitalised as a pre-payment for liquidity services and amortised over the period offacility to which it relates.
On initial recognition the fair value of the liability portion of a convertible bond is the present value of thecontractually determined stream of future cash flows discounted using a market interest rate for an equivalentnon-convertible bond. This amount is recorded as a liability on an amortized cost basis until extinguished onconversion or maturity of the bonds. The remainder of the proceeds is allocated to the conversion option. Thisis recognized and included in shareholders’ equity, net of income tax if compliant with the definition of anequity instrument according to IAS 32. The issuer’s obligation to make scheduled payments of interest andprincipal is a financial liability that exists as long as the instrument is not converted. On conversion of aconvertible instrument at maturity, the entity derecognizes the liability component and recognizes it as equity.The original equity component remains as equity. There is no gain or loss on conversion at maturity.
Borrowings are classified as current liabilities unless the Group has an unconditional right to defer settlement ofthe liability for at least 12 months after the balance sheet date.
2.21.Revenue recognition
Revenue comprises the fair value of the consideration received or receivable for the sale of goods and servicesin the ordinary course of the Group’s activities. Revenue is shown net of value-added tax, returns, rebates anddiscounts and after eliminating sales within the Group. The Group recognized revenue when the amount ofrevenue can be reliably measured, it is probable that future economic benefits will flow to the entity and specificcriteria have been met for each of the Group’s activities as described below. The amount of revenue is notconsidered to be reliably measurable until all contingencies relating to the sale have been resolved. Revenuefrom product sales is recorded upon transfer of risks and rewards, insofar as all significant contractualobligations have been fulfilled and the collection of corresponding receivables is probable.
Revenue for sales invoiced when the transfer of risks and rewards has not occurred is deferred in the balancesheet under the “deferred revenue” line, in “other current liabilities”.

90
NOTES TO THE CONSOLIDATED FINANCIAL STATEMENTS (CONTINUED)
2. SUMMARY OF SIGNIFICANT ACCOUNTING POLICIES (continued)
2.21.Revenue recognition (continued)
Revenue is recognized as follows:
(a) Sales of goods – retail (sell-out business segment)Sales of goods are recognized when the Group sells a product to the customer at the store. Retail sales areusually in cash or by credit card. The recorded revenue is the gross amount of sale, including credit cardfees payable for the transaction. Such fees are included in distribution costs.
It is not the Group’s policy to sell its products to the end retail customer with a right of return. However, insome countries, the Group accepts returned products from customers and a refund is offer. In this case,the Group retains only an insignificant risk of ownership and the revenue is recognised at the time of salenet of a liability to cover the risk of return based on past experience. The liability is recognised as adecrease in net sales.
(b) Sales of goods – wholesale and distributors (sell-in and B to B business segments)Revenue from the sale of goods is recognized when all the following conditions are satisfied:
• The Group has transferred to the buyer the significant risks and rewards of ownership of the goods,
• The Group retains neither continuing managerial involvement to the degree usually associated withownership nor effective control over the goods sold,
• There is no unfulfilled obligation that could affect the wholesaler or the distributor’s acceptance,
• The amount of revenue can be measured reliably,
• It is probable that the economic benefits associated with the transaction will flow to the Group,
• The costs incurred or to be incurred in respect of the transaction can be measured reliably.
The products are sometimes sold with conditional discounts. Sales are recorded based on the pricespecified in the sales contracts / invoices, net of the estimated conditional discounts.
No element of financing is deemed present as the sales are made with a credit term of maximum 60 days.
(c) Sale of gift-certificatesIn some territories, in the ordinary course of the Group’s activities, the Group sells gift certificates. Therevenue is recognized when the customer redeems the gift certificates for buying goods (the product isdelivered to the customer).
As long as customers do not redeem these gift certificates, the revenue for sales is deferred in the balancesheet.
Gift certificates that exceed the validity period are recognized in the statement of income.
91
2. SUMMARY OF SIGNIFICANT ACCOUNTING POLICIES (continued)
2.21.Revenue recognition (continued)
(d) Loyalty programCustomer loyalty programs are used by the Group to provide customers with incentives to buy theirproducts. Each time a customer buys goods, or performs another qualifying act, the entity grants thecustomer award credits. The customer can redeem the award credits for awards such as free ordiscounted goods or services.
The programs operate in a variety of ways. Customers may be required to accumulate a specified minimumnumber or value of award credits before they are able to redeem them. Award credits may be linked toindividual purchases or groups of purchases, or to continued custom over a specified period of time.
The Group accounts for award credits as a separately identifiable component of the sales transaction(s) inwhich they are granted (the ‘initial sale’). The fair value of the consideration received or receivable inrespect of the initial sale is allocated between the components, i.e. the goods sold and the award creditsgranted.The allocation is made by reference to the relative fair values of the components, i.e. the amountsfor which each component could be sold separately.
The fair value of the award credits is estimated by reference to the discount that the customer would obtainwhen redeeming the award credits for goods. The nominal value of this discount is reduced to take intoaccount:
• any discount that would be offered to customers who have not earned award credits from an initialsale;
• the proportion of award credits that are expected to be forfeited by customers; and
• the time value of money.
The Group recognizes revenue in respect of the award credits in the periods, and reflecting the pattern, inwhich award credits are redeemed.The amount of revenue recognized is based on the number of awardcredits that have been redeemed relative to the total number expected to be redeemed.
(e) Consideration paid to distributorsIn some cases, the Group can enter into arrangements with distributors where payments are made tocompensate for certain promotional actions.
As such payments cannot usually be separated from the supply relationship, the Group recognises theconsideration paid as a deduction of revenue.
92
NOTES TO THE CONSOLIDATED FINANCIAL STATEMENTS (CONTINUED)
2. SUMMARY OF SIGNIFICANT ACCOUNTING POLICIES (continued)
2.22.Distribution expenses
The line “Distribution expenses” in the statement of income includes expenses relating to stores, mainly:employee benefits, rent and occupancy, depreciation and amortization, freight on sales, promotional goods,credit card fees, maintenance and repairs, telephone and postage, travel and entertainment, doubtfulreceivables, start-up costs and closing costs.
Distribution promotional goods include testers and bags and are expensed when the Group has access tothose items.
2.23.Marketing expenses
The line “Marketing expenses” in the statement of income includes mainly the following expenses: employeebenefits, advertising expenses and promotional goods.
Marketing promotional goods include press kits, gifts with purchases, samples, commercial brochures anddecoration items used to prepare the windows and are expensed when the Group has access to those items.
2.24.Accounting of rent expenses
Leases in which a significant portion of the risks and rewards of ownership are retained by the lessor areclassified as operating leases. Payments made under operating leases (net of any incentives received from thelessor) are charged to the statement of income on a straight-line basis over the period of the lease beginning atthe date when the lessee is entitled to exercise its right to use the leased asset.
Certain rents can be variable according to the turnover. In this case, the supplementary and variable part of therent is recorded in the period during which it becomes likely that the additional rent will be due.
Should the landlord grant free rent – in particular during the first months of the lease during the construction ofthe store – the free part is recognized on a straight-line basis over the remaining duration of the lease. Similarly,in the case of escalation clauses, lease payments are recognized as an expense on a straight-line basis.
2.25.Start-up and pre-opening costs of stores
Start-up costs and pre-opening costs of the stores are expensed when incurred under the line “Distributionexpenses” in the statement of income. These costs mainly include the following: broker and/or lawyer fees, rentpaid before the opening date, travel expenses relating to the opening team.
93
2. SUMMARY OF SIGNIFICANT ACCOUNTING POLICIES (continued)
2.26.Foreign currency gains / (losses)
The line “Foreign currency gains / (losses)” in the statement of income relates to:
• Foreign exchange gains and losses resulting from the settlement of foreign currency transactions and fromthe translation at year end exchange rates of monetary assets and liabilities denominated in foreigncurrencies (note 2.3 (b)). These foreign currency gains and losses are mainly related to the financing of thesubsidiaries;
• Gains or losses arising from changes in the fair value of the foreign exchange derivatives at fair valuethrough profit and loss (note 2.13 and note 14);
• Gains or losses arising from the ineffective portion of changes in the fair value of foreign exchangederivatives that are designated as hedging instruments (note 2.13 and note 14).
2.27.Income taxes
The tax expense for the period comprises current and deferred tax. Tax is recognized in the income statement,except to the extent that it relates to items recognized in other comprehensive income or directly in equity. Inthis case, the tax is also recognized in other comprehensive income or directly in equity, respectively.
The current income tax charge is calculated on the basis of the tax laws enacted or substantively enacted atthe balance sheet date in the countries where the Group’s subsidiaries and associates operate and generatetaxable income. Management periodically evaluates positions taken in tax returns with respect to situations inwhich applicable tax regulation is subject to interpretation and establishes provisions where appropriate on thebasis of amounts expected to be paid to the tax authorities.
Deferred income tax is recognised, using the liability method, on temporary differences arising between the taxbases of assets and liabilities and their carrying amounts in the Consolidated Financial Statements. However,the deferred income tax, if it is not accounted for, arises from initial recognition of an asset or liability in atransaction other than a business combination that at the time of the transaction affects neither accounting nortaxable profit or loss. Deferred income tax is determined using tax rates (and laws) that have been enacted orsubstantially enacted by the balance sheet date and are expected to apply when the related deferred incometax asset is realized or the deferred income tax liability is settled.
Deferred income tax assets are recognized only to the extent that it is probable that future taxable profit will beavailable against which the temporary differences can be utilized.
Deferred income tax is provided on temporary differences arising on investments in subsidiaries andassociates, except where the timing of the reversal of the temporary difference is controlled by the Group and itis probable that the temporary difference will not reverse in the foreseeable future.
Deferred income tax assets and liabilities are offset when there is a legally enforceable right to offset current taxasset against current tax liabilities and when the deferred income taxes assets and liabilities relate to incometaxes levied by the same taxation authority on either the taxable entity of different taxable entities where thereis an intention to settle the balances on a net basis.
94
NOTES TO THE CONSOLIDATED FINANCIAL STATEMENTS (CONTINUED)
2. SUMMARY OF SIGNIFICANT ACCOUNTING POLICIES (continued)
2.28.Earnings per share
Basic earnings per share are calculated by dividing the profit attributable to equity holders of the Group by theweighted average number of ordinary shares in issue during the year, excluding ordinary shares purchased bythe Group and held as treasury shares.
Diluted earnings per share are calculated by adjusting the weighted average number of ordinary sharesoutstanding to assume conversion of all dilutive potential ordinary shares. Anti-dilutive potential ordinary sharesare not considered in the calculation of the diluted earnings per share. Potential ordinary shares are anti-dilutivewhen the conversion in ordinary shares increases the earnings per share or decreases the net losses per share.The Group has two categories of dilutive potential ordinary shares: share options and free shares. For the shareoptions a calculation is made to determine the number of shares that could have been acquired at fair valuebased on the monetary value of the subscription rights attached to outstanding share options. The number ofshares calculated as above is compared with the number of shares that would have been issued assuming theexercise of the share options.
3. FINANCIAL RISK MANAGEMENT
3.1.Financial risk factors
The Group’s activities expose it to a variety of financial risks: market risk (including currency risk, fair valueinterest rate risk, cash flow interest rate risk and price risk), credit risk and liquidity risk. The Group’s overall riskmanagement program focuses on the unpredictability of financial markets and seeks to minimize potentialadverse effects on the Group’s financial performance. The Group uses derivative financial instruments to hedgecertain risk exposures.
(a) Market riskForeign exchange risk
The Group conducts its distribution activities worldwide. Sales made by the subsidiaries are denominatedin their local currency. The production sites are located in France and, consequently, a major part of thecosts of production or purchase is denominated in euros. The Group is thus exposed to foreign exchangerisk on its commercial transactions, whether known or forecasted.
The Group treasury’s risk management policy is to hedge a portion of its subsidiaries’ known or forecastedcommercial transactions not denominated in the presentation currency. The currency exposure must behedged gradually from a minimum hedging of 17% of the anticipated trade flow in foreign currency sevenmonths before the anticipated due date to a maximum total hedging (100%) two months before theanticipated due date. The main currencies hedged are the US Dollar, the Japanese Yen, the Sterling Poundand the Australian Dollar. The hedging policy is adjusted on a case by case basis based on marketconditions. In order to achieve this objective, the Group uses foreign currency derivative instruments whichare traded “over the counter” with major financial institutions.
When the foreign currency derivative instruments used to hedge the exposure of the Group’s foreigncurrency risk do not qualify for hedge accounting, as they do not formally satisfy the conditions of hedgeaccounting fixed by IAS 39, gains or losses arising from changes in the fair value of the instrument and ofthe hedged item are recorded within “Foreign currency gains / (losses)” in the statement of income.

95
3. FINANCIAL RISK MANAGEMENT (continued)
3.1.Financial risk factors (continued)
(a) Market risk (continued)
Foreign exchange risk (continued)
During the fiscal years 2010 and 2009 and on March 31, 2010 and 2009, if the euro had weakened /strengthened by 10% in comparison to the currencies listed below with all other variables held constant,equity, net sales and post-tax profit for the year would have been higher / lower as illustrated below:
Currency translation
In thousands of Euros differences (equity) Net sales Profit for the year
March 31, 2010 2009 2010 2009 2010 2009
USD 3,814 4,759 8,936 9,119 1,943 3,241
JPY 8,669 7,618 14,838 12,766 4,833 5,158
HKD 3,240 3,180 4,254 3,620 2,123 1,817
GBP 1,678 1,438 3,080 2,600 1,370 1,126
The above sensitivity does not take into consideration the effect of a higher / lower euro on the fair marketvalue of the foreign currency derivative instruments and on realized exchange gains and losses. The fairvalue of these derivatives at period end is not material.
Cash flow and fair value interest rate risk
As the Group has no significant interest-bearing assets, the Group’s income and operating cash flows aresubstantially independent of changes in market interest rates.
The Group’s interest rate risk arises from long-term borrowings. Borrowings issued at variable rates exposethe Group to cash flow interest rate risk. Borrowings issued at fixed rates expose the Group to fair valueinterest rate risk. The analysis of the borrowings by category of rate is provided in note 17.5.
The Group manages its cash flow interest rate risk by using floating-to-fixed interest rate swaps. Suchinterest rate swaps have the economic effect of converting borrowings from floating rates to fixed rates.Under the interest rate swaps, the Group agrees with other parties to exchange, at specified intervals, thedifferences between fixed contract rates and floating-rate interest amounts calculated by reference to theagreed notional amounts.
In accordance with debt covenants described in note 17.7, the interest rate of certain bank borrowings canbe re-priced.
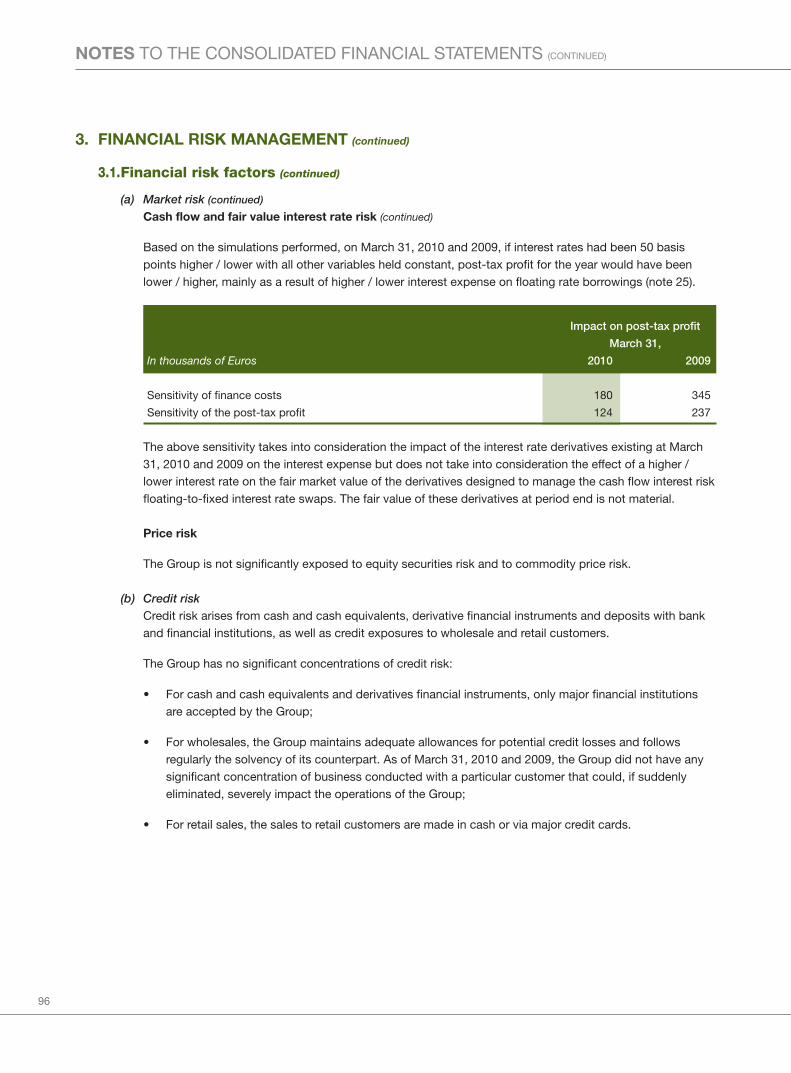
96
NOTES TO THE CONSOLIDATED FINANCIAL STATEMENTS (CONTINUED)
3. FINANCIAL RISK MANAGEMENT (continued)
3.1.Financial risk factors (continued)
(a) Market risk (continued)
Cash flow and fair value interest rate risk (continued)
Based on the simulations performed, on March 31, 2010 and 2009, if interest rates had been 50 basispoints higher / lower with all other variables held constant, post-tax profit for the year would have beenlower / higher, mainly as a result of higher / lower interest expense on floating rate borrowings (note 25).
Impact on post-tax profit
March 31,
In thousands of Euros 2010 2009
Sensitivity of finance costs 180 345
Sensitivity of the post-tax profit 124 237
The above sensitivity takes into consideration the impact of the interest rate derivatives existing at March31, 2010 and 2009 on the interest expense but does not take into consideration the effect of a higher /lower interest rate on the fair market value of the derivatives designed to manage the cash flow interest riskfloating-to-fixed interest rate swaps. The fair value of these derivatives at period end is not material.
Price risk
The Group is not significantly exposed to equity securities risk and to commodity price risk.
(b) Credit riskCredit risk arises from cash and cash equivalents, derivative financial instruments and deposits with bankand financial institutions, as well as credit exposures to wholesale and retail customers.
The Group has no significant concentrations of credit risk:
• For cash and cash equivalents and derivatives financial instruments, only major financial institutionsare accepted by the Group;
• For wholesales, the Group maintains adequate allowances for potential credit losses and followsregularly the solvency of its counterpart. As of March 31, 2010 and 2009, the Group did not have anysignificant concentration of business conducted with a particular customer that could, if suddenlyeliminated, severely impact the operations of the Group;
• For retail sales, the sales to retail customers are made in cash or via major credit cards.
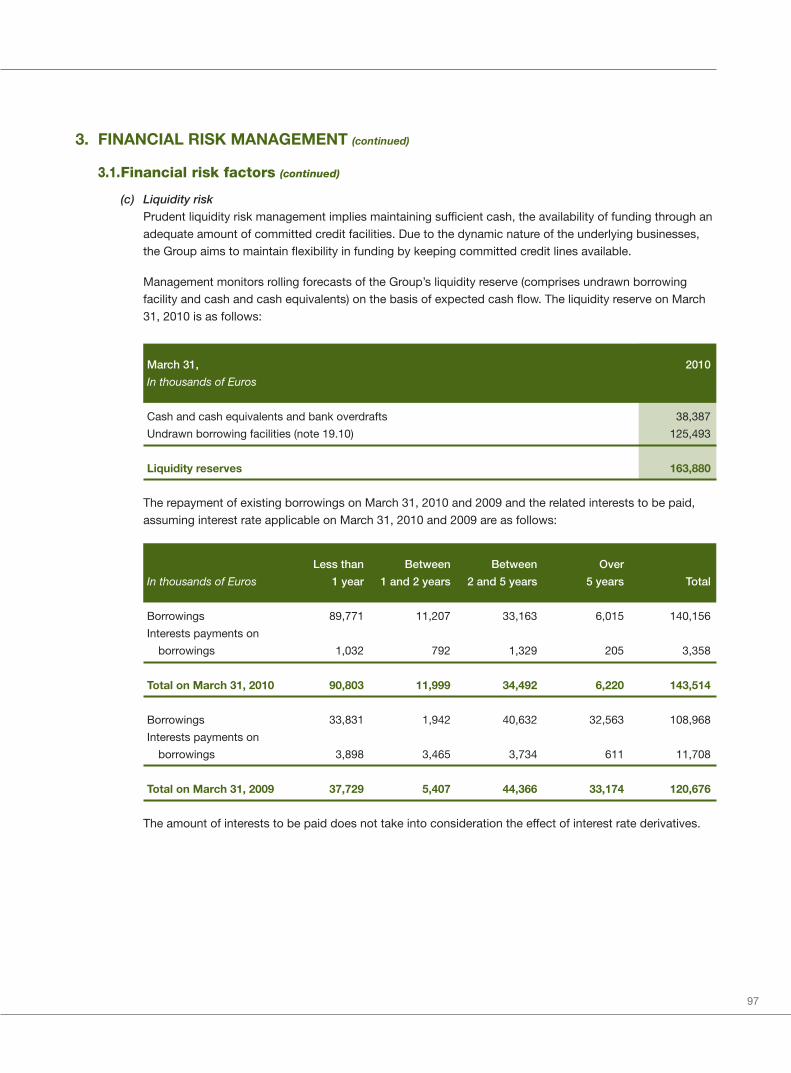
97
3. FINANCIAL RISK MANAGEMENT (continued)
3.1.Financial risk factors (continued)
(c) Liquidity riskPrudent liquidity risk management implies maintaining sufficient cash, the availability of funding through anadequate amount of committed credit facilities. Due to the dynamic nature of the underlying businesses,the Group aims to maintain flexibility in funding by keeping committed credit lines available.
Management monitors rolling forecasts of the Group’s liquidity reserve (comprises undrawn borrowingfacility and cash and cash equivalents) on the basis of expected cash flow. The liquidity reserve on March31, 2010 is as follows:
March 31, 2010
In thousands of Euros
Cash and cash equivalents and bank overdrafts 38,387
Undrawn borrowing facilities (note 19.10) 125,493
Liquidity reserves 163,880
The repayment of existing borrowings on March 31, 2010 and 2009 and the related interests to be paid,assuming interest rate applicable on March 31, 2010 and 2009 are as follows:
Less than Between Between Over
In thousands of Euros 1 year 1 and 2 years 2 and 5 years 5 years Total
Borrowings 89,771 11,207 33,163 6,015 140,156
Interests payments on
borrowings 1,032 792 1,329 205 3,358
Total on March 31, 2010 90,803 11,999 34,492 6,220 143,514
Borrowings 33,831 1,942 40,632 32,563 108,968
Interests payments on
borrowings 3,898 3,465 3,734 611 11,708
Total on March 31, 2009 37,729 5,407 44,366 33,174 120,676
The amount of interests to be paid does not take into consideration the effect of interest rate derivatives.

98
NOTES TO THE CONSOLIDATED FINANCIAL STATEMENTS (CONTINUED)
3. FINANCIAL RISK MANAGEMENT (continued)
3.2.Capital risk management
The Group’s objectives when managing capital are to safeguard the Group’s ability to continue as a goingconcern, so that it can continue to provide returns for shareholders and benefits for other stakeholders and tomaintain an optimal capital structure to reduce the cost of capital.
In order to maintain or adjust the capital structure, the Group may adjust the amount of dividends paid toshareholders, return capital to shareholders, issue new shares or sell assets to reduce debt.
3.3.Fair value estimation
Fair value of financial instrumentsThe table below presents the net book value and fair value of some of the Group’s financial instruments, withthe exception of cash, trade receivables, and trade payables as well as accrued expenses (their carrying valueless impairment provision of trade receivables and payables are assumed to approximate their fair values giventheir short maturities):
March 31,
2010 2009
Net book Net book
In thousands of Euros value Fair value value Fair value
Assets
Available-for-sale financial assets (a) 39 39 33 33
Other non-current receivables 18,435 18,435 17,181 17,181
Derivatives financial instruments (b) 94 94 2,644 2,644
Total assets 18,568 18,568 19,858 19,858
Liabilities
Non-current borrowings
Fixed rate — — — —
Floating rate 61,832 61,832 75,137 75,137
Total borrowings 61,832 61,832 75,137 75,137
Derivatives financial instruments (b) 3,010 3,010 2,104 2,104
Total liabilities 3,010 3,010 2,104 2,104
(a) Non-consolidated investments are not significant and are valuated as described in the note 2.12.
(b) The fair value of financial derivatives is determined as indicated below.
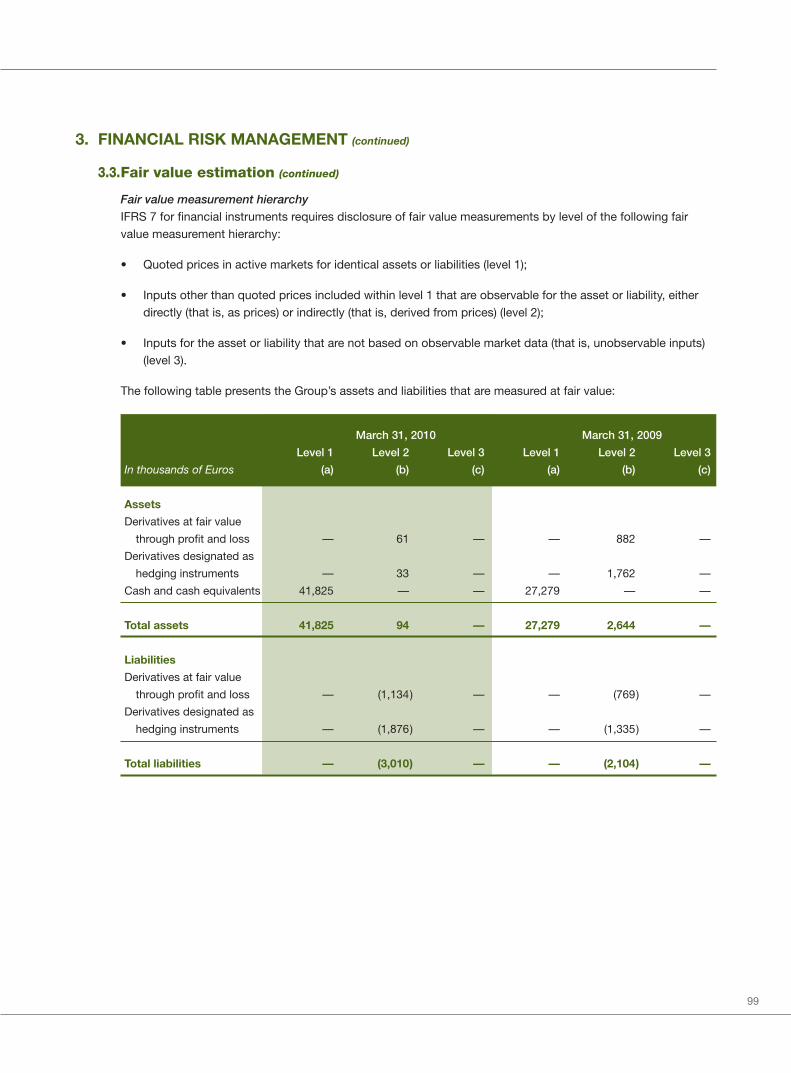
99
3. FINANCIAL RISK MANAGEMENT (continued)
3.3.Fair value estimation (continued)
Fair value measurement hierarchyIFRS 7 for financial instruments requires disclosure of fair value measurements by level of the following fairvalue measurement hierarchy:
• Quoted prices in active markets for identical assets or liabilities (level 1);
• Inputs other than quoted prices included within level 1 that are observable for the asset or liability, eitherdirectly (that is, as prices) or indirectly (that is, derived from prices) (level 2);
• Inputs for the asset or liability that are not based on observable market data (that is, unobservable inputs)(level 3).
The following table presents the Group’s assets and liabilities that are measured at fair value:
March 31, 2010 March 31, 2009
Level 1 Level 2 Level 3 Level 1 Level 2 Level 3
In thousands of Euros (a) (b) (c) (a) (b) (c)
Assets
Derivatives at fair value
through profit and loss — 61 — — 882 —
Derivatives designated as
hedging instruments — 33 — — 1,762 —
Cash and cash equivalents 41,825 — — 27,279 — —
Total assets 41,825 94 — 27,279 2,644 —
Liabilities
Derivatives at fair value
through profit and loss — (1,134) — — (769) —
Derivatives designated as
hedging instruments — (1,876) — — (1,335) —
Total liabilities — (3,010) — — (2,104) —
100
NOTES TO THE CONSOLIDATED FINANCIAL STATEMENTS (CONTINUED)
3. FINANCIAL RISK MANAGEMENT (continued)
3.3.Fair value estimation (continued)
Fair value measurement hierarchy (continued)
(a) The fair value of financial instruments traded in active markets (such as trading and available-for-salesecurities) is based on quoted market prices at the balance sheet date. A market is regarded as active ifquoted prices are readily and regularly available from an exchange, dealer, broker, industry group, pricingservice, or regulatory agency, and those prices represent actual and regularly occurring markettransactions on an arm’s length basis. The quoted market price used for financial assets held by the groupis the current bid price. These instruments are included in level 1.
(b) The fair value of financial instruments that are not traded in an active market (for example, overt-the-counter derivatives) is determined by external counterparties using methods and assumptions that arebased on market conditions existing at each balance sheet date. The fair value of interest rate swaps iscalculated as the present value of the estimated future cash flows. The fair value of forward foreignexchange contracts is determined using quoted forward exchange rates at the balance sheet date. If allsignificant inputs required to fair value an instrument are observable, the instrument is included in level 2.
(c) If one or more of the significant inputs is not based on observable market data, the instrument is includedin level 3.
101
4. CRITICAL ACCOUNTING ESTIMATES AND JUDGEMENTS
The preparation of Consolidated Financial Statements requires management to make certain estimates andassumptions that affect the reported amounts of assets and liabilities and disclosure of contingent assets andliabilities at the date of the Consolidated Financial Statements and the reported amounts of revenue and expensesduring the reporting period. Estimates are used for, but not limited to, depreciation, amortization and impairment(notes 2.5, 2.6 and 2.7) of non-current assets, allocation of the excess of the cost of an acquisition over the carryingvalue of the net assets acquired to key money (note 2.5) and to contractual customer relationship (note 2.5),valuation of inventories (note 2.10), depreciation of inventories (note 2.10), provisions (note 2.18), the provision forimpairment of trade receivables (note 2.11), revenue recognition (note 2.21), income taxes (note 2.27), fair value ofthe derivative instruments (note 2.13) and contingencies (note 28).
Estimates and judgments are continually evaluated and are based on historical experience and other factors,including expectations of future events that are believed to be reasonable under the circumstances. Actual resultscould differ from these estimates.
The Group makes estimates and assumptions concerning the future. The resulting accounting estimates will, bydefinition, seldom equal the related actual results. The estimates and assumptions that have a significant risk ofcausing a material adjustment to the carrying amounts of assets and liabilities within the next financial year arediscussed below.
4.1.Impairment test of non-current assets
Impairment test for intangible assets (including goodwill and trademarks), and property, plant and equipmentare performed in accordance with the accounting policy stated in note 2.7. The recoverable amounts of cash-generating units (CGU) have been determined on the basis of value-in-use calculations. These calculationsused cash flow projections approved by management.
The key assumptions used for value-in-use calculations are as follows:
• Forecasted sales are determined for each store based on its location. This may vary significantly from onelocation to another or from one country to another. Management determined budgeted net sales, grossmargin and operating cash flows based on past performance and its expectations of market developments;
• The terminal value is based on a long term growth rate of 1%;
• The pre-tax discount rate of 9.00% (9.27% in the fiscal year 2009). The same pre-tax discount rate hasbeen used for all the segments as;
o All the products are produced in France;
o Most of the financing is done centrally, and;
o The specific local market risks are embedded in the cash flows projections.
4.2.Depreciation and amortization periods
The main intangible and tangible assets of the Group relate to the stores. The amortization period of key moneyis based on 10 years which is deemed to approximate the average lease term or over the lease term of therelated store, if shorter and the depreciation period of tangible assets takes into consideration the expectedcommercial lives of the store or the lease term if shorter. These assets are tested for impairment in accordancewith the accounting policy stated in note 2.7.

102
NOTES TO THE CONSOLIDATED FINANCIAL STATEMENTS (CONTINUED)
4. CRITICAL ACCOUNTING ESTIMATES AND JUDGEMENTS (continued)
4.3.Allowance on inventories
The Group regularly reviews inventory quantities on hand for excess inventory, discontinued products,obsolescence and declines in net realizable value below cost and records an allowance against the inventorybalance for such declines.
When the annual inventory count takes place on a date different from the closing date, the quantity on hand isadjusted to take into account the shrinkage rate (after deduction of non-recurring differences) over the periodbetween the date of the stocktaking and the balance sheet date.
4.4.Legal claims
The estimates for provisions for litigation are based upon available information and advice of counsel and areregularly reviewed on this basis by management (see notes 20 and 28).
4.5.Income taxes
The Group is subject to income taxes in numerous jurisdictions. Significant judgment is required in determiningthe worldwide provision for income taxes. There are many transactions and calculations for which the ultimatetax determination is uncertain during the ordinary course of business. The Group recognizes liabilities foranticipated tax audit issues based on estimates of whether additional taxes will be due. Where the final taxoutcome of these matters is different from the amounts that were initially recorded, such differences will impactthe current and deferred income tax assets and liabilities in the period in which such a determination is made.
5. SEGMENT INFORMATION
The chief operating decision-maker has been identified as the Chairman & CEO and the Managing Director. Theyreview the Group’s internal reporting in order to assess performance and allocate resources. Management hasdetermined the operating segments based on these reports.
The Chairman & CEO and the Managing Director consider the business from both a channel and a geographicperspective. The Chairman & CEO and the Managing Director review the operating results of both sets ofcomponents and financial information is available for both, however the channels are the operating segments.
From a channel perspective, management assesses the performance of three operating segments, which are Sell-out, Sell-in and Business to Business:
• Sell-out comprises the sale of our products directly to the final customers. These sales are mainly done in theGroup’s stores and/or through the Group’s website;
• Sell-in comprises the sale of our products to an intermediate. These intermediates are mainly distributors,wholesalers, TV show channels and travel retailers. This segment also comprises sales of products tocorporate customers which will give them out as presents, for example to their customers or employees;
• Business to business (B to B) comprises the sale of the Group’s products to an intermediate who will providethem as free amenities to its final customers. These intermediates are mainly airline companies and hotels.
From a geographical perspective, management assesses the performance of the different countries.
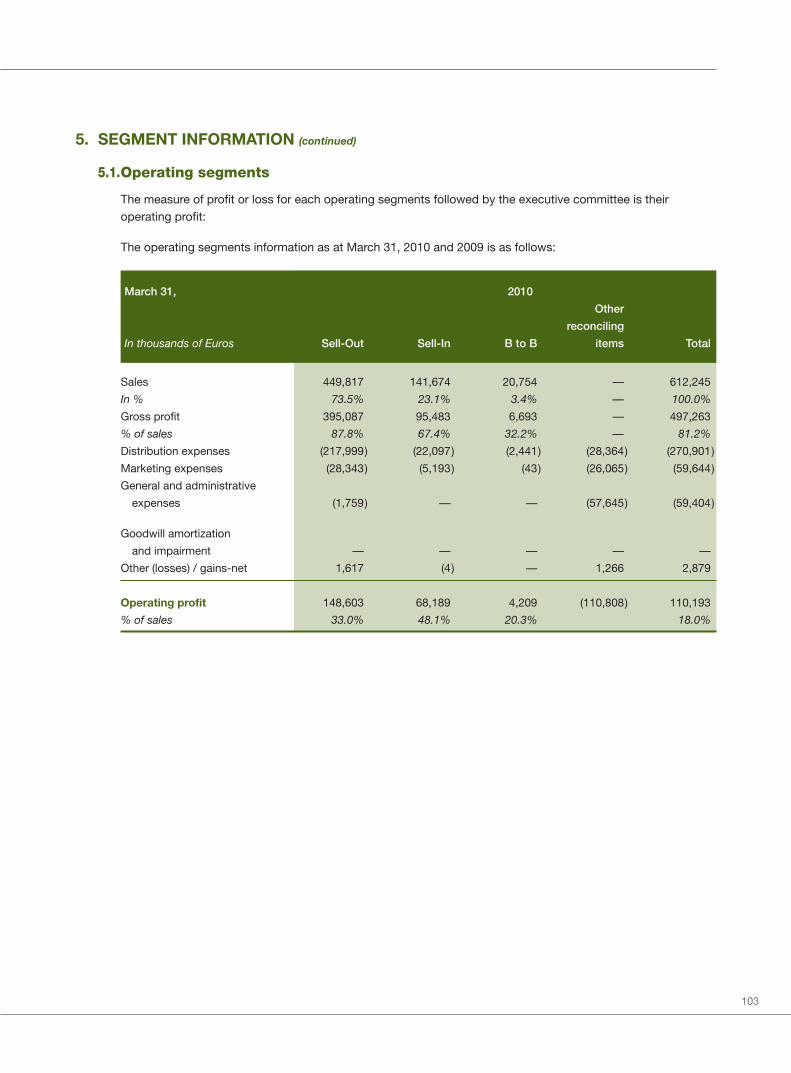
103
5. SEGMENT INFORMATION (continued)
5.1.Operating segments
The measure of profit or loss for each operating segments followed by the executive committee is theiroperating profit:
The operating segments information as at March 31, 2010 and 2009 is as follows:
March 31, 2010
Other
reconciling
In thousands of Euros Sell-Out Sell-In B to B items Total
Sales 449,817 141,674 20,754 — 612,245
In % 73.5% 23.1% 3.4% — 100.0%
Gross profit 395,087 95,483 6,693 — 497,263
% of sales 87.8% 67.4% 32.2% — 81.2%
Distribution expenses (217,999) (22,097) (2,441) (28,364) (270,901)
Marketing expenses (28,343) (5,193) (43) (26,065) (59,644)
General and administrative
expenses (1,759) — — (57,645) (59,404)
Goodwill amortization
and impairment — — — — —
Other (losses) / gains-net 1,617 (4) — 1,266 2,879
Operating profit 148,603 68,189 4,209 (110,808) 110,193
% of sales 33.0% 48.1% 20.3% 18.0%
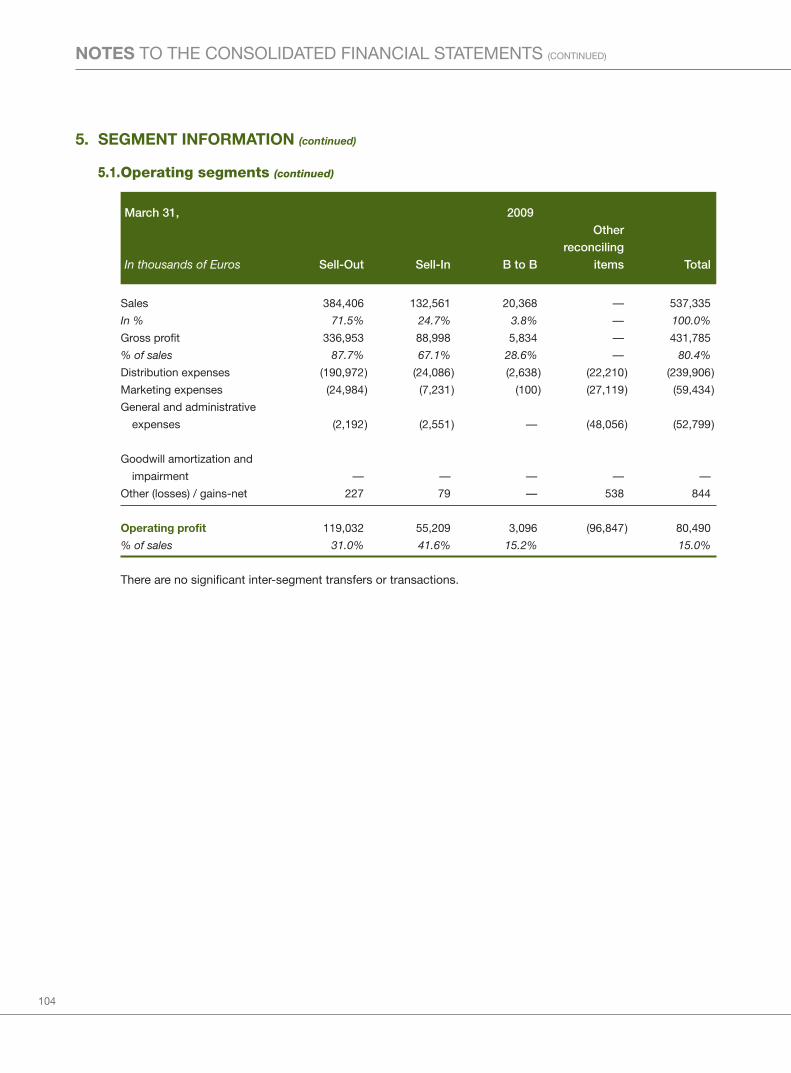
104
NOTES TO THE CONSOLIDATED FINANCIAL STATEMENTS (CONTINUED)
5. SEGMENT INFORMATION (continued)
5.1.Operating segments (continued)
March 31, 2009Other
reconcilingIn thousands of Euros Sell-Out Sell-In B to B items Total
Sales 384,406 132,561 20,368 — 537,335
In % 71.5% 24.7% 3.8% — 100.0%
Gross profit 336,953 88,998 5,834 — 431,785
% of sales 87.7% 67.1% 28.6% — 80.4%
Distribution expenses (190,972) (24,086) (2,638) (22,210) (239,906)
Marketing expenses (24,984) (7,231) (100) (27,119) (59,434)
General and administrative
expenses (2,192) (2,551) — (48,056) (52,799)
Goodwill amortization and
impairment — — — — —
Other (losses) / gains-net 227 79 — 538 844
Operating profit 119,032 55,209 3,096 (96,847) 80,490
% of sales 31.0% 41.6% 15.2% 15.0%
There are no significant inter-segment transfers or transactions.
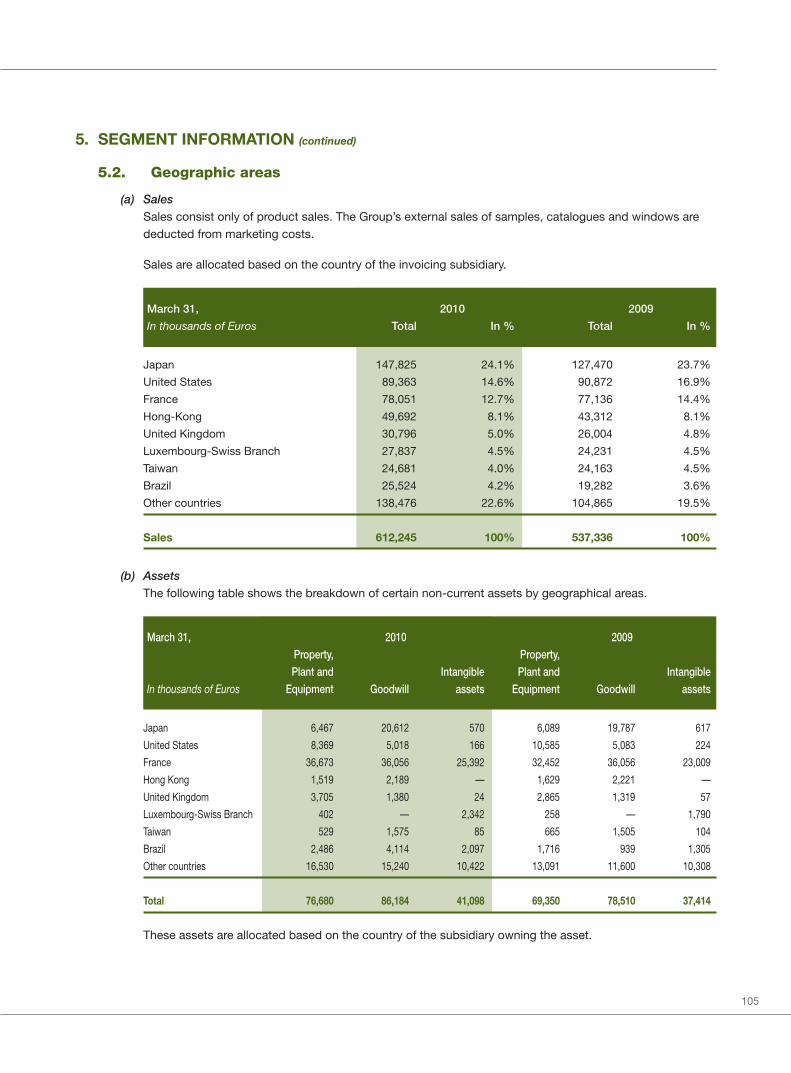
105
5. SEGMENT INFORMATION (continued)
5.2. Geographic areas
(a) SalesSales consist only of product sales. The Group’s external sales of samples, catalogues and windows arededucted from marketing costs.
Sales are allocated based on the country of the invoicing subsidiary.
March 31, 2010 2009
In thousands of Euros Total In % Total In %
Japan 147,825 24.1% 127,470 23.7%
United States 89,363 14.6% 90,872 16.9%
France 78,051 12.7% 77,136 14.4%
Hong-Kong 49,692 8.1% 43,312 8.1%
United Kingdom 30,796 5.0% 26,004 4.8%
Luxembourg-Swiss Branch 27,837 4.5% 24,231 4.5%
Taiwan 24,681 4.0% 24,163 4.5%
Brazil 25,524 4.2% 19,282 3.6%
Other countries 138,476 22.6% 104,865 19.5%
Sales 612,245 100% 537,336 100%
(b) AssetsThe following table shows the breakdown of certain non-current assets by geographical areas.
March 31, 2010 2009Property, Property,Plant and Intangible Plant and Intangible
In thousands of Euros Equipment Goodwill assets Equipment Goodwill assets
Japan 6,467 20,612 570 6,089 19,787 617
United States 8,369 5,018 166 10,585 5,083 224
France 36,673 36,056 25,392 32,452 36,056 23,009
Hong Kong 1,519 2,189 — 1,629 2,221 —
United Kingdom 3,705 1,380 24 2,865 1,319 57
Luxembourg-Swiss Branch 402 — 2,342 258 — 1,790
Taiwan 529 1,575 85 665 1,505 104
Brazil 2,486 4,114 2,097 1,716 939 1,305
Other countries 16,530 15,240 10,422 13,091 11,600 10,308
Total 76,680 86,184 41,098 69,350 78,510 37,414
These assets are allocated based on the country of the subsidiary owning the asset.
106
NOTES TO THE CONSOLIDATED FINANCIAL STATEMENTS (CONTINUED)
6. INFORMATION RELATING TO CHANGES IN THE GROUP STRUCTURE
6.1.For the year ended March 31, 2010
L’Occitane Do BrazilOn November 16, 2009, L’Occitane Holding Brazil LTDA, a fully owned subsidiary of L’Occitane InternationalSA, acquired the remaining minority interests in L’Occitane Do Brazil S/A for a consideration of €2,701,000 incash.
After this transaction, L’Occitane Do Brazil is now 100% held by the Group.
L’Occitane Canada Corp.On January 29, 2009, a new intermediary subsidiary, L’Occitane Canada Corp was created. On April 17, 2009,the Group has acquired through L’Occitane Canada Corp., from the Canadian agent, the net assets related toretail and wholesales activities in Canada. The objective of this acquisition is to strengthen the Group’s positionin North America. The purchase consideration amounted to €4,684,000.
The acquired business had contributed revenues of €5,393,000 and net profit of €(105,000) to the Group forthe period from the acquisition date to March 31, 2010.
6.2.For the year ended March 31, 2009
(a) Business combinations and acquisitions of minority interestsM&A Développement (France)On June 5, 2008, the Group signed a share purchase agreement for the purchase of 85% of M&ADéveloppement (M&A) for a purchase price of €46,750,000. The remaining 15% were held by BernardChevilliat. M&A is the holding company which holds 100% of its following subsidiaries: M&A Santé Beauté,Melvita and Ardecosm. M&A Group is located in Lagorce (Ardèche – South of France) and is specialized inmanufacturing and the distribution of organic cosmetic and hygiene products under the brand Melvita.
As at the same date, the Group obtained the right to purchase and Bernard Chevilliat obtained the right tosell the remaining 15% through a call, respectively put, option giving the Group the right to acquire, at anytime, respectively Bernard Chevilliat to sell these shares, during the option period or when certain triggeringevents occurred. The option period was the period starting from June 6, 2013. The valuation of optionshares was based on a formula deemed to approximate the fair value of the shares at the date oftransaction. Depending upon certain triggering events, the valuation can be adjusted downward.
In accordance with IAS 32, a liability was recognized for the put option. The liability was measured at thepresent value of the redemption amount (note 6.4). As the put option was written as part of a businesscombination when control over the subsidiary was acquired, no minority interest was recognized in respectof the shares subject to the put option and the goodwill arising on the business combination included thegoodwill related to the shares subject to the put option.

107
6. INFORMATION RELATING TO CHANGES IN THE GROUP STRUCTURE (continued)
6.2.For the year ended March 31, 2009 (continued)
(a) Business combinations and acquisitions of minority interests (continued)
M&A Développement (France) (continued)
Following an agreement with the minority shareholder dated November 21, 2008, L’Occitane Groupe S.A.,the parent company, has authorized on March 30, 2009, the issuance of 183,433 new shares in return ofthe contribution to the parent company by the minority shareholder Bernard Chevilliat of his shares in thecompany M&A Développement (M&A) for 15% of the capital. The shares issued by the parent company inexchange of the minority shareholdings were estimated at market value (€4,516,000). The market valuewas based on method of the multiple which consisted of comparing the Group with comparable listedcompanies operating in the same business or having a similar scheme of distribution network. These 15%of the shares in the company M&A Développement (M&A) were sold for an amount of €4,516,000 by theparent company to L’Occitane S.A., a 100% subsidiary of the Group (note 17.3). After the exchange, M&ADéveloppement (M&A) is now 100% held by the Group.
After the acquisition of the 15% remaining shares, the goodwill was adjusted downward for an amount of€3,930,000 to reflect the final consideration.
The acquired business had contributed revenues of €19,101,000 and net profit of €1,351,000 to the Groupfor the period from the acquisition date to March 31, 2009.
L’Occitane (China) limitedOn December 5, 2008, L’Occitane (Far East) Limited finalised the acquisition of 49% of the issued sharecapital of L’Occitane (China) limited from LS Holding Company Ltd, the minority shareholder. These shareswere paid through €684,000 in cash and 92,469 of the L’Occitane Groupe S.A.’s treasury shares. Thetreasury shares of the parent company were valued at market value (€2,271,000). The market value wasbased on method of the multiple which consisted of comparing the Group with comparable listedcompanies operating in the same business or having a similar scheme of distribution network. Because theminority interests have been partly paid by the parent to the vendor, this transaction resulted in theincrease of the financing from parent for the same amount of €2,271,000.
After this transaction, L’Occitane (China) Limited is now 100% held by the Group.
As indicated in note 19.4, on November 2, 2009 LS Holding Company Ltd has released and discharged theGroup from the obligation to repay a loan amounting to €686,000. This has been recorded as anadjustment to the consideration to purchase the minority interests and the goodwill was adjusteddownward accordingly (note 8.1).
108
NOTES TO THE CONSOLIDATED FINANCIAL STATEMENTS (CONTINUED)
6. INFORMATION RELATING TO CHANGES IN THE GROUP STRUCTURE (continued)
6.2.For the year ended March 31, 2009 (continued)
(a) Business combinations and acquisitions of minority interests (continued)
Urban Design Sp.z.o.o (Poland)On July 7, 2008, the Group acquired 100% of the issued share capital of Urban Design Sp.z.o.o (renamedL’Occitane Polska Sp.z.o.o.) for a total consideration of €1,773,000. L’Occitane Polska Sp.z.o.o is locatedin Warsaw, Poland and is specialized in the distribution of L’Occitane products in the territory of Poland.
The acquired business had contributed revenues of €1,495,000 and net loss of €94,000 to the Group forthe period from the acquisition date to March 31, 2009.
L’Occitane (Thailand) LimitedFollowing various arrangements signed in April and May 2008, the Group acquired 49% of the businessconducted by its agent distributing L’Occitane products in Thailand through the newly constitutedsubsidiary L’Occitane (Thailand) Limited. The transfer of risks and rewards was effective on June 30, 2008.The objective of this acquisition was to strengthen the Group’s position in this market. The purchaseconsideration for the transfer of 49% of the business had amounted to €409,000. The inventories and fixedassets necessary to run the business were acquired separately for €1,475,000. The remaining 51% inL’Occitane (Thailand) Limited are held by Harald Link and Nunthinee Sudhirak. In accordance with thesearrangements, the Group controls L’Occitane (Thailand) Limited.
As part of these arrangements, Harald Link and Nunthinee Sudhirak obtained the right to sell the remaining51% through a put option during the option period which starts three years after the completion of thesearrangements. The valuation of exercise price will be based on a mutually agreed price.
In accordance with IAS 32, a liability was recognized for the put option. The liability was measured at thepresent value of the redemption amount (note 6.6). As the put option was written as part of a businesscombination when control over the subsidiary was acquired, no minority interest was recognized in respectof the shares subject to the put option and the goodwill arising on the business combination included thegoodwill related to the shares subject to the put option.
The acquired business had contributed revenues of €3,551,000 and net loss of €119,000 to the Group forthe period from the acquisition date to March 31, 2009.
(b) DisposalsOliviers & Co Importaçao LtdaOn March 31, 2009, the Group disposed its investment in Oliviers & Co Importaçao Ltda for an amount of€114,000 and recorded a gain amounting to €46,000.
The disposed business had contributed revenues of €235,000 and net profit of €(15,000) to the Group forthe year ended March 31, 2009.
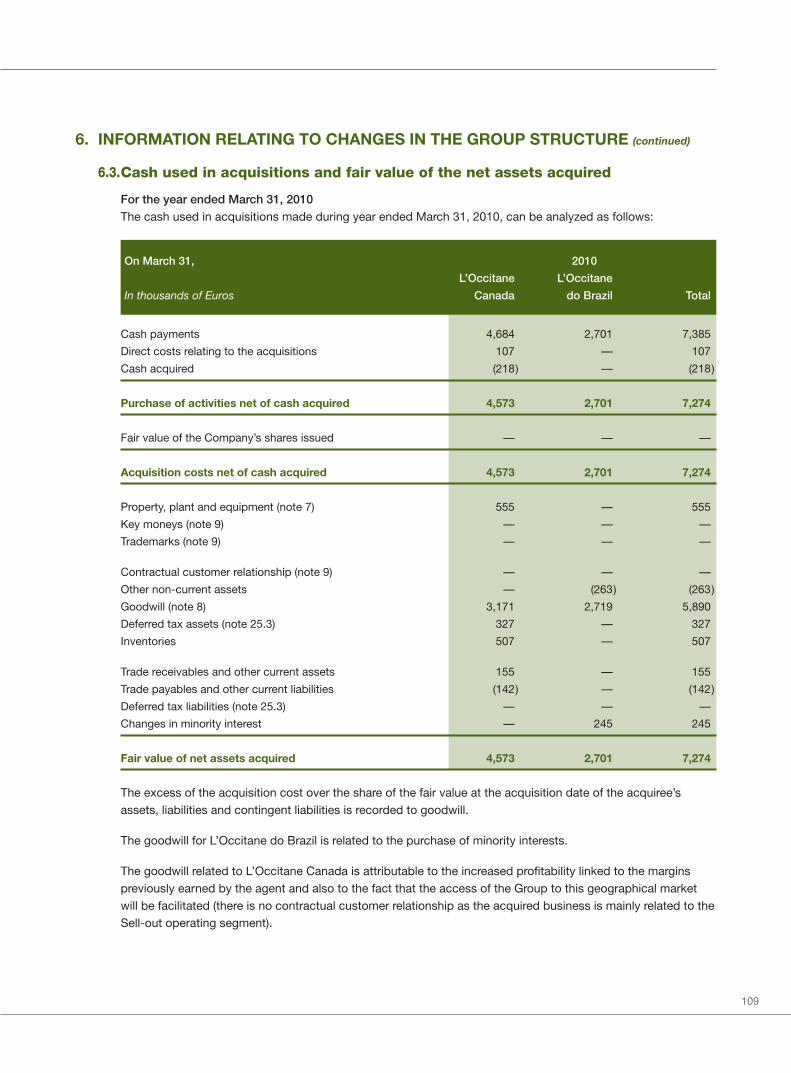
109
6. INFORMATION RELATING TO CHANGES IN THE GROUP STRUCTURE (continued)
6.3.Cash used in acquisitions and fair value of the net assets acquired
For the year ended March 31, 2010The cash used in acquisitions made during year ended March 31, 2010, can be analyzed as follows:
On March 31, 2010
L’Occitane L’Occitane
In thousands of Euros Canada do Brazil Total
Cash payments 4,684 2,701 7,385
Direct costs relating to the acquisitions 107 — 107
Cash acquired (218) — (218)
Purchase of activities net of cash acquired 4,573 2,701 7,274
Fair value of the Company’s shares issued — — —
Acquisition costs net of cash acquired 4,573 2,701 7,274
Property, plant and equipment (note 7) 555 — 555
Key moneys (note 9) — — —
Trademarks (note 9) — — —
Contractual customer relationship (note 9) — — —
Other non-current assets — (263) (263)
Goodwill (note 8) 3,171 2,719 5,890
Deferred tax assets (note 25.3) 327 — 327
Inventories 507 — 507
Trade receivables and other current assets 155 — 155
Trade payables and other current liabilities (142) — (142)
Deferred tax liabilities (note 25.3) — — —
Changes in minority interest — 245 245
Fair value of net assets acquired 4,573 2,701 7,274
The excess of the acquisition cost over the share of the fair value at the acquisition date of the acquiree’sassets, liabilities and contingent liabilities is recorded to goodwill.
The goodwill for L’Occitane do Brazil is related to the purchase of minority interests.
The goodwill related to L’Occitane Canada is attributable to the increased profitability linked to the marginspreviously earned by the agent and also to the fact that the access of the Group to this geographical marketwill be facilitated (there is no contractual customer relationship as the acquired business is mainly related to theSell-out operating segment).
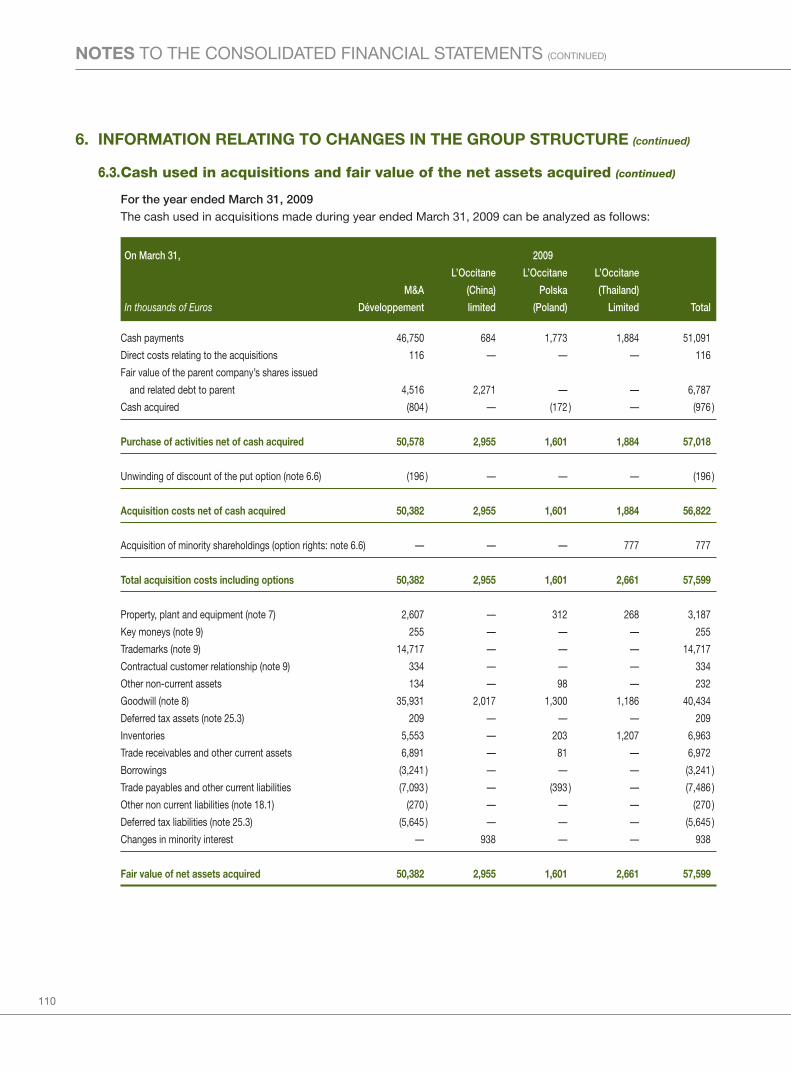
110
NOTES TO THE CONSOLIDATED FINANCIAL STATEMENTS (CONTINUED)
6. INFORMATION RELATING TO CHANGES IN THE GROUP STRUCTURE (continued)
6.3.Cash used in acquisitions and fair value of the net assets acquired (continued)
For the year ended March 31, 2009The cash used in acquisitions made during year ended March 31, 2009 can be analyzed as follows:
On March 31, 2009
L’Occitane L’Occitane L’Occitane
M&A (China) Polska (Thailand)
In thousands of Euros Développement limited (Poland) Limited Total
Cash payments 46,750 684 1,773 1,884 51,091
Direct costs relating to the acquisitions 116 — — — 116
Fair value of the parent company’s shares issued
and related debt to parent 4,516 2,271 — — 6,787
Cash acquired (804 ) — (172 ) — (976 )
Purchase of activities net of cash acquired 50,578 2,955 1,601 1,884 57,018
Unwinding of discount of the put option (note 6.6) (196 ) — — — (196 )
Acquisition costs net of cash acquired 50,382 2,955 1,601 1,884 56,822
Acquisition of minority shareholdings (option rights: note 6.6) — — — 777 777
Total acquisition costs including options 50,382 2,955 1,601 2,661 57,599
Property, plant and equipment (note 7) 2,607 — 312 268 3,187
Key moneys (note 9) 255 — — — 255
Trademarks (note 9) 14,717 — — — 14,717
Contractual customer relationship (note 9) 334 — — — 334
Other non-current assets 134 — 98 — 232
Goodwill (note 8) 35,931 2,017 1,300 1,186 40,434
Deferred tax assets (note 25.3) 209 — — — 209
Inventories 5,553 — 203 1,207 6,963
Trade receivables and other current assets 6,891 — 81 — 6,972
Borrowings (3,241 ) — — — (3,241 )
Trade payables and other current liabilities (7,093 ) — (393 ) — (7,486 )
Other non current liabilities (note 18.1) (270 ) — — — (270 )
Deferred tax liabilities (note 25.3) (5,645 ) — — — (5,645 )
Changes in minority interest — 938 — — 938
Fair value of net assets acquired 50,382 2,955 1,601 2,661 57,599
111
6. INFORMATION RELATING TO CHANGES IN THE GROUP STRUCTURE (continued)
6.3.Cash used in acquisitions and fair value of the net assets acquired (continued)
For the year ended March 31, 2009 (continued)
The excess of the acquisition cost over the share of the fair value at the acquisition date of the acquiree’sassets, liabilities and contingent liabilities is recorded to goodwill. The main differences between the fair valueof assets and liabilities and the corresponding acquiree’s carrying amount are related to the trademarks and thekey moneys and to the related deferred tax liabilities.
The goodwill related to M&A was attributable to the fact that it will accelerate and facilitate the access of theGroup to the organic cosmetic and hygiene markets. A portion of the goodwill is also attributable to synergieswith the Group.
The goodwill related to L’Occitane (China) Limited related to the purchase of the minority shares in thissubsidiary.
The goodwill related to L’Occitane (Thailand) Limited and L’Occitane Polska Sp.z.o.o (Poland) was attributableto the increased profitability linked to the margins previously earned by the agent and also to the fact that theaccess of the Group to these geographical markets will be facilitated.

112
NOTES TO THE CONSOLIDATED FINANCIAL STATEMENTS (CONTINUED)
6. INFORMATION RELATING TO CHANGES IN THE GROUP STRUCTURE (continued)
6.4.Other financial liabilities
For the year ended March 31, 2010The following put options have been granted by the Group to the minority shareholders:
Exercise of
Change in the option/
Grant of Unwinding estimates in the purchase of
puttable of discount valuation of the minority March 31,
In thousands of Euros March 31, 2009 instruments (note 23) exercice price interests 2010
Anton Luybimov
(L’Occitane Russia) 4,339 — 313 — — 4,652
Harald Link and Nunthinee
Sudhirak (L’Occitane Thailand) 806 — 46 — — 852
Total put options 5,145 — 359 — — 5,504
For the year ended March 31, 2009
The following put options have been granted by the Group to the minority shareholders:
Exercise of
Change in the option/
Grant of Unwinding estimates in the purchase of
puttable of discount valuation of the minority March 31,
In thousands of Euros March 31, 2008 instruments (note 23) exercice price interests 2009
Anton Luybimov
(L’Occitane Russia) 3,969 — 370 — — 4,339
Bernard Chevilliat
(M&A Développement) — 8,250 196 (3,930 ) (4,516 ) —
Harald Link and Nunthinee
Sudhirak (L’Occitane Thailand) — 777 29 — — 806
Total put options 3,969 9,027 595 (3,930) (4,516) 5,145
The unwinding of discount is recognised as finance costs in the statement of income (note 25).
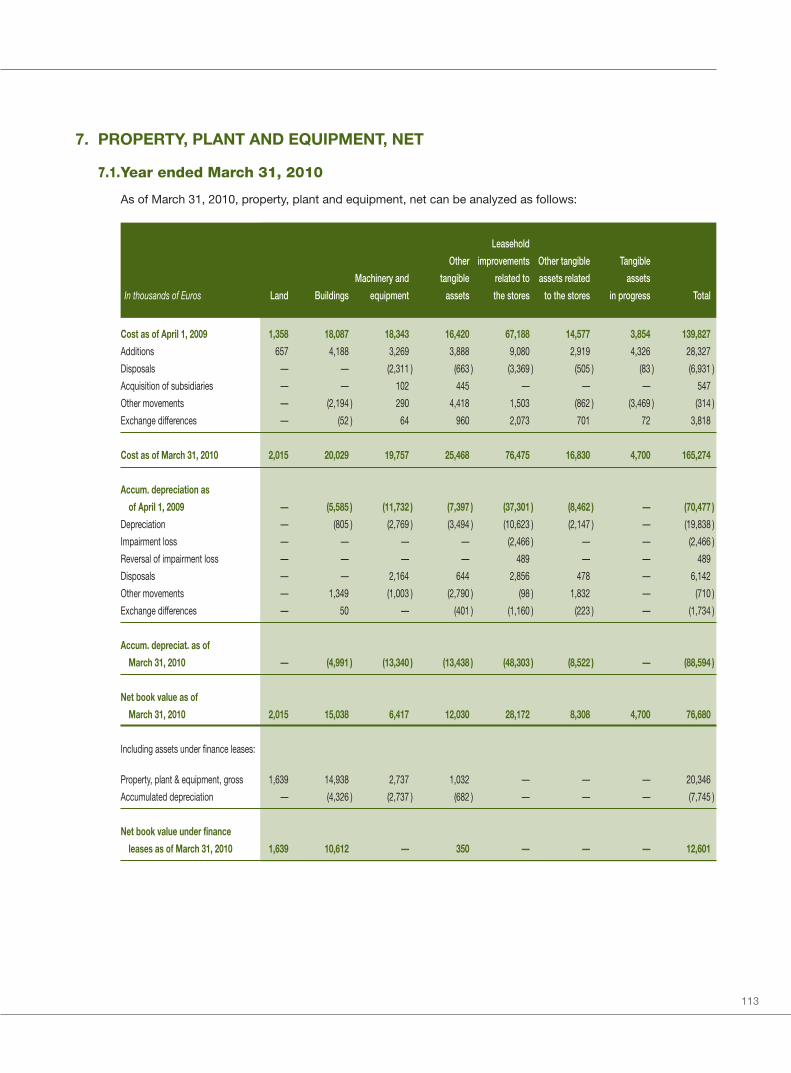
113
7. PROPERTY, PLANT AND EQUIPMENT, NET
7.1.Year ended March 31, 2010
As of March 31, 2010, property, plant and equipment, net can be analyzed as follows:
Leasehold
Other improvements Other tangible Tangible
Machinery and tangible related to assets related assets
In thousands of Euros Land Buildings equipment assets the stores to the stores in progress Total
Cost as of April 1, 2009 1,358 18,087 18,343 16,420 67,188 14,577 3,854 139,827
Additions 657 4,188 3,269 3,888 9,080 2,919 4,326 28,327
Disposals — — (2,311 ) (663 ) (3,369 ) (505 ) (83 ) (6,931 )
Acquisition of subsidiaries — — 102 445 — — — 547
Other movements — (2,194 ) 290 4,418 1,503 (862 ) (3,469 ) (314 )
Exchange differences — (52 ) 64 960 2,073 701 72 3,818
Cost as of March 31, 2010 2,015 20,029 19,757 25,468 76,475 16,830 4,700 165,274
Accum. depreciation as
of April 1, 2009 — (5,585 ) (11,732 ) (7,397 ) (37,301 ) (8,462 ) — (70,477 )
Depreciation — (805 ) (2,769 ) (3,494 ) (10,623 ) (2,147 ) — (19,838 )
Impairment loss — — — — (2,466 ) — — (2,466 )
Reversal of impairment loss — — — — 489 — — 489
Disposals — — 2,164 644 2,856 478 — 6,142
Other movements — 1,349 (1,003 ) (2,790 ) (98 ) 1,832 — (710 )
Exchange differences — 50 — (401 ) (1,160 ) (223 ) — (1,734 )
Accum. depreciat. as of
March 31, 2010 — (4,991 ) (13,340 ) (13,438 ) (48,303 ) (8,522 ) — (88,594 )
Net book value as of
March 31, 2010 2,015 15,038 6,417 12,030 28,172 8,308 4,700 76,680
Including assets under finance leases:
Property, plant & equipment, gross 1,639 14,938 2,737 1,032 — — — 20,346
Accumulated depreciation — (4,326 ) (2,737 ) (682 ) — — — (7,745 )
Net book value under finance
leases as of March 31, 2010 1,639 10,612 — 350 — — — 12,601

114
NOTES TO THE CONSOLIDATED FINANCIAL STATEMENTS (CONTINUED)
7. PROPERTY, PLANT AND EQUIPMENT, NET (continued)
7.1.Year ended March 31, 2010 (continued)
Main additions during the period related to leasehold improvements for the opening of 110 stores.
On March 30, 2010, the Company signed a finance lease agreement in connection with (i) the acquisition of theexisting land and building of Melvita for an amount of €4,934,000 and (ii) the extension and restructuring of theplant for an amount of €9,066,000. As at March 31, 2010, the finance lease was drawn for an amount of€4,934,000 in connection with the acquisition of the land, buildings and other tangible assets related to theplant in Lagorce.
The additions in Other tangible assets related to the stores include the costs for dismantling and restoring thatare recorded at the inception of the lease and that amount to €423,000. This component is subsequentlydepreciated over the lease term (note 2.18 and 18.3). Excluding these costs of dismantling and restoring andthe acquisitions under finance lease that are non cash items, total additions amount to €22,795,000.
The addition in Land is related to the extension of the plant in Lagorce.
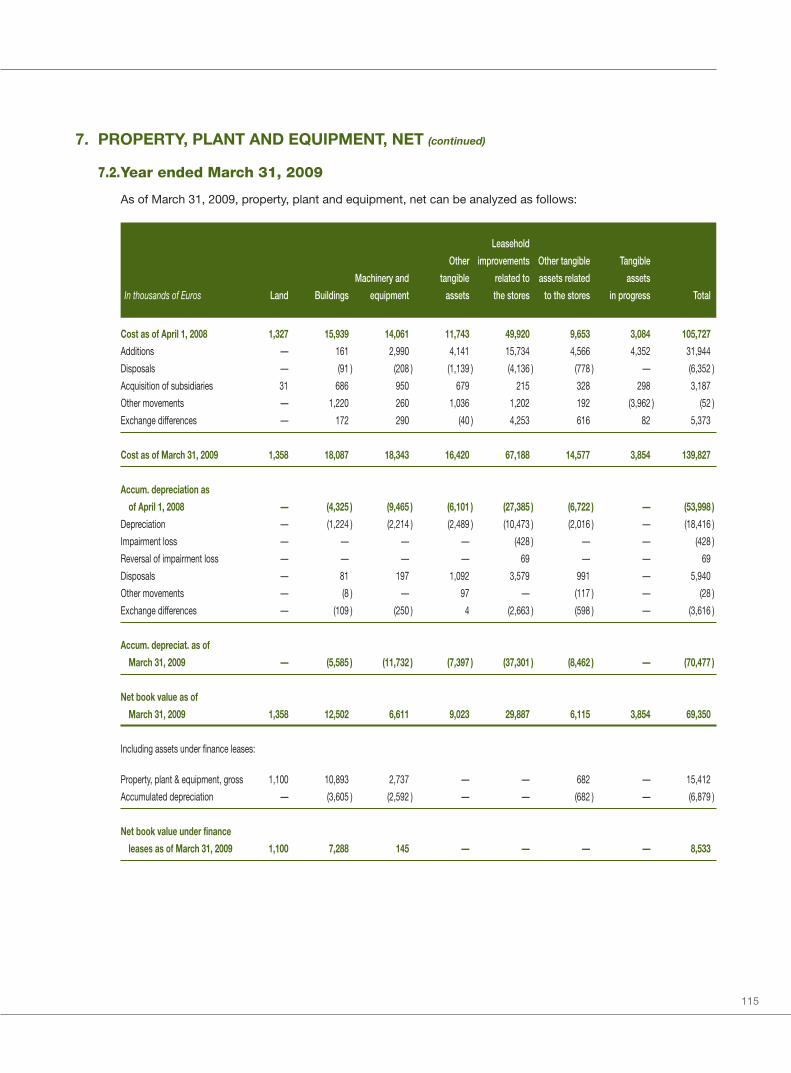
115
7. PROPERTY, PLANT AND EQUIPMENT, NET (continued)
7.2.Year ended March 31, 2009
As of March 31, 2009, property, plant and equipment, net can be analyzed as follows:
Leasehold
Other improvements Other tangible Tangible
Machinery and tangible related to assets related assets
In thousands of Euros Land Buildings equipment assets the stores to the stores in progress Total
Cost as of April 1, 2008 1,327 15,939 14,061 11,743 49,920 9,653 3,084 105,727
Additions — 161 2,990 4,141 15,734 4,566 4,352 31,944
Disposals — (91 ) (208 ) (1,139 ) (4,136 ) (778 ) — (6,352 )
Acquisition of subsidiaries 31 686 950 679 215 328 298 3,187
Other movements — 1,220 260 1,036 1,202 192 (3,962 ) (52 )
Exchange differences — 172 290 (40 ) 4,253 616 82 5,373
Cost as of March 31, 2009 1,358 18,087 18,343 16,420 67,188 14,577 3,854 139,827
Accum. depreciation as
of April 1, 2008 — (4,325 ) (9,465 ) (6,101 ) (27,385 ) (6,722 ) — (53,998 )
Depreciation — (1,224 ) (2,214 ) (2,489 ) (10,473 ) (2,016 ) — (18,416 )
Impairment loss — — — — (428 ) — — (428 )
Reversal of impairment loss — — — — 69 — — 69
Disposals — 81 197 1,092 3,579 991 — 5,940
Other movements — (8 ) — 97 — (117 ) — (28 )
Exchange differences — (109 ) (250 ) 4 (2,663 ) (598 ) — (3,616 )
Accum. depreciat. as of
March 31, 2009 — (5,585 ) (11,732 ) (7,397 ) (37,301 ) (8,462 ) — (70,477 )
Net book value as of
March 31, 2009 1,358 12,502 6,611 9,023 29,887 6,115 3,854 69,350
Including assets under finance leases:
Property, plant & equipment, gross 1,100 10,893 2,737 — — 682 — 15,412
Accumulated depreciation — (3,605 ) (2,592 ) — — (682 ) — (6,879 )
Net book value under finance
leases as of March 31, 2009 1,100 7,288 145 — — — — 8,533

116
NOTES TO THE CONSOLIDATED FINANCIAL STATEMENTS (CONTINUED)
7. PROPERTY, PLANT AND EQUIPMENT, NET (continued)
7.2.Year ended March 31, 2009 (continued)
Main additions during the year related to leasehold improvements for the opening of 155 stores, the finalisationof the renovation of the Paris office and new offices in Manosque.
The additions in Other tangible assets related to the stores include the costs for dismantling and restoring thatare recorded at the inception of the lease and that amount to €1,357,000. This component is subsequentlydepreciated over the lease term (note 2.18 and 18.3). Excluding these non-cash costs, total additions amountto €30,587,000.
The increase in finance leases is related to the acquisition of land and buildings.
Land is located in France.
7.3.Classification of the depreciation of the tangible assets in the statement of income
Depreciation of the Group’s property, plant and equipment has been charged to income statements as follows:
March 31, 2010 2009
In thousands of Euros
Cost of goods sold 2,950 2,353
Distribution expenses 14,957 13,893
General and administrative expenses 1,931 2,170
Depreciation expenses 19,838 18,416

117
7. PROPERTY, PLANT AND EQUIPMENT, NET (continued)
7.4.Impairment tests for property, plant and equipment
March 31, 2010 2009
In thousands of Euros
Accumulated impairment as of April 1, (1,141) (641)
Impairment loss (2,466) (428)
Reversal of impairment loss 489 69
Disposals — —
Exchange differences (81) (141)
Accumulated impairment as of March 31, (3,199) (1,141)
Property, plant and equipment are allocated to the Group’s cash-generating units (CGUs) and tested forimpairment as described in note 2.7. The note 4.1 describes the key assumptions used for the value-in-usecalculations.
An impairment loss amounting to €2,466,000 at March 31, 2010 and €428,000 at March 31, 2009 has beenrecorded within the distribution expenses to adjust the carrying amount of certain assets related to the stores.
A reversal of impairment loss amounting to €489,000 at March 31, 2010 and €69,000 at March 31, 2009 hasbeen recorded within the distribution expenses. No impairment loss has been recorded in the general andadministrative expenses.
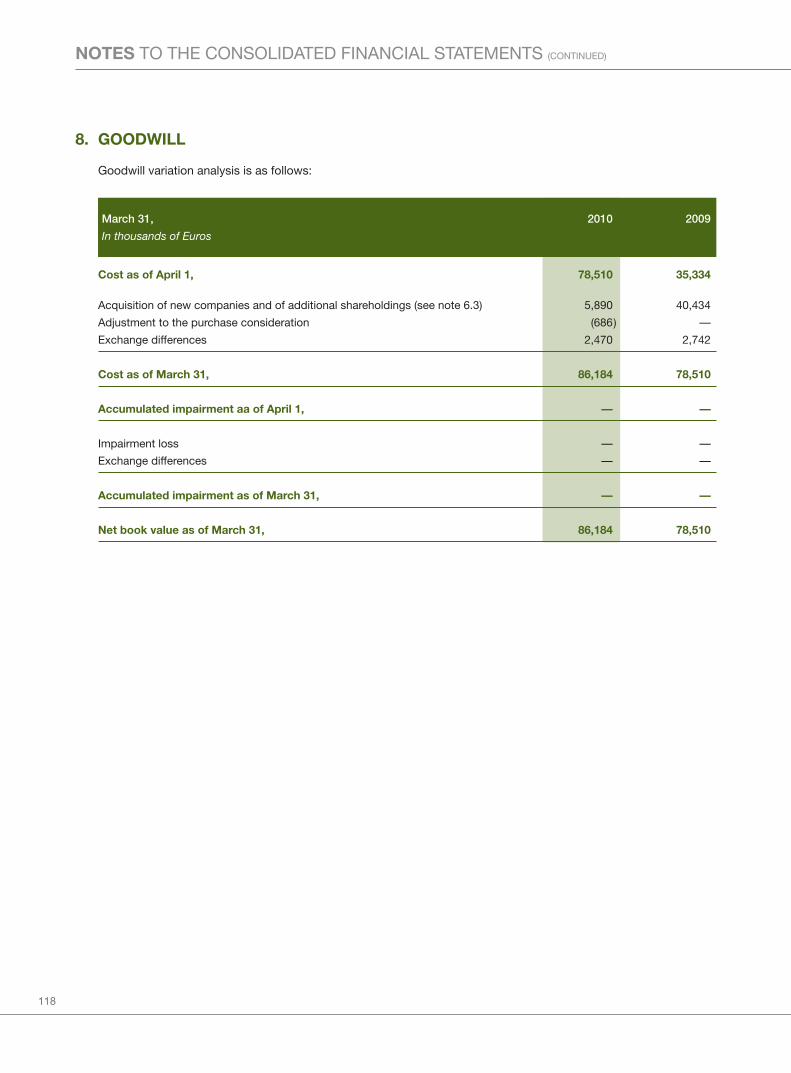
118
NOTES TO THE CONSOLIDATED FINANCIAL STATEMENTS (CONTINUED)
8. GOODWILL
Goodwill variation analysis is as follows:
March 31, 2010 2009
In thousands of Euros
Cost as of April 1, 78,510 35,334
Acquisition of new companies and of additional shareholdings (see note 6.3) 5,890 40,434
Adjustment to the purchase consideration (686) —
Exchange differences 2,470 2,742
Cost as of March 31, 86,184 78,510
Accumulated impairment aa of April 1, — —
Impairment loss — —
Exchange differences — —
Accumulated impairment as of March 31, — —
Net book value as of March 31, 86,184 78,510

119
8. GOODWILL (continued)
8.1.Year ended March 31, 2010
As of March 31, 2010, the breakdown of the Group’s goodwill by country of origin is detailed as follows:
Acquisitions of Net book
Net book subsidiaries or Adjustment to value on
Geographic areas value on of additional the purchase Exchange March 31,
In thousands of Euros April 1, 2009 shareholdings consideration differences 2010
France (a) 36,056 — — — 36,056
Japan (b) 19,787 — — 825 20,612
Russia 5,315 — — 354 5,669
United States 5,083 — — (65) 5,018
Brazil 939 2,719 — 456 4,114
Canada — 3,171 — 470 3,641
Hong Kong 2,221 — — (32) 2,189
Taïwan 1,505 — — 70 1,575
United Kingdom 1,319 — — 61 1,380
China (c) 2,142 — (686) (71) 1,385
Thailand 1,225 — — (10) 1,215
Poland 929 — — 197 1,126
Spain 880 — — — 880
Australia 656 — — 215 871
Belgium 323 — — — 323
Germany 130 — — — 130
TOTAL 78,510 5,890 (686) 2,470 86,184
(a) The French goodwill mostly related to Melvita acquisition is allocated to the Sell-out operating segment for an amount of 22,067,000 and to the Sell-in operatingsegment for an amount of 13,864,000. The key step in relation to the impairment test is the international launch of the Melvita brand which has not yet started;
(b) The Japanese goodwill is allocated to the Sell-out operating segment.(c) On November 2, 2009, LS Holding Company Ltd has released and discharged the Group from the obligation to repay a loan amounting to €686,000. This has
been recorded as an adjustment to the consideration to purchase the minority interests (note 6.2) and the goodwill was adjusted downward accordingly.

120
NOTES TO THE CONSOLIDATED FINANCIAL STATEMENTS (CONTINUED)
8. GOODWILL (continued)
8.2.Year ended March 31, 2009
As of March 31, 2009, the breakdown of the Group’s goodwill by country of origin was detailed as follows:
Acquisitions of
subsidiaries Net book
Geographic areas Net book value or of additional Exchange value on
In thousands of Euros on April 1, 2008 shareholdings differences March 31, 2009
France 125 35,931 — 36,056
United States 4,278 — 805 5,083
United Kingdom 1,542 — (223) 1,319
Japan 16,520 — 3,267 19,787
Hong Kong 1,861 — 360 2,221
Taïwan 1,396 — 109 1,505
Brazil 1,046 — (107) 939
Spain 880 — — 880
Australia 784 — (128) 656
Belgium 323 — — 323
Germany 130 — — 130
Russia 6,449 — (1,134) 5,315
Thailand — 1,186 39 1,225
Poland — 1,300 (371) 929
China — 2,017 125 2,142
TOTAL 35,334 40,434 2,742 78,510
8.3.Impairment test for goodwill
As described in notes 2.5, 2.7 and 4.1, goodwill is reviewed for impairment based on expectations of futurecash flows at each balance sheet date or whenever events or changes in circumstances indicate that thecarrying value may not be recoverable. When an impairment loss is recognized, the corresponding amount isincluded in the statement of income under “Goodwill impairment” (note 4.1).
No impairment loss was recognized during the periods.
9. INTANGIBLE ASSETS, NET
Indemnities paid to the previous lessee at the inception of the lease are recorded as key money and amortized overa period of 10 years or over the lease term if shorter.
Other intangible assets relate mainly to internally used software including enterprise resources planning system,point-of-sales system and others.
Except for trademarks, there are no intangible assets with indefinite useful lives.
The intangible assets in progress relate to purchased softwares to be used internally which are under development.

121
9. INTANGIBLE ASSETS, NET (continued)
9.1.Year ended March 31, 2010
As of March 31, 2010, intangible assets, net can be analyzed as follows:
Contractual Intangible Other
customer assets intangible
In thousands of Euros Website Trademarks Key moneys relationships in progress assets Total
Cost as of April 1, 2009 698 14,717 32,081 1,761 839 8,229 58,325
Additions — — 2,321 — 3,035 2,108 7,464
Disposals — — (222 ) — — (538 ) (760 )
Acquisition of subsidiaries — — — — — — —
Other movements — — 34 — (727 ) 897 204
Exchange differences — — 1,259 — — 178 1,437
Cost as of March 31, 2010 698 14,717 35,473 1,761 3,147 10,874 66,670
Accumulated amortization and
impairment as of April 1, 2009 (686 ) — (13,175) (1,483 ) — (5,567) (20,911)
Impairment loss — — — — — — —
Reversal of impairment loss — — — — — — —
Amortization (12 ) — (3,122 ) (188 ) — (1,588 ) (4,910 )
Disposals — — 205 — — 513 718
Other movements — — 3 — — 42 45
Exchange differences — — (448 ) — — (66 ) (514 )
Accumulated amortization and
impairment as of March 31, 2010 (698 ) — (16,537) (1,671 ) — (6,666) (25,572)
Net book value as of March 31, 2010 — 14,717 18,936 90 3,147 4,208 41,098
Including assets under finance leases
Intangible assets, gross — — — — — 1,170 1,170
Accumulated amortization — — — — — (1,170 ) (1,170 )
Net book value under finance
leases as of March 31, 2010 — — — — — — —
Additions mainly concern:
• Key moneys for an amount of €2,321,000. Such key moneys were mainly acquired in France, Mexico andBrazil;
• Intangible assets in progress for an amount of €3,035,000 that mainly relate to a SAP project.
The amount of intangible assets whose title is restricted or that are pledged as security for liabilities is€1,368,000 as at March 31, 2010.

122
NOTES TO THE CONSOLIDATED FINANCIAL STATEMENTS (CONTINUED)
9. INTANGIBLE ASSETS, NET (continued)
9.2.Year ended March 31, 2009
As of March 31, 2009, intangible assets, net can be analyzed as follows:
Contractual Intangible Other
customer assets intangible
In thousands of Euros Website Trademarks Key moneys relationships in progress assets Total
Cost as of April 1, 2008 696 — 26,421 1,427 651 6,355 35,550
Additions 13 — 6,612 — 700 1,148 8,473
Disposals (22 ) — (189 ) — — (90 ) (301 )
Acquisition of subsidiaries — 14,717 255 334 — 12 15,318
Other movements 11 — (466 ) — (512 ) 514 (453 )
Exchange differences — — (552 ) — — 290 (262 )
Cost as of March 31, 2009 698 14,717 32,081 1,761 839 8,229 58,325
Accumulated amortization and
impairment as of April 1, 2008 (687 ) — (10,765 ) (1,069 ) — (4,400 ) (16,921 )
Impairment loss — — — — — — —
Reversal of impairment loss — — — — — — —
Amortization (7 ) — (3,059 ) (413 ) — (1,116 ) (4,595 )
Disposals 11 — 188 — — 82 281
Other movements (3 ) — 326 (1 ) — 63 385
Exchange differences — — 135 — — (196 ) (61 )
Accumulated amortization and
impairment as of March 31, 2009 (686 ) — (13,175 ) (1,483 ) — (5,567 ) (20,911 )
Net book value as of March 31, 2009 12 14,717 18,906 278 839 2,662 37,414
Including assets under finance leases
Intangible assets, gross — — — — — 1,170 1,170
Accumulated amortization — — — — — (1,170 ) (1,170 )
Net book value under finance
leases as of March 31, 2009 — — — — — — —
Additions and acquisitions mainly concern:
• Trademarks acquired through the business combination with M&A Développement (M&A): Melvita, Prosun,Procarbo and Algascience. These trademarks which have an indefinite useful life are not amortized but aretested for impairment;
• Key moneys for an amount of €6,612,000. Such key moneys were mainly acquired in France, Mexico andSpain.
The amount of intangible assets whose title is restricted or that are pledged as security for liabilities is€2,087,000 as at March 31, 2009.

123
9. INTANGIBLE ASSETS, NET (continued)
9.3.Classification of the amortization of the intangible assets in the statement of income
Amortization of the intangible assets has been charged to income statements as follows:
March 31, 2010 2009
In thousands of Euros
Cost of goods sold 5 —
Distribution expenses 3,264 3,914
General and administrative expenses 1,641 681
Amortization expenses 4,910 4,595
9.4.Impairment tests for intangible assets
Intangible assets are allocated to the Group’s cash-generating units (CGUs) as described in note 2.7 and testedfor impairment. The note 4.1 describes the sensitivity of the key assumptions used for the value-in-usecalculation.
March 31, 2010 2009
In thousands of Euros
Accumulated impairment as of April 1, (101) (94)
Impairment loss — —
Reversal of impairment loss — —
Exchange differences 1 (7)
Accumulated impairment as of March 31, (100) (101)
No new impairment loss has been recorded during the periods. The accumulated impairment loss is fullyallocated to the Sell-Out segment.
No reversal of impairment loss has been recorded at March 31, 2010 and 2009.

124
NOTES TO THE CONSOLIDATED FINANCIAL STATEMENTS (CONTINUED)
10.OTHER NON-CURRENT RECEIVABLES
The other non-current receivables consist of the following:
March 31, 2010 2009
In thousands of Euros
Deposits 16,839 15,049
Key moneys paid to the landlord 1,596 1,112
Loans to employees — 1,020
Other non-current receivables 18,435 17,181
Key moneys paid to the landlord are deemed to be linked to the rent and are classified within prepaid expenses(current and non current) (note 2.5).
The decrease in the loans to employees is mainly explained by repayments that occurred during the period and bythe fact that certain loans were assigned to LOG on December 31, 2009 for an amount of €454,000. This resultedin a corresponding change in the current account from parent (note 30.4).
The fair value of these loans to employees (based on discounted cash flows at a market rate) was not significantlydifferent from the above nominal value.
11. INVENTORIES, NET
Inventories, net consist of the following items:
March 31, 2010 2009
In thousands of Euros
Raw materials and supplies 15,942 15,559
Finished goods and work in progress 59,361 68,801
Inventories, gross 75,303 84,360
Less, allowance (7,824) (6,694)
Inventories, net 67,479 77,666
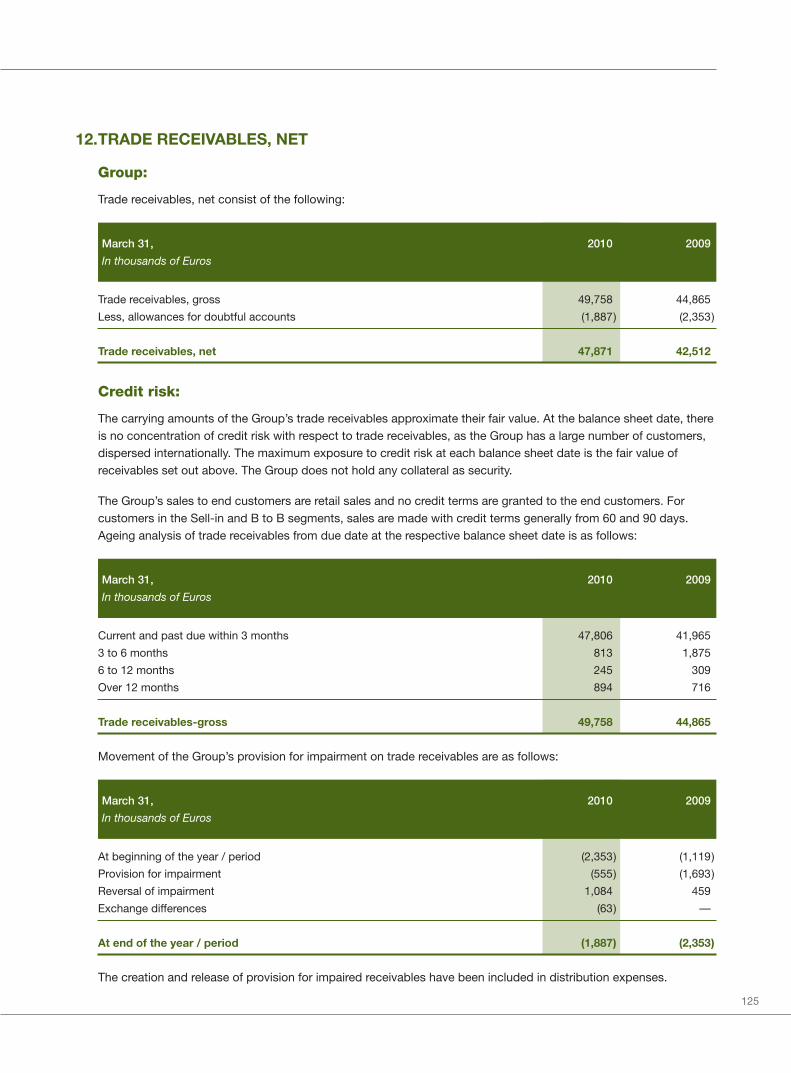
125
12.TRADE RECEIVABLES, NET
Group:
Trade receivables, net consist of the following:
March 31, 2010 2009
In thousands of Euros
Trade receivables, gross 49,758 44,865
Less, allowances for doubtful accounts (1,887) (2,353)
Trade receivables, net 47,871 42,512
Credit risk:
The carrying amounts of the Group’s trade receivables approximate their fair value. At the balance sheet date, thereis no concentration of credit risk with respect to trade receivables, as the Group has a large number of customers,dispersed internationally. The maximum exposure to credit risk at each balance sheet date is the fair value ofreceivables set out above. The Group does not hold any collateral as security.
The Group’s sales to end customers are retail sales and no credit terms are granted to the end customers. Forcustomers in the Sell-in and B to B segments, sales are made with credit terms generally from 60 and 90 days.Ageing analysis of trade receivables from due date at the respective balance sheet date is as follows:
March 31, 2010 2009
In thousands of Euros
Current and past due within 3 months 47,806 41,965
3 to 6 months 813 1,875
6 to 12 months 245 309
Over 12 months 894 716
Trade receivables-gross 49,758 44,865
Movement of the Group’s provision for impairment on trade receivables are as follows:
March 31, 2010 2009
In thousands of Euros
At beginning of the year / period (2,353) (1,119)
Provision for impairment (555) (1,693)
Reversal of impairment 1,084 459
Exchange differences (63) —
At end of the year / period (1,887) (2,353)
The creation and release of provision for impaired receivables have been included in distribution expenses.

126
NOTES TO THE CONSOLIDATED FINANCIAL STATEMENTS (CONTINUED)
12.TRADE RECEIVABLES, NET (continued)
Credit risk: (continued)
The ageing of the provision for the impaired receivables from due date is as follows:
March 31, 2010 2009
In thousands of Euros
Within 3 months 977 761
3 to 6 months 121 860
6 to 12 months 80 103
Over 12 months 709 629
Impaired receivables 1,887 2,353
The individually impaired receivables relate to wholesalers which are in unexpectedly difficult economic situations.
The ageing analysis of trade receivables from due date that were past due but not impaired as of March 31, 2010and 2009 is as follows:
March 31, 2010 2009
In thousands of Euros
Within 3 months 4,182 4,067
3 to 6 months 692 1,015
6 to 12 months 164 205
Over 12 months 186 88
Trade receivables past due but not impaired 5,224 5,375
These trade receivables relate to a number of customers for whom there is no recent history of default.
The Group considers that there is no recoverability risk on these past due receivables.
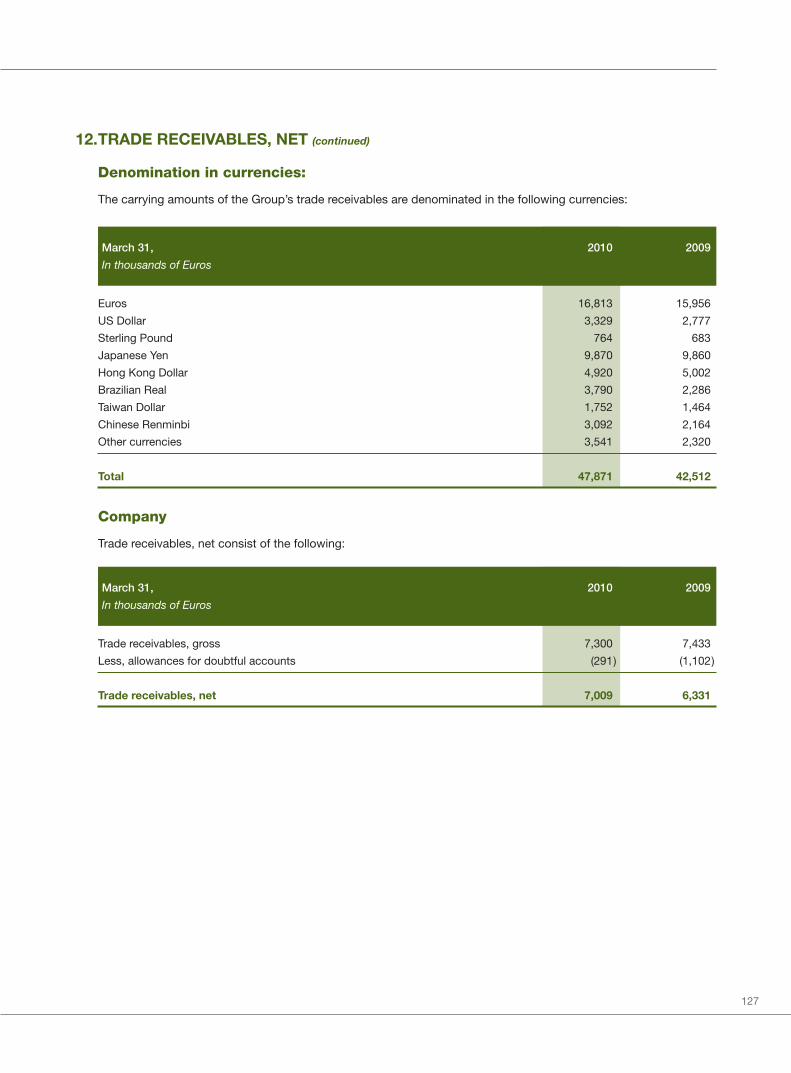
127
12.TRADE RECEIVABLES, NET (continued)
Denomination in currencies:
The carrying amounts of the Group’s trade receivables are denominated in the following currencies:
March 31, 2010 2009
In thousands of Euros
Euros 16,813 15,956
US Dollar 3,329 2,777
Sterling Pound 764 683
Japanese Yen 9,870 9,860
Hong Kong Dollar 4,920 5,002
Brazilian Real 3,790 2,286
Taiwan Dollar 1,752 1,464
Chinese Renminbi 3,092 2,164
Other currencies 3,541 2,320
Total 47,871 42,512
Company
Trade receivables, net consist of the following:
March 31, 2010 2009
In thousands of Euros
Trade receivables, gross 7,300 7,433
Less, allowances for doubtful accounts (291) (1,102)
Trade receivables, net 7,009 6,331
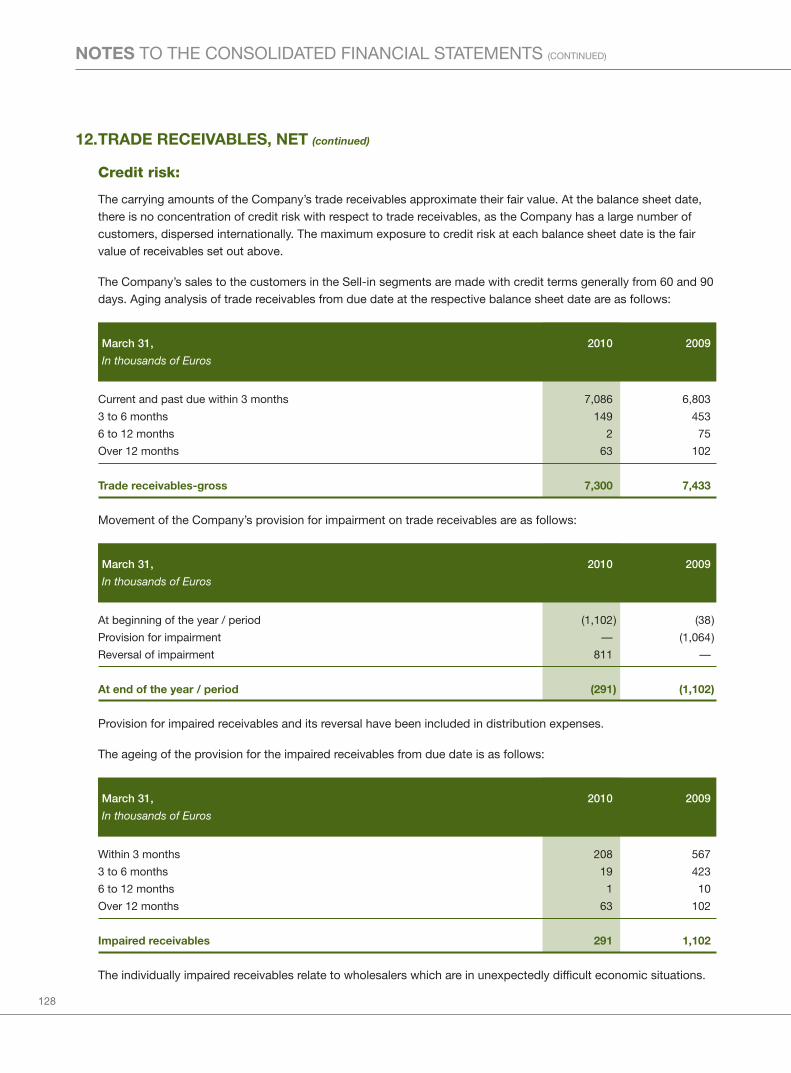
128
NOTES TO THE CONSOLIDATED FINANCIAL STATEMENTS (CONTINUED)
12.TRADE RECEIVABLES, NET (continued)
Credit risk:
The carrying amounts of the Company’s trade receivables approximate their fair value. At the balance sheet date,there is no concentration of credit risk with respect to trade receivables, as the Company has a large number ofcustomers, dispersed internationally. The maximum exposure to credit risk at each balance sheet date is the fairvalue of receivables set out above.
The Company’s sales to the customers in the Sell-in segments are made with credit terms generally from 60 and 90days. Aging analysis of trade receivables from due date at the respective balance sheet date are as follows:
March 31, 2010 2009
In thousands of Euros
Current and past due within 3 months 7,086 6,803
3 to 6 months 149 453
6 to 12 months 2 75
Over 12 months 63 102
Trade receivables-gross 7,300 7,433
Movement of the Company’s provision for impairment on trade receivables are as follows:
March 31, 2010 2009
In thousands of Euros
At beginning of the year / period (1,102) (38)
Provision for impairment — (1,064)
Reversal of impairment 811 —
At end of the year / period (291) (1,102)
Provision for impaired receivables and its reversal have been included in distribution expenses.
The ageing of the provision for the impaired receivables from due date is as follows:
March 31, 2010 2009
In thousands of Euros
Within 3 months 208 567
3 to 6 months 19 423
6 to 12 months 1 10
Over 12 months 63 102
Impaired receivables 291 1,102
The individually impaired receivables relate to wholesalers which are in unexpectedly difficult economic situations.

129
12.TRADE RECEIVABLES, NET (continued)
Credit risk: (continued)
The ageing analysis of trade receivables from due date that were past due but not impaired as at March 31, 2009and 2010 is as follows:
March 31, 2010 2009
In thousands of Euros
Within 3 months 1,109 1,036
3 to 6 months 130 30
6 to 12 months 1 65
Over 12 months — —
Trade receivables past due but not impaired 1,240 1,131
These trade receivables relate to a number of customers for whom there is no recent history of default.
The Company considers that there is no recoverability risk on these past due receivables.
Denomination in currencies:
The carrying amounts of the Company’s trade receivables are denominated in the following currencies:
March 31, 2010 2009
In thousands of Euros
Euros 6,355 5,912
US Dollar 610 388
Sterling Pound 44 31
Total 7,009 6,331
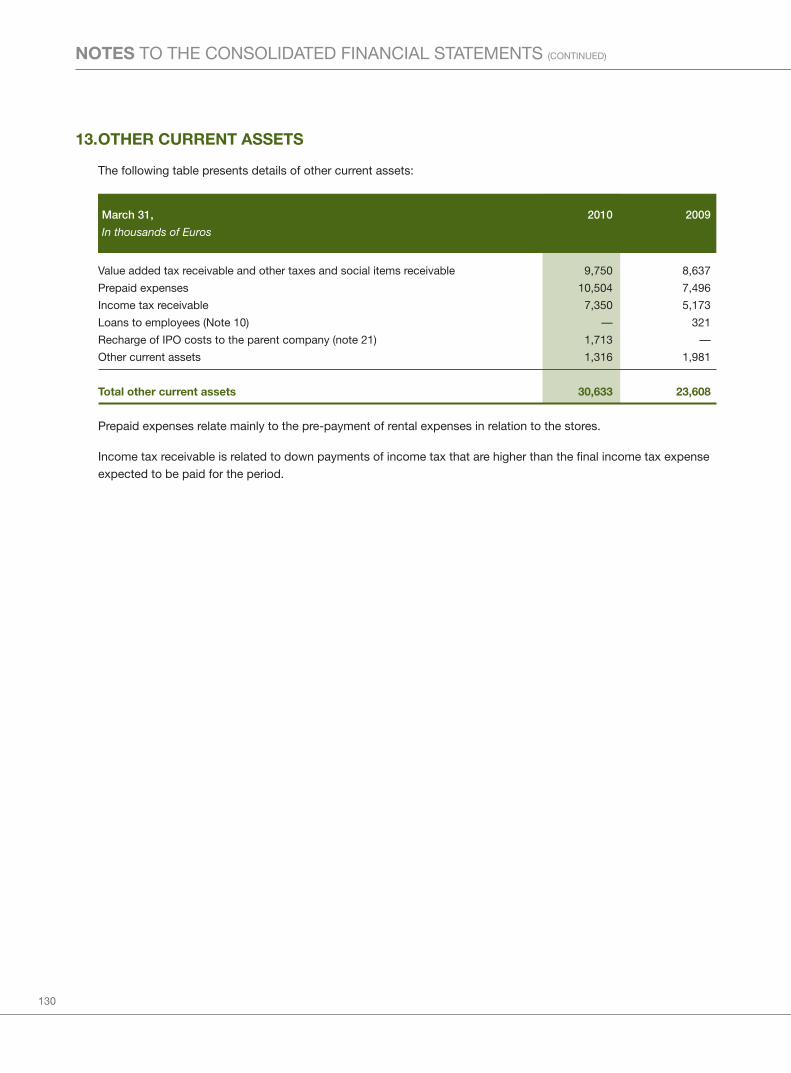
130
NOTES TO THE CONSOLIDATED FINANCIAL STATEMENTS (CONTINUED)
13.OTHER CURRENT ASSETS
The following table presents details of other current assets:
March 31, 2010 2009
In thousands of Euros
Value added tax receivable and other taxes and social items receivable 9,750 8,637
Prepaid expenses 10,504 7,496
Income tax receivable 7,350 5,173
Loans to employees (Note 10) — 321
Recharge of IPO costs to the parent company (note 21) 1,713 —
Other current assets 1,316 1,981
Total other current assets 30,633 23,608
Prepaid expenses relate mainly to the pre-payment of rental expenses in relation to the stores.
Income tax receivable is related to down payments of income tax that are higher than the final income tax expenseexpected to be paid for the period.
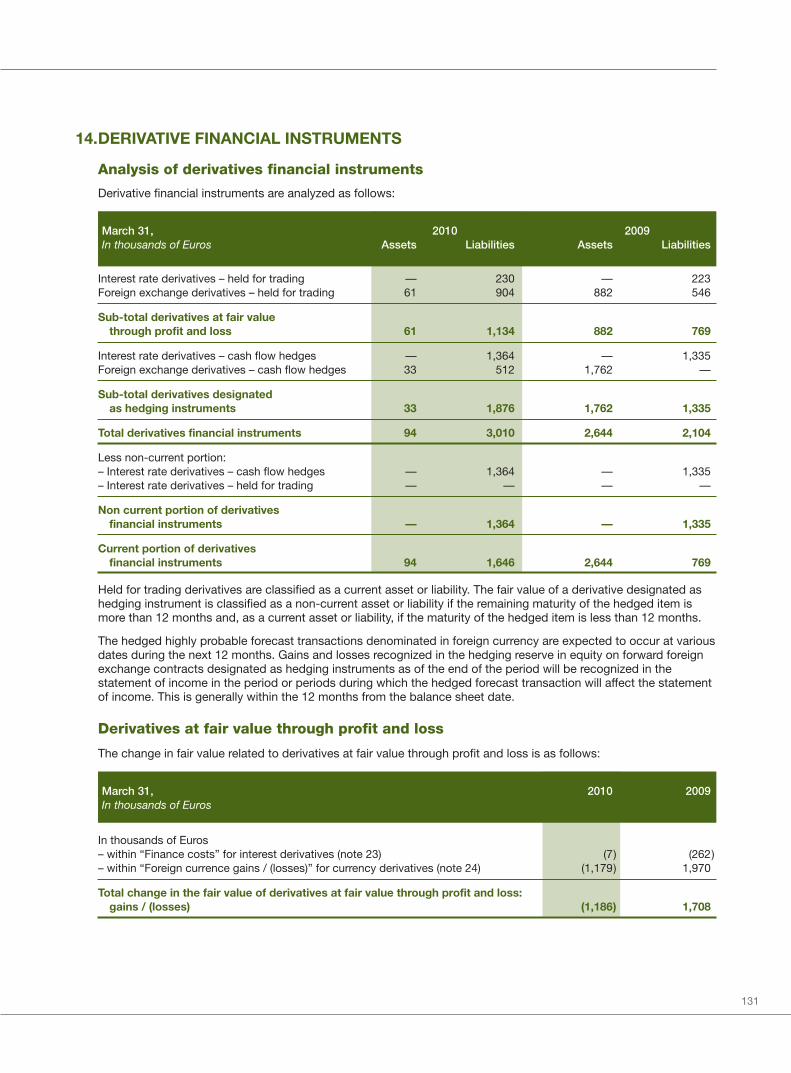
131
14.DERIVATIVE FINANCIAL INSTRUMENTS
Analysis of derivatives financial instruments
Derivative financial instruments are analyzed as follows:
March 31, 2010 2009In thousands of Euros Assets Liabilities Assets Liabilities
Interest rate derivatives – held for trading — 230 — 223Foreign exchange derivatives – held for trading 61 904 882 546
Sub-total derivatives at fair valuethrough profit and loss 61 1,134 882 769
Interest rate derivatives – cash flow hedges — 1,364 — 1,335Foreign exchange derivatives – cash flow hedges 33 512 1,762 —
Sub-total derivatives designatedas hedging instruments 33 1,876 1,762 1,335
Total derivatives financial instruments 94 3,010 2,644 2,104
Less non-current portion:– Interest rate derivatives – cash flow hedges — 1,364 — 1,335– Interest rate derivatives – held for trading — — — —
Non current portion of derivativesfinancial instruments — 1,364 — 1,335
Current portion of derivativesfinancial instruments 94 1,646 2,644 769
Held for trading derivatives are classified as a current asset or liability. The fair value of a derivative designated ashedging instrument is classified as a non-current asset or liability if the remaining maturity of the hedged item ismore than 12 months and, as a current asset or liability, if the maturity of the hedged item is less than 12 months.
The hedged highly probable forecast transactions denominated in foreign currency are expected to occur at variousdates during the next 12 months. Gains and losses recognized in the hedging reserve in equity on forward foreignexchange contracts designated as hedging instruments as of the end of the period will be recognized in thestatement of income in the period or periods during which the hedged forecast transaction will affect the statementof income. This is generally within the 12 months from the balance sheet date.
Derivatives at fair value through profit and loss
The change in fair value related to derivatives at fair value through profit and loss is as follows:
March 31, 2010 2009In thousands of Euros
In thousands of Euros– within “Finance costs” for interest derivatives (note 23) (7) (262)– within “Foreign currence gains / (losses)” for currency derivatives (note 24) (1,179) 1,970
Total change in the fair value of derivatives at fair value through profit and loss:gains / (losses) (1,186) 1,708
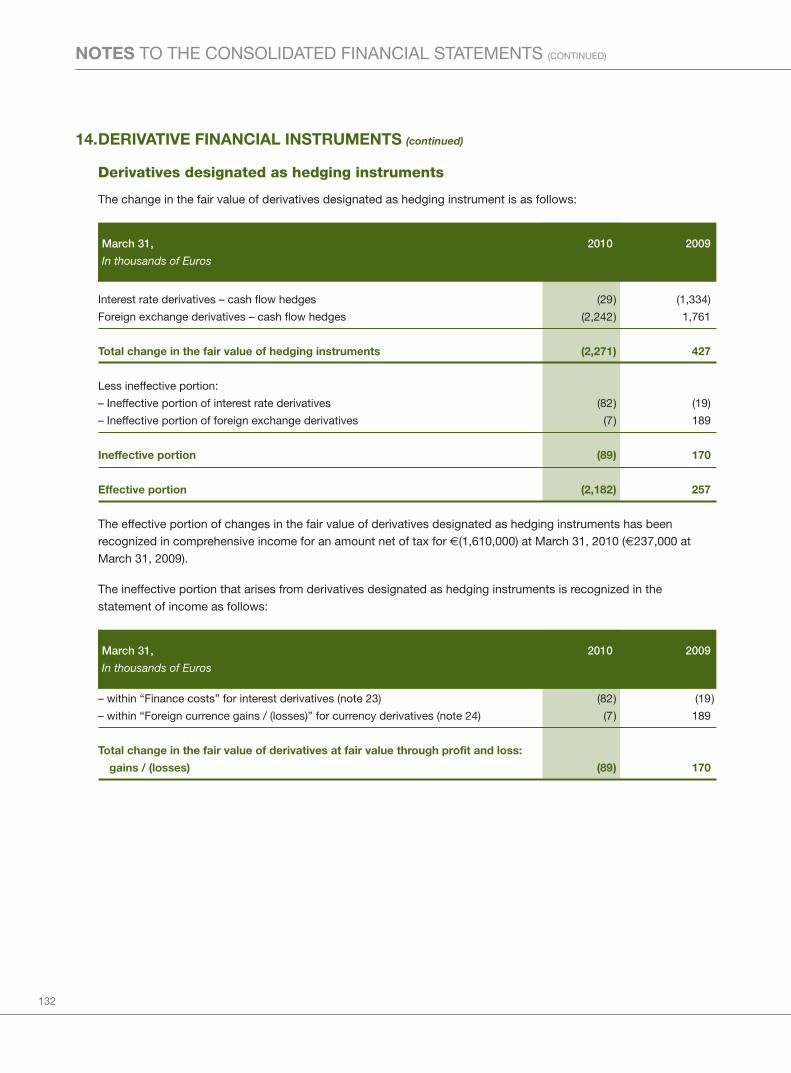
132
NOTES TO THE CONSOLIDATED FINANCIAL STATEMENTS (CONTINUED)
14.DERIVATIVE FINANCIAL INSTRUMENTS (continued)
Derivatives designated as hedging instruments
The change in the fair value of derivatives designated as hedging instrument is as follows:
March 31, 2010 2009
In thousands of Euros
Interest rate derivatives – cash flow hedges (29) (1,334)
Foreign exchange derivatives – cash flow hedges (2,242) 1,761
Total change in the fair value of hedging instruments (2,271) 427
Less ineffective portion:
– Ineffective portion of interest rate derivatives (82) (19)
– Ineffective portion of foreign exchange derivatives (7) 189
Ineffective portion (89) 170
Effective portion (2,182) 257
The effective portion of changes in the fair value of derivatives designated as hedging instruments has beenrecognized in comprehensive income for an amount net of tax for €(1,610,000) at March 31, 2010 (€237,000 atMarch 31, 2009).
The ineffective portion that arises from derivatives designated as hedging instruments is recognized in thestatement of income as follows:
March 31, 2010 2009
In thousands of Euros
– within “Finance costs” for interest derivatives (note 23) (82) (19)
– within “Foreign currence gains / (losses)” for currency derivatives (note 24) (7) 189
Total change in the fair value of derivatives at fair value through profit and loss:
gains / (losses) (89) 170
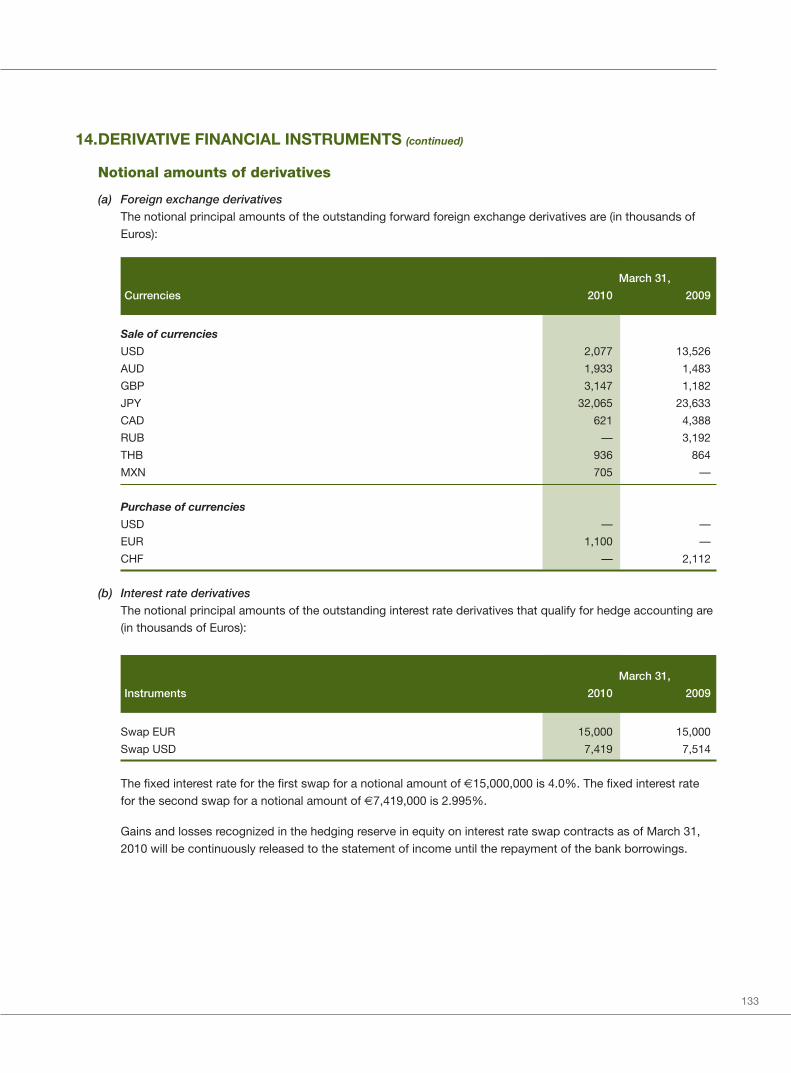
133
14.DERIVATIVE FINANCIAL INSTRUMENTS (continued)
Notional amounts of derivatives
(a) Foreign exchange derivativesThe notional principal amounts of the outstanding forward foreign exchange derivatives are (in thousands ofEuros):
March 31,
Currencies 2010 2009
Sale of currencies
USD 2,077 13,526
AUD 1,933 1,483
GBP 3,147 1,182
JPY 32,065 23,633
CAD 621 4,388
RUB — 3,192
THB 936 864
MXN 705 —
Purchase of currencies
USD — —
EUR 1,100 —
CHF — 2,112
(b) Interest rate derivativesThe notional principal amounts of the outstanding interest rate derivatives that qualify for hedge accounting are(in thousands of Euros):
March 31,
Instruments 2010 2009
Swap EUR 15,000 15,000
Swap USD 7,419 7,514
The fixed interest rate for the first swap for a notional amount of €15,000,000 is 4.0%. The fixed interest ratefor the second swap for a notional amount of €7,419,000 is 2.995%.
Gains and losses recognized in the hedging reserve in equity on interest rate swap contracts as of March 31,2010 will be continuously released to the statement of income until the repayment of the bank borrowings.
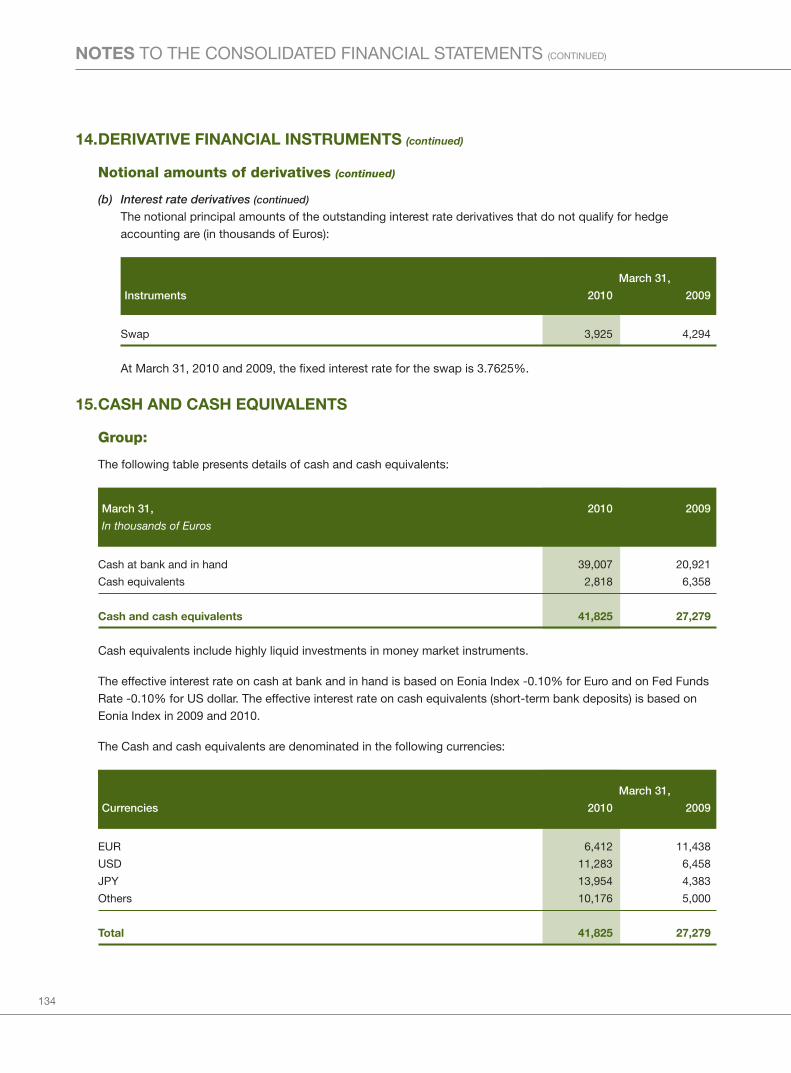
134
NOTES TO THE CONSOLIDATED FINANCIAL STATEMENTS (CONTINUED)
14.DERIVATIVE FINANCIAL INSTRUMENTS (continued)
Notional amounts of derivatives (continued)
(b) Interest rate derivatives (continued)
The notional principal amounts of the outstanding interest rate derivatives that do not qualify for hedgeaccounting are (in thousands of Euros):
March 31,
Instruments 2010 2009
Swap 3,925 4,294
At March 31, 2010 and 2009, the fixed interest rate for the swap is 3.7625%.
15.CASH AND CASH EQUIVALENTS
Group:
The following table presents details of cash and cash equivalents:
March 31, 2010 2009
In thousands of Euros
Cash at bank and in hand 39,007 20,921
Cash equivalents 2,818 6,358
Cash and cash equivalents 41,825 27,279
Cash equivalents include highly liquid investments in money market instruments.
The effective interest rate on cash at bank and in hand is based on Eonia Index -0.10% for Euro and on Fed FundsRate -0.10% for US dollar. The effective interest rate on cash equivalents (short-term bank deposits) is based onEonia Index in 2009 and 2010.
The Cash and cash equivalents are denominated in the following currencies:
March 31,
Currencies 2010 2009
EUR 6,412 11,438
USD 11,283 6,458
JPY 13,954 4,383
Others 10,176 5,000
Total 41,825 27,279
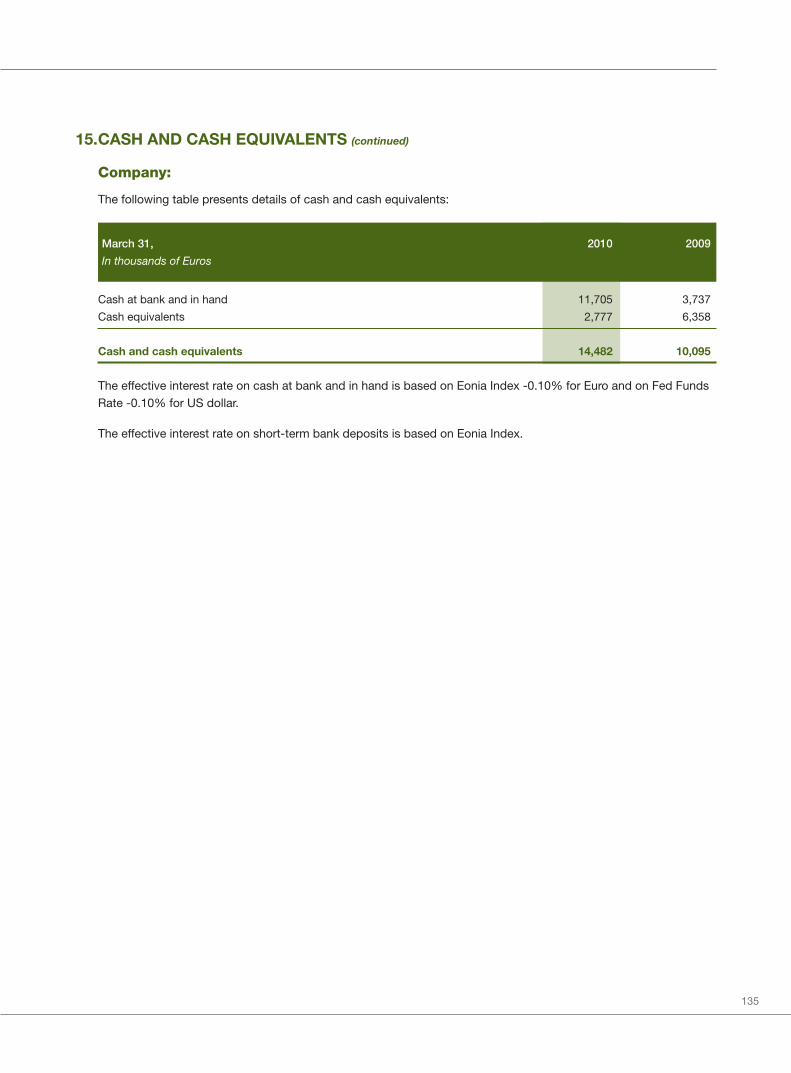
135
15.CASH AND CASH EQUIVALENTS (continued)
Company:
The following table presents details of cash and cash equivalents:
March 31, 2010 2009
In thousands of Euros
Cash at bank and in hand 11,705 3,737
Cash equivalents 2,777 6,358
Cash and cash equivalents 14,482 10,095
The effective interest rate on cash at bank and in hand is based on Eonia Index -0.10% for Euro and on Fed FundsRate -0.10% for US dollar.
The effective interest rate on short-term bank deposits is based on Eonia Index.
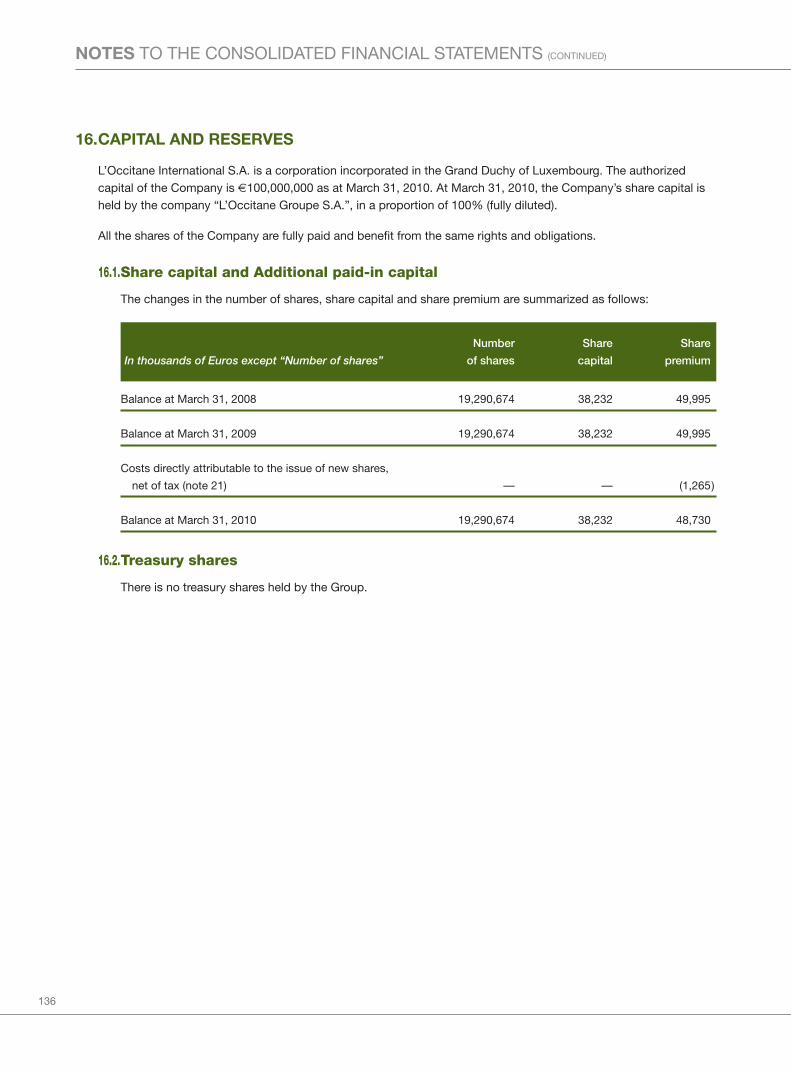
136
NOTES TO THE CONSOLIDATED FINANCIAL STATEMENTS (CONTINUED)
16.CAPITAL AND RESERVES
L’Occitane International S.A. is a corporation incorporated in the Grand Duchy of Luxembourg. The authorizedcapital of the Company is €100,000,000 as at March 31, 2010. At March 31, 2010, the Company’s share capital isheld by the company “L’Occitane Groupe S.A.”, in a proportion of 100% (fully diluted).
All the shares of the Company are fully paid and benefit from the same rights and obligations.
16.1.Share capital and Additional paid-in capital
The changes in the number of shares, share capital and share premium are summarized as follows:
Number Share Share
In thousands of Euros except “Number of shares” of shares capital premium
Balance at March 31, 2008 19,290,674 38,232 49,995
Balance at March 31, 2009 19,290,674 38,232 49,995
Costs directly attributable to the issue of new shares,
net of tax (note 21) — — (1,265)
Balance at March 31, 2010 19,290,674 38,232 48,730
16.2.Treasury shares
There is no treasury shares held by the Group.

137
16.CAPITAL AND RESERVES (continued)
16.3.Share-based payments
Share-based payments from the parent
Main characteristics of the plans
L’Occitane Groupe S.A. (the parent company of L’Occitane International S.A.) (“LOG”) granted rights to its ownequity instruments direct to L’Occitane International S.A. and its subsidiaries’ employees.
• Options, granted in July 2009 (formally authorized in January 2010) are conditional on the employeecompleting four year’s service (the vesting period) and there are no performance conditions. The exerciseprice of the options is €23.20. Options have a contractual option term of 6 years.
• Options, granted on February 2008, are conditional on the employee completing four year’s service (thevesting period) and there are no performance conditions. The exercise price of the options is €26.10.Options have a contractual option term of 6 years.
• The free shares, granted on July 2009, June 2008 and February 2008 are conditional upon the employeecompleting four year’s service (the vesting period).
• On December 27, 2007, 60,651 shares of L’Occitane Groupe S.A., the parent company have been issuedto the benefit of FCPE L’Occitane Actionnariat which is a fund held by employees of the Frenchsubsidiaries of the Group. The shares were issued for a subscription price with a discount of 20% ascompared to the fair value at that date. There is no vesting condition. However the shares are subject torestrictions on transfer over a period of 5 years.
At the time they become LOG shareholders, employees are subject to a liquidity agreement signed with CIME,which is controlled by Mr. Reinold Geiger, a Director of the Company.
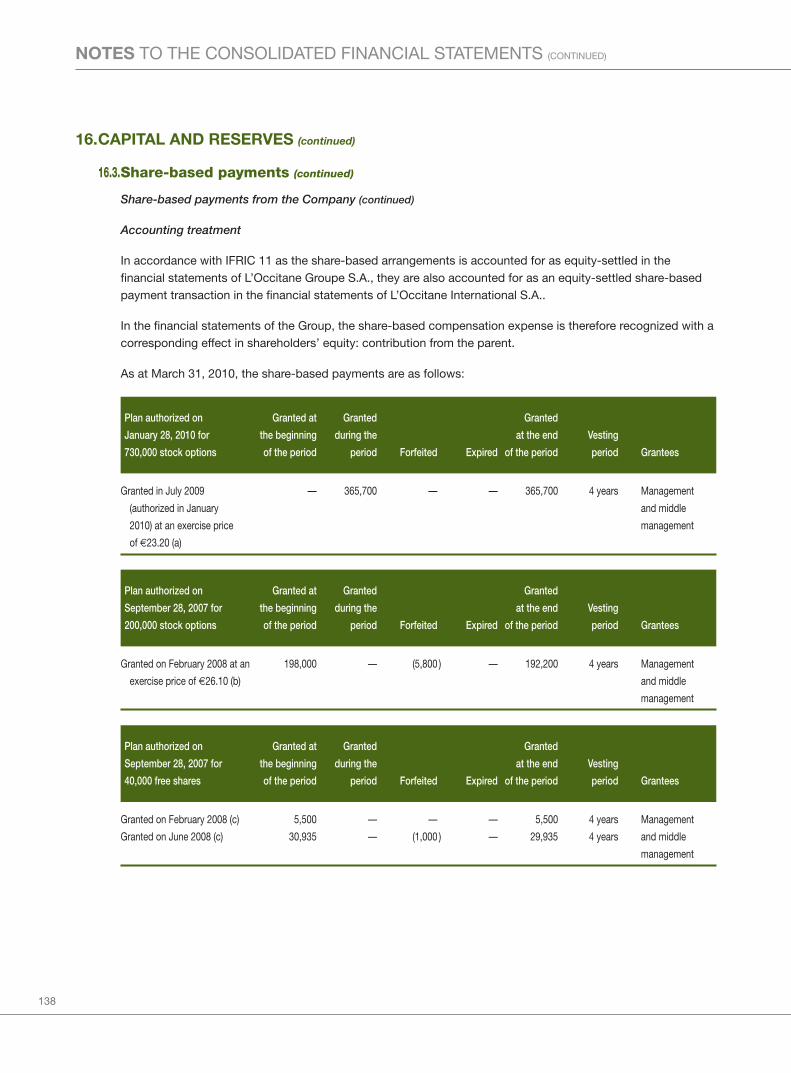
138
NOTES TO THE CONSOLIDATED FINANCIAL STATEMENTS (CONTINUED)
16.CAPITAL AND RESERVES (continued)
16.3.Share-based payments (continued)
Share-based payments from the Company (continued)
Accounting treatment
In accordance with IFRIC 11 as the share-based arrangements is accounted for as equity-settled in thefinancial statements of L’Occitane Groupe S.A., they are also accounted for as an equity-settled share-basedpayment transaction in the financial statements of L’Occitane International S.A..
In the financial statements of the Group, the share-based compensation expense is therefore recognized with acorresponding effect in shareholders’ equity: contribution from the parent.
As at March 31, 2010, the share-based payments are as follows:
Plan authorized on Granted at Granted Granted
January 28, 2010 for the beginning during the at the end Vesting
730,000 stock options of the period period Forfeited Expired of the period period Grantees
Granted in July 2009 — 365,700 — — 365,700 4 years Management
(authorized in January and middle
2010) at an exercise price management
of €23.20 (a)
Plan authorized on Granted at Granted Granted
September 28, 2007 for the beginning during the at the end Vesting
200,000 stock options of the period period Forfeited Expired of the period period Grantees
Granted on February 2008 at an 198,000 — (5,800 ) — 192,200 4 years Management
exercise price of €26.10 (b) and middle
management
Plan authorized on Granted at Granted Granted
September 28, 2007 for the beginning during the at the end Vesting
40,000 free shares of the period period Forfeited Expired of the period period Grantees
Granted on February 2008 (c) 5,500 — — — 5,500 4 years Management
Granted on June 2008 (c) 30,935 — (1,000 ) — 29,935 4 years and middle
management
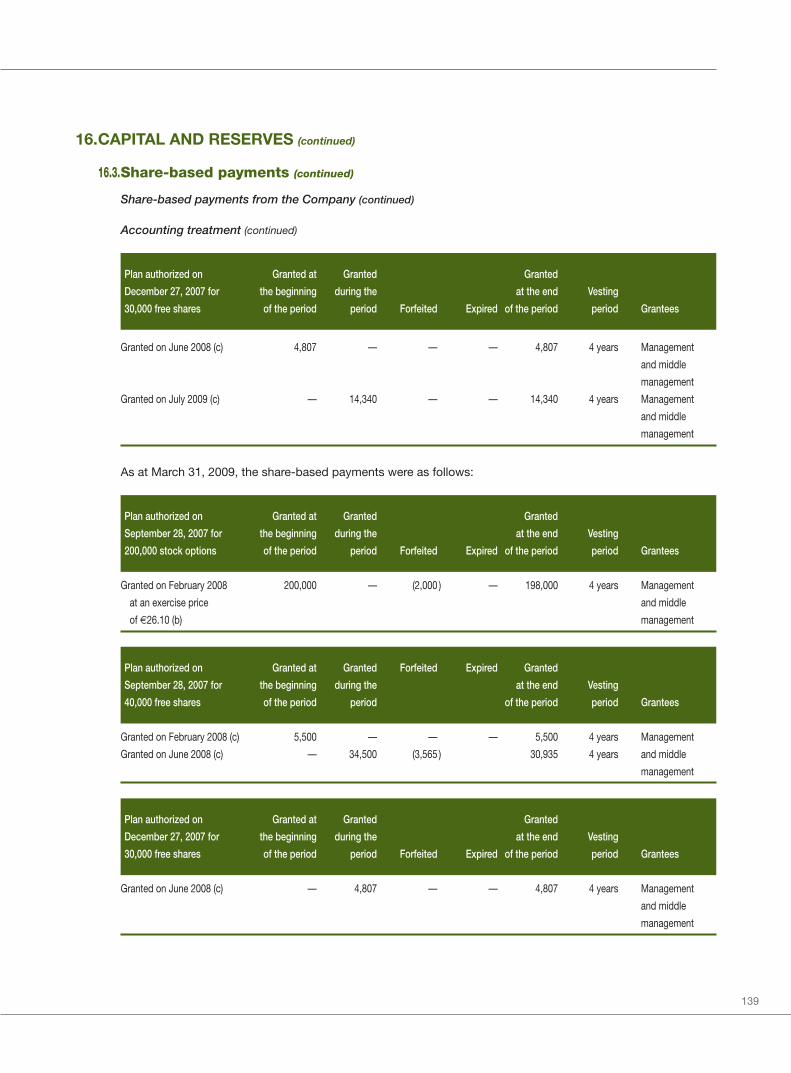
139
16.CAPITAL AND RESERVES (continued)
16.3.Share-based payments (continued)
Share-based payments from the Company (continued)
Accounting treatment (continued)
Plan authorized on Granted at Granted Granted
December 27, 2007 for the beginning during the at the end Vesting
30,000 free shares of the period period Forfeited Expired of the period period Grantees
Granted on June 2008 (c) 4,807 — — — 4,807 4 years Management
and middle
management
Granted on July 2009 (c) — 14,340 — — 14,340 4 years Management
and middle
management
As at March 31, 2009, the share-based payments were as follows:
Plan authorized on Granted at Granted Granted
September 28, 2007 for the beginning during the at the end Vesting
200,000 stock options of the period period Forfeited Expired of the period period Grantees
Granted on February 2008 200,000 — (2,000 ) — 198,000 4 years Management
at an exercise price and middle
of €26.10 (b) management
Plan authorized on Granted at Granted Forfeited Expired Granted
September 28, 2007 for the beginning during the at the end Vesting
40,000 free shares of the period period of the period period Grantees
Granted on February 2008 (c) 5,500 — — — 5,500 4 years Management
Granted on June 2008 (c) — 34,500 (3,565 ) 30,935 4 years and middle
management
Plan authorized on Granted at Granted Granted
December 27, 2007 for the beginning during the at the end Vesting
30,000 free shares of the period period Forfeited Expired of the period period Grantees
Granted on June 2008 (c) — 4,807 — — 4,807 4 years Management
and middle
management
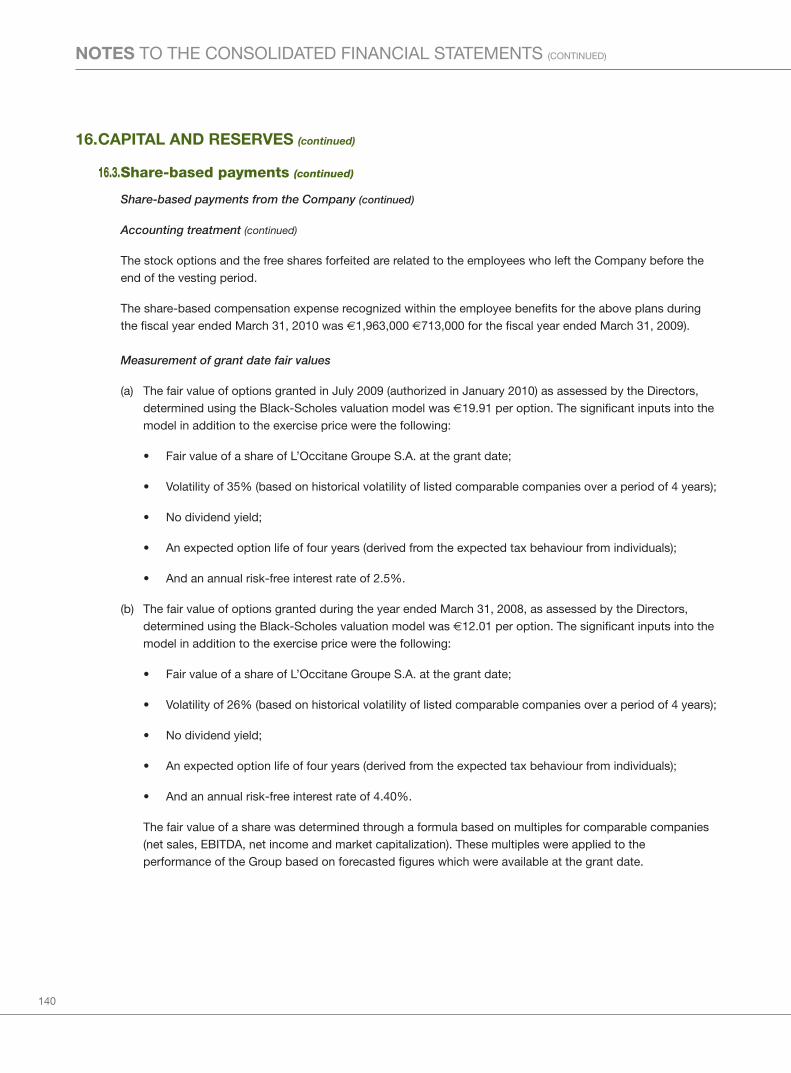
140
NOTES TO THE CONSOLIDATED FINANCIAL STATEMENTS (CONTINUED)
16.CAPITAL AND RESERVES (continued)
16.3.Share-based payments (continued)
Share-based payments from the Company (continued)
Accounting treatment (continued)
The stock options and the free shares forfeited are related to the employees who left the Company before theend of the vesting period.
The share-based compensation expense recognized within the employee benefits for the above plans duringthe fiscal year ended March 31, 2010 was €1,963,000 €713,000 for the fiscal year ended March 31, 2009).
Measurement of grant date fair values
(a) The fair value of options granted in July 2009 (authorized in January 2010) as assessed by the Directors,determined using the Black-Scholes valuation model was €19.91 per option. The significant inputs into themodel in addition to the exercise price were the following:
• Fair value of a share of L’Occitane Groupe S.A. at the grant date;
• Volatility of 35% (based on historical volatility of listed comparable companies over a period of 4 years);
• No dividend yield;
• An expected option life of four years (derived from the expected tax behaviour from individuals);
• And an annual risk-free interest rate of 2.5%.
(b) The fair value of options granted during the year ended March 31, 2008, as assessed by the Directors,determined using the Black-Scholes valuation model was €12.01 per option. The significant inputs into themodel in addition to the exercise price were the following:
• Fair value of a share of L’Occitane Groupe S.A. at the grant date;
• Volatility of 26% (based on historical volatility of listed comparable companies over a period of 4 years);
• No dividend yield;
• An expected option life of four years (derived from the expected tax behaviour from individuals);
• And an annual risk-free interest rate of 4.40%.
The fair value of a share was determined through a formula based on multiples for comparable companies(net sales, EBITDA, net income and market capitalization). These multiples were applied to theperformance of the Group based on forecasted figures which were available at the grant date.
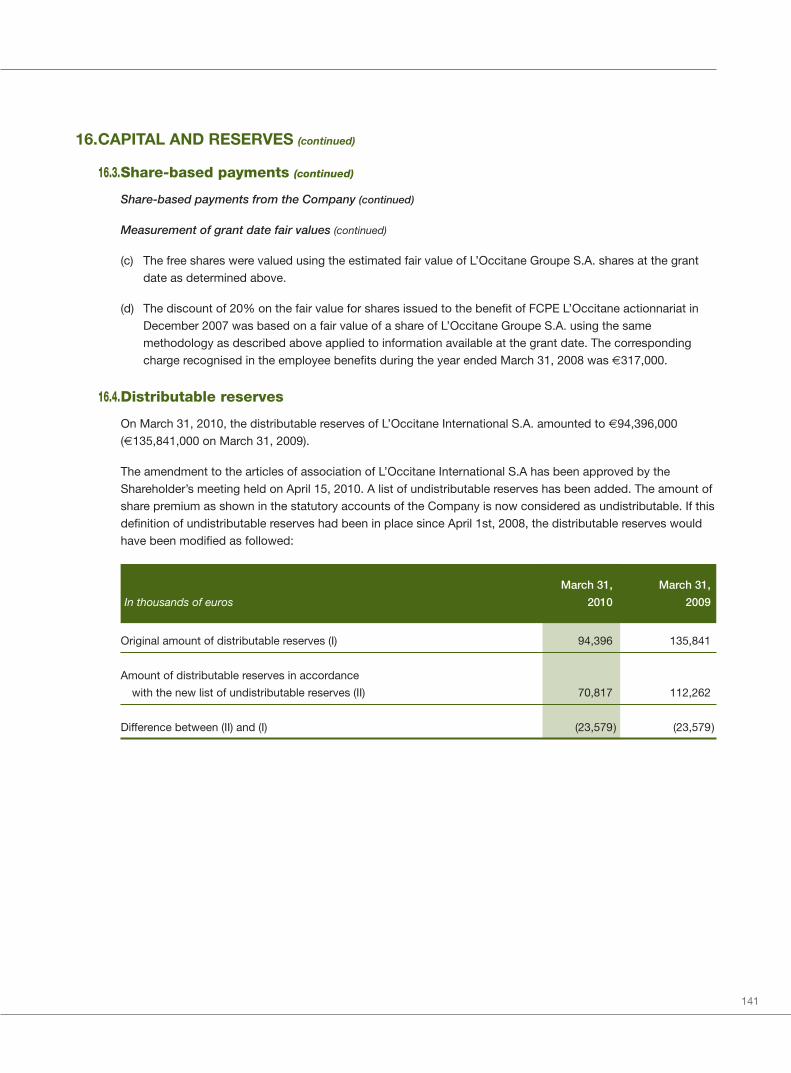
141
16.CAPITAL AND RESERVES (continued)
16.3.Share-based payments (continued)
Share-based payments from the Company (continued)
Measurement of grant date fair values (continued)
(c) The free shares were valued using the estimated fair value of L’Occitane Groupe S.A. shares at the grantdate as determined above.
(d) The discount of 20% on the fair value for shares issued to the benefit of FCPE L’Occitane actionnariat inDecember 2007 was based on a fair value of a share of L’Occitane Groupe S.A. using the samemethodology as described above applied to information available at the grant date. The correspondingcharge recognised in the employee benefits during the year ended March 31, 2008 was €317,000.
16.4.Distributable reserves
On March 31, 2010, the distributable reserves of L’Occitane International S.A. amounted to €94,396,000(€135,841,000 on March 31, 2009).
The amendment to the articles of association of L’Occitane International S.A has been approved by theShareholder’s meeting held on April 15, 2010. A list of undistributable reserves has been added. The amount ofshare premium as shown in the statutory accounts of the Company is now considered as undistributable. If thisdefinition of undistributable reserves had been in place since April 1st, 2008, the distributable reserves wouldhave been modified as followed:
March 31, March 31,
In thousands of euros 2010 2009
Original amount of distributable reserves (I) 94,396 135,841
Amount of distributable reserves in accordance
with the new list of undistributable reserves (II) 70,817 112,262
Difference between (II) and (I) (23,579) (23,579)
142
NOTES TO THE CONSOLIDATED FINANCIAL STATEMENTS (CONTINUED)
16.CAPITAL AND RESERVES (continued)
16.5.Dividend per share
On March 31, 2010, the Shareholders’ Meeting approved the distribution of €80,000,000 being €4.147 pershare. This distribution was conditional upon the approval of the interim financial information of the Companyon a stand alone basis under Luxembourg Generally Accepted Accounting Principles as at February 28, 2010.This interim financial information was approved by the Board of directors held for April 9, 2010. The dividendwas paid on May 4, 2010.
On September 30, 2009, the annual Shareholder’s Meeting approved the distribution of €32,000,000 being€1.659 per share which was paid before December 31, 2009.
During the year ended March 31, 2009, the dividend paid was €30,000,000 being €1.555 per share.
The dividend per share adjusted for the new par value of €0.03 as detailed in note 31 paid during the yearsended March 31, 2009 and 2010 is €0.024 and €0.025 respectively.
16.6.Additional paid in capital
Additional paid in capital includes:
• The additional paid in capital recognized in the statutory financial statements;
• The effect of valuing, at market value, the shares issued in exchange of acquisitions;
• The difference between the carrying amount net of tax and the nominal amount of the compound financialinstruments converted to equity on February 26, 2007.
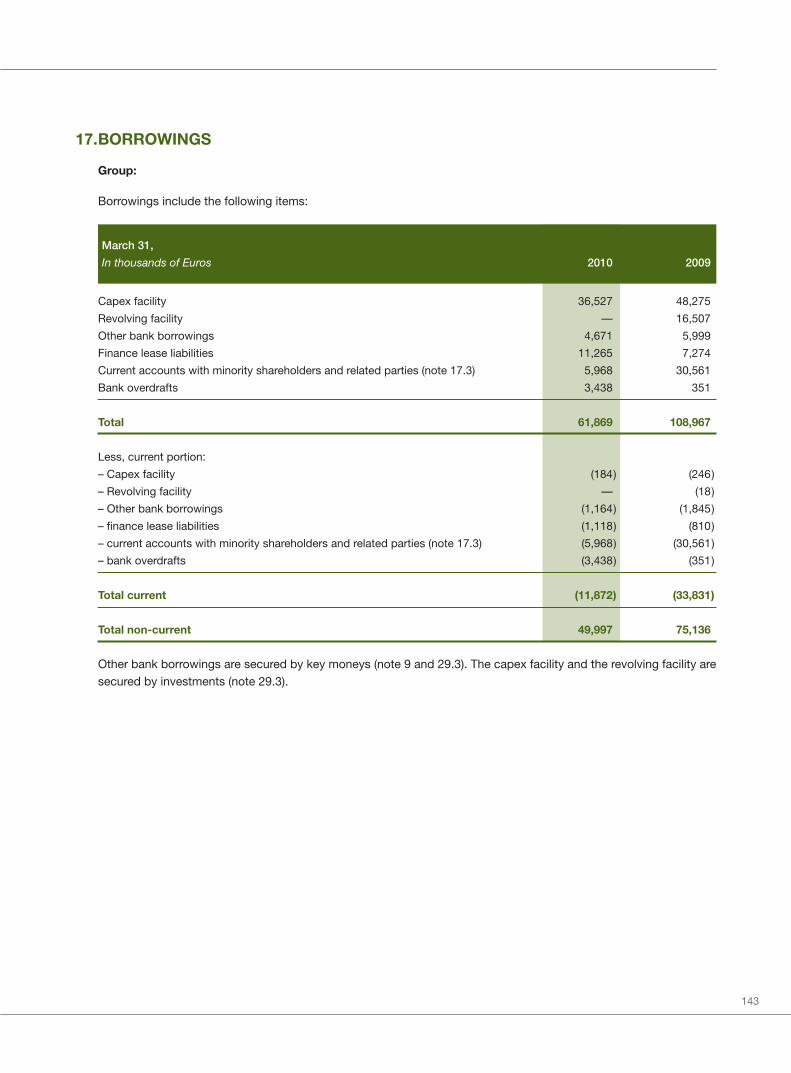
143
17.BORROWINGS
Group:
Borrowings include the following items:
March 31,
In thousands of Euros 2010 2009
Capex facility 36,527 48,275
Revolving facility — 16,507
Other bank borrowings 4,671 5,999
Finance lease liabilities 11,265 7,274
Current accounts with minority shareholders and related parties (note 17.3) 5,968 30,561
Bank overdrafts 3,438 351
Total 61,869 108,967
Less, current portion:
– Capex facility (184) (246)
– Revolving facility — (18)
– Other bank borrowings (1,164) (1,845)
– finance lease liabilities (1,118) (810)
– current accounts with minority shareholders and related parties (note 17.3) (5,968) (30,561)
– bank overdrafts (3,438) (351)
Total current (11,872) (33,831)
Total non-current 49,997 75,136
Other bank borrowings are secured by key moneys (note 9 and 29.3). The capex facility and the revolving facility aresecured by investments (note 29.3).
144
NOTES TO THE CONSOLIDATED FINANCIAL STATEMENTS (CONTINUED)
17.BORROWINGS (continued)
Company
Borrowings include the following items:
March 31,
In thousands of Euros 2010 2009
Capex facility 11,386 26,122
Revolving facility — 9,498
Other bank borrowings 1,055 —
Current accounts (financing from parent) — 21,880
Bank overdrafts 3,417 —
Total 15,858 57,500
Less, current portion:
– Capex facility (45) (95)
– Revolving facility — (8)
– Other bank borrowings (4) —
– current accounts (financing from parent) — (21,880)
– Bank overdrafts (3,417) —
Total current (3,466) (21,983)
Total non-current 12,391 35,517

145
17.BORROWINGS (continued)
17.1.Maturity of non-current borrowings
For the year ended March 31, 2010 and 2009, maturity of non-current borrowings, excluding current portion,can be broken down as follows:
Between 1 Between 2
In thousands of Euros and 2 years and 5 years Over 5 years Total
Capex facility 9,085 27,258 — 36,343
Revolving facility — — — —
Other bank borrowings 1,022 2,485 — 3,507
Finance lease liabilities 1,100 3,420 5,627 10,147
Maturity on March 31, 2010 11,207 33,163 5,627 49,997
Capex facility — 35,651 12,378 48,029
Revolving facility — — 16,489 16,489
Other bank borrowings 1,129 2,438 588 4,155
Finance lease liabilities 813 2,543 3,108 6,464
Maturity on March 31, 2009 1,942 40,632 32,563 75,137

146
NOTES TO THE CONSOLIDATED FINANCIAL STATEMENTS (CONTINUED)
17.BORROWINGS (continued)
17.2.Senior credit facilities agreement
On July 4 2007, the Company, its parent company and it subsidiary L’Occitane S.A. entered into a senior creditfacilities agreement for the amount in principal of €280,000,000, made up of:
• A capex facility of €50 million with a maturity of 7 years that can be drawn only by L’Occitane InternationalS.A. or L’Occitane S.A.. This facility was drawn in the following currencies at the end of the following fiscalyear ended:
March 31,
In thousands of Euros 2010 2009
Drawn by L’Occitane S.A.
EUR 25,000 22,000
Drawn by L’Occitane International S.A.
JPY — 7,433
GBP 1,124 2,041
USD 7,419 14,277
AUD 2,798 2,277
Capex facility – nominal value 36,341 48,028
Accrued interests 186 247
Capex facility 36,527 48,275

147
17.BORROWINGS (continued)
17.2.Senior credit facilities agreement (continued)
• A multi-currency revolving facility of €25 million granted for a period of 7 years that can be drawn only byL’Occitane International S.A. or L’Occitane S.A.. This facility was drawn in the following currencies at theend of the following fiscal year ended:
March 31,
In thousands of Euros 2010 2009
Drawn by L’Occitane S.A.EUR — 7,000Drawn by L’Occitane International S.A.JPY — 2,783GBP — 1,182USD — 4,809AUD — 716
Capex facility – nominal value — 16,490
Accrued interests 17
Capex facility — 16,507
• A senior loan of €205 million that can be drawn only by L’Occitane Groupe S.A.. An amount of €195 millionnet is drawn as at March 31, 2009. After a repayment of €20.75 million in April 2009, an amount of€174.25 million is drawn as at March 31, 2010. This loan is secured by a pledge on 100% of theCompany’s shares.
The capex and revolving facilities are secured by a pledge on respectively 100% of L’Occitane S.A. shares and100% of Les Relais L’Occitane France shares (note 29.3). In addition, L’Occitane Groupe S.A. granted aguarantee (“caution solidaire”) on the Group’s borrowings in relation to the capex or revolving facilities abovementioned.

148
NOTES TO THE CONSOLIDATED FINANCIAL STATEMENTS (CONTINUED)
17.BORROWINGS (continued)
17.3.Current accounts with minority shareholders and related parties
Current accounts with minority shareholders and related parties concern:
March 31,
In thousands of Euros 2010 2009
Subsidiaries Minority shareholders and related parties
L’Occitane China (a) LS Holding Company Ltd. — 1,102
L’Occitane Mexico (note 30.4) Clarins Group 2,419 1,334
L’Occitane Korea (note 30.4) Clarins Group 1,502 1,475
L’Occitane Suisse (note 30.4) Clarins Group 1,190 1,165
L’Occitane Thailand Various individual minority shareholders 853 882
L’Occitane India Beauty Concepts Pvt Ltd. 4 —
L’Occitane Brazil (b) Shower — 104
Other Other — 93
Total current accounts with
minority shareholders and
related parties 5,968 6,155
Financing from parent
(note 30.4) and (c) — 24,406
Total current accounts 5,968 30,561
(a) On November 2, 2009, LS Holding Company Ltd has released and discharged the Group from theobligation to repay a portion of the loan. This has been recorded as an adjustment to the consideration topurchase the minority interests (note 6.2) and the goodwill was adjusted downward accordingly.
(b) Since the acquisition of minority interests in November 2009 (see note 6.1), this current account has beensettled.
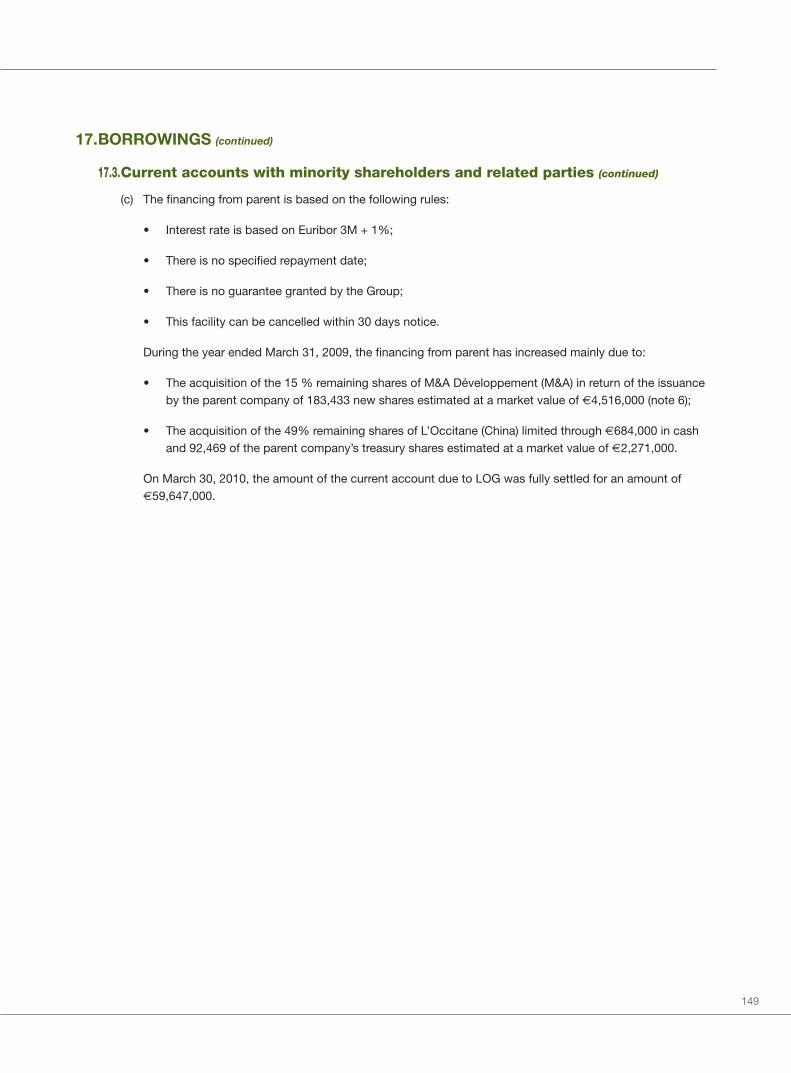
149
17.BORROWINGS (continued)
17.3.Current accounts with minority shareholders and related parties (continued)
(c) The financing from parent is based on the following rules:
• Interest rate is based on Euribor 3M + 1%;
• There is no specified repayment date;
• There is no guarantee granted by the Group;
• This facility can be cancelled within 30 days notice.
During the year ended March 31, 2009, the financing from parent has increased mainly due to:
• The acquisition of the 15 % remaining shares of M&A Développement (M&A) in return of the issuanceby the parent company of 183,433 new shares estimated at a market value of €4,516,000 (note 6);
• The acquisition of the 49% remaining shares of L’Occitane (China) limited through €684,000 in cashand 92,469 of the parent company’s treasury shares estimated at a market value of €2,271,000.
On March 30, 2010, the amount of the current account due to LOG was fully settled for an amount of€59,647,000.
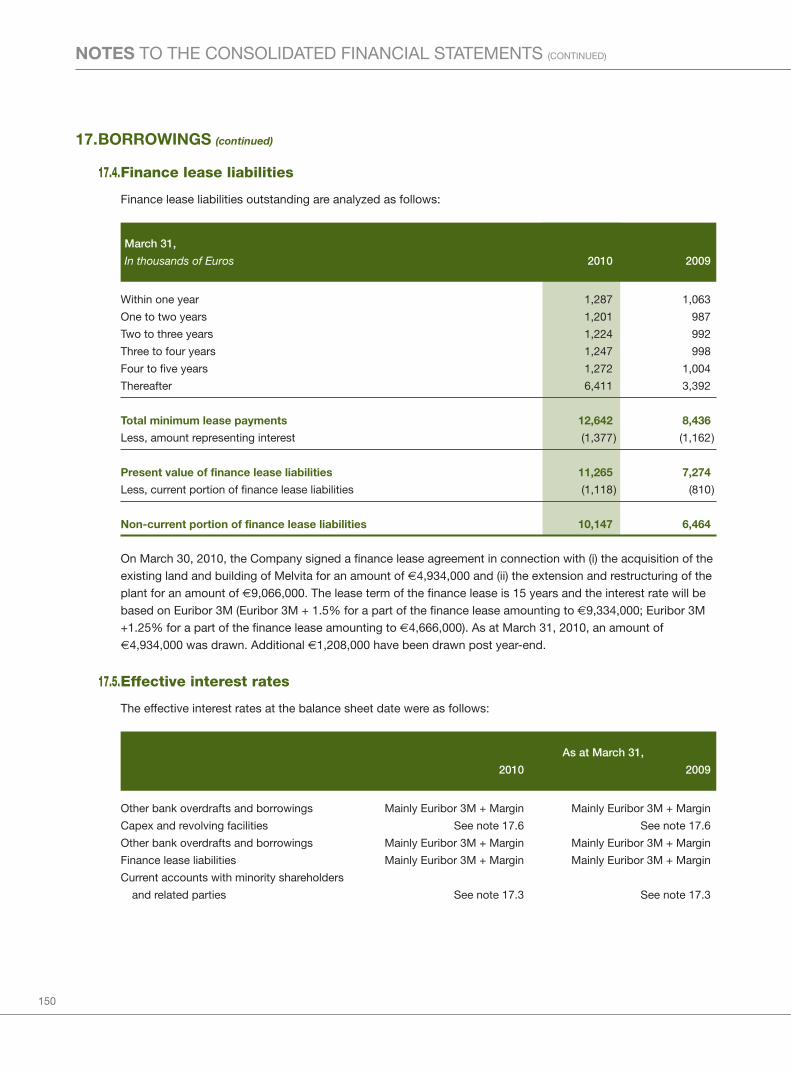
150
NOTES TO THE CONSOLIDATED FINANCIAL STATEMENTS (CONTINUED)
17.BORROWINGS (continued)
17.4.Finance lease liabilities
Finance lease liabilities outstanding are analyzed as follows:
March 31,
In thousands of Euros 2010 2009
Within one year 1,287 1,063
One to two years 1,201 987
Two to three years 1,224 992
Three to four years 1,247 998
Four to five years 1,272 1,004
Thereafter 6,411 3,392
Total minimum lease payments 12,642 8,436
Less, amount representing interest (1,377) (1,162)
Present value of finance lease liabilities 11,265 7,274
Less, current portion of finance lease liabilities (1,118) (810)
Non-current portion of finance lease liabilities 10,147 6,464
On March 30, 2010, the Company signed a finance lease agreement in connection with (i) the acquisition of theexisting land and building of Melvita for an amount of €4,934,000 and (ii) the extension and restructuring of theplant for an amount of €9,066,000. The lease term of the finance lease is 15 years and the interest rate will bebased on Euribor 3M (Euribor 3M + 1.5% for a part of the finance lease amounting to €9,334,000; Euribor 3M+1.25% for a part of the finance lease amounting to €4,666,000). As at March 31, 2010, an amount of€4,934,000 was drawn. Additional €1,208,000 have been drawn post year-end.
17.5.Effective interest rates
The effective interest rates at the balance sheet date were as follows:
As at March 31,
2010 2009
Other bank overdrafts and borrowings Mainly Euribor 3M + Margin Mainly Euribor 3M + Margin
Capex and revolving facilities See note 17.6 See note 17.6
Other bank overdrafts and borrowings Mainly Euribor 3M + Margin Mainly Euribor 3M + Margin
Finance lease liabilities Mainly Euribor 3M + Margin Mainly Euribor 3M + Margin
Current accounts with minority shareholders
and related parties See note 17.3 See note 17.3

151
17.BORROWINGS (continued)
17.6.Exposure to interest rate changes
Capex and revolving credit facilities
The capex and revolving facilities issued on July 4, 2007, include a repricing option. The interest rates dependon a covenant and are calculated every semester after the consolidated financial statements of L’OccitaneGroupe S.A. are issued.
The covenant is based on the leverage financial ratio: Consolidated net debt / EBITDA. For the measurement ofthis ratio, which is based on the consolidated financial statements of L’Occitane Groupe S.A., the definitions tobe used are as follows:
• Consolidated net debt: current and non-current borrowings (excluding subordinated loan of L’OccitaneGroupe S.A.) minus cash and cash equivalents
• EBITDA: operating profit before depreciation, amortization and impairment, before net movements inprovisions for other liabilities and before allowance for inventories and trade receivables and before anyother allowance.
The change in the above ratio results in repricing the interest rate as follows:
Leverage financial ratio Capex and revolving facilities
Ratio being higher or equal than 2.4 Euribor 3M + Margin
Ratio being comprised between 1.9 and 2.4: Euribor 3M + Margin -0.1
Ratio being comprised between 1.4 and 1.9: Euribor 3M + Margin -0.2
Ratio being comprised between 1.0 and 1.4: Euribor 3M + Margin -0.25
Ratio being lower than 1.0: Euribor 3M + Margin -0.3
During the fiscal year ended March 31, 2008, the interest rate was based on Euribor 3M + Margin.
On March 31, 2008 the ratio amounted to 2.12, therefore the rate used from July 2008 was based on Euribor3M + Margin -0.1.
On March 31, 2009, the ratio amounted to 2.26, therefore the rate used from July 2009 is based on Euribor3M+ margin -0.1. On September 30, 2009, the unaudited ratio amounted to 1.75 and the rate to be used fromJanuary 2010 is based on Euribor 3M + margin – 0.2.

152
NOTES TO THE CONSOLIDATED FINANCIAL STATEMENTS (CONTINUED)
17.BORROWINGS (continued)
17.7.Exposure to debt covenants
Capex and revolving facilities
Event of default resulting in the early repayment of the Capex and Revolving facilities issued on July 4, 2007depends on 2 ratios based on L’Occitane Groupe S.A. consolidated financial statements (issued eachsemester): the Leverage financial ratio and the Finance cost coverage ratio.
Leverage financial ratio
For the purpose of debt covenant, the leverage financial ratio is calculated as follows: Consolidated net debt /EBITDA. For the measurement of this ratio, the definitions to be used are as follows:
• Consolidated net debt: current and non-current borrowings (excluding subordinated loan of L’OccitaneGroupe S.A.) – cash and cash equivalents
• EBITDA: operating profit before depreciation, amortization and impairment, before net movements inprovisions for other liabilities and before allowance for inventories and trade receivables and before anyother allowance.
According to the agreement, the leverage financial ratio should be lower than:
• 3.75 for the year ending March 31, 2008;
• 3.50 for the half-year ending September 30, 2008;
• 3.25 for the year ending March 31, 2009;
• 3.00 for the half-year ending September 30, 2009;
• 2.75 for the year ending March 31, 2010;
• 2.50 for the half-year ending September 30, 2010 and the following 6-months periods.
The unaudited Leverage financial ratio on September 30, 2009 amounted to 1.75 (2.26 on March 31, 2009).
On December 15, 2008, the Group re-negotiated the terms of the senior credit facilities. Characteristicsremained unchanged except mainly for:
• The leverage financial ratio that should be lower than 2.75 for the half-year ending September 30, 2010 andthe following 6-months periods;
• Reimbursement events were redefined to exclude the listing of the Group and more generally theagreement was modified to allow potential listing of the Group and to determine the use of the proceeds,
• Reduction on constraints made on investments

153
17.BORROWINGS (continued)
17.7.Exposure to debt covenants (continued)
Finance costs coverage ratio
This ratio was calculated as EBITDA (as defined above) divided by finance costs (only paid).
According to the agreement, the finance costs coverage ratio should be higher than:
• 4.00 for the year ending March 31, 2008;
• 4.25 for the half-year ending September 30, 2008;
• 4.50 for the year ending March 31, 2009;
• 5.00 for the half-year ending September 30, 2009 and the following 6-months periods.
The unaudited finance costs coverage ratio on September 30, 2009 amounted to 6.08 (6.09 on March 31,2009).
17.8.Denomination in currencies
The carrying amounts of the Group’s borrowings are denominated in the following currencies:
March 31,
In thousands of Euros 2010 2009
Euro 42,334 67,207
US dollar 9,849 19,086
Japanese Yen — 10,216
Sterling Pound 1,124 3,223
Australian dollar 2,798 2,992
Swiss Franc 1,581 1,165
Mexican Peso — 1,334
Canadian Dollar 3,363 —
Other currencies 820 3,745
Total 61,869 108,968
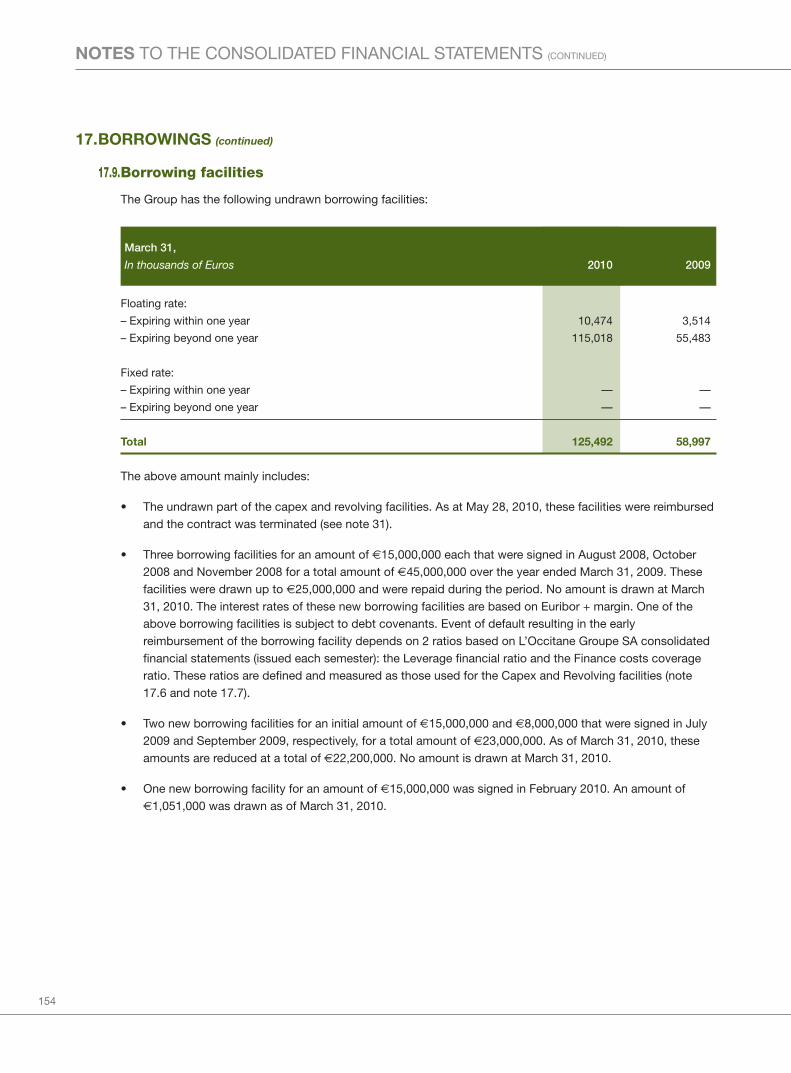
154
NOTES TO THE CONSOLIDATED FINANCIAL STATEMENTS (CONTINUED)
17.BORROWINGS (continued)
17.9.Borrowing facilities
The Group has the following undrawn borrowing facilities:
March 31,
In thousands of Euros 2010 2009
Floating rate:
– Expiring within one year 10,474 3,514
– Expiring beyond one year 115,018 55,483
Fixed rate:
– Expiring within one year — —
– Expiring beyond one year — —
Total 125,492 58,997
The above amount mainly includes:
• The undrawn part of the capex and revolving facilities. As at May 28, 2010, these facilities were reimbursedand the contract was terminated (see note 31).
• Three borrowing facilities for an amount of €15,000,000 each that were signed in August 2008, October2008 and November 2008 for a total amount of €45,000,000 over the year ended March 31, 2009. Thesefacilities were drawn up to €25,000,000 and were repaid during the period. No amount is drawn at March31, 2010. The interest rates of these new borrowing facilities are based on Euribor + margin. One of theabove borrowing facilities is subject to debt covenants. Event of default resulting in the earlyreimbursement of the borrowing facility depends on 2 ratios based on L’Occitane Groupe SA consolidatedfinancial statements (issued each semester): the Leverage financial ratio and the Finance costs coverageratio. These ratios are defined and measured as those used for the Capex and Revolving facilities (note17.6 and note 17.7).
• Two new borrowing facilities for an initial amount of €15,000,000 and €8,000,000 that were signed in July2009 and September 2009, respectively, for a total amount of €23,000,000. As of March 31, 2010, theseamounts are reduced at a total of €22,200,000. No amount is drawn at March 31, 2010.
• One new borrowing facility for an amount of €15,000,000 was signed in February 2010. An amount of€1,051,000 was drawn as of March 31, 2010.
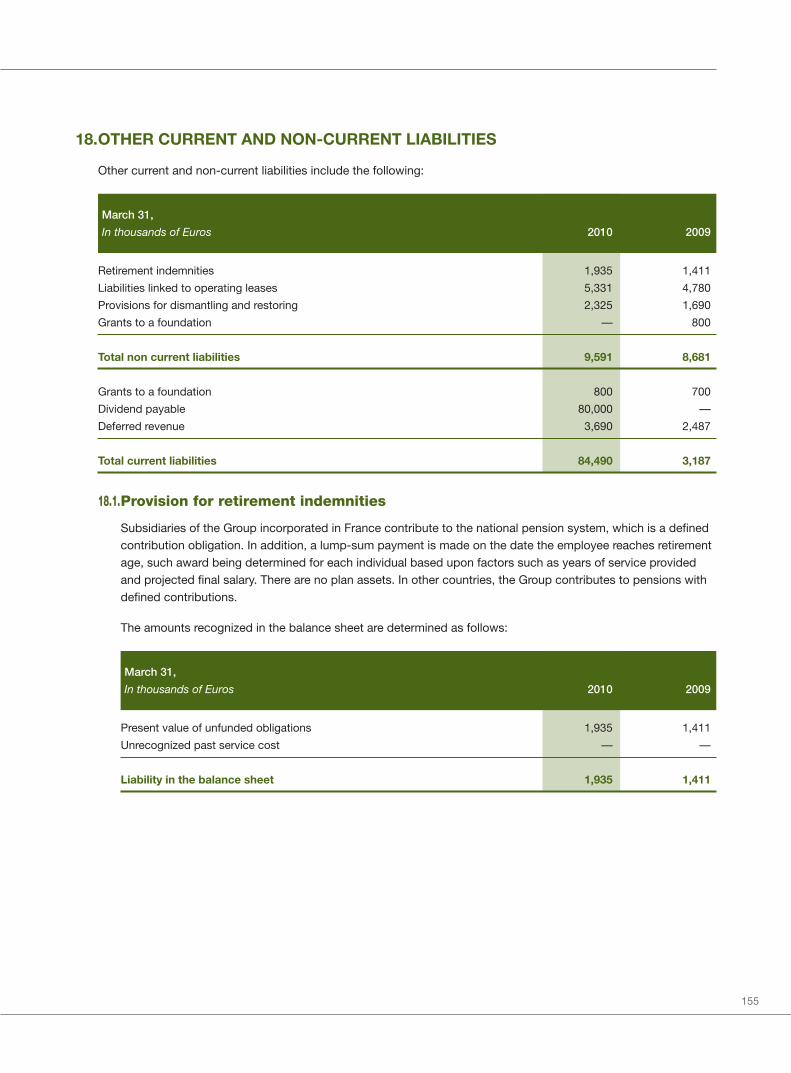
155
18.OTHER CURRENT AND NON-CURRENT LIABILITIES
Other current and non-current liabilities include the following:
March 31,
In thousands of Euros 2010 2009
Retirement indemnities 1,935 1,411
Liabilities linked to operating leases 5,331 4,780
Provisions for dismantling and restoring 2,325 1,690
Grants to a foundation — 800
Total non current liabilities 9,591 8,681
Grants to a foundation 800 700
Dividend payable 80,000 —
Deferred revenue 3,690 2,487
Total current liabilities 84,490 3,187
18.1.Provision for retirement indemnities
Subsidiaries of the Group incorporated in France contribute to the national pension system, which is a definedcontribution obligation. In addition, a lump-sum payment is made on the date the employee reaches retirementage, such award being determined for each individual based upon factors such as years of service providedand projected final salary. There are no plan assets. In other countries, the Group contributes to pensions withdefined contributions.
The amounts recognized in the balance sheet are determined as follows:
March 31,
In thousands of Euros 2010 2009
Present value of unfunded obligations 1,935 1,411
Unrecognized past service cost — —
Liability in the balance sheet 1,935 1,411
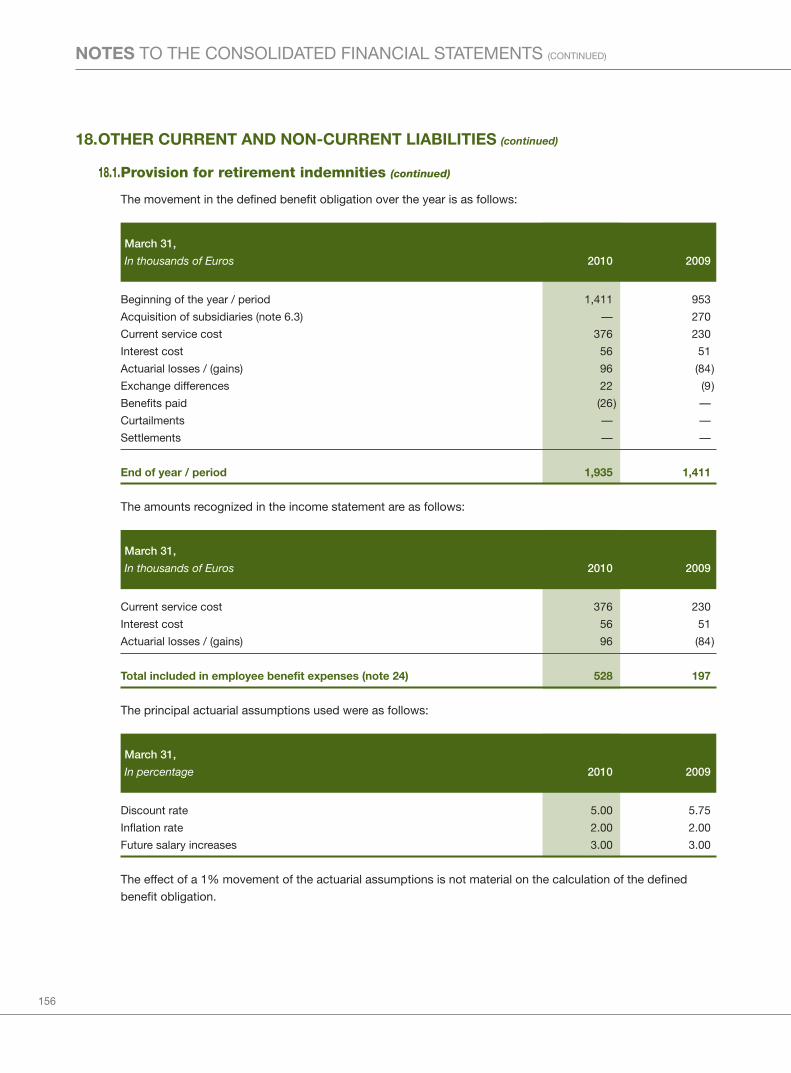
156
NOTES TO THE CONSOLIDATED FINANCIAL STATEMENTS (CONTINUED)
18.OTHER CURRENT AND NON-CURRENT LIABILITIES (continued)
18.1.Provision for retirement indemnities (continued)
The movement in the defined benefit obligation over the year is as follows:
March 31,
In thousands of Euros 2010 2009
Beginning of the year / period 1,411 953
Acquisition of subsidiaries (note 6.3) — 270
Current service cost 376 230
Interest cost 56 51
Actuarial losses / (gains) 96 (84)
Exchange differences 22 (9)
Benefits paid (26) —
Curtailments — —
Settlements — —
End of year / period 1,935 1,411
The amounts recognized in the income statement are as follows:
March 31,
In thousands of Euros 2010 2009
Current service cost 376 230
Interest cost 56 51
Actuarial losses / (gains) 96 (84)
Total included in employee benefit expenses (note 24) 528 197
The principal actuarial assumptions used were as follows:
March 31,
In percentage 2010 2009
Discount rate 5.00 5.75
Inflation rate 2.00 2.00
Future salary increases 3.00 3.00
The effect of a 1% movement of the actuarial assumptions is not material on the calculation of the definedbenefit obligation.

157
18.OTHER CURRENT AND NON-CURRENT LIABILITIES (continued)
18.2.Liabilities linked to operating leases
The liabilities linked to operating leases are related to:
• The impact of recognizing the lease payment as an expense on a straight-line basis (note 2.24);
• Incentives received from the lessors at the inception of the lease, which are recognized pro-rata over thelease term (note 2.24).
18.3.Provision for dismantling and restoring
As at March 31, 2010, provisions for dismantling and restoring costs are as follows:
Provisions
Provisions recorded as
recorded in a component Unused
March 31, the statement of tangible amounts Used during Exchange March 31,
In thousands of Euros 2009 of income fixed assets reversed the year differences 2010
Provisions recorded over
the lenght of the lease 290 129 — (5 ) — 11 425
Provisions recorded at the
inception of the lease 1,400 — 423 (55 ) — 132 1,900
Total 1,690 129 423 (60 ) — 143 2,325
As at March 31, 2009, provisions for dismantling and restoring costs are as follows:
Provisions
Provisions recorded as
recorded in a component Unused
March 31, the statement of tangible amounts Used during Exchange March 31,
In thousands of Euros 2008 of income fixed assets reversed the year differences 2009
Provisions recorded over
the lenght of the lease — 282 — — — 8 290
Provisions recorded at the
inception of the lease — — 1,358 — — 42 1,400
Total — 282 1,358 — — 50 1,690
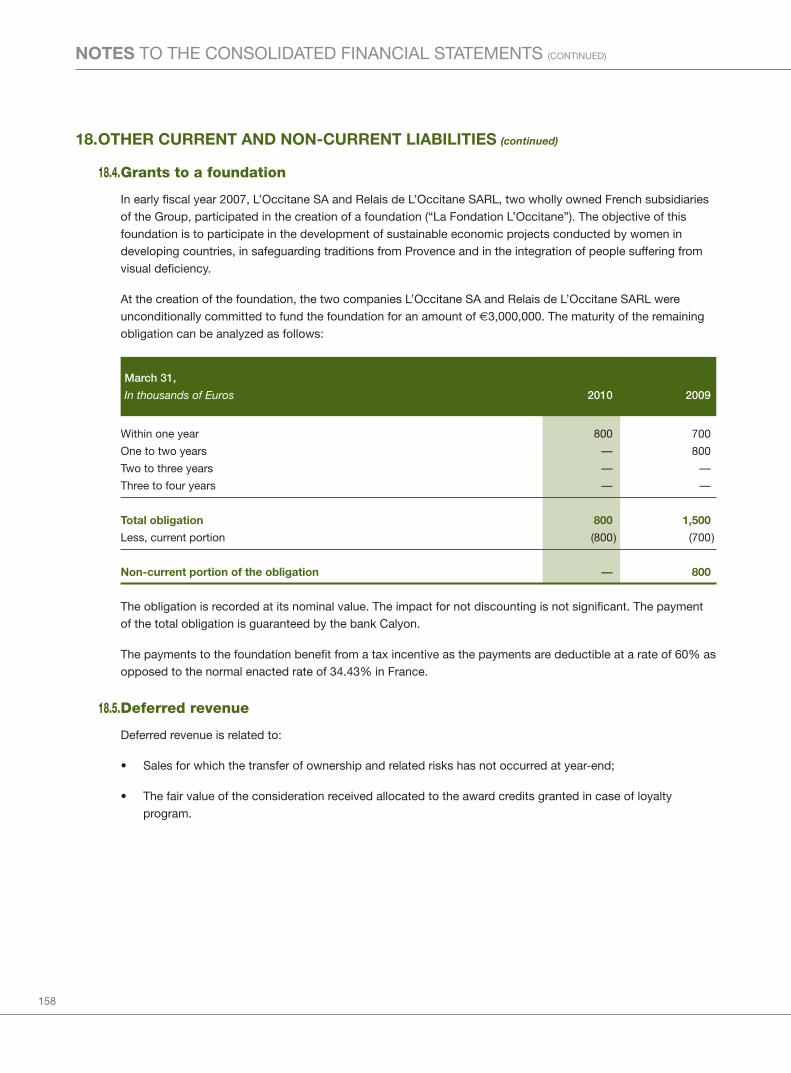
158
NOTES TO THE CONSOLIDATED FINANCIAL STATEMENTS (CONTINUED)
18.OTHER CURRENT AND NON-CURRENT LIABILITIES (continued)
18.4.Grants to a foundation
In early fiscal year 2007, L’Occitane SA and Relais de L’Occitane SARL, two wholly owned French subsidiariesof the Group, participated in the creation of a foundation (“La Fondation L’Occitane”). The objective of thisfoundation is to participate in the development of sustainable economic projects conducted by women indeveloping countries, in safeguarding traditions from Provence and in the integration of people suffering fromvisual deficiency.
At the creation of the foundation, the two companies L’Occitane SA and Relais de L’Occitane SARL wereunconditionally committed to fund the foundation for an amount of €3,000,000. The maturity of the remainingobligation can be analyzed as follows:
March 31,
In thousands of Euros 2010 2009
Within one year 800 700
One to two years — 800
Two to three years — —
Three to four years — —
Total obligation 800 1,500
Less, current portion (800) (700)
Non-current portion of the obligation — 800
The obligation is recorded at its nominal value. The impact for not discounting is not significant. The paymentof the total obligation is guaranteed by the bank Calyon.
The payments to the foundation benefit from a tax incentive as the payments are deductible at a rate of 60% asopposed to the normal enacted rate of 34.43% in France.
18.5.Deferred revenue
Deferred revenue is related to:
• Sales for which the transfer of ownership and related risks has not occurred at year-end;
• The fair value of the consideration received allocated to the award credits granted in case of loyaltyprogram.
159
19.TRADE PAYABLES
The credit terms granted by the domestic suppliers to the production subsidiaries and to the distributionsubsidiaries were usually 80 to 110 days and 30 to 60 days, respectively. The average credit terms granted by theoverseas suppliers to the distribution subsidiaries were usually 30 days.
Ageing analysis of trade payables from due date at the respective balance sheet date is as follows:
March 31,
In thousands of Euros 2010 2009
Current and past due within 3 months 59,489 50,157
Past due from 3 to 6 months 233 278
Past due from 6 to 12 months 118 176
Past due over 12 months 100 91
Trade payables 59,940 50,702
20.PROVISIONS FOR OTHER LIABILITIES AND CHARGES
Within the normal framework of their activities, the Group and its subsidiaries are subject to various forms oflitigation and legal proceedings. The Group sets aside a provision based on its past experience and on facts andcircumstances known at the balance sheet date. The provision charge is recognized in the statement of incomewithin “General and administrative expenses”. When the date of the utilization is not reliably measurable, theprovisions are not discounted and are classified in current liabilities. The impact for not discounting is notsignificant.
Social litigation relates mainly to litigations with employees in relation to staff benefits or potential claims from socialsecurity administrations authorities.
Commercial claims relate mainly to claims from distributors.
In the director’s opinion, after taking appropriate legal advice, the outcome of these legal claims will not give rise toany significant loss beyond the amounts provided at each balance sheet date.
No reimbursement is expected in connection with these provisions and accordingly no corresponding asset wasrecognized.
160
NOTES TO THE CONSOLIDATED FINANCIAL STATEMENTS (CONTINUED)
20.PROVISIONS FOR OTHER LIABILITIES AND CHARGES (continued)
20.1.Year ended March 31, 2010
As at March 31, 2010, provisions for other liabilities and charges can be analyzed as follows:
Unused Used
March 31, Additional amounts during Exchange March 31,
In thousands of Euros 2009 provisions reversed the year differences 2010
Social litigations 1,477 515 (590) (25) 361 1,738
Commercial claims 183 411 (140) (72) 6 388
Onerous contracts — 1,513 — — 66 1,579
Tax risks — 465 — — 41 506
Total 1,660 2,904 (730) (97) 474 4,211
The increase in the provision for onerous contract is related to operating lease contracts of stores (note 2.18).
The provisions reversed unused are mainly due to statute of limitation of certain risks.
20.2.Year ended March 31, 2009
As of March 31, 2009, provisions for other liabilities and charges can be analyzed as follows:
Unused Used
March 31, Additional amounts during Exchange March 31,
In thousands of Euros 2008 provisions reversed the year differences 2009
Social litigations 2,256 114 (295) (521) (77) 1,477
Commercial claims 61 442 (23) (296) (1) 183
Total 2,317 556 (318) (817) (78) 1,660
161
21.DIRECT COSTS RELATED TO THE PROJECTED IPO – NET
During the fiscal year ended March 31, 2009, the Group has conducted an IPO project which has been postponeddue to adverse market conditions in October 2008.
Transactions costs (external and incremental costs directly attributable to the project) incurred during the periodand related to this project were expensed for an amount of €1,996,000, as the achievement of the IPO project wasnot probable in the foreseeable future and as the future economic benefits were questioned due to the time that haselapsed since the costs have been incurred. They are classified in general and administrative expenses in theoperating profit in the statement of income. The total costs amounted to €3,986,000 and were partly recharged toL’Occitane Groupe S.A. the parent company, for an amount of €1,990,000.
In September 2009, the Group has decided to resume the IPO project. The total incremental transaction costsrelated to the new project amounted to €3,542,000 as at March 31, 2010. The accounting treatment of these costsis as follows:
• the costs associated with the listing of new shares amounting to €1,771,000 are recorded as a reduction toequity for €1,265,000 net of tax.;
• the costs allocated to the listing of existing shares amounting to €1,771,000 have been recharged toL’Occitane Groupe SA (note 30.2).
162
NOTES TO THE CONSOLIDATED FINANCIAL STATEMENTS (CONTINUED)
22.EXPENSES BY NATURE
Expenses by nature include the following amounts:
March 31,
In thousands of Euros 2010 2009
Employee benefit expenses 159,961 136,303
Rent and occupancy 105,010 83,734
Advertising costs 49,740 49,159
Raw materials and consumables used 69,329 71,820
Professional fees (1) 28,131 28,045
Depreciation, amortization and impairment (note 27.3) 26,725 23,370
Transportation expenses 15,253 21,819
Change in inventories of finished goods and work in progress 10,267 (16,327)
Other expenses 40,515 59,766
Total cost of sales, distribution expenses, marketing expenses, general andadministrative expenses and direct costs related to the projected IPO-net 504,931 457,689
(1) Professional fees include mainly payments made to lawyers, auditors, accountants, marketing agencies anddirect costs related to the first projected IPO (see note 21).
Rent and occupancy include the minimum lease payments for operating leases, contingent rents (variable rentsbased on sales) and other charges related to these leases.
Employee benefits include the following amounts:
March 31,
In thousands of Euros 2010 2009
Wages, salaries and bonus 130,512 110,868
Share-based payments 1,963 713
Social security 25,814 23,800
Post employment benefit (note 18) 894 197
Others 778 725
Total employee benefits 159,961 136,303
Workforce (full time equivalent) 4,573 4,292
Wages, salaries and bonus include the cost of temporary staff.
The Group’s workforce is expressed as the number of employees at the end of the period.

163
23.FINANCE COSTS, NET
Finance costs, net consist of the following:
March 31,
In thousands of Euros 2010 2009
Interest on cash and cash equivalent 121 130
Fair value gains on derivatives (note 14) 28 76
Finance income 149 206
Interest expense:
– Interest on other borrowings (847) (1,638)
– Interest on capex facility (1,238) (1,743)
– Interest on revolving facility (148) (523)
– Interest on finance lease (303) (281)
– Interest on financing from parent (666) (925)
– Unwinding of discount on financial liabilities (note 6.4) (359) (595)
Fair value losses on derivatives (note 14) (117) (357)
Finance costs (3,678) (6,062)
Finance costs, net (3,529) (5,856)
The interest expense on other borrowings is related to other bank borrowings, current account with minorityshareholders and related parties (excluding financing from parent) and bank overdrafts.
On March 31, 2010, the interests paid amount to €3,542,000 (€4,755,000 on March 31, 2009).
24.FOREIGN CURRENCY GAINS / (LOSSES)
Foreign currency gains / (losses) consist of the following:
March 31,
In thousands of Euros 2010 2009
Foreign exchange differences 6,658 (482)
Fair value gains on derivatives (note 14) (1,184) 2,159
Foreign currency gains / (losses) 5,474 1,677
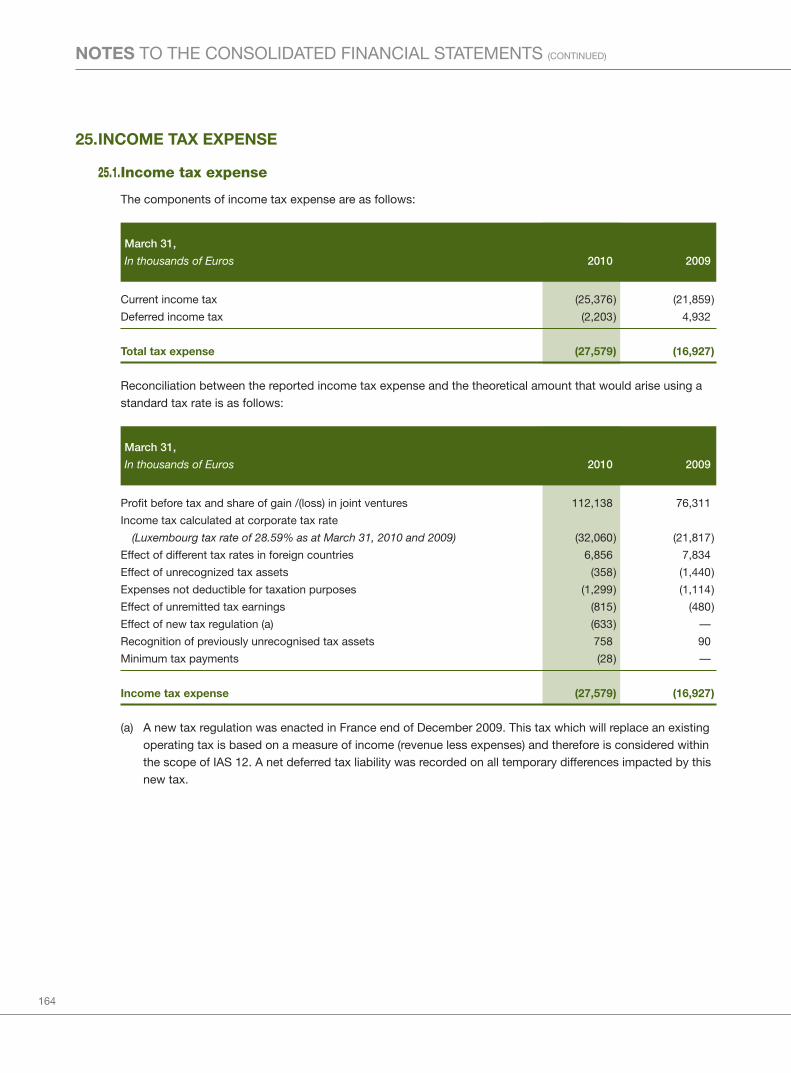
164
NOTES TO THE CONSOLIDATED FINANCIAL STATEMENTS (CONTINUED)
25.INCOME TAX EXPENSE
25.1.Income tax expense
The components of income tax expense are as follows:
March 31,
In thousands of Euros 2010 2009
Current income tax (25,376) (21,859)
Deferred income tax (2,203) 4,932
Total tax expense (27,579) (16,927)
Reconciliation between the reported income tax expense and the theoretical amount that would arise using astandard tax rate is as follows:
March 31,
In thousands of Euros 2010 2009
Profit before tax and share of gain /(loss) in joint ventures 112,138 76,311
Income tax calculated at corporate tax rate
(Luxembourg tax rate of 28.59% as at March 31, 2010 and 2009) (32,060) (21,817)
Effect of different tax rates in foreign countries 6,856 7,834
Effect of unrecognized tax assets (358) (1,440)
Expenses not deductible for taxation purposes (1,299) (1,114)
Effect of unremitted tax earnings (815) (480)
Effect of new tax regulation (a) (633) —
Recognition of previously unrecognised tax assets 758 90
Minimum tax payments (28) —
Income tax expense (27,579) (16,927)
(a) A new tax regulation was enacted in France end of December 2009. This tax which will replace an existingoperating tax is based on a measure of income (revenue less expenses) and therefore is considered withinthe scope of IAS 12. A net deferred tax liability was recorded on all temporary differences impacted by thisnew tax.
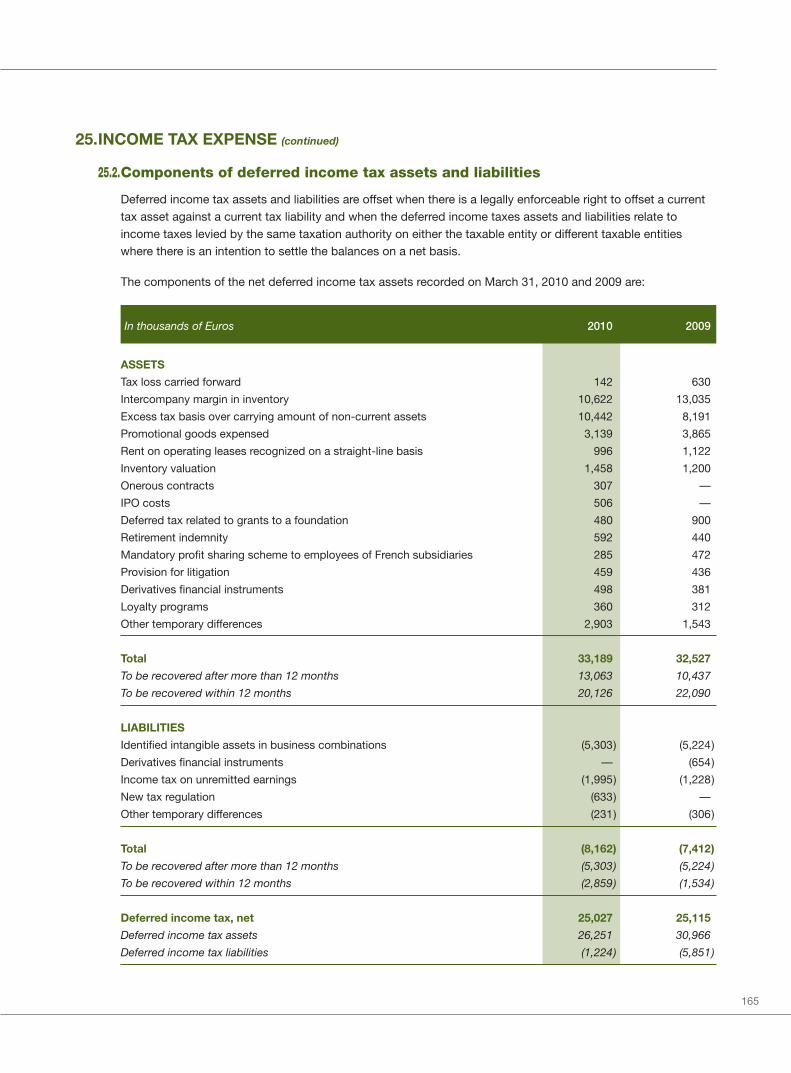
165
25.INCOME TAX EXPENSE (continued)
25.2.Components of deferred income tax assets and liabilities
Deferred income tax assets and liabilities are offset when there is a legally enforceable right to offset a currenttax asset against a current tax liability and when the deferred income taxes assets and liabilities relate toincome taxes levied by the same taxation authority on either the taxable entity or different taxable entitieswhere there is an intention to settle the balances on a net basis.
The components of the net deferred income tax assets recorded on March 31, 2010 and 2009 are:
In thousands of Euros 2010 2009
ASSETS
Tax loss carried forward 142 630
Intercompany margin in inventory 10,622 13,035
Excess tax basis over carrying amount of non-current assets 10,442 8,191
Promotional goods expensed 3,139 3,865
Rent on operating leases recognized on a straight-line basis 996 1,122
Inventory valuation 1,458 1,200
Onerous contracts 307 —
IPO costs 506 —
Deferred tax related to grants to a foundation 480 900
Retirement indemnity 592 440
Mandatory profit sharing scheme to employees of French subsidiaries 285 472
Provision for litigation 459 436
Derivatives financial instruments 498 381
Loyalty programs 360 312
Other temporary differences 2,903 1,543
Total 33,189 32,527
To be recovered after more than 12 months 13,063 10,437
To be recovered within 12 months 20,126 22,090
LIABILITIES
Identified intangible assets in business combinations (5,303) (5,224)
Derivatives financial instruments — (654)
Income tax on unremitted earnings (1,995) (1,228)
New tax regulation (633) —
Other temporary differences (231) (306)
Total (8,162) (7,412)
To be recovered after more than 12 months (5,303) (5,224)
To be recovered within 12 months (2,859) (1,534)
Deferred income tax, net 25,027 25,115
Deferred income tax assets 26,251 30,966
Deferred income tax liabilities (1,224) (5,851)

166
NOTES TO THE CONSOLIDATED FINANCIAL STATEMENTS (CONTINUED)
25.INCOME TAX EXPENSE (continued)
25.2.Components of deferred income tax assets and liabilities (continued)
Deferred income tax assets are recognized to the extent that the realization of the related benefit through thefuture taxable profits is probable.
On March 31, 2010, the Group had tax losses of €6,063,000 to be carried over, generating a potential deferredtax asset of €1,814,000. These figures were €9,479,000 and €2,574,000 respectively, on March 31, 2009.
The use of the deferred tax assets will mainly depend upon the Group’s results from operations, which aredifficult to accurately predict in certain tax jurisdictions. The deferred income tax assets that were notrecognized on March 31, 2010, amount to €1,672,000 and €2,484,000 on March 31, 2009.
25.3.Movements in deferred tax assets and liabilities, net
The movement in deferred tax assets and liabilities, net during the year is as follows:
March 31,
In thousands of Euros 2010 2009
At the beginning of the year 25,115 24,349
(Charged) / credited to income, continuing operations (note 25.1) (2,203) 4,932
(Charged) / credited to equity 1,078 (19)
Acquisition of subsidiary (note 6.3) 327 (5,436)
Exchange differences 710 1,289
At the end of the year 25,027 25,115
As at March 31, 2010, the deferred income tax credited to equity related to:
• The effective portion of change in the fair value of derivatives designated as hedging instruments that wererecognized in equity (note 14): €572,000;
• The costs directly attributable to the issue of new shares (note 21): €506,000.
As at March 31, 2009, the deferred income tax charged to equity related to the effective portion of changes inthe fair value of derivatives designated as hedging instruments that were recognized in equity (note 14).
25.4.Income tax on unremitted earnings
Deferred income taxes on the unremitted earnings of the Group’s foreign subsidiaries and associates areprovided for unless the Group intends to indefinitely reinvest the earnings in the subsidiaries. The Group doesintend to indefinitely reinvest unremitted earnings of its foreign subsidiaries in most jurisdictions.
For certain subsidiaries that the Group does not intend to indefinitely reinvest unremitted earnings of theseforeign jurisdictions, the corresponding distribution of earnings may trigger taxes. Therefore, the Groupprovides for deferred income taxes on these earnings where distribution would trigger taxes. Thecorresponding deferred tax liability amounts to €1,995,000 on March 31, 2010 and €1,228,000 on March 31,2009.

167
26.EARNINGS PER SHARE
The Group applies the rules governing earnings per share as described in note 2.28 above. The reconciliationbetween basic earnings per share and diluted earnings per share is as follows:
March 31,
2010 2009
Profit for the year attributable to equity holders
of the Company (in thousands of Euros) 81,626 58,383
Weighted average number of ordinary shares in issue 19,290,674 19,290,674
Weighted average number of ordinary shares in
issue adjusted for the new par value of €0.03 1,274,396,391 1,274,396,391
Basic earnings per share (in € per share) 0.064 0.046
During the periods, the Group had no potential dilutive ordinary shares, nor share options or convertible debt.Therefore, the diluted earnings per share is equal to the basic earnings per share.
Basic earnings per share
Basic earnings per share are calculated by dividing the profit attributable to equity holders of the Company by theweighted average number of ordinary shares in issue during the year. The weighted average number of ordinaryshares in issue is adjusted for the new par value of €0.03 as detailed in note 31.
Diluted earnings per share
Diluted earnings per share are calculated by adjusting the weighted average number of ordinary shares outstandingto assume conversion of all dilutive potential ordinary shares.
The diluted average number of shares is adjusted for the new par value of €0.03 as detailed in note 31.

168
NOTES TO THE CONSOLIDATED FINANCIAL STATEMENTS (CONTINUED)
27.SUPPLEMENTAL DISCLOSURE ON CASH FLOW INFORMATION
27.1.Cash paid for interest and income taxes
Cash paid for interest and income taxes are as follows:
March 31,
In thousands of Euros 2010 2009
Cash paid for:
– Interest net 3,542 4,755
– Income taxes 24,534 24,372
27.2.Proceeds from sale of assets
In the cash flow statement, proceeds from sale of assets comprise the following:
2010 2009
Disposal of
Property, Property, Oliviers & Co
March 31, Intangible plant and Intangible plant and Importaçao
In thousands of Euros assets equipment Total assets equipment Ltda Total
Disposals – Cost 760 6,931 7,691 301 6,352 68 6,721
Disposals – Accumulated
depreciation and amortization (718 ) (6,142 ) (6,860 ) (281 ) (5,951 ) — (6,232 )
Net book value (7), (9) 42 789 831 20 401 68 489
Profit / (loss) on sale of assets 2,500 (208 ) 2,292 506 (299 ) 46 253
Proceeds from sale of assets 2,542 581 3,123 526 102 114 742
On November 2, 2009, Oliviers and Co. LLC, L’Occitane Inc (the sellers, two fully owned subsidiaries of theGroup) and Oliviers & Co S.A (the buyer) have signed a transition and an asset purchase agreement. Thisagreement has been amended on December 17, 2009 and again on January 5, 2010. Following thesearrangements the current distribution agreement with Olivier & CO S.A. has been terminated and the assets offour stores have been transferred from the Group to Oliviers & Co S.A as at February 1, 2010 (the closing date).Five other stores owned by the Group have continued distributing Oliviers & Co products until March 31, 2010.A provision for onerous contract for an amount of €495,000 was recorded in connection with these five storesas at March 31, 2010. The consideration paid by Oliviers & Co S.A. to the Group for this agreement amount toapproximately €500,000 which may be increased to approximately €1,250,000 depending upon the renewal ofa lease. The net profit on this sale approximate the consideration as the carrying amount of the assets sold isclosed to zero. Inventories have also been transferred at the closing date for a consideration closed to their netcarrying amounts.
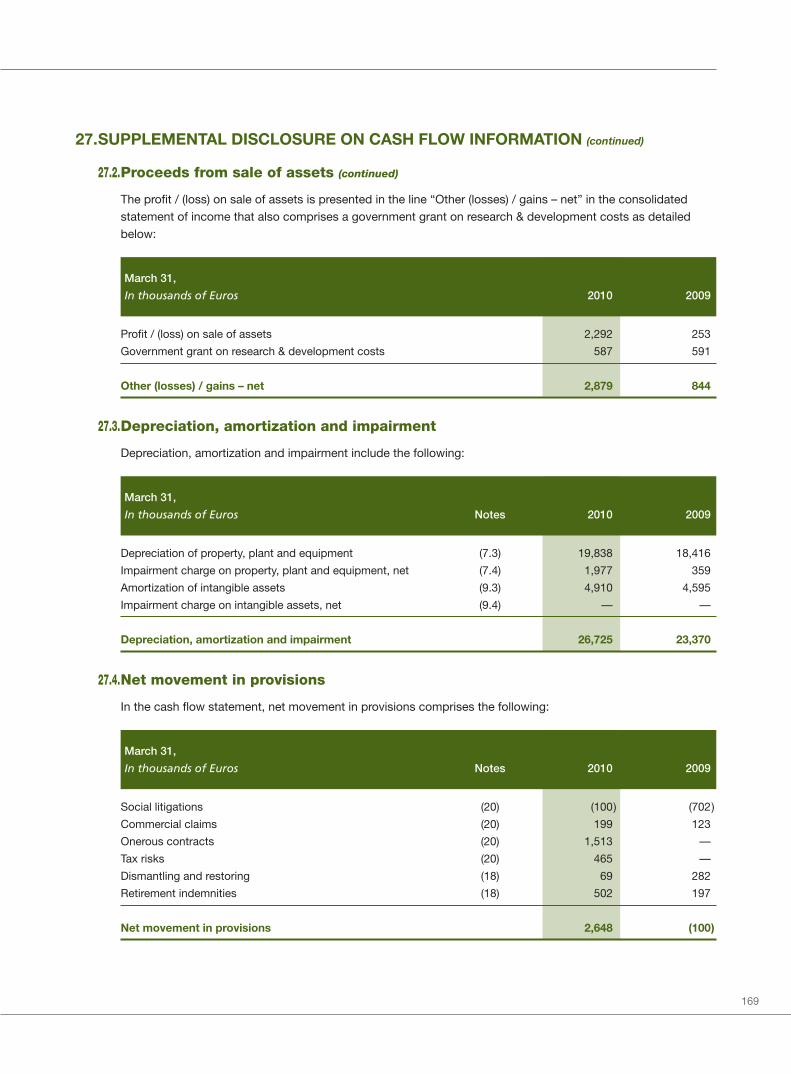
169
27.SUPPLEMENTAL DISCLOSURE ON CASH FLOW INFORMATION (continued)
27.2.Proceeds from sale of assets (continued)
The profit / (loss) on sale of assets is presented in the line “Other (losses) / gains – net” in the consolidatedstatement of income that also comprises a government grant on research & development costs as detailedbelow:
March 31,
In thousands of Euros 2010 2009
Profit / (loss) on sale of assets 2,292 253
Government grant on research & development costs 587 591
Other (losses) / gains – net 2,879 844
27.3.Depreciation, amortization and impairment
Depreciation, amortization and impairment include the following:
March 31,
In thousands of Euros Notes 2010 2009
Depreciation of property, plant and equipment (7.3) 19,838 18,416
Impairment charge on property, plant and equipment, net (7.4) 1,977 359
Amortization of intangible assets (9.3) 4,910 4,595
Impairment charge on intangible assets, net (9.4) — —
Depreciation, amortization and impairment 26,725 23,370
27.4.Net movement in provisions
In the cash flow statement, net movement in provisions comprises the following:
March 31,
In thousands of Euros Notes 2010 2009
Social litigations (20) (100) (702)
Commercial claims (20) 199 123
Onerous contracts (20) 1,513 —
Tax risks (20) 465 —
Dismantling and restoring (18) 69 282
Retirement indemnities (18) 502 197
Net movement in provisions 2,648 (100)
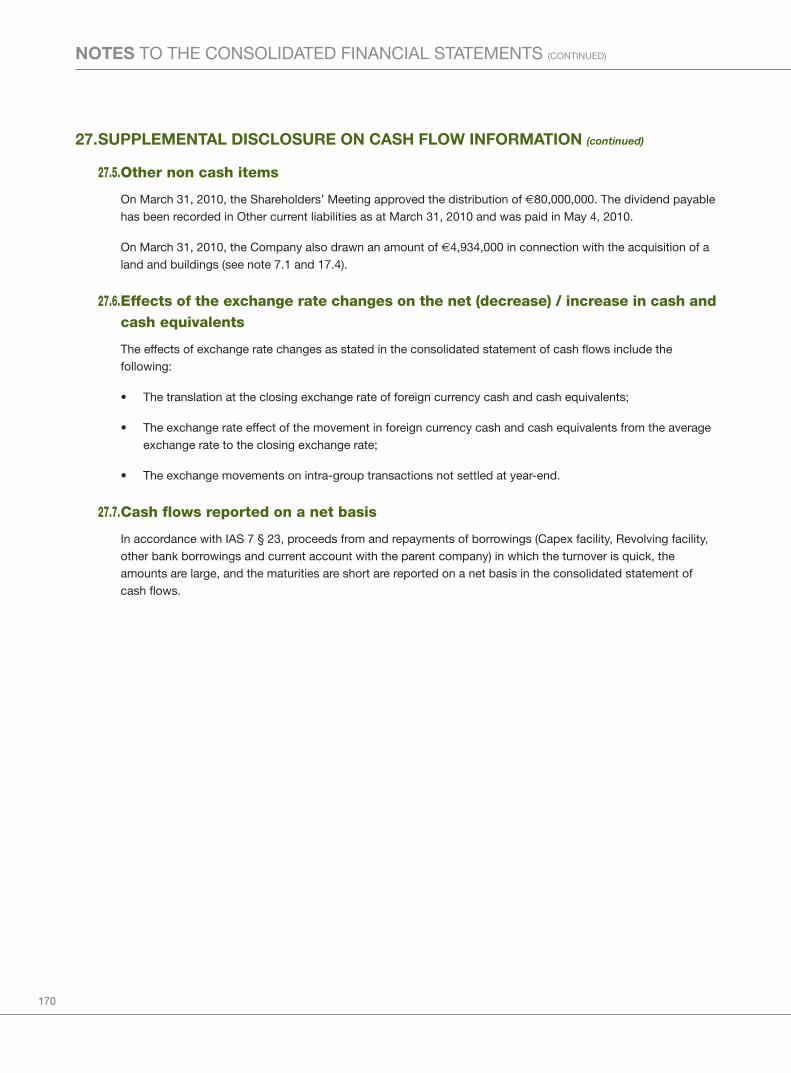
170
NOTES TO THE CONSOLIDATED FINANCIAL STATEMENTS (CONTINUED)
27.SUPPLEMENTAL DISCLOSURE ON CASH FLOW INFORMATION (continued)
27.5.Other non cash items
On March 31, 2010, the Shareholders’ Meeting approved the distribution of €80,000,000. The dividend payablehas been recorded in Other current liabilities as at March 31, 2010 and was paid in May 4, 2010.
On March 31, 2010, the Company also drawn an amount of €4,934,000 in connection with the acquisition of aland and buildings (see note 7.1 and 17.4).
27.6.Effects of the exchange rate changes on the net (decrease) / increase in cash andcash equivalents
The effects of exchange rate changes as stated in the consolidated statement of cash flows include thefollowing:
• The translation at the closing exchange rate of foreign currency cash and cash equivalents;
• The exchange rate effect of the movement in foreign currency cash and cash equivalents from the averageexchange rate to the closing exchange rate;
• The exchange movements on intra-group transactions not settled at year-end.
27.7.Cash flows reported on a net basis
In accordance with IAS 7 § 23, proceeds from and repayments of borrowings (Capex facility, Revolving facility,other bank borrowings and current account with the parent company) in which the turnover is quick, theamounts are large, and the maturities are short are reported on a net basis in the consolidated statement ofcash flows.

171
28.CONTINGENCIES
28.1.Legal proceedings
In September 2008, a complaint was filed by the co-owners of the L’Occitane Soho building against H. Stern, athird party and lessee, and against L’Occitane Inc and O.&Co. Table LLC, respectively as sub-lessee andassignee of the sublease, requesting damages and the termination of the lease and sublease. The suit hasbeen dropped following a settlement agreement dated April 2, 2009 according to which L’Occitane Inc andO.&Co. Table LLC left the premises in consideration to termination compensations of €1,893,000 (net ofexcluding lawyers costs). The related profit net of disposal costs of €1,893,000 (the net book value of relatedassets was nil as at March 31, 2009) has been recognised during the period ended March 31, 2010.
Also, the Company launched a new Immortelle product “Immortelle Crème Divine” in September 2009. InFrench, “divine” is a generic descriptive adjective with a similar meaning to the English word “divine”, and isoften used to mean “godly”. A third party claiming to be the registered owner of the trademark “Divine” recentlycommenced legal proceedings against the Company for unauthorized use of their mark in France only. Theclaimant or plaintiff sought an interdiction of the commercialization via a preliminary claiming for damages. OnJanuary 14, 2010, the Court decided against the plaintiff, dismissed the action and consequently enabled thecontinuous use of the name “Divine”. It is theoretically possible that the claimant files another legal action (mainproceedings) against L’Occitane. Should the Company lose the main proceedings contrary to our expectations,the Company believe that using another word in the name of that product will not affect our sale of that productin any materially adverse way given that the product is very new to the market and there would not be asignificant or material marketing goodwill attached to that particular name yet, and in any event our productsare marketed for their principal ingredients, and the word “divine” was not included nor intended to indicate theingredients of that product. The Company therefore believe that these claims are immaterial and will notmaterially affect our results of operations.
In addition to the litigations and claims mentioned above, the Group is subject to legal proceedings, claims andlitigation arising in the ordinary course of business. The Group’s management does not expect that the ultimatecosts to resolve these other matters will have a material adverse effect on the Group’s consolidated financialposition, statement of income or cash flows.
28.2.Contingent liabilities
The Group has contingent liabilities in respect of bank, other guarantees and other matters arising in theordinary course of business. It is not anticipated that any material liabilities will arise from the contingentliabilities.
All guarantees given by the Group are described in note 31.
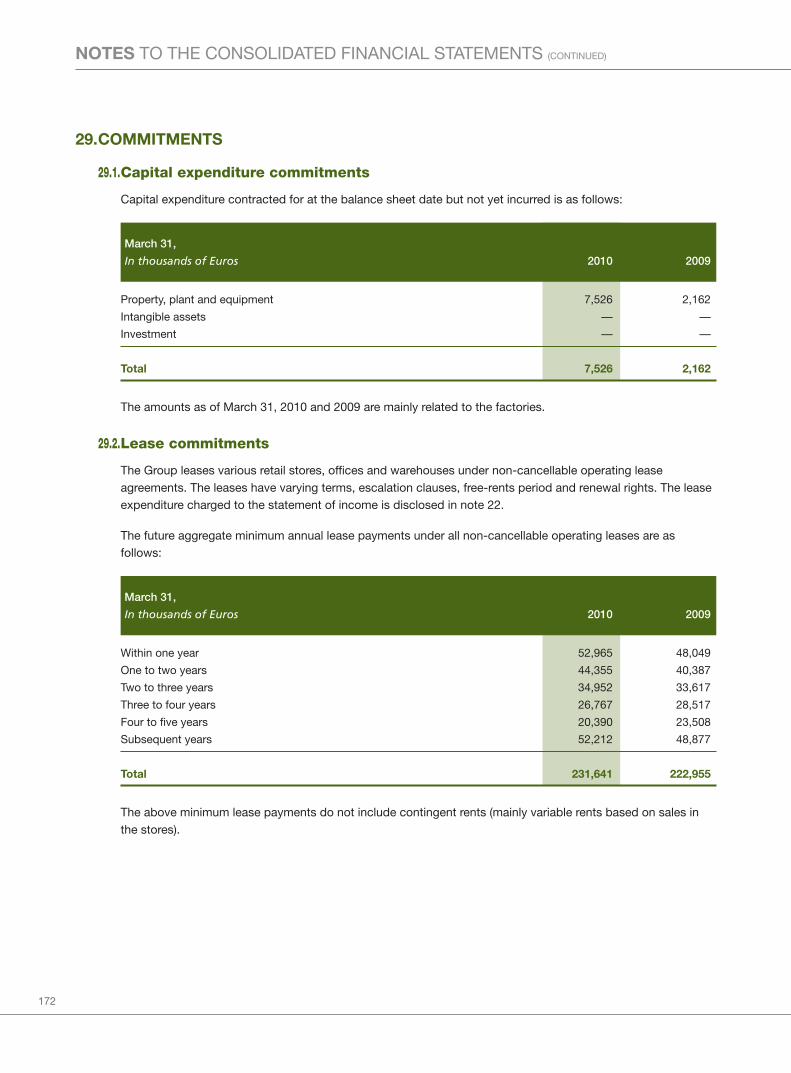
172
NOTES TO THE CONSOLIDATED FINANCIAL STATEMENTS (CONTINUED)
29.COMMITMENTS
29.1.Capital expenditure commitments
Capital expenditure contracted for at the balance sheet date but not yet incurred is as follows:
March 31,
In thousands of Euros 2010 2009
Property, plant and equipment 7,526 2,162
Intangible assets — —
Investment — —
Total 7,526 2,162
The amounts as of March 31, 2010 and 2009 are mainly related to the factories.
29.2.Lease commitments
The Group leases various retail stores, offices and warehouses under non-cancellable operating leaseagreements. The leases have varying terms, escalation clauses, free-rents period and renewal rights. The leaseexpenditure charged to the statement of income is disclosed in note 22.
The future aggregate minimum annual lease payments under all non-cancellable operating leases are asfollows:
March 31,
In thousands of Euros 2010 2009
Within one year 52,965 48,049
One to two years 44,355 40,387
Two to three years 34,952 33,617
Three to four years 26,767 28,517
Four to five years 20,390 23,508
Subsequent years 52,212 48,877
Total 231,641 222,955
The above minimum lease payments do not include contingent rents (mainly variable rents based on sales inthe stores).

173
29.COMMITMENTS (continued)
29.3.Other commitments
March 31,
In thousands of Euros 2010 2009
Pledge of key money (note 17) 1,368 2,087
Pledge of Investments (note 17) 36,527 64,782
Total 37,895 66,869
The pledge of investments corresponds to the capex and revolving facilities. The senior loan of the parentcompany which amounted to €174,253,000 as at March 31, 2009 is pledged by 100% of the Company’sshares.
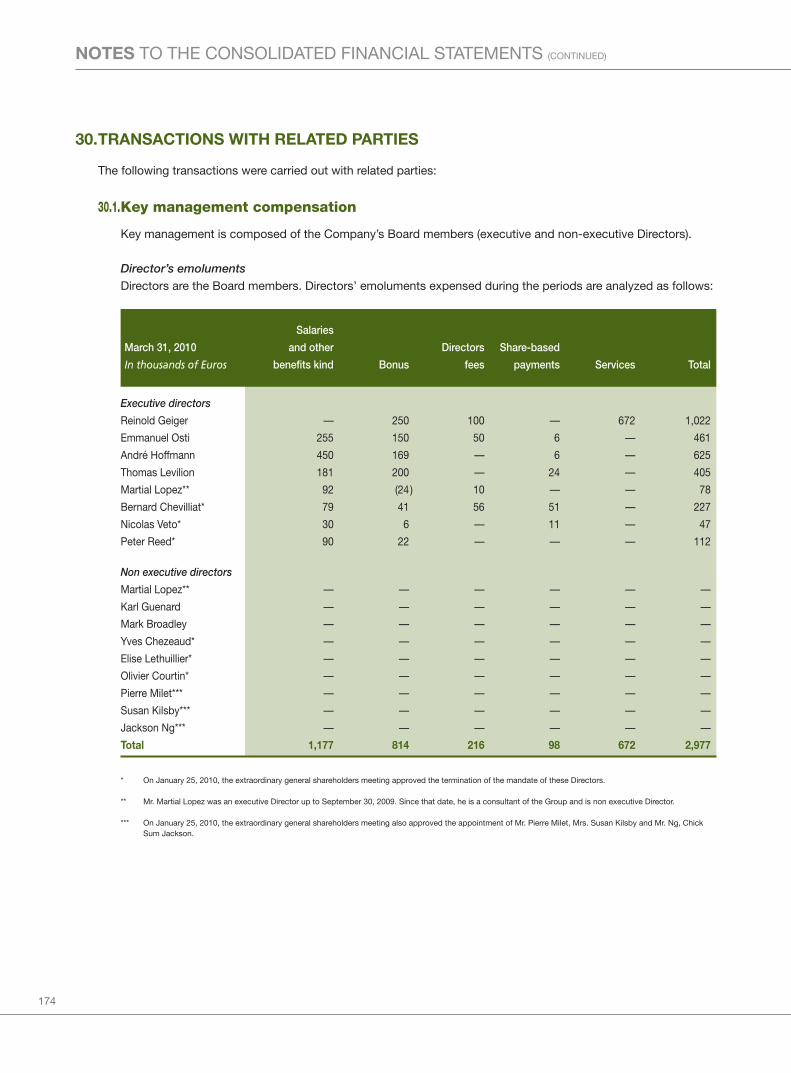
174
NOTES TO THE CONSOLIDATED FINANCIAL STATEMENTS (CONTINUED)
30.TRANSACTIONS WITH RELATED PARTIES
The following transactions were carried out with related parties:
30.1.Key management compensation
Key management is composed of the Company’s Board members (executive and non-executive Directors).
Director’s emolumentsDirectors are the Board members. Directors’ emoluments expensed during the periods are analyzed as follows:
Salaries
March 31, 2010 and other Directors Share-based
In thousands of Euros benefits kind Bonus fees payments Services Total
Executive directors
Reinold Geiger — 250 100 — 672 1,022
Emmanuel Osti 255 150 50 6 — 461
André Hoffmann 450 169 — 6 — 625
Thomas Levilion 181 200 — 24 — 405
Martial Lopez** 92 (24) 10 — — 78
Bernard Chevilliat* 79 41 56 51 — 227
Nicolas Veto* 30 6 — 11 — 47
Peter Reed* 90 22 — — — 112
Non executive directors
Martial Lopez** — — — — — —
Karl Guenard — — — — — —
Mark Broadley — — — — — —
Yves Chezeaud* — — — — — —
Elise Lethuillier* — — — — — —
Olivier Courtin* — — — — — —
Pierre Milet*** — — — — — —
Susan Kilsby*** — — — — — —
Jackson Ng*** — — — — — —
Total 1,177 814 216 98 672 2,977
* On January 25, 2010, the extraordinary general shareholders meeting approved the termination of the mandate of these Directors.
** Mr. Martial Lopez was an executive Director up to September 30, 2009. Since that date, he is a consultant of the Group and is non executive Director.
*** On January 25, 2010, the extraordinary general shareholders meeting also approved the appointment of Mr. Pierre Milet, Mrs. Susan Kilsby and Mr. Ng, ChickSum Jackson.

175
30.TRANSACTIONS WITH RELATED PARTIES (continued)
30.1.Key management compensation (continued)
Salaries
March 31, 2009 and other Directors Share-based
In thousands of Euros benefits kind Bonus fees payments Services Total
Executive directors
Reinold Geiger — 75 100 — 664 839
Emmanuel Osti 248 100 50 — — 398
André Hoffmann 400 167 — — — 567
Thomas Levilion** 89 — — — — 89
Bernard Chevilliat** 36 — — — — 36
Nicolas Veto** 50 10 — — — 60
Peter Reed** 55 21 — — — 76
Martial Lopez 141 24 24 10 — 199
Christopher Braden* 51 — 33 — — 84
Non executive directors
Yves Chezeaud — — — — — —
Karl Guenard — — — — — —
Mark Broadley** — — — — — —
Elise Lethuillier — — — — — —
Olivier Courtin — — — — — —
Olivier Baussan* — — — — — —
Henri Biard* — — — — — —
Total 1,070 397 207 10 664 2,348
* Correspond to the emoluments up to the date of resignation from the Board as at September 30, 2008.
** Correspond to the emoluments from the date of nomination as director by the General Meeting held on September 30, 2008.
Other than the types of emoluments described above, none of the Directors received any other form ofcompensation during the relevant periods. There was no arrangement under which a director has waived oragreed to waive any emolument.
There was no payment during the above financial years or periods to directors as an inducement to join theGroup or as compensation for loss of office.
Mr. Yves Chezeaud, Mr. Karl Guenard, Ms. Elise Lethuillier, Mr. Olivier Baussan, Mr. Olivier Courtin and Mr. HenriBiard did not perform executive functions, nor were they involved in the day to day operations or managementof the Group. Accordingly, they did not receive any emoluments as Directors during the above periods.
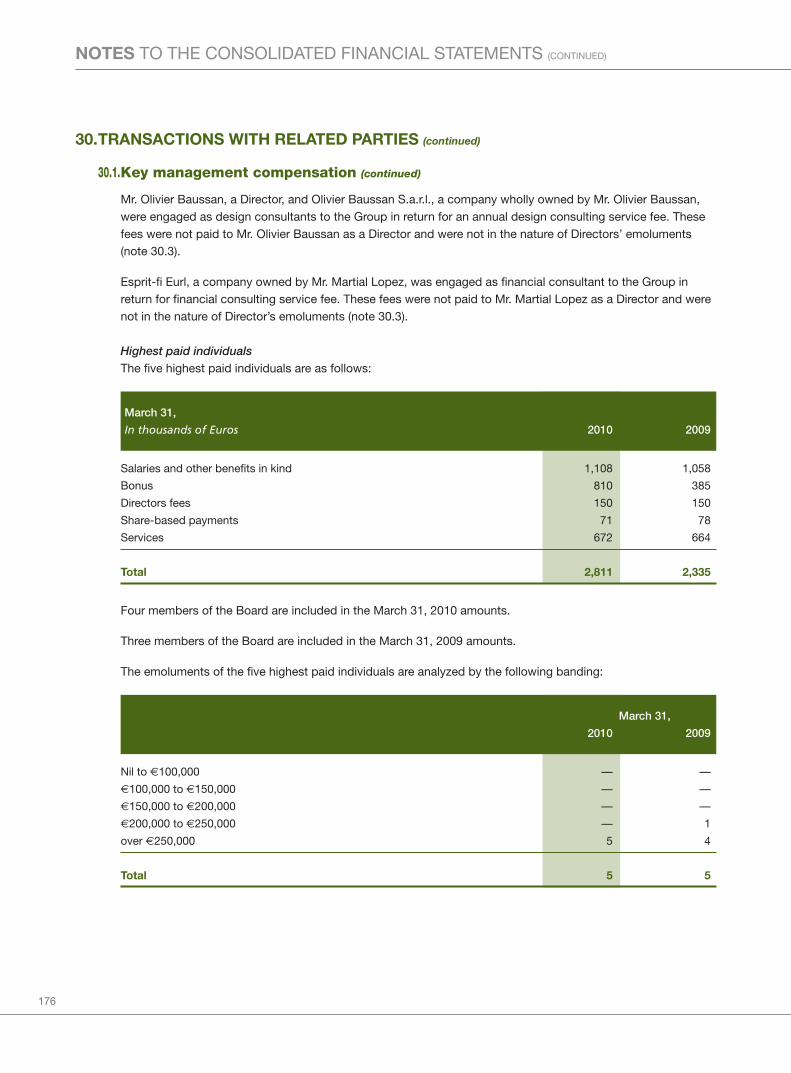
176
NOTES TO THE CONSOLIDATED FINANCIAL STATEMENTS (CONTINUED)
30.TRANSACTIONS WITH RELATED PARTIES (continued)
30.1.Key management compensation (continued)
Mr. Olivier Baussan, a Director, and Olivier Baussan S.a.r.l., a company wholly owned by Mr. Olivier Baussan,were engaged as design consultants to the Group in return for an annual design consulting service fee. Thesefees were not paid to Mr. Olivier Baussan as a Director and were not in the nature of Directors’ emoluments(note 30.3).
Esprit-fi Eurl, a company owned by Mr. Martial Lopez, was engaged as financial consultant to the Group inreturn for financial consulting service fee. These fees were not paid to Mr. Martial Lopez as a Director and werenot in the nature of Director’s emoluments (note 30.3).
Highest paid individualsThe five highest paid individuals are as follows:
March 31,
In thousands of Euros 2010 2009
Salaries and other benefits in kind 1,108 1,058
Bonus 810 385
Directors fees 150 150
Share-based payments 71 78
Services 672 664
Total 2,811 2,335
Four members of the Board are included in the March 31, 2010 amounts.
Three members of the Board are included in the March 31, 2009 amounts.
The emoluments of the five highest paid individuals are analyzed by the following banding:
March 31,
2010 2009
Nil to €100,000 — —
€100,000 to €150,000 — —
€150,000 to €200,000 — —
€200,000 to €250,000 — 1
over €250,000 5 4
Total 5 5
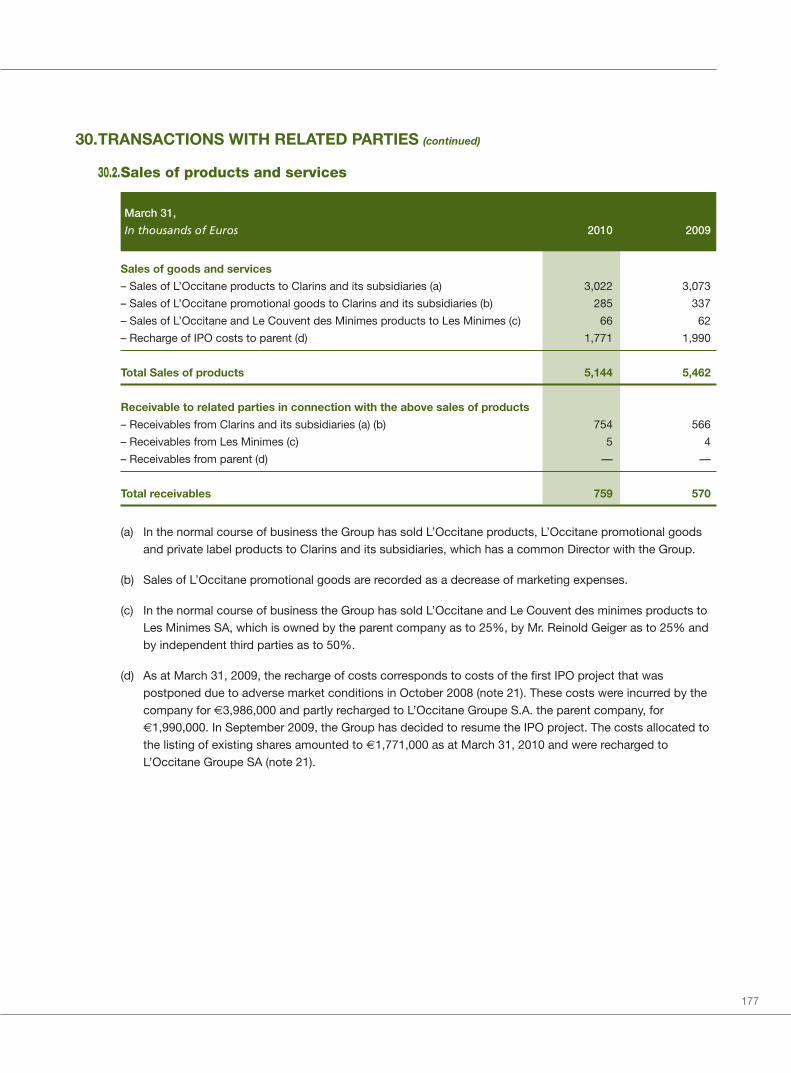
177
30.TRANSACTIONS WITH RELATED PARTIES (continued)
30.2.Sales of products and services
March 31,
In thousands of Euros 2010 2009
Sales of goods and services
– Sales of L’Occitane products to Clarins and its subsidiaries (a) 3,022 3,073
– Sales of L’Occitane promotional goods to Clarins and its subsidiaries (b) 285 337
– Sales of L’Occitane and Le Couvent des Minimes products to Les Minimes (c) 66 62
– Recharge of IPO costs to parent (d) 1,771 1,990
Total Sales of products 5,144 5,462
Receivable to related parties in connection with the above sales of products
– Receivables from Clarins and its subsidiaries (a) (b) 754 566
– Receivables from Les Minimes (c) 5 4
– Receivables from parent (d) — —
Total receivables 759 570
(a) In the normal course of business the Group has sold L’Occitane products, L’Occitane promotional goodsand private label products to Clarins and its subsidiaries, which has a common Director with the Group.
(b) Sales of L’Occitane promotional goods are recorded as a decrease of marketing expenses.
(c) In the normal course of business the Group has sold L’Occitane and Le Couvent des minimes products toLes Minimes SA, which is owned by the parent company as to 25%, by Mr. Reinold Geiger as to 25% andby independent third parties as to 50%.
(d) As at March 31, 2009, the recharge of costs corresponds to costs of the first IPO project that waspostponed due to adverse market conditions in October 2008 (note 21). These costs were incurred by thecompany for €3,986,000 and partly recharged to L’Occitane Groupe S.A. the parent company, for€1,990,000. In September 2009, the Group has decided to resume the IPO project. The costs allocated tothe listing of existing shares amounted to €1,771,000 as at March 31, 2010 and were recharged toL’Occitane Groupe SA (note 21).
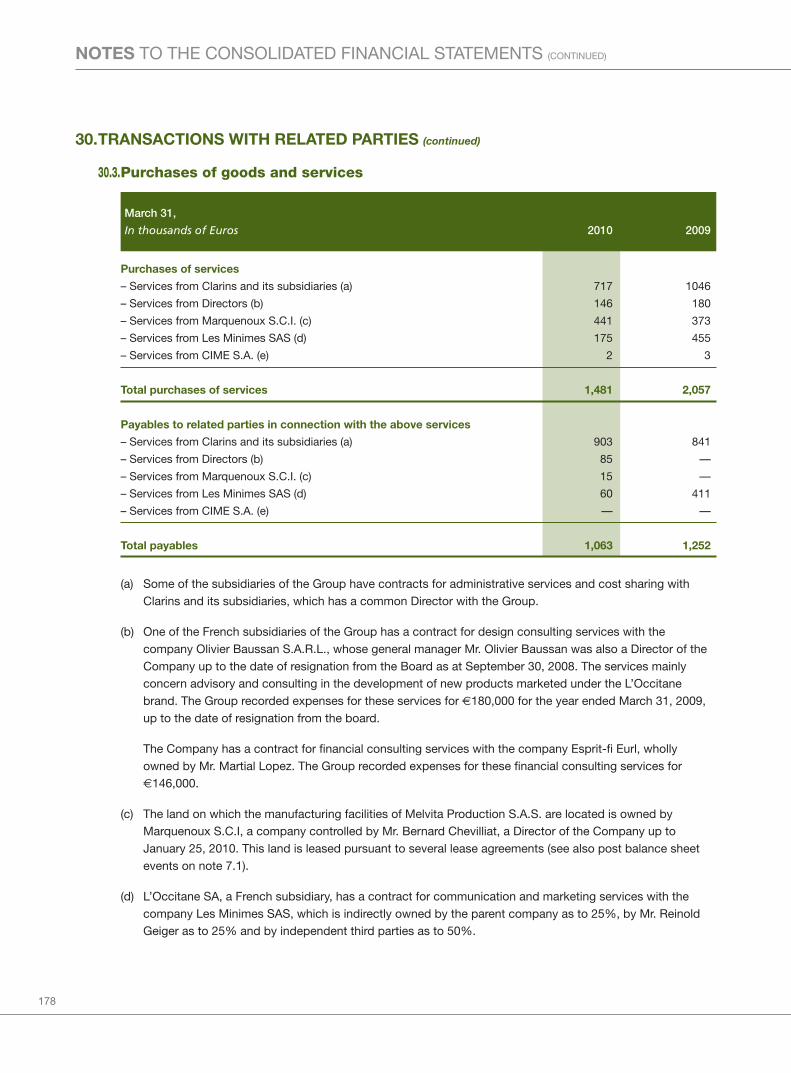
178
NOTES TO THE CONSOLIDATED FINANCIAL STATEMENTS (CONTINUED)
30.TRANSACTIONS WITH RELATED PARTIES (continued)
30.3.Purchases of goods and services
March 31,
In thousands of Euros 2010 2009
Purchases of services
– Services from Clarins and its subsidiaries (a) 717 1046
– Services from Directors (b) 146 180
– Services from Marquenoux S.C.I. (c) 441 373
– Services from Les Minimes SAS (d) 175 455
– Services from CIME S.A. (e) 2 3
Total purchases of services 1,481 2,057
Payables to related parties in connection with the above services
– Services from Clarins and its subsidiaries (a) 903 841
– Services from Directors (b) 85 —
– Services from Marquenoux S.C.I. (c) 15 —
– Services from Les Minimes SAS (d) 60 411
– Services from CIME S.A. (e) — —
Total payables 1,063 1,252
(a) Some of the subsidiaries of the Group have contracts for administrative services and cost sharing withClarins and its subsidiaries, which has a common Director with the Group.
(b) One of the French subsidiaries of the Group has a contract for design consulting services with thecompany Olivier Baussan S.A.R.L., whose general manager Mr. Olivier Baussan was also a Director of theCompany up to the date of resignation from the Board as at September 30, 2008. The services mainlyconcern advisory and consulting in the development of new products marketed under the L’Occitanebrand. The Group recorded expenses for these services for €180,000 for the year ended March 31, 2009,up to the date of resignation from the board.
The Company has a contract for financial consulting services with the company Esprit-fi Eurl, whollyowned by Mr. Martial Lopez. The Group recorded expenses for these financial consulting services for€146,000.
(c) The land on which the manufacturing facilities of Melvita Production S.A.S. are located is owned byMarquenoux S.C.I, a company controlled by Mr. Bernard Chevilliat, a Director of the Company up toJanuary 25, 2010. This land is leased pursuant to several lease agreements (see also post balance sheetevents on note 7.1).
(d) L’Occitane SA, a French subsidiary, has a contract for communication and marketing services with thecompany Les Minimes SAS, which is indirectly owned by the parent company as to 25%, by Mr. ReinoldGeiger as to 25% and by independent third parties as to 50%.
179
30.TRANSACTIONS WITH RELATED PARTIES (continued)
30.3.Purchases of goods and services (continued)
(e) In 2007, a shareholding fund (FCPE L’Occitane actionnariat) was established. The fund holds L’OccitaneGroupe’s shares, the beneficiaries of whom are certain employees of some of our French subsidiaries.Pursuant to relevant French regulations, a fund of this nature is required to afford its beneficiaries a certainminimum degree of liquidity in their investment. The company CIME, which is controlled by Mr. ReinoldGeiger, a Director of the Company, agreed to act as liquidity guarantor whereby it would purchase suchnumber of LOG’s shares at certain regular times each year as may be requested by the manager of thefund in order to comply with the minimum liquidity requirements. L’Occitane SA, a French wholly ownedsubsidiary, has agreed to pay CIME an annual fee representing 0.125% of the net asset value of the fundfor so acting as liquidity guarantor (note 16.3).
30.4.Borrowings from related parties (note 17.3)
An advance was granted to L’Occitane Suisse SA by the company Clarins BV, a subsidiary of the Clarins group,which has a common Director with the Group, for an amount in euro equivalent of €1,190,000 on March 31,2010 (€1,165,000 on March 31, 2009), with a 1.64333% fixed interest rate on Swiss Francs and with a 2.242%interest rate on euro. An interest expense of €45,000 was recorded by the Group on March 31, 2010 (€48,000on March 31, 2009).
An advance was granted to L’Occitane Korea Ltd by the company Clarins BV, a subsidiary of the Clarins group,which has a common Director with the Group, for an amount of €1,502,000 on March 31, 2010 (€1,475,000 onMarch 31, 2009) and with a 2.4967% fixed interest rate. An interest expense of €48,000 was recorded by theGroup on March 31, 2010 (€64,000 on March 31, 2009).
An advance was granted to L’Occitane Mexico SA de CV by the company Clarins BV, a subsidiary of theClarins group, which has a common Director with the Group, for an amount of €2,419,000 on March 31, 2010(€1,334,000 on March 31, 2009) and with a 2.21292% fixed interest rate. An interest expense of €88,000 wasrecorded by the Group on March 31, 2010 (€65,000 on March 31, 2009).
Since the fiscal year ended March 31, 2008, the Group benefited from a financing from parent amounting€24,406,000 on March 31, 2009. On March 30, 2010, the amount of the current account due from LOG wasfully settled for an amount of €59,647,000. The terms of such financing are disclosed in note 17.3.
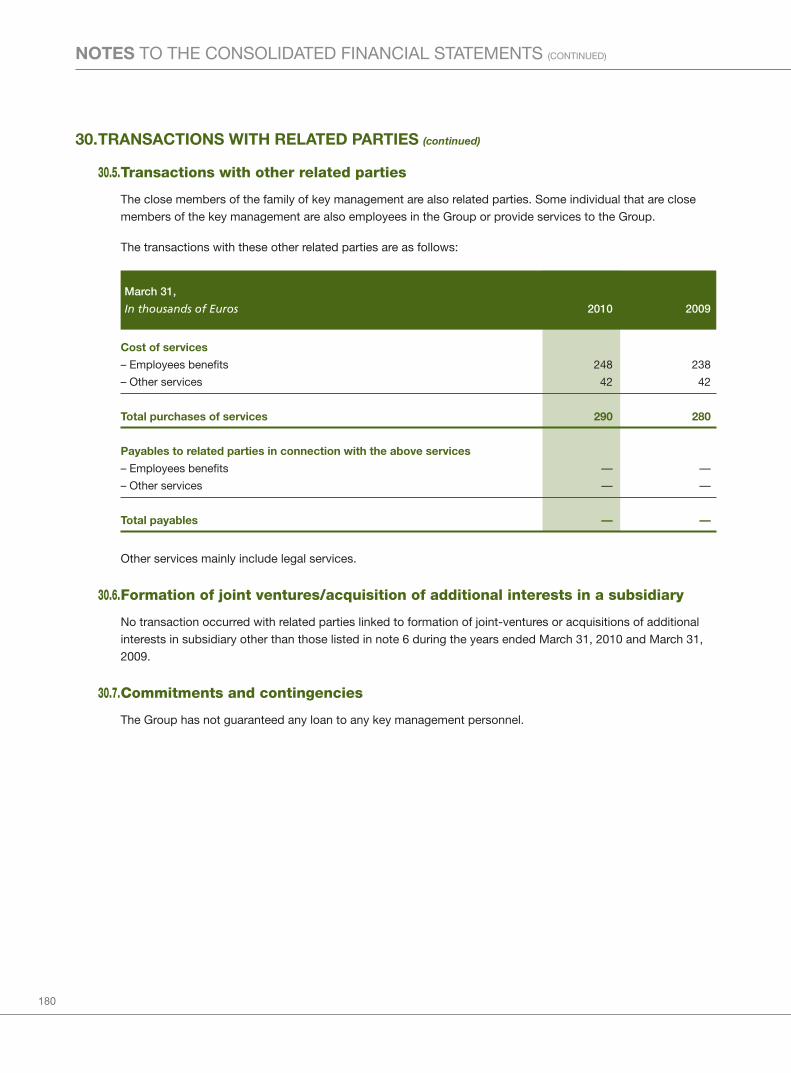
180
NOTES TO THE CONSOLIDATED FINANCIAL STATEMENTS (CONTINUED)
30.TRANSACTIONS WITH RELATED PARTIES (continued)
30.5.Transactions with other related parties
The close members of the family of key management are also related parties. Some individual that are closemembers of the key management are also employees in the Group or provide services to the Group.
The transactions with these other related parties are as follows:
March 31,
In thousands of Euros 2010 2009
Cost of services
– Employees benefits 248 238
– Other services 42 42
Total purchases of services 290 280
Payables to related parties in connection with the above services
– Employees benefits — —
– Other services — —
Total payables — —
Other services mainly include legal services.
30.6.Formation of joint ventures/acquisition of additional interests in a subsidiary
No transaction occurred with related parties linked to formation of joint-ventures or acquisitions of additionalinterests in subsidiary other than those listed in note 6 during the years ended March 31, 2010 and March 31,2009.
30.7.Commitments and contingencies
The Group has not guaranteed any loan to any key management personnel.
181
31.POST BALANCE SHEET EVENTS
On May 7, 2010, the Company was listed on the main board of the Hong Kong stock exchange. 364,120,000shares of the Company were sold at a unit price of HKD 15.08. Out of these 364,120,000 shares, 182,060,000shares were sold by LOG and 182,060,000 were newly issued shares as provided for by the Shareholders’ Meetingheld on March 31, 2010. Consequently, the Company received gross proceed of €276,872,000 (HKD2,745,465,000) and the shareholding of LOG in the share capital was reduced to 75%.
On May 28, 2010, the Underwriters to the global offering exercised their over-allotment option for a total number ofshares of 41,017,000. Out of these 41,017,000 shares, 20,508,500 shares were sold by LOG and 20,508,500 werenewly issued shares as provided for by the Shareholders’ Meeting held on May 31, 2010. Consequently, theCompany received an additional gross proceed of €32,480,000 (HKD 309,268,000) and the shareholding of LOG inthe share capital was reduced to 72,57%.
As at March 31, 2010, the aggregate amount of undrawn borrowing facilities was €125.5 million. In April, May andJune 2010, an additional amount of €110.1 million in bank borrowings has been drawn on our existing bankfacilities to finance principally the repayment of the LOG current account, and to partially finance the repayment infull of our Capex Facility (note 17.9).
In FY2007, LOG, the Company, L’Occitane S.A., a French subsidiary, entered into a senior credit facility agreementin the principal amount of €280.0 million (the 2007 Credit Facility) made up of:
(i) A medium term senior loan of €205.0 million that can be drawn only by LOG (the Acquisition Facility), of which€200.0 million was drawn as of 31 March 2010. The balance of the principal amount was €174.3 million as atMarch 31, 2010;
(ii) A capital expenditures facility of €50.0 million with a maturity of seven years that can be drawn only by theCompany and L’Occitane S.A. (the Capex Facility), of which €36.5 million was outstanding as at March 31,2010; and
(iii) A multi-currency revolving facility of €25.0 million granted for a period of seven years that can be drawn onlyby us and L’Occitane S.A. (the Revolving Facility), of which nil was outstanding as at March 31, 2010.
As at May 28, 2010, all amounts due by LOG, the Company and L’Occitane S.A. under the 2007 Credit Facility havebeen repaid in full and the 2007 Credit Facility has been terminated.
The amendment to the articles of association of L’Occitane International S.A has been approved by theShareholder’s meeting held on April 15, 2010 and a list of undistributable reserves has been added (see note 16.4).
On 9 April 2010, the sole shareholder of the Company, LOG resolved that a value of €0.03 be designated as the parvalue per ordinary share in the share capital of the Company so that the subscribed share capital of the Companyamounting to €38,232,000 be represented by 1,274,396,391 shares having a par value of €0.03. In accordancewith IAS 33, the calculation of basic and diluted earnings per share for all periods presented has been adjustedretrospectively (see note 26).
On May 28, 2010, the Company signed a term sheet with one of its banks, under which this bank will arrange a newsyndicated credit facility in favour of the Company for a minimum amount of €300.0 million with a 5 years maturity,as approved by the Company’s board of directors on June 24, 2010.
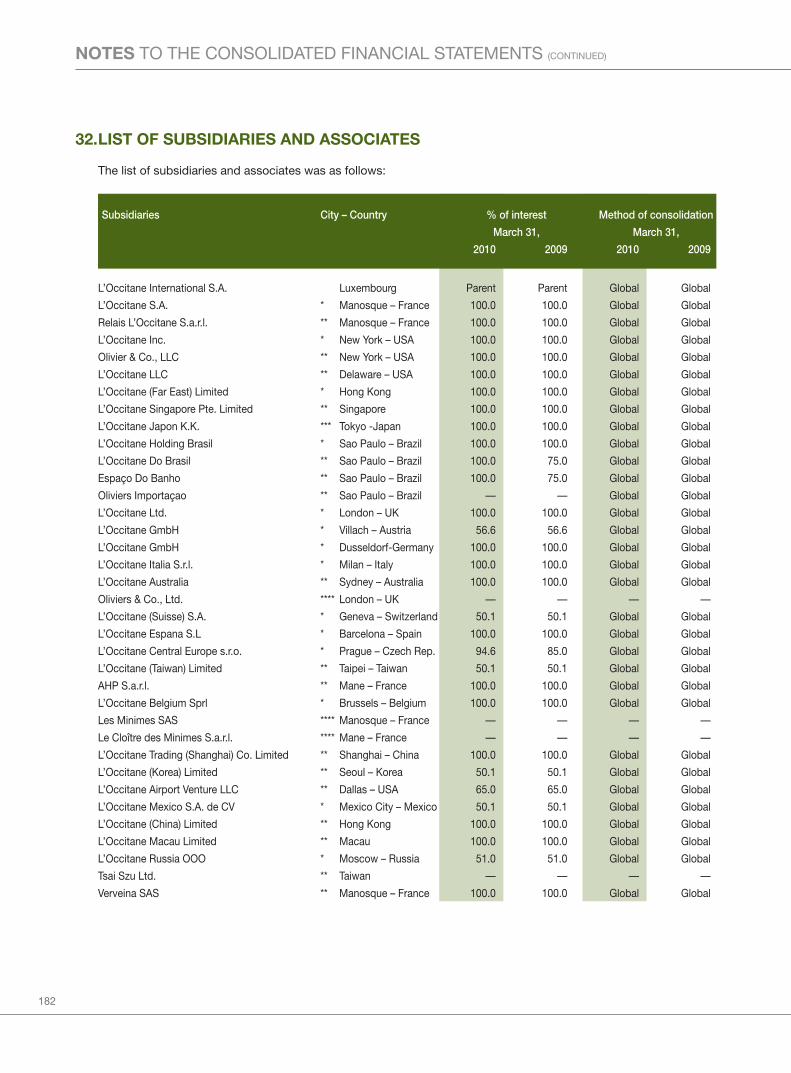
182
NOTES TO THE CONSOLIDATED FINANCIAL STATEMENTS (CONTINUED)
32.LIST OF SUBSIDIARIES AND ASSOCIATES
The list of subsidiaries and associates was as follows:
Subsidiaries City – Country % of interest Method of consolidation
March 31, March 31,
2010 2009 2010 2009
L’Occitane International S.A. Luxembourg Parent Parent Global Global
L’Occitane S.A. * Manosque – France 100.0 100.0 Global Global
Relais L’Occitane S.a.r.l. ** Manosque – France 100.0 100.0 Global Global
L’Occitane Inc. * New York – USA 100.0 100.0 Global Global
Olivier & Co., LLC ** New York – USA 100.0 100.0 Global Global
L’Occitane LLC ** Delaware – USA 100.0 100.0 Global Global
L’Occitane (Far East) Limited * Hong Kong 100.0 100.0 Global Global
L’Occitane Singapore Pte. Limited ** Singapore 100.0 100.0 Global Global
L’Occitane Japon K.K. *** Tokyo -Japan 100.0 100.0 Global Global
L’Occitane Holding Brasil * Sao Paulo – Brazil 100.0 100.0 Global Global
L’Occitane Do Brasil ** Sao Paulo – Brazil 100.0 75.0 Global Global
Espaço Do Banho ** Sao Paulo – Brazil 100.0 75.0 Global Global
Oliviers Importaçao ** Sao Paulo – Brazil — — Global Global
L’Occitane Ltd. * London – UK 100.0 100.0 Global Global
L’Occitane GmbH * Villach – Austria 56.6 56.6 Global Global
L’Occitane GmbH * Dusseldorf-Germany 100.0 100.0 Global Global
L’Occitane Italia S.r.l. * Milan – Italy 100.0 100.0 Global Global
L’Occitane Australia ** Sydney – Australia 100.0 100.0 Global Global
Oliviers & Co., Ltd. **** London – UK — — — —
L’Occitane (Suisse) S.A. * Geneva – Switzerland 50.1 50.1 Global Global
L’Occitane Espana S.L * Barcelona – Spain 100.0 100.0 Global Global
L’Occitane Central Europe s.r.o. * Prague – Czech Rep. 94.6 85.0 Global Global
L’Occitane (Taiwan) Limited ** Taipei – Taiwan 50.1 50.1 Global Global
AHP S.a.r.l. ** Mane – France 100.0 100.0 Global Global
L’Occitane Belgium Sprl * Brussels – Belgium 100.0 100.0 Global Global
Les Minimes SAS **** Manosque – France — — — —
Le Cloître des Minimes S.a.r.l. **** Mane – France — — — —
L’Occitane Trading (Shanghai) Co. Limited ** Shanghai – China 100.0 100.0 Global Global
L’Occitane (Korea) Limited ** Seoul – Korea 50.1 50.1 Global Global
L’Occitane Airport Venture LLC ** Dallas – USA 65.0 65.0 Global Global
L’Occitane Mexico S.A. de CV * Mexico City – Mexico 50.1 50.1 Global Global
L’Occitane (China) Limited ** Hong Kong 100.0 100.0 Global Global
L’Occitane Macau Limited ** Macau 100.0 100.0 Global Global
L’Occitane Russia OOO * Moscow – Russia 51.0 51.0 Global Global
Tsai Szu Ltd. ** Taiwan — — — —
Verveina SAS ** Manosque – France 100.0 100.0 Global Global
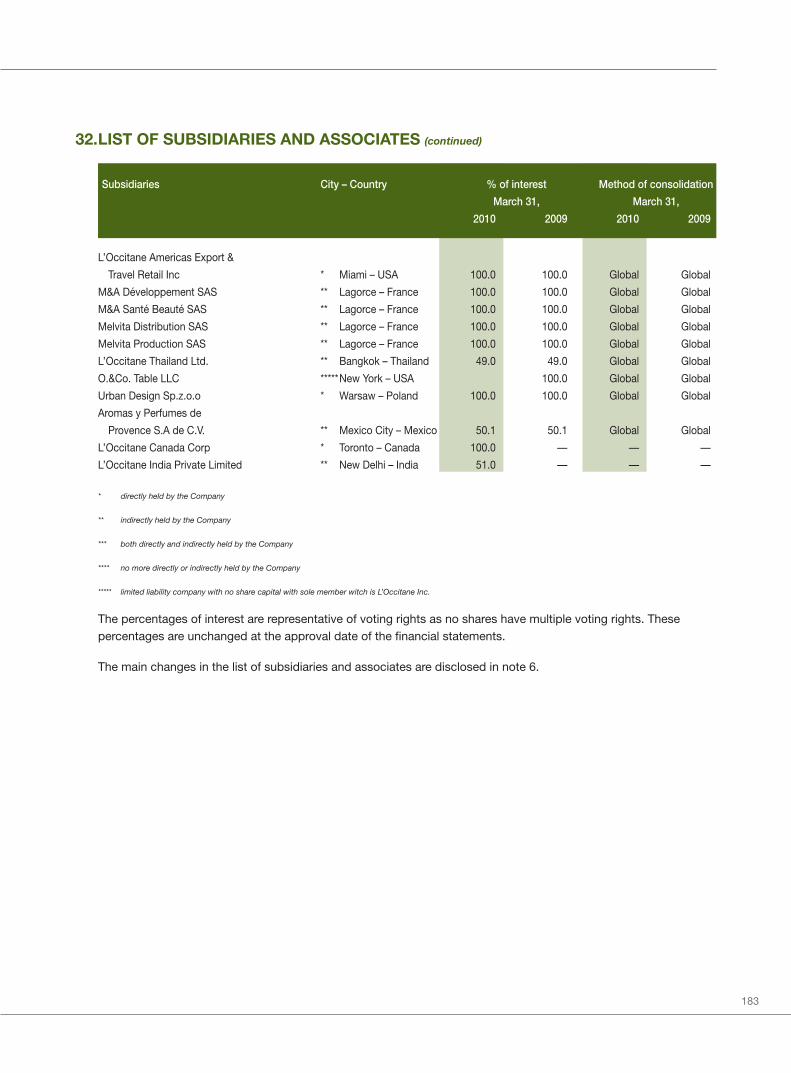
183
32.LIST OF SUBSIDIARIES AND ASSOCIATES (continued)
Subsidiaries City – Country % of interest Method of consolidation
March 31, March 31,
2010 2009 2010 2009
L’Occitane Americas Export &
Travel Retail Inc * Miami – USA 100.0 100.0 Global Global
M&A Développement SAS ** Lagorce – France 100.0 100.0 Global Global
M&A Santé Beauté SAS ** Lagorce – France 100.0 100.0 Global Global
Melvita Distribution SAS ** Lagorce – France 100.0 100.0 Global Global
Melvita Production SAS ** Lagorce – France 100.0 100.0 Global Global
L’Occitane Thailand Ltd. ** Bangkok – Thailand 49.0 49.0 Global Global
O.&Co. Table LLC *****New York – USA 100.0 Global Global
Urban Design Sp.z.o.o * Warsaw – Poland 100.0 100.0 Global Global
Aromas y Perfumes de
Provence S.A de C.V. ** Mexico City – Mexico 50.1 50.1 Global Global
L’Occitane Canada Corp * Toronto – Canada 100.0 — — —
L’Occitane India Private Limited ** New Delhi – India 51.0 — — —
* directly held by the Company
** indirectly held by the Company
*** both directly and indirectly held by the Company
**** no more directly or indirectly held by the Company
***** limited liability company with no share capital with sole member witch is L’Occitane Inc.
The percentages of interest are representative of voting rights as no shares have multiple voting rights. Thesepercentages are unchanged at the approval date of the financial statements.
The main changes in the list of subsidiaries and associates are disclosed in note 6.

184
NOTES TO THE CONSOLIDATED FINANCIAL STATEMENTS (CONTINUED)
32.LIST OF SUBSIDIARIES AND ASSOCIATES (continued)
The date of incorporation, the share capital and the principal activities of the subsidiaries are as follows:
Date of Principal
Subsidiaries City – Country incorporation Share capital activities
L’Occitane International S.A. Luxembourg 2000 EUR 38,231,891.72 Holding &
Distribution
L’Occitane S.A. * Manosque – France 1976 EUR 8,126,409.35 Production
Relais L’Occitane S.a.r.l. ** Manosque – France 1994 EUR 3,097,000 Distribution
L’Occitane Inc. * New York – USA 1995 USD 1 Distribution
Olivier & Co., LLC ** New York – USA 1999 USD 1 Distribution
L’Occitane LLC ** Delaware – USA 1999 USD 1 Dormant
Holding &
L’Occitane (Far East) Limited * Hong Kong 1992 HKD 8,000,000 Distribution
L’Occitane Singapore Pte. Limited ** Singapore 1997 SGD 100,000 Distribution
L’Occitane Japon K.K. *** Tokyo -Japan 1998 JPY 100,000,000 Distribution
L’Occitane Holding Brasil * Sao Paulo – Brazil 1999 BRL11,132,197 Holding
L’Occitane Do Brasil ** Sao Paulo – Brazil 1999 BRL 8,700,000 Distribution
Espaço Do Banho ** Sao Paulo – Brazil 1996 BRL 3,800,000 Distribution
Oliviers Importaçao ** Sao Paulo – Brazil 2006 BRL 11,132,197 Distribution
L’Occitane Ltd. * London – UK 1996 GBP 1,398,510.75 Distribution
L’Occitane GmbH * Villach – Austria 2000 EUR 70,000 Distribution
L’Occitane GmbH * Dusseldorf-Germany 2004 EUR 25,000 Distribution
L’Occitane Italia S.r.l. * Milan – Italy 2001 EUR 80,000 Distribution
L’Occitane Australia ** Sydney – Australia 2000 AUD 5,000,000 Distribution
L’Occitane (Suisse) S.A. * Geneva – Switzerland 2002 CHF100,000 Distribution
L’Occitane Espana S.L * Barcelona – Spain 2003 EUR 2,924,650.10 Distribution
L’Occitane Central Europe s.r.o. * Prague – Czech Rep. 2004 CZK 9,361,000 Distribution
L’Occitane (Taiwan) Limited ** Taipei – Taiwan 2005 TWD 28,500,000 Distribution
Marketing
AHP S.a.r.l. ** Mane – France 2004 EUR 10,000 support
L’Occitane Belgium Sprl * Brussels – Belgium 2005 EUR 20,000 Distribution
L’Occitane Trading
(Shanghai) Co. Limited ** Shanghai – China 2005 USD 1,400,000 Distribution
L’Occitane (Korea) Limited ** Seoul – Korea 2005 KRW 2,505,000,000 Distribution
L’Occitane Airport Venture LLC ** Dallas – USA 2006 USD 10,000 Distribution
L’Occitane Mexico S.A. de CV * Mexico City – Mexico 2006 MXP 28,250,000 Distribution
L’Occitane (China) Limited ** Hong Kong 2006 HKD 10,000 Distribution
L’Occitane Macau Limited ** Macau 2007 MOP 25,000 Distribution
L’Occitane Russia OOO * Moscow – Russia 2006 RUB 10,000 Distribution
Tsai Szu Ltd. ** Taiwan 2008 TWD 2,500,000 Distribution
Verveina SAS ** Manosque – France 2008 EUR 37,000 Dormant

185
32.LIST OF SUBSIDIARIES AND ASSOCIATES (continued)
The date of incorporation, the share capital and the principal activities of the subsidiaries are as follows:
Date of Principal
Subsidiaries City – Country incorporation Share capital activities
L’Occitane Americas Export &
Travel Retail Inc * Miami – USA 2008 USD 1,000 Distribution
M&A Développement SAS ** Lagorce – France 2005 EUR 4,600,000 Holding
M&A Santé Beauté SAS ** Lagorce – France 1998 EUR 500,000 Holding
Melvita Distribution SAS ** Lagorce – France 1982 EUR 555,105 Distribution
Melvita Production SAS ** Lagorce – France 1987 EUR 150,000 Production
L’Occitane Thailand Ltd. ** Bangkok – Thailand 2008 THB 20,000,000 Dormant
O.&Co. Table LLC **** New-York – USA 2007 — Out
Urban Design Sp.z.o.o * Warsaw – Poland 2009 PLN 3,754,000 Distribution
Aromas y Perfumes de
Provence S.A de C.V. ** Mexico City – Mexico 2009 MXN 50,000 Dormant
L’Occitane Canada Corp * Toronto – Canada 2009 CAD 3,000,000 Distribution
L’Occitane India Private Limited ** New Delhi – India 2009 INR 17,500,000 Distribution
* directly held by the Company
** indirectly held by the Company
*** both directly and indirectly held by the Company
**** no more directly or indirectly held by the Company
***** limited liability company with no share capital with sole member witch is L’Occitane Inc.
The main changes in the list of subsidiaries and associates are disclosed in note 6.
33.ULTIMATE HOLDING COMPANY
The Directors consider L’Occitane Groupe S.A., an unlisted company incorporated in Luxembourg as the ultimateholding company.

186
FINANCIAL SUMMARY
A summary of the consolidated results and assets, liabilities, equity and minority interests of the Group for the last fivefinancial years is set out below.
Year ended 31 March 2010 2009 2008 2007 2006
€‘000 €‘000 €‘000 €‘000 €‘000
Net Sales 612,245 537,335 414,965 334,949 269,303
Gross profit 497,263 431,785 336,364 271,147 211,282
Gross profit margin 81.2% 80.4% 81.1% 81.0% 78.5%
Operating profit 110,193 80,490 73,136 52,111 42,191
Operating profit margin 18.0% 15.0% 17.6% 15.6% 15.7%
Profit for the year 84,559 59,384 49,524 35,507 29,023
attributable to:
equity holders of the Company 81,626 58,383 47,898 33,157 26,521
minority interests 2,933 1,001 1,626 2,350 2,502
Total assets 436,590 407,163 294,396 258,840 183,122
Total liabilities 275,312 219,904 139,156 116,558 116,958
Equity attributable to the equity
holders of the Company 157,290 185,255 152,251 140,233 62,469
Minority interests 3,988 2,004 2,989 2,049 3,695
The consolidated financial statements of the Group have been prepared in accordance with International FinancialReporting Standard (IFRS). The standard IAS 38 (Amendment) ‘Intangible assets’ is effective for the Group for the firsttime for the fiscal year beginning on April 1, 2009. According to this revised standard, a prepayment may only berecognised in the event that payment has been made in advance of obtaining right of access to goods or receipt ofservices. This means that an expense is recognised for distribution and marketing promotional goods when the Grouphas access to these goods and not when the goods are distributed to customers or used, as was the Group’saccounting policy as at March 31, 2009 and before. The financial years ended 31 March 2009, 2008 and 2007 havebeen restated in accordance with the revised standard. The financial year ended 31 March 2006 has not been restatedin accordance with the revised standard.
The above summary does not form a part of the consolidated financial statements.