Embed Size (px)
Citation preview

P a g e | 1
PURDUE AGRICULTURAL ECONOMICS REPORT MARCH 2016
March 2016
CONTENTS Farmland Update from Indiana Farm Managers and Rural Appraisers ................................................ 1
Small Business Administration Disaster Loans after Hurricane Katrina ................................................ 3
The Agricultural Communications Gap: Agricultural Economics Responds ........................................... 7
Growing the Pork Industry: Exports to China ................................................................................... 8
Farmland Update from Indiana Farm Managers and Rural Appraisers1 Craig Dobbins, Professor of Agricultural Economics
The farm press and coffee shops have been a buzz
this winter with discussions of farmland values in
Indiana and other Midwestern states. In February
2016, the Chicago Federal Reserve Bank indicated
that farmland values in Indiana were down 2%
between October 1, 2015 and January 1, 2016.
Values in Illinois and Iowa declined 1% and 3%,
respectively. Values in Michigan and Wisconsin
increased 1% and 2%, respectively. In the face of
significant farm income declines, farmland markets
remain uncertain about how to respond.
To obtain a perspective about recent changes in
Indiana’s farmland market, members of the Indiana
Chapter of Farm Managers & Rural Appraisers were
surveyed during their winter meeting on February 3,
2016. To obtain information about Indiana’s
farmland market, members were presented with the
following situation:
1 A special thanks is expressed to the Indiana Chapter of Farm Managers and Rural Appraisers that participated in the survey. The
Indiana Chapter of Farm Managers and Rural Appraisers is an organization of rural land experts located in Indiana and promote the professions of farm management, agricultural consulting, and rural appraisal. Without their assistance it would not be possible to take the pulse of Indiana’s farmland market.
80 acres or more, all tillable, no buildings, capable
of averaging 170 bushels of corn per acre and 50
bushels of soybeans in a corn/bean rotation under
typical management and not having special non-
farm uses.
Farmland Values
Responses from people representing 27 different
counties were received. The average estimated price
of farmland was $7,968 per acre. Five respondents
indicated no change in farmland values when
compared to values in February 2015. The remaining
22 respondents indicated their estimated price was
lower than the value in February 2015. The average
percentage decline was 9% with a range in
estimated decline from 2.5% to 15%.
Not too long ago many people were asking how high
farmland values might go. It would appear that the
P a g e | 2
PURDUE AGRICULTURAL ECONOMICS REPORT MARCH 2016
2013/2014 values were the top. The group was
asked to provide forecasts of future farmland values
in one year and in five years. In one year, 15% of
the respondents indicated that values would be the
same. The other 85% said they would be lower by
an average of 8%. The declines ranged from 3% to
15%. These respondents have a strong consensus
that in the short run farmland values will not
increase.
There was less agreement about the change in
farmland values over the next five years. In this
case, 19% of the respondents indicated farmland
values would be higher, 33% indicated farmland
values would be the same as current values, and
48% indicated farmland values would be lower.
Those indicating that farmland values would be
higher averaged 14% with a range from 5% to 20%.
Those expecting a decrease averaged 13% with a
range from 5% to 30%.
Cash Rents
Attendees were also asked to specify the cash rent
for 2016. The average cash rent for the example
parcel was estimated to be $234 per acre. The
estimated cash rents varied from $175 to $300 per
acre, a difference of $125 per acre. Three of the
respondents indicated cash rent remained the same
as in 2015. Everyone else indicated that cash rent
declined. The average reduction was $20 per acre.
This was a reduction of about 8%.
As with farmland values the respondents were asked
to forecast cash rents one year and five years into
the future. When asked what cash rent would be in
2017, 22% of the respondents indicated they would
be the same as 2016. The remaining 78% indicated
cash rents would be lower. The average decline in
cash rents was 8.5%, just a little more than the
reduction from 2015 to 2016. The range of the
declines varied from a reduction of 3% to 15%.
As with farmland values the five year projection was
more uncertain with 15% of the respondents
indicating cash rents would exceed the 2016 level.
This group expected cash rents to average 15%
higher than the 2016 value. Forty-eight percent of
the respondents expect cash rents to be lower by an
average of 13%. The range of decline varied from
5% to 20%. The final 25% of the respondents
expect cash rents to be the same as they are in
2016.
These results indicate a pessimistic attitude in the
rental market. This is not surprising since there has
been little reduction in cash rents since they reached
their peak. At this time, it appears that many
respondents anticipate cash rent declines for the
next several years.
Final Thoughts
The effects of much tighter margins are rippling
through the farmland and cash rent markets. This
small survey indicates the adjustment process may
stretch over the next several years. The majority of
the professional farm managers forecast that
farmland values would have a gradual decline. Using
the 9% decline respondents indicated for February
1, 2015, to February 1, 2016, and the anticipated
8% reduction from 2016 to 2017, the two-year
decline is about 17%. So, is this a gradual decline?
How will farmland value declines of 17% to 20%
change landowners’ balance sheets and the
conversations with their lenders?
Cash rents are also adjusting downward.
Respondents indicate from February 1, 2015 to
February 1, 2016 cash rent declined 8%. There were
two groups when asking respondents about changes
in 2017. One group indicated no further decline. The
other group expected further declines with an
average decline of 8.5%. Over this two-year period,
this leaves a decline of 8% to 16.5%. Will there be
further declines? In the spring of 2016, these
reductions do not appear to be large enough for
many tenants to regain profitability on rented
farmland. In addition, many tenant budgets will
suggest further erosion of their working capital with
current costs and new-crop grain prices. This
suggests further reductions in cash rents unless
grain prospects improve or some costs drop more
rapidly.

P a g e | 3
PURDUE AGRICULTURAL ECONOMICS REPORT MARCH 2016
Small Business Administration Disaster Loans after Hurricane Katrina Anna Josephson and Maria Marshall, Professor of Agricultural Economics
Hurricane Katrina, which hit the southeastern United
States over ten years ago in August of 2005, was the
costliest hurricane in the history of the country. The
storm cost more than $108 billion in damages and
over 1,800 lives were lost (FEMA, 2013). As a result,
the recovery effort was a tremendous undertaking.
In order to assist in the rebuilding, the United States
government promised $45 billion in loans and
rebuilding funds (FEMA, 2013). One of these sources
of funding was the Small Business Administration
(SBA), and their small business disaster loans.
The SBA provides small business disaster loans to
businesses and individuals for losses not covered by
insurance. Disaster loans are different from SBA
commercial loans, which are provided by commercial
banks but guaranteed by the SBA. Disaster loans are
provided directly by the federal government.
SBA small business disaster loans provided to small
businesses affected by Hurricane Katrina are the
subject of this article. In particular, we consider the
differences in small businesses which applied for a
loan and small businesses which did not apply for a
loan following Hurricane Katrina. As any business in
a declared disaster area is eligible to apply for a loan,
understanding the characteristics of businesses
which applied versus those that did not apply is
important. We consider these differences for a group
of approximately 500 small businesses in southern
Mississippi.
SBA Background and History
Following a disaster, regions are designated as
“declared disaster areas”. Businesses and individuals
located within these regions are then eligible for
financial assistance from the SBA. Businesses of any
size, most private nonprofit organizations, and
homeowners may apply to the SBA for a loan. Loans
are intended to cover losses not fully protected by
insurance. Three primary loan types exist, including:
1) home and personal property loans, 2) business
physical disaster loans, and 3) economic injury
disaster loans.
Although SBA loans were available following
Hurricane Katrina, evidence suggests that the
process was mismanaged and that many eligible
business owners were either rejected or failed to
apply altogether. The Associated Press released a
report based on SBA data, finding that 55 percent of
homeowners and businesses that applied for
disaster loans were turned away. Of 318,953
applications processed, 175,463 were rejected and
143,490 were approved. Further, of the approved
loans, only 60 percent ultimately reached recipients.
SBA officials claim that many applicants never
accepted the loans as they found other ways to
rebuild. But, many applicants indicated that
applications were abandoned as the process took
too long and was overly complicated (Weiss, 2010).
P a g e | 4
PURDUE AGRICULTURAL ECONOMICS REPORT MARCH 2016
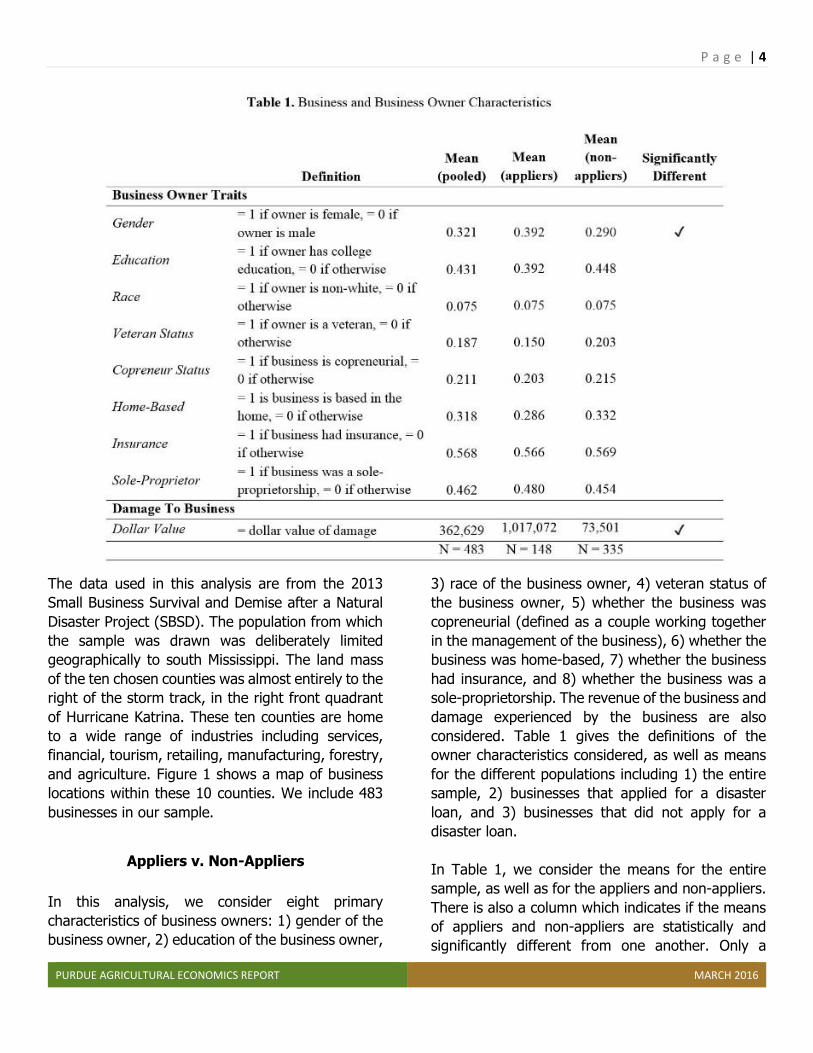
The data used in this analysis are from the 2013
Small Business Survival and Demise after a Natural
Disaster Project (SBSD). The population from which
the sample was drawn was deliberately limited
geographically to south Mississippi. The land mass
of the ten chosen counties was almost entirely to the
right of the storm track, in the right front quadrant
of Hurricane Katrina. These ten counties are home
to a wide range of industries including services,
financial, tourism, retailing, manufacturing, forestry,
and agriculture. Figure 1 shows a map of business
locations within these 10 counties. We include 483
businesses in our sample.
Appliers v. Non-Appliers
In this analysis, we consider eight primary
characteristics of business owners: 1) gender of the
business owner, 2) education of the business owner,
3) race of the business owner, 4) veteran status of
the business owner, 5) whether the business was
copreneurial (defined as a couple working together
in the management of the business), 6) whether the
business was home-based, 7) whether the business
had insurance, and 8) whether the business was a
sole-proprietorship. The revenue of the business and
damage experienced by the business are also
considered. Table 1 gives the definitions of the
owner characteristics considered, as well as means
for the different populations including 1) the entire
sample, 2) businesses that applied for a disaster
loan, and 3) businesses that did not apply for a
disaster loan.
In Table 1, we consider the means for the entire
sample, as well as for the appliers and non-appliers.
There is also a column which indicates if the means
of appliers and non-appliers are statistically and
significantly different from one another. Only a
P a g e | 5
PURDUE AGRICULTURAL ECONOMICS REPORT MARCH 2016
single variable has a
statistically different mean
for appliers and non-
appliers: gender of business
owner. While 32% of all
businesses in the sample
have a female owner, 39%
of those who applied for a
loan were female, while only
29% of those who did not
apply were female. This
indicates that female
business owners were more
likely to be appliers. It is not
clear at this time why women
would be more likely to be
appliers, on average, than
non-appliers; however,
based on the support by the SBA for women-owned
businesses, perhaps the greater application of
women is a signal of the success of these programs
(SBA, n.d.).
Other characteristics of business owners are not
significantly different between appliers and non-
appliers. Some traits have slight, though not
statistically significant differences. These include:
1. Education: 43% of business owners have a
college education; only 39% of appliers have
a college education while 45% of non-
appliers do.
2. Veterans: 19% of business owners are
veterans; only 15% of appliers are veterans
while 20% of non-appliers are.
3. Coprenerial status: 21% of business owners
are copreneurs; only 20% of appliers are
coprenerial, while 22% of non-appliers are.
4. Home-based: 32% of businesses are home-
based, only 29% of appliers are home-
based, while 33% of non-appliers are.
5. Sole-proprietorship: 46% of businesses are
sole-proprietors; 48% of appliers are sole-
proprietors, while only 45% of non-appliers
are.
For the remaining two traits, there are effectively no
differences; 7.5% of all the groups are non-white,
while 57% of all groups had insurance.
Several of these similarities are encouraging. In
particular, there seems to be no bias for application
towards only those with college education and no
bias against application for non-white business
owners. As the SBA seeks to help all business owners
and other eligible individuals impacted by disaster, it
is encouraging that no bias in application is evident.
However, one of the lacks of difference is somewhat
surprising. That is, the result that there is no
difference between appliers with insurance and non-
appliers with insurance is somewhat unexpected as
SBA loans only cover losses not covered by
insurance. Thus, it would seem that those without
insurance would be more likely to apply, though this
is not the case. This can be explained, however, as
insurance is often mandated for homeowners or
renters. It is possible that businesses had insurance,
but did not have enough insurance to cover the
damage sustained from the storm. This resulted in
businesses with insurance applying for loans,
causing no difference between appliers with
insurance and non-appliers with insurance.

P a g e | 6
PURDUE AGRICULTURAL ECONOMICS REPORT MARCH 2016
It is also important to consider the financial
considerations of the business. The first of these
considered is the size of business revenue. There is
no clear distinction in the size of revenue between
appliers and non-appliers; businesses with revenues
over a million dollars are not significantly less likely
to apply, nor are businesses with revenues less than
$50,000 significantly more likely to apply. This
suggests that application status is equitable across
businesses, with respect to revenue.
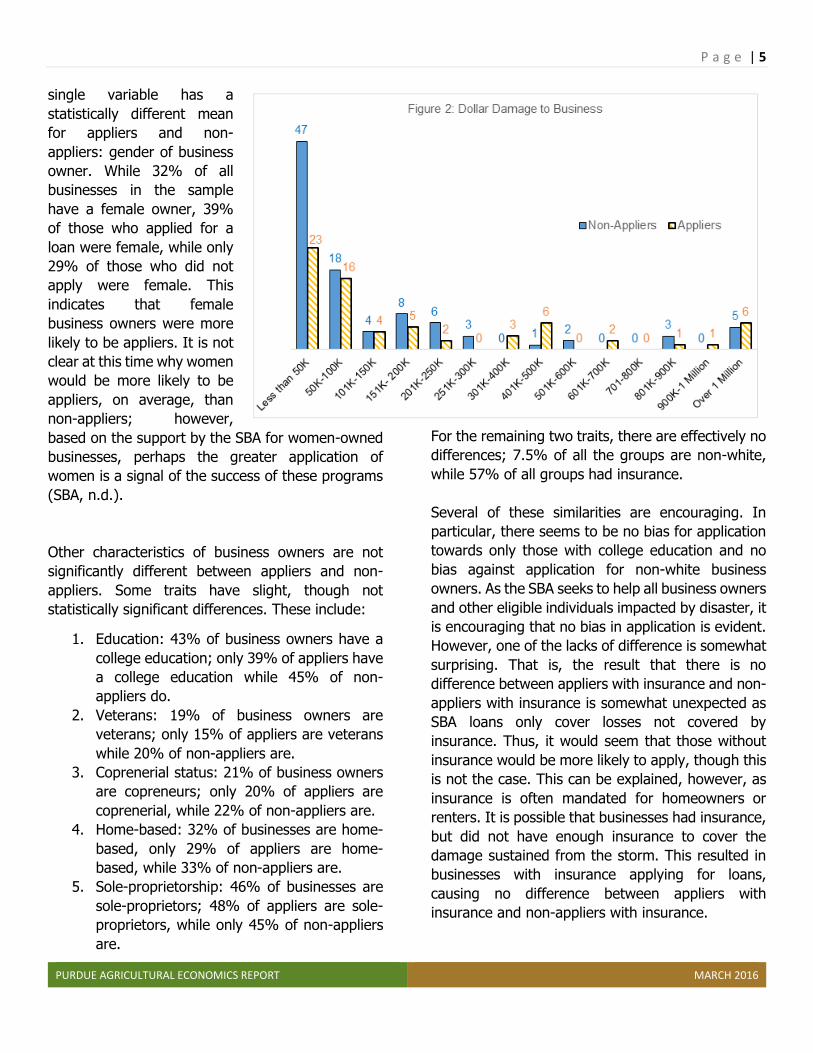
Additionally, when considering application for loans,
it is imperative to consider damage to the business.
This particular variable measures the damage to the
physical facility in which the business is housed.
Mean statistics are given in Table 1, with a range
seen in Figure 2. Table 1 shows that, on average,
businesses had an average of $362,629 of damage.
As one would expect, for those who applied for
loans, damage was much higher: $1,017,072.
Further, for those who did not apply, damage was
much lower: $73,501. This follows expectations, as
those with less damage are less likely to apply, as
they have less need for the loan; their losses may be
covered by insurance or they may be able to
independently cover the cost of reconstruction.
Conversely, those with more damage are more likely
to apply, as their losses may not entirely be covered
by insurance and it would be difficult to
independently cover the cost of repairs.
Figure 2 expands on these damage statistics. Not
shown in Figure 2 are businesses with a damage
value of zero. For those businesses which applied
there are 79 businesses with no damage while for
those businesses which did not apply there are 240
businesses with no damage. It may be somewhat
puzzling that there would be appliers with no
damage. However, this is possible as businesses are
able to apply for loans related to economic injury or
damage to personal property with no reported
damage to the physical structure of the business.
However, it is worth noting that businesses with less
than $50,000 of damage which do not apply are the
largest group represented; this makes sense, as
those with less damage are less likely to apply.
Why Apply or Not Apply?
Small business disaster loans from the Small
Business Administration were available to
businesses in Mississippi following Hurricane Katrina,
in order to help them recover losses not otherwise
covered by insurance. This article reports on
differences between the businesses which applied
and the businesses which did not apply for an SBA
disaster loan. We examined several characteristics
of the business owner, as well as two financial
measures. The analysis largely revealed that there
are few differences between those businesses which
applied and those businesses which did not. While
female business owners are more likely to be
appliers than not, there are no significant differences
with respect to education, race, veteran status, or
insurance.
Two circumstances have mixed results. First, there
is not a definitive discrepancy in business revenue
between appliers and non-appliers; businesses with
revenues over a million dollars are not significantly
less likely to apply, nor are businesses with revenues
less than $50,000 significantly more likely to apply.
However, there is a strong distinction with respect
to amount of damage: the average damage for
those businesses which apply is nearly fourteen
times greater than damage for those businesses
which did not apply. Thus, the amount of damage
was more important than size of revenue for
businesses which would apply for an SBA loan.
Although these results do not tell us everything that
we may want to know about the differences between
appliers and non-appliers, it does suggest that there
is little bias in the process of application for SBA
loans. Given the controversy at the SBA which
followed Hurricane Katrina due to difficulties with
the application and administration process for the
disaster loans, this is an encouraging result.
P a g e | 7
PURDUE AGRICULTURAL ECONOMICS REPORT MARCH 2016
References:
FEMA: Federal Emergency Management Agency, (2013),
“About Hurricane Katrina”, available at:
http://www.fema.gov/response-recovery/about-
hurricane-katrina (Accessed March 15, 2014).
SBA: Small Business Administration, (n.d.). “Women
Owned Businesses: SBA Resources for Women” available
at: https://www.sba.gov/content/women-owned-
businesses (Accessed January 9, 2015)
Weiss, M. (2010), “No Compassion for Katrina Loan
Applicants”, Associated Press. (Accessed May 19, 2014).
This article is based upon material from the Purdue
University Project “Small Business Survival and Demise
after a Natural Disaster”, supported by NSF Grant
#0856221-CMMI and “Small Business Disaster Recovery
Process: An Analysis of Rural Communities in Mississippi”
supported by USDA-NIFA grant # 2011-67023-30609.
The Agricultural Communications Gap: Agricultural Economics Responds Jessica Eise, Director of Communications, Agricultural Economics
Some two hundred years ago, over 90% of
Americans worked in or around agriculture. Farming
and food production was a way of life. With the
majority of people growing up on or near a farm, our
population understood our food system. Agriculture
permeated nearly everyone’s existence, and this
provided the population with a baseline of
knowledge to form opinions.
Today, our culture has radically shifted. Due to
impressive increases in productivity and efficiency,
only 2% of the American population works in or
around agriculture production. While this has been a
great advancement for our nation, it has had an
unintended effect on communication. The gap
between those who ‘know’ agriculture, and those
who do not, has dramatically grown. The
consequences of this gap have not been positive in
some cases.
Familiarity to a subject or issue provides us with
many insights. When a rainy summer only means
you cannot go on as many bike rides or morning
walks, you understand the consequences of weather
conditions very differently than someone in
agriculture. To a farmer, weather conditions are
significantly more than just a minor inconvenience –
they can make or break that year’s crop.
When considering communicating with those outside
of agriculture it is safe to assume that 98% of the
American population does not understand
production agriculture. They are far removed from
the realities of the sector and likely do not know
anyone who works in the field. Given the geographic
realities of farming (the necessity for space) plus the
migration of Americans to urban areas, there is even
less overlap.
People without exposure to agriculture are not
intentionally careless or insensitive. Most behavior is
driven by ignorance. Decades ago, a neighbor would
have been keenly aware of the impact of weather on
their farmer neighbor, and would have developed an
understanding and respect over years of interaction
and day-to-day communication. This is no longer the
case. Demographic shifts have cut off the lion’s
share of informal communication between
agricultural stakeholders and everyone else.
With most of the informal communication
opportunities gone, it has become incumbent upon
both agricultural stakeholders and interested
consumers to proactively communicate. To date, this
has not always been a priority of those within
agriculture, and on the consumer side, seeking
P a g e | 8
PURDUE AGRICULTURAL ECONOMICS REPORT MARCH 2016
balanced information has not always been done
effectively or thoroughly. A starting point for moving
forward is to recognize these altered demographics,
and to consciously decide to re-open lines of
communication between agriculture and the broader
society. As a department, we have started down that
path.
Purdue Agricultural Economics Department
Responds
With these goals in mind, the Purdue Department of
Agricultural Economics has initiated a number of
programs and changes to help better communicate
agricultures important stories.
New Center: The Center for Commercial Agriculture
was created to study global security of food, fuel and
fiber in a way that is relevant and impactful to the
farms managing these sources.
New Undergrad Class: The majority of our Purdue
undergraduate students and a growing number of
our Ag School students do not have a farm
background. In order to narrow the communications
gap, the Department has initiated a new class,
Introduction to the Business of Commercial
Agriculture. The course uses case studies, field trips,
and guest lectures by farmers and agribusiness
managers to learn from each other.
Events Mix Agriculture and Urban: Each summer, the
Department and Purdue Extension sponsor the
Indiana State Farm Management Tour. Each June,
four or five farms and Ag businesses host the two-
day event. They open their site to the public to see
the latest technology and to talk about managing Ag
businesses. While agricultural managers are the
dominant part of the 500 attendees, an increasing
number of urban families are also learning about
their farm neighbors.
Keeping Consumers Informed: Ag Economics faculty
are actively engaged in providing hundreds of media
interviews each year on how agriculture works and
why it is critical to consumers. Whether it is
explaining how a drought will influence food prices
to USA Today, explaining how Avian Influenza
affects the availability of eggs to a syndicated radio
show, or explaining how corn ethanol affects the
gasoline market to a Wall Street Journal reporter,
through the mass media, the Department helps
educate millions about the role of agriculture.
Graduate Course: The department has created a
new one-credit course for our graduate students
dedicated to teaching communication and
multimedia skills in the agricultural context. This
course, Multimedia and Communications in
Agricultural Economics, teaches our graduate
students practical communications skills in today’s
environment.
Online: The department’s website hosts a range of
information on agricultural economics, and the
department is newly present on Facebook, Twitter,
YouTube as well as producing biweekly podcasts.
Growing the Pork Industry: Exports to China John Lai, Graduate Research Assistant and H. Holly Wang, Professor
The U.S. pork industry has had to face numerous
complex challenges over the past decade including
an era of high feed prices and the porcine epidemic
diarrhea virus (PED) in late 2013 and 2014. In 2015
and 2016 the industry has responded to lower feed
prices by expanding production and has recovered
from PED. As a result of these events, per capita
pork consumption has recovered from a low of 46.4
pounds in 2014 to over 50 pounds for 2016. After
two years of rapid recovery, long-term projections
from the USDA (Westcott & Hansen, 2015) suggest
P a g e | 9
PURDUE AGRICULTURAL ECONOMICS REPORT MARCH 2016
more moderate, but continued gains over the next
10 years.
One likely avenue for that future growth can be
found in exports. Given the importance of China as
a buyer of food commodities in recent years there
have been multiple studies examining their pork
market and also studies to better understand their
pork consumers.
There was much optimisism in the U.S. a few years
ago regarding the potential for greater pork exports
to China and Hong Kong, but the actual results are
more mixed. China primarily produces their own
pork. In 2015, 98.5% of their pork supply was
domestically produced and only 1.5% was imported.
In addition, imports have stayed near 1.5% of
supply since 2011, indicating only small import
growth.
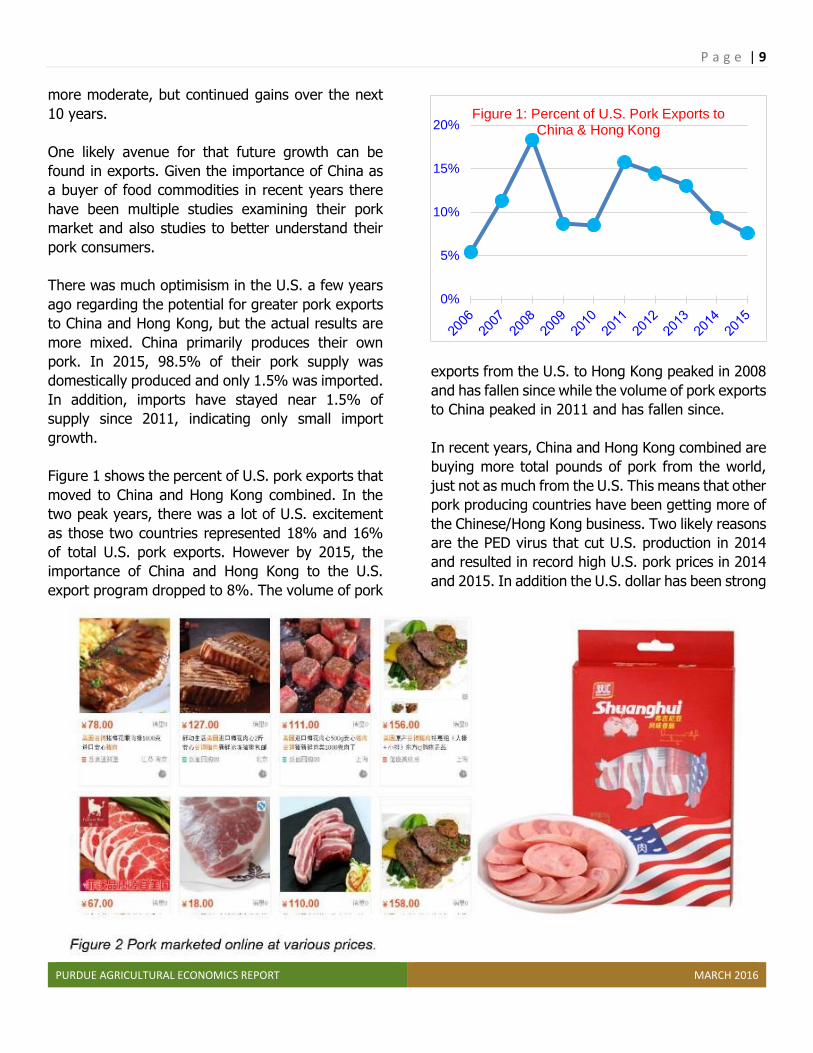
Figure 1 shows the percent of U.S. pork exports that
moved to China and Hong Kong combined. In the
two peak years, there was a lot of U.S. excitement
as those two countries represented 18% and 16%
of total U.S. pork exports. However by 2015, the
importance of China and Hong Kong to the U.S.
export program dropped to 8%. The volume of pork
exports from the U.S. to Hong Kong peaked in 2008
and has fallen since while the volume of pork exports
to China peaked in 2011 and has fallen since.
In recent years, China and Hong Kong combined are
buying more total pounds of pork from the world,
just not as much from the U.S. This means that other
pork producing countries have been getting more of
the Chinese/Hong Kong business. Two likely reasons
are the PED virus that cut U.S. production in 2014
and resulted in record high U.S. pork prices in 2014
and 2015. In addition the U.S. dollar has been strong
0%
5%
10%
15%
20%Figure 1: Percent of U.S. Pork Exports to
China & Hong Kong
P a g e | 10
PURDUE AGRICULTURAL ECONOMICS REPORT MARCH 2016
relative to other currencies since 2014 and this has
tended to make U.S. pork less competitive relative
to other pork exporting countries.
Get to Know Chinese Consumers
If the U.S. is going to grow the Chinese/Hong Kong
markets then a better understanding of consumer
taste and preferences will be helpful. The goal is to
carefully match pork export products for each
segmented market. Here I review some of those
findings.
David Ortega and his colleagues at Michigan State
University along with Holly Wang at Purdue
University found that consumers in China differ from
those in Hong Kong. In China, more attention is paid
to the freshness and packaging of pork and
therefore domestic produced pork is preferred. On
the other hand, consumers in Hong Kong prefer pork
from developed countries like the U.S. and consider
the meat to be of higher quality than meat from
mainland China. Regardless of whether the pork is
domestic or foreign, food safety is considered the
most important indicator of pork quality for both
regions, a belief that has been strengthened in
recent years due to numerous Chinese food related
scandals.
Another study examined Chinese consumers’
preferences and willingness to pay for traceable food
quality and safety attributes. Researchers at the
Synergetic Innovation Center of Food Safety and
Nutrition found that government certification was
the most important quality indicator for consumers.
Murphy et al (2015) explains that consumers also
had strong preferences for very fresh-looking pork
with traceability information which includes the farm
source and slaughtering, processing and marketing
information.
Finally, a study conducted by the Center for Meat
Safety and Quality at Colorado State University
showed that for 70% of Chinese importers, the price
was considered as highly influential in where they
buy pork, while only 20% of importers in China and
Hong Kong considered the exchange rate as a
deciding factor. Wu, et al. (2015) explains that the
same group defined food safety as using
government, or third party certifications.
Although many pork products imported from
developed countries are considered safer and of
higher quality than domestically produced pork,
Chinese consumers have misinformation about U.S.
pork such as its dull taste, the use of growth
hormones, and ractopamine. For these reason,
Wang, argues that it is difficult for U.S. pork to
compete with Chinese traditional pork in the retail
market directly. Instead, it may be more beneficial
to promote U.S. pork as a high-end, high-value
product. Figure 2 provides two examples of U.S.
pork products sold on-line in China. The cuts shown
are from different vendors, they all are in western
style instead of the traditional Chinese style, and
each are priced quite high.
Shuanghui is the signature brand for WH Group that
acquired U.S. based Smithfield Foods and
specifically indicates the flavorful product is from
Virginia. This promotes the image that U.S. pork is
for Chinese consumers seeking an upscale western
lifestyle.
There is an increasing need for U.S. pork exporters
to connect with pork importers in the international
arena. China and Hong Kong provide a market with
a growing middle class who are seeking a higher
quality and safer source of pork. However, there are
other pork exporting countries seeking the same
markets. For U.S. exporters to be successful they
must understand the expectations of pork importers
in China and Hong Kong and simultaneously fill the
needs of those consumers.
References
Westcott, P., & Hansen, J. (2015). USDA
Agricultural Projections to 2024. United States
Department of Agriculture.
P a g e | 11
PURDUE AGRICULTURAL ECONOMICS REPORT MARCH 2016
Chen, Maolong, David L. Ortega, and H. Holly
Wang. "Chinese consumers’ perception of imported
versus domestic pork quality." (2015).
Murphy, R. G. L., et al. "Definition, willingness-to-
pay, and ranking of quality attributes of US pork as
defined by importers in Asia and Mexico." Journal
of animal science 93.1 (2015): 433-441.
Ortega, David L., H. Holly Wang and Maolong
Chen. “Emerging Markets for U.S. Meat and Poultry
in China.” Choices: The Magazine of Food, Farm,
and Resources Issues 30. 2 (2nd Quarter 2015).
Wu, Linhai, et al. "Chinese consumers’ preferences
and willingness to pay for traceable food quality
and safety attributes: The case of pork." China
Economic Review (2015).
New Faces in Agricultural Economics
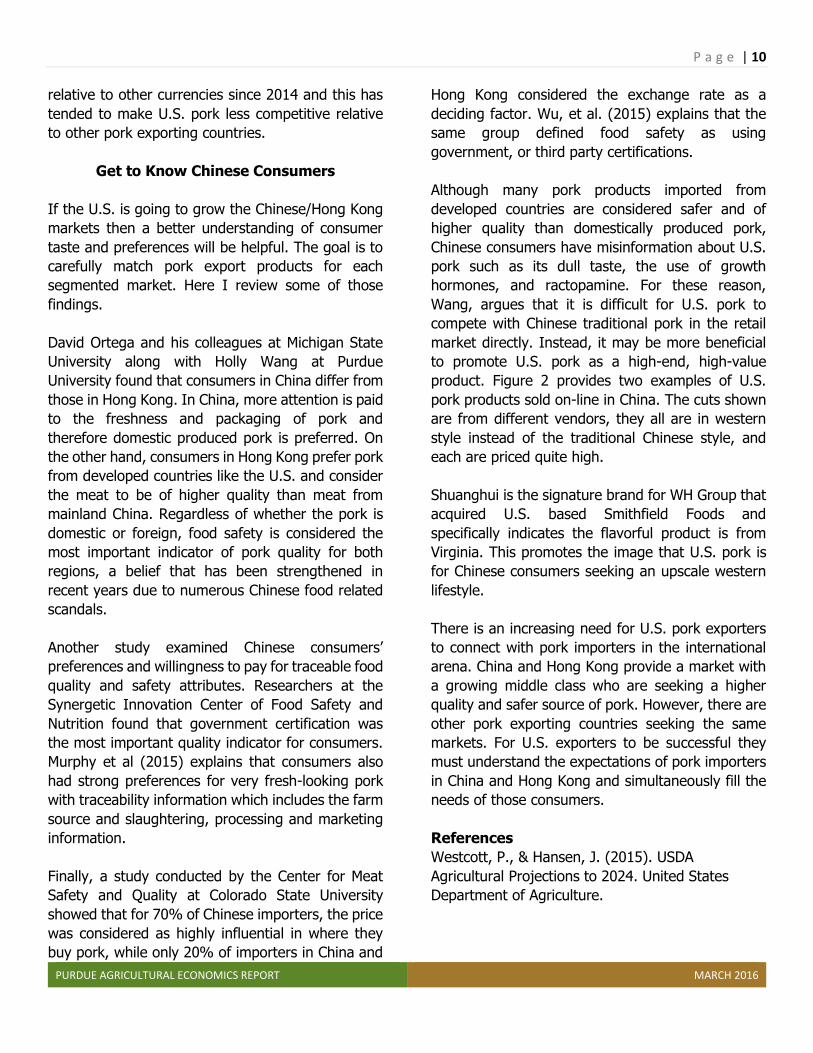
Dr. Bhagyashree Katare
Dr. Bhagyashree Katare joined the department in August of 2015. She earned her Master of Financial Mathematics degree, Master of Science degree in Applied Economics, and a Doctorate in Applied Economics from the University of Minnesota. During her doctoral program, Dr. Katare has taught courses in Economics and Statistics as an adjunct faculty. She has also worked as a consultant for World Bank and Young Lives Project. Dr. Katare’s research interests are in the economics of food, health, nutrition, and particularly on the empirical analysis of consumption behavior related to health outcomes. Her current research centers on the economic determinants of weight gain and the spread of obesity. In the next few years, Dr. Katare will develop a research program focused on understanding how environmental factors and peers influence the health choices and decisions of individuals. Her teaching responsibilities include an undergraduate course in agricultural marketing.
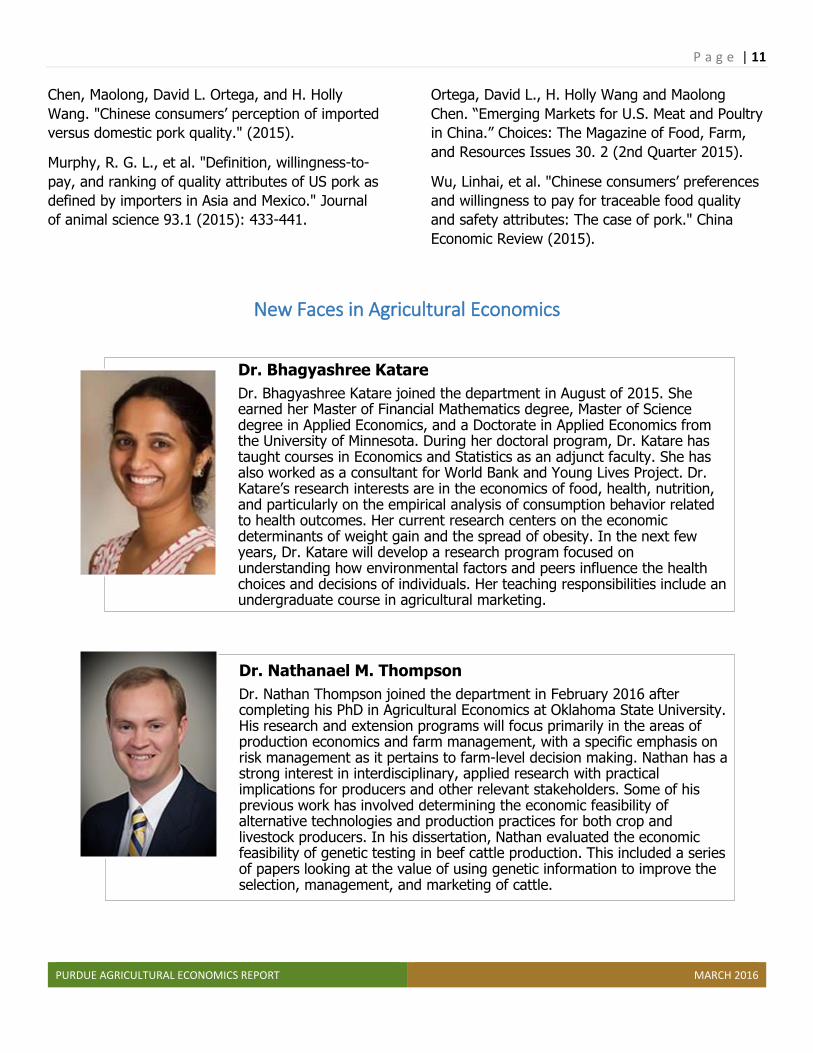
Dr. Nathanael M. Thompson
Dr. Nathan Thompson joined the department in February 2016 after completing his PhD in Agricultural Economics at Oklahoma State University. His research and extension programs will focus primarily in the areas of production economics and farm management, with a specific emphasis on risk management as it pertains to farm-level decision making. Nathan has a strong interest in interdisciplinary, applied research with practical implications for producers and other relevant stakeholders. Some of his previous work has involved determining the economic feasibility of alternative technologies and production practices for both crop and livestock producers. In his dissertation, Nathan evaluated the economic feasibility of genetic testing in beef cattle production. This included a series of papers looking at the value of using genetic information to improve the selection, management, and marketing of cattle.

P a g e | 12
PURDUE AGRICULTURAL ECONOMICS REPORT MARCH 2016
It is the policy of Purdue University that all persons have
equal opportunity and access to its educational programs,
services, activities, and facilities without regard to race,
religion, color, sex, age, national origin or ancestry, marital
status, parental status, sexual orientation, disability or status
as a veteran.
Purdue University is an Affirmative Action institution.
This material may be available in alternative formats.
Dr. Chris Hurt, PAER Editor and Professor of Agricultural Economics
Dr. Craig Dobbins, Professor of Agricultural Economics
Anna Josephson, Agricultural Economics Graduate Research Assistant
Dr. Maria Marshall, Professor of Agricultural Economics
Jessica Eise, PAER Production Editor and Director of Communications of Agricultural Economics
John Lai, Agricultural EconomicsGraduate Research Assistant


