Embed Size (px)
Citation preview


CONTENTS
CHAIR’S REPORT .............................................................................................................................. 1
MANAGING DIRECTOR’S REPORT ..................................................................................................... 3
DIRECTORS’ REPORT ........................................................................................................................ 6
OPERATING AND FINANCIAL REVIEW ............................................................................................. 10
REMUNERATION REPORT .............................................................................................................. 19
AUDITORS INDEPENDENCE DECLARATION ..................................................................................... 32
CORPORATE GOVERNANCE STATEMENT ........................................................................................ 33
FINANCIAL STATEMENTS ............................................................................................................... 43
DIRECTORS’ DECLARATION ............................................................................................................ 75
INDEPENDENT AUDITORS REPORT ................................................................................................. 76
ASX ADDITIONAL INFORMATION ................................................................................................... 78
CORPORATE INFORMATION .......................................................................................................... 80

Page 1
Chair’s Report For the 2016 Financial Year
Dear Shareholder, The business model of Lifestyle Communities’ is very sound. From a financial perspective we do not
require any more equity as we recycle capital through our projects, returns on new developments are
attractive and stable, and our management or rental incomes have grown to a stage where we can pay
dividends on a sustainable and growing basis. We are continually watchful about risks to these
attractive financial settings and whilst the Board worries about and debates many risks, there is no
significant risk that we have currently observed that should materially upset our model.
But what is particularly satisfying about the Company’s business model is the market acceptance of our
offer and the positive impact it has on the people living in our communities. We use a range of measures
to monitor homeowner satisfaction levels but the most telling is our referral rate (the percentage of
new homes settled via an introduction from one of our existing homeowners). For several years our
referral rate has been about 33%, so one in three of our new homes have been sold and settled via an
existing homeowner introduction. Whilst we offer our homeowners a small financial incentive to assist,
this is a very high referral rate, we are proud of it and it supports why our business model is attractive.
A few months ago, James Kelly, our Managing Director announced our ambition to increase this referral
rate to 50% or one in every two settlements. As a Board we are excited about this challenge for one
significant reason. The Company will not be able to lift the referral rate by operating the same way. We
will need to examine our processes and the points at which we interact with our homeowners and look
for ways to change and improve. Going through this process of self‐assessment, review and hopefully
improvement will be extremely healthy for the Company.
The 2016 financial year was another successful one for Lifestyle Communities. We settled 202 new
homes taking the total number of settled homes to 1,348 with 1,995 people (as at 30 June 2016) now
living in our communities throughout Victoria. Notwithstanding the number of new home settlements
were lower than in the 2015 financial year, profitability and dividends both increased compared with
the prior year.
To continue to grow in the future the Company needs to acquire suitable land at a reasonable price.
Given the strength in the housing market, particularly in New South Wales and Victoria, the Board
regularly assesses the challenges of acquiring land for new communities. Pleasingly, during the 2016
financial year, the Company was able to acquire two new sites in Bittern and Ocean Grove which has
bolstered our medium term development pipeline. Both sites are ideally suited for one of our
affordable retirement communities.
The Board of Lifestyle Communities remained stable during the 2016 financial year with no changes.
We regularly assess the size and composition of the Board but we are currently comfortable with both.

Page 2
During the 2016 financial year the Board spent a significant amount of time discussing with James our
resourcing plan for the next phase of the Company’s growth. The additions we have made leave us very
well placed to continue to grow the number of homes we have under development and management.
We have also spent considerable time discussing and implementing a new incentive plan to ensure our
team continues to be strongly aligned to the execution of our corporate plan. Both developments are
outlined further in this Annual Report.
Finally, on behalf of the Board, I would like to thank all of our homeowners, our talented team and our
shareholders for great support during the 2016 financial year as we continue our mission to dominate
our niche of providing good quality affordable accommodation for active retirees in Victoria.
Yours sincerely
Tim Poole
Chair
18 August 2016

Page 3
Managing Director’s Report For the 2016 Financial Year
Dear Shareholder
I am pleased to present to you the Lifestyle Communities Annual Report for the year ended 30 June
2016.
The 2016 financial year has seen the addition of 202 new home settlements now providing 1,348 settled
homes within our communities providing annuity income streams. I am pleased with the acquisition of
two new sites during the year located at Bittern and Ocean Grove. Bittern is located on Melbourne’s
Mornington Peninsula and Ocean Grove is located on Geelong’s Bellarine Peninsula and I am confident
these sites, along with current developments will provide a strong platform to grow the business in the
2017 financial year and beyond. Our development plan remains focused in Victoria and we continue
to investigate further sites in Melbourne’s key growth corridors. As our brand has become better
known we are getting more approaches from developers who are interested in having Lifestyle
Communities as part of their development mix.
The development focus of the business is now on Shepparton, Lyndarum, Geelong, Officer and Berwick
Waters after fully selling and settling some very successful projects at Casey Fields, Chelsea Heights and
Hastings during the 2016 financial year. Whilst Shepparton, Lyndarum and Geelong have performed
well Officer and Berwick Waters have exceeded expectations and show the potential of the business
and the market we operate in. Officer was launched for sale in March 2015 and by the end of the 2016
financial year had sold 93 homes. Officer also contributed 27 settlements in three months with the first
homeowner settling in April 2016. Berwick Waters was launched for sale in April 2016 and has seen 40
sales in four months.
At our recent Investor Day in April 2016 I outlined the evolution of the business and provided some
new home settlement goals for the 2017 and 2018 financial years as per below:

Page 4
In order to meet the settlement objectives above in the 2017 financial year we are enhancing the
capability and depth of the sales team by introducing dual sales consultants at most community
locations. Although we remain a lean organisation we have hired some additional executive resources
during the 2016 financial year. The positions added were seen as essential to support growth and assist
the Company to achieve the settlement targets in the 2017 and 2018 financial years.
A key focus that I have set the organisation for the coming two years is to increase the number of home
owner referrals for new sales and resales. Currently approximately one in three sales are coming from
homeowner referral and I have set a goal to increase this to approximately one in two sales by ensuring
that we make every touch point with the customer a very positive one and one they will remember.
This strategy will deliver results into the future as it will decrease our reliance on marketing as well as
differentiating against competitors.
The key highlights for the 2016 financial year include:
Acquiring two additional sites in Bittern and Ocean Grove;
Achieving 93 sales at Officer in the first 16 months and 27 settlements in the first three months;
Achieving 40 sales at Berwick Waters since launch four months ago;
Completion of a five‐year, $80 million debt facility with Westpac Bank;
Increasing the total portfolio to 2,445 home sites either under planning, development or
management;
Net profit after tax attributable to shareholders increased by $2.6 million to $19.3 million (this
includes a $2.4 million adjustment to reflect favourable changes in investment property
valuations);
Home site annuity rentals increased by $1.9 million to $11.1 million; and
Deferred management fees (inclusive of selling and administration fees) increased by $0.9
million to $2.5 million with the settlement of 52 resale settlements (2015: 34).
The Company now has eleven years of increasing annuities flowing from site rentals and deferred
management fees. The rental fees increase annually by the greater of CPI or 3.5% creating a strong
inflation linked annuity flow for future dividends.

Page 5
Other highlights for the year include:
Adding 202 settlements, taking the total number of home sites settled under management to
1,348;
Announcing the expansion of Lifestyle Shepparton by 47 homes due to the excellent progress
with this project;
Settling out of communities in Warragul, Casey Fields, Chelsea Heights and Hastings during the
year. We now have six communites fully occupied; and
Launching a new employee equity incentive scheme available to all staff commencing in
respect of the 2017 financial year.
FinalIy I am pleased to report that the Lifestyle Communities Foundation has been established to
remember one of my co‐founders, Dael Perlov’s life and significant contribution to this business. The
goal of the Foundation is to annually donate $50 for every home under management to cancer research
and support by a combination of direct donation and co‐sponsoring initiatives from within our
communites. This support at a community level is very well received and enables Lifestyle Communities
to contribute at a homeowner level to a whole range of initiatives and ideas to raise money for cancer
charities. In the 2016 financial year over $57,000 was donated and I look forward to watching this
figure grow into the future.
Yours sincerely
James Kelly
Managing Director
18 August 2016

Page 6
Directors’ Report
The directors present their report together with the financial report of the consolidated entity
consisting of Lifestyle Communities Limited and the entities it controlled for the financial year ended
30 June 2016 and auditor’s report thereon.
Principal activities The principal activities of the consolidated entity during the financial year were developing and
managing affordable communities which offer homeowners an improved lifestyle. There have been no
significant changes in the nature of these activities during the financial year.
Results The consolidated profit after income tax attributable to shareholders of Lifestyle Communities Limited
for the year ended 30 June 2016 was $19,268,682 (2015: $16,652,690).
Directors The directors of the Company during the financial year and until the date of this report are set out
below. All directors held their position throughout the entire year.
Tim Poole, Non‐Executive Chair (BCom, CA)
Tim was appointed a Director of Lifestyle Communities Limited on 22 November 2007 and was
appointed Chair on 31 December 2012. Tim is also a member of the HR & Remuneration Committee.
He holds a Bachelor of Commerce from the University of Melbourne and is a Chartered Accountant.
Tim has more than 15 years’ experience as a Director of ASX listed and unlisted companies across the
financial services, infrastructure, aged care and resources industries. He is currently non‐executive
Chair of Aurizon Holdings Limited and McMillan Shakespeare Limited and is a non‐executive Director
of Reece Limited. He was formerly Managing Director of Hastings Funds Management, and a non‐
executive Director of Japara Healthcare Limited and Newcrest Mining Limited.
James Kelly, Managing Director (BBldg)
James was appointed Managing Director in September 2007 and is one of the founders of Lifestyle
Communities Limited.
With over 30 years’ experience in property development and construction, James brings to Lifestyle
Communities a wealth of knowledge and experience in the property industry. Prior to establishing
Lifestyle Communities, James held several senior management roles in property and related sectors,
including CEO of Dennis Family Corporation and roles at Coles Myer and Lend Lease Corporation. James
is the founding Chair of the Residential Land Lease Alliance, the peak body for the land lease industry.
He is also on the board of the Caravan Industry Association of Australia and is Vice President of the
Victorian Caravan Parks Association. James has not held any directorships in any other listed entities
during the past three years.

Page 7
Bruce Carter, Non‐Executive Director (BCom)
Bruce is one of the founders of Lifestyle Communities Limited and was appointed as an executive
Director in September 2007, transitioning to a non‐executive Director on 1 July 2015. Bruce is also a
member of the Audit Committee.
Bruce has more than 30 years’ experience in financial and business management. He was the co‐
founder of Australian Stock Exchange listed telecommunications company Pracom Limited, serving as
joint Managing Director from 1988 to 2002. Bruce brings to Lifestyle Communities Limited extensive
knowledge and experience of building, funding and operating complex ASX listed companies. Bruce
has not held any directorships in any other listed entities during the past three years.
Jim Craig, Non‐Executive Director (BEc, LLB (Hons) Adel, LLM Melb)
Jim was appointed a Director of Lifestyle Communities Limited on 31 December 2012. Jim is also a
member of the Audit Committee and Chair of the HR & Remuneration Committee.
After working as a lawyer in Australia and Japan, Jim joined Macquarie Group Limited. He held a
number of senior roles within Macquarie in the resources, infrastructure and fund management areas,
including leading Macquarie’s businesses in Europe from 2003‐2008. Jim is currently Chair of a number
of organisations including Cell Care Australia Pty Ltd, River Capital Pty Ltd and Trinity College (University
of Melbourne), a member of the investment committee of AustralianSuper and a non‐executive
Director of Australian United Investment Company Limited.
Philippa Kelly, Non‐Executive Director (LLB, F Fin, GAICD)
Philippa was appointed to the board of Lifestyle Communities Limited as a non‐executive Director on
18 September 2013. Philippa is also Chair of the Audit Committee and a member of the HR &
Remuneration Committee.
Philippa is an experienced property and finance executive with over 25 years’ experience in the
corporate sector and a background in law and investment banking at Goldman Sachs. Specialising in
property for the past 18 years, she is currently Chief Operating Officer of the Juilliard Group of
Companies, one of Melbourne’s largest private property owners, managing an extensive portfolio of
commercial and retail assets. Previous experience included seven years with Federation Centres
(formerly Centro Properties Group), working on the refinancing of the Group and with responsibility
for its institutional and wholesale funds management business.
Philippa is a member of the Deakin University Council, Chair of its Finance and Business Committee
and a member of the Remuneration Committee. Philippa is also a non‐executive Director of the
Australian Drug Foundation, including Chair of the Audit and Risk Committee. Philippa was previously
a non‐executive Director of ASX listed 3D Oil Limited until November 2013.
Geoff Hollis, Company Secretary (BCom, CA, AGIA)
Geoff was appointed as Company Secretary on 24 November 2011. Geoff joined Lifestyle Communities
Limited in February 2010 and prior to that he spent 10 years as a Chartered Accountant in professional
practice. Geoff was appointed as a member of the Institute of Chartered Accountants in June 2004 and
has completed a Graduate Diploma of Applied Corporate Governance.

Page 8
Directors’ interests At the date of this report, the interests of each Director in the shares and options of Lifestyle
Communities Limited were:
Director Fully Paid
Ordinary Shares Options over
Ordinary Shares
Tim Poole 1,224,607 ‐
Bruce Carter 7,079,433 ‐
James Kelly 13,045,566 ‐
Jim Craig 4,000,000 ‐
Philippa Kelly 65,000 ‐
Dividends A fully franked dividend of 1.5 cents per share was paid on 9 October 2015 (representing the 2015 final
dividend). A fully franked dividend of 1.0 cent per share was paid on 8 April 2016 (representing the
2016 interim dividend).
Since the end of the financial year the Directors have resolved to pay a fully franked dividend 1.5 cents
per ordinary share (representing the 2016 final dividend).
Share options 120,000 Convertible Repurchase‐able Employee Shares (CRES) were granted to an employee on 22 July
2015 as part of the Employee Share Loan Plan approved at the Company’s 2012 Annual General
Meeting.
During the year 1,250,001 ordinary shares were issued as a result of the exercise of 1,050,000 options
and the conversion of 200,001 CRES.
The 1,050,000 ordinary shares issued as a result of the exercise of options were fully paid with a
consideration of $795,000.
The 200,001 ordinary shares issues as a result of the conversion of CRES resulted in loans to relevant
employees of $175,201 that will be recognised as paid as the loans are repaid.
Unissued ordinary shares of the Company under option or CRES at the date of this report are as follows:
Date options granted
Number of unissued ordinary shares under
option
Issue price of the shares
Expiry date of the options
22 May 2013 333,331 $0.876 22 May 2018
22 July 2015 120,000 $2.696 22 July 2020
Significant changes in the state of affairs Refer to the Operating and Financial Review for the significant changes in the state of the affairs of the Company.

Page 9
Significant events after the balance date There are no matters or affairs that have arisen since balance date which significantly affect or may
significantly affect the operations of the consolidated entity.
Future developments Refer to the Operating and Financial Review for information on likely developments and the future
prospects of the Company.
Environmental regulation The consolidated entity’s operations are not subject to any significant Commonwealth or State
environmental regulations or laws.
Indemnification and insurance of directors and officers During the financial year the Company paid premiums in respect of a Directors’ and Officers’ insurance
policy. The nature of the liabilities insured and premium payable under this contract of insurance has
not been disclosed in accordance with confidentiality provisions within the policy.
Proceedings on behalf of the consolidated entity No person has applied for leave of Court to bring proceedings on behalf of the consolidated entity.
Directors’ meetings The number of meetings of Directors (including meetings of committees of Directors) held during the
financial year and the number of meetings attended by each of the Directors are:
Meetings of committees of directors’
Directors’ meetings Audit HR & Remuneration
Director Held Attended Held Attended Held Attended
Tim Poole 11 11 1 1 4 4
James Kelly 11 11 ‐ ‐ ‐ ‐
Bruce Carter 11 10 2 2 ‐ ‐
Jim Craig 11 10 3 3 4 4
Philippa Kelly 11 11 3 3 4 4
Corporate governance In recognising the need for the highest standards of corporate behaviour and accountability, the
Directors of Lifestyle Communities Limited support and have adhered to the principles of corporate
governance. The Company’s corporate governance statement is contained later in this report.
Auditor independence and non‐audit services The Directors received an independence declaration from the auditor of Lifestyle Communities Limited
which is provided in this report.
Non‐audit services The Company’s auditor, Pitcher Partners, provided tax compliance ($19,250), general tax advice
($14,995), human resources advice ($8,528), IT consulting ($2,250), and other agreed upon procedures
($5,750) at a total cost of $50,773 (2015: $42,790). The Directors are satisfied that the provision of
these non‐audit services is compatible with the general standard of independence for auditors imposed
by the Corporations Act 2001. The nature and scope of these non‐audit services means that auditor
independence was not compromised.

Page 10
Operating and Financial Review
Overview
The Company continued to develop and manage its portfolio of affordable lifestyle communities during
the 2016 financial year. Profit after tax attributable to shareholders was $19.3 million (2015: $16.7
million). Underlying profit after tax attributable to shareholders was $16.9 million (2015: $16.7 million).
Financial and operating highlights Measure FY2016 FY2015 Change Change %
Key financial data
Revenue A$ millions 70.2 78.8 (8.6) (11)
Earnings before interest and tax A$ millions 29.2 32.8 (3.6) (11)
Net profit before tax A$ millions 28.6 29.1 (0.5) (2)
Net profit after tax A$ millions 20.6 21.9 (1.3) (6)
Net profit attributable to shareholders A$ millions 19.3 16.7 2.6 16
Underlying net profit attributable to shareholders A$ millions 16.9 16.7 0.2 2
Operating cash flow A$ millions (14.2) 16.4 (30.6) (187)
Community cash flow(1) A$ millions 7.5 6.5 1.0 17
Gearing(2) % 25.6 17.2 8.4 49
Return on average capital employed(3) % 15.5 20.8 (5.3) (25)
Earnings per share A$ cents 18.6 16.5 2.1 13
Diluted earnings per share A$ cents 18.5 16.1 2.4 15
Dividend per share(4) A$ cents 2.5 1.5 1.0 67
Key operational data
Homes settled (gross) No. of homes 202 240 (38) (16)
Homes settled (after NCI)(5) No. of homes 188 188 ‐ ‐
Homes sold (gross) No. of homes 217 211 6 3
Homes sold (after NCI)(5) No. of homes 217 194 23 12
Average realised sales price of new homes (GST incl) A$’000 298 302 (4) (1)
Total number of homes (gross) No. of homes 1,348 1,146 202 18
Total number of homes (after NCI)(5) No. of homes 1,147 959 188 20
Total number of homeowners No. of people 1,995 1,701 294 17
Average age of homeowners Years 72 72 ‐ ‐
Number of resales settled(6) No. of homes 52 34 18 53
Average realised sales price of resales (GST incl) (7) A$’000 275 260 15 6
(1) Community cash flow comprises cash flows received from homeowner rentals and deferred management fees less
community operating costs and the net surplus/deficit provided from utilities
(2) Calculated as a ratio of net debt to net debt plus equity (net debt includes $5 million deposit held for the liquidity
buffer)
(3) Calculated as a ratio of EBIT divided by average total assets less current liabilities
(4) For FY2016 includes interim dividend of 1.0 cent per share and final dividend of 1.5 cents per share
(5) Gross number of homes adjusted for share of communities owned by non‐controlling interests
(6) Includes resales attracting a deferred management fee, there were a further 14 resales settled in FY2016 (FY2015: 8
resales) that didn’t attract a deferred management fee as the outgoing homeowners moved out within 12 months of
initial settlement in accordance with the Company’s Smart Buy Guarantee
(7) Average realised sales price of resales attracting a deferred management fee
Included in the table above are several non IFRS measures including earnings before interest and tax,
underlying net profit attributable to shareholders, community cash flow, gearing, return on average
capital employed and key operational data. These figures have not been subject to audit but have been
provided to give a better understanding of the performance of the Company during the 2016 financial
year.

Page 11
The increase in profit after tax attributable to shareholders $19.3 million (2015: $16.7 million) can be
mainly attributed to: increased contributions from net rental income and deferred management fees
received; fair value adjustments from investment property revaluations; and reduced finance costs
being partly offset by a reduced contribution from new home settlements (revenue and margin); and
increased development expenses and corporate overheads. The reduced contribution from new home
settlements and the increase in development expenses were in line with expectations.
Underlying profit of $16.9 million excludes a $2.4 million after tax impact of independent investment
property revaluations across the portfolio. Refer to the analysis of income statement section on page
14 for further details.
New home settlements for the year were 202 and, although down from 240 in the prior year, were in
line with expectations mainly due to the prior year pull forward of settlements due to the quicker
than anticipated sales and settlements at Casey Fields, Chelsea Heights and Hastings.
The Company continued to develop its communities at Shepparton, Lyndarum and Geelong. During
the year construction was completed at Chelsea Heights and construction commenced at Officer.
The Company made good progress operationally with improvements in several key metrics. The total
number of homes settled increased to 1,348 homes due to the 202 settlements during the year. Net
community cash flows were $7.5 million (2015: $6.5 million). This was driven by increases in rental
revenue and deferred management fees received, partly offset by increases in management expenses
which were in line with expectations.
The Company had 1,995 people living in its communities as at the end of the 2016 financial year with
an average age of 72 years (2015: 72).
Resales (sales of previously settled and occupied homes) during the year were 52 (2015: 34). Deferred
management fee income received (inclusive of selling and administration fees) was $2.5 million (2015:
$1.6 million). As at the 30 June 2016 there were 11 resale homes available for sale across the
communities.

Page 12
Update on communities
Community New homes Resales
Settled
FY16
Settled
FY15
Net
sales
FY16
Net
sales
FY15
Settled
FY16
Settled
FY15
Net
sales
FY16
Net
sales
FY15
Total
homes
settled
Total
homes in
portfolio
Brookfield ‐ ‐ ‐ ‐ 23 15 17 20 228 228
Seasons ‐ 1 ‐ ‐ 5 5 7 4 136 136
Warragul 2 12 ‐ 1 9 7 11 10 182 182
Casey Fields 2 42 ‐ 20 5 5 8 5 217 217
Shepparton 51 38 49 54 1 ‐ 1 1 149 268
Chelsea Heights 27 62 ‐ 13 5 2 6 2 186 186
Hastings 14 82 ‐ 31 4 ‐ 5 1 141 141
Lyndarum 43 3 39 22 ‐ ‐ ‐ ‐ 46 154
Geelong 36 ‐ 51 28 ‐ ‐ ‐ ‐ 36 164
Officer 27 ‐ 51 42 ‐ ‐ ‐ ‐ 27 151
Berwick Waters ‐ ‐ 31 ‐ ‐ ‐ ‐ ‐ ‐ 220
Bittern ‐ ‐ ‐ ‐ ‐ ‐ ‐ ‐ ‐ 208
Ocean Grove ‐ ‐ ‐ ‐ ‐ ‐ ‐ ‐ ‐ 190
Total 202 240 221 211 52 34 55 43 1,348 2,445
Lifestyle Brookfield in Melton, Lifestyle Seasons in Tarneit, Lifestyle Warragul, Lifestyle Casey Fields
in Cranbourne, Lifestyle Chelsea Heights and Lifestyle Hastings are fully sold and settled.
Lifestyle Shepparton performed well during the year achieving 49 net sales and 51 settlements.
Given the sustained lift in performance at Lifestyle Shepparton a decision was made during the
year to expand the community by 47 homes using surplus Company owned land. This increased
the size of the community to 268 homes of which 72% are sold and 56% are settled.
Lifestyle Lyndarum in Wollert achieved 39 sales and 43 settlements in its first full year of
operations. Consistent with other communities Lifestyle Lyndarum received a positive spike in
sales upon the opening of the clubhouse in the middle of the 2016 financial year with second‐half
sales more than doubling first‐half sales. The community is now 53% sold and 30% settled.
Lifestyle Geelong achieved 51 sales and 36 settlements in its first full year of operations. Lifestyle
Geelong also opened its clubhouse in the middle of the 2016 financial year with second‐half sales
almost doubling first‐half sales. The community is now 48% sold and 22% settled.
Lifestyle Officer welcomed their first homeowner in April 2016 and achieved 27 settlements for the 2016 financial year. The community has achieved 93 sales which represents 62% of the total available. This is a particularly pleasing project and is performing historically better than any other community. The clubhouse is due to open in September 2016 and this normally has a positive impact on sales.
The land for Lifestyle Berwick Waters was acquired in April 2015. Planning approval was obtained
during the year and construction is expected to commence in the first quarter of the 2017 financial
year. Settlement of the land is scheduled to occur in the second quarter of the 2017 financial year
with the earlier construction access being granted by way of licence. 31 sales have been achieved
since launching the project in April 2016 which is particularly pleasing in a three month period.
The land for the Lifestyle Community at Bittern is contracted to settle in two parcels: the first parcel
providing approximately 160 homes is expected to settle in the second‐half of the 2017 financial
year; and the second parcel providing an additional 48 homes is expected to settle in the first‐half
of the 2018 financial year. The Company currently expects settlements to commence in the
second‐half of the 2018 financial year. The development of this community is subject to planning
approval.
The land for the Lifestyle Community in Ocean Grove was acquired in May 2016 and is contracted
to settle late in the first‐half of the 2018 financial year with construction planned to commence
soon after. The Company currently expects settlements to commence in the first‐half of the 2019
financial year. The development of this community is subject to planning approval.

Page 13
Analysis of income statement
Net profit after tax attributable to shareholders increased to $19.3 million (2015: $16.7 million). The
table below shows the changes to net profit attributable to shareholders from 30 June 2015 to 30 June
2016.
A$ millions A$ millions
Net profit after tax attributable to shareholders
for the year ended 30 June 2015
16.7
Changes in revenues
Home settlement revenue (11.5)
Rental revenue 1.9
Utilities revenue 0.3
Deferred management fees
Sub‐division revenue
0.9
(0.1)
Finance revenue (0.2) (8.7)
Changes in cost of sales 4.4
Changes in gains from fair value adjustments 3.9
Changes in expenses
Development expenses (0.5)
Management expenses (1.4)
Utilities expenses (0.6)
Corporate overheads
Sub‐division expenses
Finance costs
(0.9)
‐
0.8
Accelerated finance costs due to re‐financing 2.4 (0.2)
Increase in income tax expense (0.7)
Decrease in profit after tax attributable to non‐controlling interests 3.9
Net profit after tax attributable to shareholders
for the year ended 30 June 2016
19.3
The key drivers of changes in profitability were:
Home settlement revenue and margin
‐ Revenue from home settlements decreased to $54.9 million (2015: $66.3 million) due to a
decrease in settlements to 202 (2015: 240). The decrease was in line with the Company’s
expectations and was due to a pull‐forward of settlements in the 2015 financial year.
‐ Home settlement gross margin reduced to 21% (2015: 28%). A contributing factor was a
reduction in the average realised sales price to $298k (GST inclusive) in the 2016 financial year
(2015: $302k). All communities achieved sales price growth during the 2016 financial year but
the average reduced due to the completion of higher priced communities at Chelsea Heights
and Casey Fields. The communities at Chelsea Heights and, to a lesser extent, Casey Fields
provide a higher margin than other communities due to the high realised sales prices achieved
relative to the cost per unit. Conversely, Shepparton has a lower margin relative to other
communities. Gross margins achieved in the 2012 and 2013 financial years were 22% and 23%
respectively prior to the uplift from Chelsea Heights across the 2014 and 2015 financial years
where the gross margins spiked to 25% and 28% respectively. The gross home margin
represents home settlement revenue less a pro‐rata share of project infrastructure, housing
and capitalised finance costs expensed as each home settles.

Page 14
Annuity income and expenses
‐ Revenue from homeowner rentals increased to $11.1 million (2015: $9.2 million) due to an
increase in homes under management and a rental increase of 3.5%. 202 homes were settled
during the year bringing the Company’s total homes under management to 1,348.
‐ Community management expenses increased to $5.8 million (2015: $4.4 million) due to: an
increase in operations at Lyndarum and Geelong; commencement of management at Officer;
and an increase in homes under management. Until a community is fully settled there is also
an increase in community management expenses for those expense items that are variable on
a per home basis such as landscaping and council rates.
‐ Deferred management fees received (inclusive of selling and administration fees) increased to
$2.5 million (2015: $1.6 million). There were 52 resale settlements during the year compared
to 34 in the prior year. The average realised sales price of resales increased to $275k (GST
inclusive) (2015: $260k). The 52 resale settlements achieved an average price growth of 3%
per annum from their initial acquisition date.
Other expenses
‐ Development expenses increased to $4.2 million (2015: $3.7 million) due to: increased
marketing support required to build the Lifestyle Communities brand in the two newer
markets of Lyndarum and Geelong; supporting Officer prior to commencement of
construction; launching Berwick Waters; and the write‐off of $0.13 million of costs associated
with the site acquisition at Rosebud that did not proceed.
‐ Corporate overheads increased to $4.9 million (2015: $4.0 million) due to expenses associated
with the re‐financing of the Company’s banking facilities and additional executive resources to
provide the organisational capability for medium term growth. During the 2016 financial year
the Company employed a finance manager, project co‐ordinator, marketing co‐ordinator and
an additional support person to provide increased support to the Managing Director and
senior management team.
‐ Finance costs reduced to $0.8 million (2015: $1.6 million). This is mainly due to the re‐
financing of the Company’s banking facilities in August 2015 resulting in a lower interest rate
for most of the 2016 financial year. The Company capitalises a proportion of finance costs to
investment properties and inventories where appropriate and the balance of finance costs are
expensed. Capitalised finance costs are expensed in subsequent years through cost of sales.
Fair value adjustments
‐ Total fair value adjustments have increased to $18.9 million (2015: $15.1 million). The
increase of $3.8 million includes a $3.3 million uplift ($2.4 million on an after‐tax basis) as a
result of independent investment property valuations at seven communities. The key drivers
were: rental capitalisation rates reduced to 8% for all communities valued, down from
between 8.5% ‐ 8.75% within prior valuations (this had a favourable valuation impact of $4.3
million or $3.0 million on an after‐tax basis); deferred management fee valuations provided a
net favourable valuation impact of $1.7 million ($1.2 million on an after tax basis) mainly due
to quicker than expected sell through times at certain communities; and the valuers have
updated their view in relation to the long‐term expense requirements of maintaining the
communities and this has resulted in a downwards adjustment of $2.7 million ($1.9 million
on an after tax basis).

Page 15
Fair value adjustments comprise changes to the fair value of investment properties. Changes
relating to investment properties represent incremental adjustments to their fair value upon
settlement of homes and reflects the discounted value of future rental and deferred
management fee revenues net of expenses as well as the fair value of undeveloped land. Refer
to Note 4 in the Company’s 2016 financial statements for further details.
(1) Due to the Company’s legal structure, cash flows related to operations includes all gross costs of project capital
infrastructure expenditure (i.e. civil works, clubhouse and other facilities). Under some other legal structures, project
capital expenditure may be classified within investing cash flows rather than operating cash flows.
Cash flows related to operations decreased to a deficit of $14.2 million (2015: surplus of $16.4 million).
The reduction is mainly attributable to a $21.8 million increase in payments to suppliers and employees
as well as a reduction of $8.7 million on receipts from customers. Payments to suppliers and employees
increased due to a $6.3 million increase in project capital expenditure and a $15.5 million increase in
housing construction. There was increased civil and infrastructure activity at Officer and increased
home construction activity (271 homes were constructed in the 2016 financial year (2015: 197)) as
construction was completed at Chelsea Heights, commenced at Officer and increased at Shepparton,
Lyndarum and Geelong to increase stock to target levels to match increased sales activity.
Cash flows related to investing activities included: $1.2 million relating to the deposits paid at Ocean
Grove and Bittern as well as the deposit released from Rosebud; $1.0 million relating to purchases of
property, plant and equipment; offset by $5.0 million from the release of term deposits.
Cash flows related to financing activities included: $0.8 million received upon exercise of options; $9.4
million net proceeds from bank borrowings; $2.6 million for payment of dividends; and distributions
paid to non‐controlling interests of $3.4 million.
Analysis of cash flow
A$ millions
FY2016
FY2015
Change
Cash flows related to operations (14.2) 16.4 (30.6)
add Project capital expenditure (1) 23.7 17.4 6.3
Adjusted cash flows related to operations 9.5 33.8 (24.3)
Cash flows related to investing activities 2.8 (6.6) 9.4
Cash flows related to financing activities 4.2 (4.6) 8.8
Net movement in cash (7.2) 5.2
Cash at the beginning of the period 8.0 2.8
Cash at the end of the period 0.8 8.0
Liquidity buffer funds on deposit ‐ 5.0
Adjusted closing cash 0.8 13.0

Page 16
Analysis of balance sheet
Net assets and total equity
A$ millions FY2016 FY2015 Change Change %
Assets
Cash and cash equivalents 3.4 8.0 (4.6) (58)
Other financial assets (term deposits) ‐ 5.0 (5.0) (100)
Trade and other receivables 0.8 ‐ 0.8 100
Inventories 49.7 30.6 19.1 62
Property, plant and equipment 4.2 2.8 1.6 51
Investment properties 163.7 132.8 30.9 23
Other assets 0.7 0.5 0.2 50
Total Assets 222.5 179.7 42.8 24
Liabilities
Cash and cash equivalents (overdraft) (2.5) ‐ (2.5) (100)
Trade and other payables (14.4) (5.4) (9.0) (168)
Interest‐bearing loans and borrowings (46.0) (36.6) (9.4) (20)
Provisions (0.6) (0.4) (0.2) (33)
Current tax payable (0.4) (1.8) 1.4 80
Deferred tax liabilities (27.3) (21.7) (5.6) (26)
Total Liabilities (91.2) (65.9) (25.3) (38)
Net Assets 131.3 113.8 17.5 15
Equity
Lifestyle Communities interest
Contributed equity and reserves 65.4 64.6 0.8 1
Retained earnings 65.9 49.2 16.7 34
Non‐controlling interests ‐ ‐ ‐ ‐
Total Equity 131.3 113.8 17.5 15
During the year the Company’s net assets and total equity increased to $131.3 million (2015: $113.8
million) as a result of: profit during the period of $19.3 million; $0.8 million provided due to the exercise
of share options; partly offset by dividends paid of $2.6 million.
Inventories have increased to $49.7 million (2015: $30.6 million). There has been a transition from
projects in ‘run‐off’ mode at Casey Fields, Chelsea Heights and Hastings that are now fully settled. Apart
from Shepparton all other projects (Lyndarum, Geelong and Officer) are at or near to their peak
inventory levels as the intense civil infrastructure phases have been completed during the 2016
financial year.
Included within trade and other payables is a payable of $10.9 million relating to the land at Berwick
Waters which is due to settle in the second quarter of the 2017 financial year. The corresponding asset
is included within investment properties.
Current tax payable has reduced to $0.4 million (2015: $1.8 million) due to more timely tax instalments
being paid throughout the year (after first commencing instalments in the 2015 financial year).
Deferred tax liabilities have increased to $27.3 million (2015: $21.7 million) representing the tax on fair
value adjustments being deferred. This liability will only be realised should an investment property be
disposed of which is highly unlikely.

Page 17
Debt, gearing and liquidity
As at 30 June 2016 the Company had net debt of $45.2 million (2015: $23.6 million).
A$ millions
Net debt at 30 June 2015 23.6
Net increase in bank borrowings
Decrease in term deposit assigned to liquidity buffer
9.4
5.0
Decrease in cash balances / overdraft 7.2
Net movement in 2016 21.6
Net debt at 30 June 2016 45.2
The gearing ratio (net debt to net debt plus equity) of the Company as at 30 June 2016 was 25.6% (2015:
17.2%).
The Company’s bank facilities were re‐financed during the 2016 financial year with the execution of a
five‐year, $80 million facility agreement with Westpac in August 2015. The new facility provides greater
flexibility and has resulted in lower finance costs. The facility includes financial and reporting
undertakings but shifts away from project specific development undertakings previously in place.
Due to the tenure provided by the facility coupled with the strong and growing annuity income being
generated by the Company, the Company considers that a 30% gearing ceiling is appropriate. This level
of gearing may allow a faster roll‐out of new communities rather than solely relying on recycled capital
from completed communities. Continued utilisation of the debt facility is subject to internal gearing
disciplines and Westpac covenant requirements.
As at 30 June 2016 the Company has a committed facility with Westpac of $80.0 million of which $48.6
million was drawn ($46.0 million drawn plus utilisation of overdraft facility of $2.6 million).
Outlook and risks
Outlook
The Company has been pleased with the rate of construction, sales and settlements across the
communities currently under development during the 2016 financial year. The Company was
particularly pleased with the continued performance at Shepparton as well as the level of sales
achieved at Officer and Berwick Waters and early settlements achieved at Officer.
The Company has a focused strategy to dominate the niche of affordable housing to the over 50’s
market and is currently funded and resourced to roll out a new community at least every 12 months
subject to identification of appropriate sites. The Company continues to focus on Melbourne’s growth
corridors as well as key Victorian regional centres and is currently considering a range of opportunities
but will remain disciplined in its assessment of these opportunities.
The Company has previously released guidance that settlements are expected to be in the range of 250
to 270 for the 2017 financial year. The increase in settlements, coupled with an expected increased
contribution from community management, is expected to result in net profit after tax attributable to
shareholders being materially higher in the 2017 financial year.
It is the Company’s intention to pay an interim and final dividend in respect of the 2017 financial year.
The Company expects the combined dividend in the 2017 financial year to be greater than the 2016
financial year amount of 2.5 cents per share (1.0 cent per share interim dividend and 1.5 cents per share
final dividend). The Company also expects both dividends in 2017 to be fully franked.

Page 18
Key risks
The Company’s key risk categories are:
Site selection – if the Company makes a poor site acquisition it may not generate adequate financial
returns on the investment and the objective of recovering 100% of the development costs may not be
met. The Company attempts to mitigate this risk by maintaining a detailed land acquisition strategy
and by carrying out detailed due diligence on potential new sites. The Company also uses the significant
experience it has gained from acquiring 13 sites and developing many of these during the past 13 years.
Sales and settlements – the Company is exposed to the rate of sales of new and existing homes, the
price of sales of new homes (and to a lesser extent the price of sales of existing homes) and to the
timing of settlements of new homes (revenue is only recorded when a sale of a home is settled). The
Company’s experience to date is that sales rates and realisations are closely related to the difference
between the median house price in the area and the home price in the Lifestyle Community. This factor
attracts a great deal of attention during the site selection process and also during the development of
the community.
Community roll out – management of the construction programme is important to ensure cash flow is
managed efficiently and returns are maximised. The Company mitigates this risk by taking a stage by
stage approach to construction based on a required level of pre‐sales.
Financing risk – there is a risk the Company will not achieve its growth strategy due to insufficient capital
or the inability to obtain new debt facilities. The Company may also experience re‐financing risk if all
debt facilities were cancelled in a short period of time. The Company mitigates these risks by:
maintaining a balance sheet with a reasonably low level of gearing; ensuring it complies with all debt
covenants and reporting obligations; ensuring sufficient term for debt facilities; and tightly managing
the commencement and rate of development of new communities.
Community management – it is important communities are well managed and homeowners have a high
level of satisfaction. A well managed community will: generate new sales from homeowner referrals;
add to the Lifestyle Communities brand; assist in facilitating resales of existing homes; and improve the
profitability of the community management business. The Company mitigates community
management risk by maintaining a very transparent sales and contract process, undertaking careful
selection of community management teams, maintaining community facilities to a high standard,
ensuring regular community activities and events, and maintaining the common areas and gardens to
a high standard.
Regulatory risk – the Company’s operations and business and financial model are impacted by the
Residential Tenancies Act and the Social Securities Act. Changes to this legislation could have an
adverse impact on the operating and financial performance of the Company.

Page 19
Remuneration Report (audited) Dear Shareholder, On behalf of the Board, we are pleased to present Lifestyle Communities’ Remuneration Report for the 2016 financial year.
The Company’s approach to executive remuneration continues to evolve. Historically the Company
has paid fixed remuneration that is fair and based on external benchmarking. Due to the size of the
Company and the founders being significant shareholders, it has not been considered necessary to
have annual short and long term incentive schemes. However, the Company has implemented a few
targeted equity incentive schemes during the past six years to provide long term incentives to some
key management personnel. The Board considers that the alignment and retention aspects of these
historical schemes have been successful given the significant increase in the Company’s profitability
over this time.
Moving forward the Company will continue to use external benchmarking to provide fair fixed
remuneration to executives. The Company is keen to implement a new scheme to provide incentive,
alignment and retention of key executives. To that end we are pleased to announce that a new
equity incentive scheme will be introduced in respect of the 2017 and 2018 financial years, with the
following key features (refer to 5.3 for further details):
Incentives will be provided for reaching settlement targets on a two year rolling basis
reflecting settlement projections previously announced to the ASX (refer 5.3);
Incentives will be paid in the form of fully paid ordinary shares (to be acquired by the
Company on market), rather than options;
The scheme will be open to all employees (subject to the qualifying rules) to create
company‐wide alignment. Directors will not be entitled to participate; and
Shares issued to senior management will be held in escrow for specified periods to assist
with retention.
The HR & Remuneration Committee considers that the scheme will enhance shareholder value by
driving the business towards the goal of settlements. Coupled with tight financial control over costs
at Board level, a focus on customer touch points and ultimately homeowner referrals we believe the
settlement target provides the clearest and strongest alignment with shareholders. We will continue
to monitor the effectiveness of this target against long‐term shareholder value creation.
The Committee also reviewed the compensation of the Managing Director during the 2016 financial
year. As the largest shareholder in the Company, it was considered that the Managing Director’s
alignment of interest would not be improved by either short term or long term incentive
arrangements. However, following an external benchmarking study, it was decided to increase the
Managing Directors base salary to more closely align to a market level.
The above two measures will increase the Company’s corporate overheads beyond inflation in the
2017 financial year. However, we anticipate that the benefits derived from productivity
improvements across the Company will be greater than the increased costs.
The following report sets out further detail on your Company’s approach to remuneration.
Yours sincerely
Tim Poole Jim Craig Chair Chair, HR & Remuneration Committee 18 August 2016 18 August 2016

Page 20
1. Introduction
1.1 About this report
The Remuneration Report forms part of the Directors’ Report. It outlines the overall remuneration
strategy, framework and practices adopted by Lifestyle Communities Limited (the Company) and has
been prepared in accordance with Section 300A of the Corporations Act 2001 and its regulations. This
entire remuneration report is designated as audited.
1.2 Overview of contents
Section Contents
1 Introduction
2 HR & Remuneration Committee
3 Details of key management personnel
4 Non‐executive directors’ remuneration
5 Executive directors and senior management remuneration
6 Relationship between remuneration and performance
7 Executive service agreements
8 Remuneration details
9 Options and CRES held by key management personnel
10 Remuneration report voting at Annual General Meetings
2. HR & Remuneration Committee
2.1 Role of the HR & Remuneration Committee
As a minimum the HR & Remuneration Committee’s role is to make recommendations to the board on:
the Company’s remuneration framework;
formulation and operation of employee incentive plans;
remuneration levels of executive Directors and other key management personnel; and
the level of non‐executive Director fees.
The objective is to ensure that remuneration policies and structures are fair and competitive and
aligned with the long‐term interests of the Company.
3. Details of Key Management Personnel
Position Commencement date
Non‐executive directors
Tim Poole Chair of the Board 22 November 2007
Non‐executive Director
Member – HR & Remuneration Committee
Bruce Carter(1) Non‐executive Director Founder
Member – Audit Committee
Jim Craig Non‐executive Director 31 December 2012
Member – Audit Committee
Chair – HR & Remuneration Committee
Philippa Kelly Non‐executive Director 18 September 2013
Chair – Audit Committee
Member – HR & Remuneration Committee

Page 21
Executive director
James Kelly Managing Director Founder
Other executives
Michael Imbesi Construction Manager 21 March 2005
Chris Paranthoiene Development and Acquisition Manager 13 March 2007
Geoff Hollis Chief Financial Officer and Company
Secretary
15 February 2010
Sam Cohen Operations Manager 3 October 2011
(1) Bruce Carter transitioned from executive Director to non‐executive Director on 1 July 2015.
4. Non‐executive directors’ remuneration
4.1 Fixed fees
All non‐executive Directors are paid fixed fees for their services to the Company. The level of fees are
based upon providing the Company with the ability to attract and retain Directors of high calibre, whilst
incurring a cost that is reasonable having regard to the size and complexity of the Company.
The aggregate amount of fees paid is within the overall amount approved by shareholders in a general
meeting. The last determination was made at the Annual General Meeting held in November 2007 at
which shareholders approved an aggregate amount of $1,000,000 per annum.
Fixed fees paid to Directors during the 2016 financial year are set out in section 8.
4.2 Review of non‐executive Directors’ fees
The HR & Remuneration Committee reviewed non‐executive Directors’ fees in September 2014,
benchmarking to similar sized ASX listed companies. No remuneration consultant was used.
As part of the review of non‐executive Directors’ fees in September 2014 it was determined that the
Chair’s market remuneration should be $100,000 per annum. It was decided to step to this amount
over a two year period and effective 1 January 2015 remuneration payable to the non‐executive Chair
was increased to $80,000 and effective 1 January 2016 remuneration payable to the non‐executive
Chair was increased to $100,000.
Other non‐executive Director fees have not changed in the 2016 financial year and remain at $50,000
per annum for each non‐executive Director as well as an additional $5,000 per annum for each
committee Chair.
5. Executive Directors and senior management remuneration
5.1 Framework
The Company’s executive remuneration framework consists of the following elements:
fixed remuneration; and
equity based incentives.

Page 22
In determining executive remuneration the Board aims to ensure that remuneration practices are:
competitive and reasonable, enabling the Company to attract and retain key talent;
aligned to the Company’s strategic and business objectives and the creation of shareholder
value; and
transparent and acceptable to shareholders.
5.2 Determining fixed remuneration
Managing Director
During the year the HR & Remuneration Committee undertook a benchmarking process in relation to
the fixed remuneration of the Managing Director with an effective date of any changes being 1
September 2015. The benchmarking was undertaken by Yellow Folder Research, an independent
specialist remuneration consultant. Pursuant to the Corporations Act 2001, the remuneration
consultant was engaged by the non‐executive Directors and reporting of the remuneration
recommendations were made directly to the HR & Remuneration Committee. Due to the
independence of the process the Board is satisfied that the remuneration recommendations received
were made free from undue influence by the senior executives to whom the recommendations related.
Consideration paid to the remuneration consultant was $3,000. No other recommendations were
provided by the remuneration consultant.
The Managing Directors total package (inclusive of superannuation) is $450,000 effective from 1
September 2015 (previous package was $375,000). This fixed remuneration includes a $20,000 car
allowance as compensation for the high level of travel required between the Company’s communities.
The HR & Remuneration Committee has been mindful to ensure the Managing Director is being
remunerated at fair market rates for fixed remuneration given there is no entitlement to participate in
any short term incentive or long term incentive plans.
Senior management
Fixed remuneration for senior management is reviewed annually or on promotion. Fixed remuneration
is benchmarked against market data for comparable roles in the market. The remuneration for the
Company’s Chief Financial Officer and Company Secretary was benchmarked along with that of the
Managing Director referred to above.
5.3 New equity incentive scheme
As outlined within the introduction to the Remuneration Report the proposed equity incentive scheme,
to be implemented in the 2017 financial year, will be measured each year as a short term incentive but
have the retention aspects (for key management personnel and other selected staff) of a long term
incentive.
Incentives, in the form of fully paid ordinary shares (to be acquired on‐market), will be issued to
participants on reaching new home settlement targets as follows:
FY2017 FY2018
Settlement targets 250 to 270 260 to 290
Should settlement targets be achieved, incentives will be issued as follows:
Key management personnel and other selected senior management (on a pro‐rata basis based
on standard hours) will receive: 10,000 shares if the low point of the target is reached; 15,000
shares if the mid‐point is reached; and 20,000 shares if the high point is reached or exceeded.
All other staff (on a pro‐rata basis based on standard hours) will receive: 500 shares if the low
point of the target is reached; 1,000 shares if the mid‐point is reached; and 1,500 shares if the
high point is reached or exceeded.

Page 23
To be entitled to the incentive staff will need to have been employed by the Company on 1 July of the
target year with shares to be allocated in September following the end of the target year. Shares
allocated to key management personnel and other selected senior management will be held in escrow
(50% for one year and 50% for two years for the FY2017 issue and 50% for two years and 50% for three
years for the FY2018 issue). The allocation relating to all other staff will not have an escrow period and
will be allocated provided they remain employed at the date of allocation.
The proposed equity incentive scheme is subject to final structuring.
5.4 Short term incentives
The Company currently has no widespread short‐term incentive plans other than the new incentive
scheme outlined at 5.3.
5.5 Long term incentives
The Company has two existing long‐term incentive plans in place and uses them to retain key talent
and align the interests of senior executives to shareholders. With the proposed introduction of the
new incentive scheme as outlined at 5.3, there is no intention to issue any further incentives under
these two plans.
Employee Share Loan Plan (ESLP)
The ESLP was approved at the Company’s 2012 AGM. The purpose of the ESLP was to provide eligible
employees (at the Board’s discretion based on a recommendation from the Managing Director) with an
opportunity to acquire convertible repurchase‐able employee shares (CRES) in the Company and, as
CRES are convertible into ordinary shares in the Company, thereby enable them to participate in any
growth in the value of the Company, and to motivate and retain them.
The performance conditions under the ESLP are for participants to provide continuous service to the
Company. The CRES are issued in three tranches; tranche one requires two years continuous service
prior to the ability to convert to ordinary shares; tranche two requires three years; and tranche three
requires four years. The CRES are treated as options for accounting purposes.
The Company acknowledges that the ESLP was implemented without any financial or non‐financial
performance conditions apart from continuous service. The HR & Remuneration Committee
considered the remuneration framework of the Company and determined that this was appropriate
given senior management did not have access to any short term incentives. The performance condition
of providing continuous service to the Company was chosen to help the Company attract and retain
key talent as well as to align interests of executives to shareholders and to support the growth
trajectory of the Company.
In May 2013 CRES were issued to the four key management personnel. The continuous service
requirements were met for the first two tranches with the third tranche due to be met in May 2017.
In July 2015 120,000 CRES shares were issued pursuant to this plan (2015: nil) to someone in the senior
management team who is not considered to be key management personnel. The 120,000 CRES shares
have been issued under the same terms as the May 2013 issue and have been issued in three tranches
with the same continuous service requirements.
Senior Executives and Directors Share Option Plan (ESOP)
No options were issued pursuant to this plan during the 2016 financial year (2015: nil). The
performance conditions under the ESOP were for participants to provide two years continuous service.
This condition has been satisfied for all prior options issued under the ESOP and hence all options issued
under the ESOP have now vested.
Refer to section 9 for details of options and CRES held by key management personnel.

Page 24
6. Relationship between remuneration and performance
The Company’s current remuneration framework, outlined in section 4, is primarily based on providing
fixed remuneration. This is because the Managing Director has a large shareholding in the Company
and has a strong incentive to increase the value of the Company. In prior years a modest long‐term
incentive plan has been used to retain and motivate key employees (other than the Managing Director).
The long‐term incentive plan is only of value if the share price of the Company increases, thereby
encouraging strong operational and financial performance and is therefore directly aligned to the long
term interests of all shareholders.
The proposed implementation of the new equity incentive scheme in the 2017 financial year, as
outlined at 5.3 and in the introduction to the Remuneration Report, will provide equity incentives on
achieving new home settlement targets. New home settlements are one of the key drivers of growth
within the business and the HR & Remuneration Committee is confident the new equity incentive
scheme will help to further the alignment of key management personnel and all other employees to
this common goal.
The following table shows key performance indicators for the Company over the last five years:
Performance measure FY2016 FY2015 FY2014 FY2013 FY2012
Net profit after tax attributable to members ($million) $19.27 $16.65 $12.28 $ 6.96 $ 6.59
Net profit (change from prior year) (%) 15.7% 35.6% 76.4% 5.6% (3.3%)
Dividends declared & paid (fully franked) (cents) 2.5 1.5 ‐ 0.5 0.5
Diluted earnings per share (cents) 18.47 16.11 12.00 9.40 14.18
Closing share price (30 June) $2.91 $2.44 $1.60 $0.78 $0.80
Share price increase / (decrease) 19.26% 52.50% 105.13% (2.50%) (5.56%)
STI paid to KMP $10,000 $ ‐ $ ‐ $ 10,000 $ 42,000
7. Executive service agreements
7.1 Executive Directors
The HR & Remuneration Committee refreshed the Managing Director’s executive service agreement in
the 2014 financial year. This was executed on 8 December 2013 with an effective date of 1 September
2013.
Significant conditions
Under the terms of the agreement, the contract may be terminated by either party giving three months
written notice.
The Company may terminate the contract at any time without notice if serious misconduct has
occurred. The Managing Director has a three month restrictive period post termination.
7.2 Senior management
All senior management have consistent key terms of employment.
Significant conditions
Under the terms of all agreements, the contracts may be terminated by either party giving one month
written notice.
The Company may terminate the contracts at any time without notice if serious misconduct has
occurred. Senior management have a three month restrictive period post termination.

Page 25
8. Remuneration details
8.1 Compensation of directors and key management personnel for the year ended 30 June 2016 30 June 2016 Short term Post‐employment Long term Share based
payment Total
performance related %
Total
Salary & fees
$
Cash bonus
$
Non‐monetary $
Other $
Super $
Retirement benefits
$
Incentive plans $
Options/ ESLP $
Cash bonus %
Shares %
$
Directors
Tim Poole 82,192 ‐ ‐ ‐ 7,808 ‐ ‐ ‐ ‐ ‐ 90,000
James Kelly 396,317 ‐ ‐ ‐ 22,678 ‐ ‐ ‐ ‐ ‐ 418,995
Bruce Carter(1) 49,562 ‐ ‐ ‐ 5,086 ‐ ‐ ‐ ‐ ‐ 54,648
Jim Craig(2) 55,000 ‐ ‐ ‐ ‐ ‐ ‐ ‐ ‐ ‐ 55,000
Philippa Kelly 50,228 ‐ ‐ ‐ 4,772 ‐ ‐ ‐ ‐ ‐ 55,000
633,299 ‐ ‐ ‐ 40,344 ‐ ‐ ‐ 673,643
Key management personnel
Michael Imbesi 167,567 ‐ ‐ ‐ 13,544 ‐ ‐ 10,895 ‐ 5.7 192,006
Chris Paranthoiene 172,260 9,132 ‐ ‐ 15,807 ‐ ‐ 10,895 ‐ 5.2 208,094
Geoff Hollis(3) 194,824 ‐ ‐ ‐ 18,508 ‐ ‐ 16,343 ‐ 7.1 229,675
Sam Cohen 166,996 ‐ ‐ ‐ 13,628 ‐ ‐ 5,448 ‐ 2.9 186,072
701,647 9,132 ‐ ‐ 61,487 ‐ ‐ 43,582 815,848
Total 1,334,946 9,132 ‐ ‐ 101,831 ‐ ‐ 43,582 1,489,491
(1) Bruce Carter’s standard directors fees for the 2016 financial year inclusive of superannuation were $50,000, a payment of outstanding leave liabilities was also paid during the year
reflecting the transition from executive to non‐executive director on 1 July 2015. (2) Fees were paid to Bellwether Holdings Pty Ltd, an entity controlled by Jim Craig. (3) For comparative purposes note that Geoff Hollis took one month unpaid leave during the year.

Page 26
8.2 Compensation of directors and key management personnel for the year ended 30 June 2015
30 June 2015 Short term Post‐employment Long term Share based
payment Total
performance related %
Total
Salary & fees
$
Cash bonus
$
Non‐monetary $
Other $
Super $
Retirement benefits
$
Incentive plans $
Options/ ESLP $
Cash bonus %
Shares %
$
Directors
Tim Poole 66,051 ‐ ‐ ‐ 6,412 ‐ ‐ ‐ ‐ ‐ 72,463
James Kelly 342,603 ‐ ‐ ‐ 20,833 ‐ ‐ ‐ ‐ ‐ 363,436
Bruce Carter 184,031 ‐ ‐ ‐ 17,954 ‐ ‐ ‐ ‐ ‐ 201,985
Jim Craig(1) 52,025 ‐ ‐ ‐ ‐ ‐ ‐ ‐ ‐ ‐ 52,025
Philippa Kelly 47,614 ‐ ‐ ‐ 4,523 ‐ ‐ ‐ ‐ ‐ 52,137
692,324 ‐ ‐ ‐ 49,722 ‐ ‐ ‐ 742,046
Key management personnel
Michael Imbesi(2) 163,078 ‐ ‐ ‐ 13,117 ‐ ‐ 20,496 ‐ 10.4 196,691
Chris Paranthoiene(2) 162,381 ‐ ‐ ‐ 14,001 ‐ ‐ 20,496 ‐ 10.4 196,878
Geoff Hollis 179,361 ‐ ‐ ‐ 17,039 ‐ ‐ 30,744 ‐ 13.5 227,144
Sam Cohen(2) 154,408 ‐ ‐ ‐ 12,769 ‐ ‐ 10,248 ‐ 5.8 177,425
659,228 ‐ ‐ ‐ 56,926 ‐ ‐ 81,984 798,138
Total 1,351,552 ‐ ‐ ‐ 106,648 ‐ ‐ 81,984 1,540,184
(1) Fees were paid to Bellwether Holdings Pty Ltd, an entity controlled by Jim Craig. (2) On 1 July 2014 additional employees were defined as key management personnel as a result of the reduced involvement of founders, Bruce Carter and Dael Perlov, in the day‐to‐day
operations of the business.

Page 27
9. Options and CRES held by Key Management Personnel
9.1 Options and CRES on issue (issued as remuneration)
The terms and conditions of each grant of options or CRES affecting remuneration in the current or
future reporting periods are as follows:
Plan Number
of options
granted
Grant
date
Vesting
date
Expiry
date
Exercise
price
Value per
option at
grant date
Performance
hurdles
achieved
%
Vested
ESOP 1,275,000 24 Nov
2010
24 Nov
2012
24 Nov
2015
$0.650 $0.435 Yes 100%
ESLP 266,667 22 May
2013
22 May
2015
22 May
2018
$0.876 $0.207 Yes 100%
ESLP 266,667 22 May
2013
22 May
2016
22 May
2018
$0.876 $0.216 Yes 100%
ESLP 266,666 22 May
2013
22 May
2017
22 May
2018
$0.876 $0.220 Not yet N/A
ESLP 40,000 22 July
2015
22 July
2017
22 July
2020
$2.696 $0.608 Not yet N/A
ESLP 40,000 22 July
2015
22 July
2018
22 July
2020
$2.696 $0.608 Not yet N/A
ESLP 40,000 22 July
2015
22 July
2019
22 July
2020
$2.696 $0.608 Not yet N/A
As at the date of this report, there were 453,331 unissued ordinary shares under option or CRES. Of
these, 333,331 were issued to Key Management Personnel as remuneration.
No option holder has any right under the options to participate in any other share issue of the Company.
There were no alterations to the terms and conditions of options granted as remuneration since their
grant date. During the year 1,250,001 ordinary shares were issued as a result of the exercise of
1,050,000 options and the conversion of 200,001 CRES.
A loan of $175,201 was provided to three Key Management Personnel in respect of the conversion of
200,001 CRES during the year on 22 May 2016. In the prior year a loan of $233,601 was provided to
four Key Management Personnel in respect of the conversion of 266,668 CRES on 22 May 2015. The
loans are non‐interest bearing and repayable no later than 22 May 2018. If the Key Management
Personnel cease employment with the Company prior to 22 May 2018 the loan will be repayable within
three months. The Key Management Personnel are required to use the proceeds from the disposal of
the shares to repay the loan. If interest was charged on the loan, using the Company’s average cost of
funding, interest charged for the 2016 financial year would have been $9,334.
For details on the valuation of the options, including models and assumptions used, please refer to
Note 25 of the Company’s 2016 financial statements.

Page 28
9.2 Options and CRES issued to Key Management Personnel as remuneration
Name Year of
grant
Vesting
year
Plan Number Value at
grant date
Total
vested
Vested
%
Total
number
exercised
Tim Poole 2010 2012 ESOP 125,000 $54,375 125,000 100% 125,000
Geoff Hollis 2010 2012 ESOP 125,000 $54,375 125,000 100% 125,000
2013 2015 ESLP 100,000 $20,700 100,000 100% 100,000
2013 2016 ESLP 100,000 $21,600 100,000 100% 100,000
2013 2017 ESLP 100,000 $22,000 ‐ ‐ ‐
Michael
Imbesi
2010
2012 ESOP 100,000 $43,500 100,000
100% 100,000
2013 2015 ESLP 66,667 $13,800 66,667 100% 66,667
2013 2016 ESLP 66,667 $14,400 66,667 100% 66,667
2013 2017 ESLP 66,666 $14,667 ‐ ‐ ‐
Chris
Paranthoiene
2010
2012 ESOP 50,000 $21,750 50,000
100% 50,000
2013 2015 ESLP 66,667 $13,800 66,667 100% 66,667
2013 2016 ESLP 66,667 $14,400 66,667 100% ‐
2013 2017 ESLP 66,666 $14,667 ‐ ‐ ‐
Sam Cohen 2013 2015 ESLP 33,334 $6,900 33,334 100% 33,334
2013 2016 ESLP 33,333 $7,200 33,334 100% 33,334
2013 2017 ESLP 33,332 $7,333 ‐ ‐ ‐
9.3 Number of options and CRES held by Key Management Personnel
2016
Name Balance
at
1‐Jul‐15
Granted
as
remun‐
eration
Exercised Balance
at
30‐Jun‐16
Total
vested
30‐Jun‐16
Total
exercise‐
able
30‐Jun‐16
Total
unexerci‐
sable
30‐Jun‐16
Directors
Tim Poole 125,000 ‐ 125,000(1) ‐ ‐ ‐ ‐
Key Management
Personnel
Geoff Hollis 200,000 ‐ 100,000(2) 100,000 ‐ ‐ 100,000
Michael Imbesi 133,333 ‐ 66,667(2) 66,666 ‐ ‐ 66,666
Chris
Paranthoiene
133,333 ‐ ‐ 133,333 66,667
66,667 66,666
Sam Cohen 66,666 ‐ 33,334(2) 33,332 ‐ ‐ 33,332
(1) Exercised during the 2016 financial year, value per share at exercise date was $1.95.
(2) Exercised during the 2016 financial year, value per share at exercise date was $2.00.

Page 29
2015
Name Balance
at
1‐Jul‐14
Granted
as
remun‐
eration
Exercised Balance
at
30‐Jun‐15
Total
vested
30‐Jun‐15
Total
exercise‐
able
30‐Jun‐15
Total
unexerci‐
sable
30‐Jun‐15
Directors
Bruce Carter 200,000 ‐ 200,000 ‐ ‐ ‐ ‐
James Kelly 200,000 ‐ 200,000 ‐ ‐ ‐ ‐
Tim Poole 125,000 ‐ ‐ 125,000 125,000 125,000 ‐
Jim Craig 1,250,000 ‐ 1,250,000 ‐ ‐ ‐ ‐
Key Management
Personnel
Geoff Hollis 425,000 ‐ 225,000 200,000 ‐ ‐ 200,000
Michael Imbesi(1) 300,000 ‐ 166,667 133,333 ‐ ‐ 133,333
Chris
Paranthoiene(1)
250,000 ‐ 116,667 133,333 ‐
‐ 133,333
Sam Cohen(1) 100,000 ‐ 33,334 66,666 ‐ ‐ 66,666
(1) These employees were deemed Key Management Personnel as of 1 July 2014
For further details relating to options and CRES, please refer to Note 25 of the Company’s 2016 financial
statements.
9.4 Shareholdings of Key Management Personnel
2016
Name Balance at
1‐Jul‐15
Off‐market
transfer
On‐market
transactions
Exercise of
options
Balance at
30‐Jun‐16
Directors
Bruce Carter 8,579,433 ‐ (1,500,000) ‐ 7,079,433
James Kelly 14,045,566 ‐ (1,000,000) ‐ 13,045,566
Tim Poole 1,080,460 19,147 ‐ 125,000 1,224,607
Jim Craig 4,000,000 ‐ ‐ ‐ 4,000,000
Philippa Kelly 65,000 ‐ ‐ ‐ 65,000
Key Management
Personnel
Geoff Hollis 244,712 ‐ (144,712) 100,000 200,000
Michael Imbesi 170,667 ‐ ‐ 66,667 237,334
Chris
Paranthoiene
116,667 ‐ ‐
‐
116,667
Sam Cohen 33,334 ‐ ‐ 33,334 66,668

Page 30
2015
Name Balance at
1‐Jul‐14
Off‐market
transfer
On‐market
transactions
Exercise of
options
Balance at
30‐Jun‐15
Directors
Bruce Carter 11,618,532 ‐ (3,239,099) 200,000 8,579,433
James Kelly 14,845,566 ‐ (1,000,000) 200,000 14,045,566
Tim Poole 1,405,460 ‐ (325,000) ‐ 1,080,460
Jim Craig 3,800,000 ‐ (1,050,000) 1,250,000 4,000,000
Philippa Kelly 45,000 ‐ 20,000 65,000
Key Management
Personnel
Geoff Hollis ‐ ‐ 19,712 225,000 244,712
Michael Imbesi(1) 12,500 ‐ (8,500) 166,667 170,667
Chris
Paranthoiene(1)
‐ ‐ ‐ 116,667
116,667
Sam Cohen(1) ‐ ‐ ‐ 33,334 33,334
(1) These employees were deemed Key Management Personnel as of 1 July 2014.
10. Remuneration report voting at Annual General Meetings
Lifestyle Communities Limited received more than 98% of votes in support of its remuneration report
for the 2015 financial year.

Page 31
Signed in accordance with a resolution of the directors.
On behalf of the Board
Tim Poole James Kelly
Chair Managing Director
18 August 2016 18 August 2016

LIFESTYLE COMMUNITIES LIMITED
AUDITOR’S INDEPENDENCE DECLARATION TO THE DIRECTORS OF LIFESTYLE COMMUNITIES LIMITED
An independent Victorian Partnership ABN 27 975 255 196 Pitcher Partners is an association of independent firms Level 19, 15 William Street, Melbourne VIC 3000 Melbourne | Sydney | Perth | Adelaide | Brisbane | Newcastle Liability limited by a scheme approved under Professional Standards Legislation An independent member of Baker Tilly International
Page 32
In relation to the independent audit for the year ended 30 June 2016, to the best of my knowledge and belief there have been:
(i) No contraventions of the auditor independence requirements of the Corporations Act 2001; and
(ii) No contraventions of any applicable code of professional conduct.
This declaration is in respect of Lifestyle Communities Limited and the entities it controlled during the year.
P A JOSE PITCHER PARTNERS Partner Melbourne
18 August 2016

Page 33
Corporate Governance Statement The Company is committed to implementing and maintaining good corporate governance practices.
This Statement outlines the main features of the Company’s corporate governance framework and
governance practices, and the extent to which the Company has followed the recommendations of the
ASX Corporate Governance Council (the ASX Principles and Recommendations) during the 2016
financial year.
This Statement is current as at 18 August 2016 and has been approved by the Board of the Company.
All charters and other policies referred to in this statement are available on the Company’s website at
www.lifestylecommunities.com.au.
1. Lay solid foundations for management and oversight
Board functions
The Company has a Board Charter which describes the roles and responsibilities of the Board.
The primary role of the Board is to create shareholder value by setting the strategic direction of the
Company. Matters reserved for the Board include:
• setting the strategic direction of the Company;
• approving and monitoring operating budgets and major capital expenditures;
• overseeing the integrity of the Company's financial reporting;
• overseeing the management of the Company’s debt facilities;
• overseeing the Company’s risk management strategy and approval of the risk management
framework;
• selecting, appointing, and where necessary removing, the Managing Director;
• delegating responsibility to the Managing Director, and setting the limits of delegation from
the Managing Director to other management;
• appointing committees to assist in the oversight of the Company; and
• reviewing Board performance.
The Board has delegated other matters and the day to day management of the Company to the
Managing Director, James Kelly, and established cascading delegated authority levels for senior
management and employees. The Managing Director is also responsible for implementing the
Company's strategic plan within the Company's risk management framework and ensuring accurate
information is provided to the Board.
The Chair, Tim Poole, is primarily responsible for facilitating effective Board meetings by encouraging
contribution from all Directors and by promoting constructive and respectful relations between
Directors, management and the Board.

Page 34
Director appointment, election and re‐election
Vetting is undertaken before new Directors are appointed, elected or re‐elected to the Board to ensure
they are appropriate candidates. This includes background checks, such as for bankruptcy. Information
included in respect of recommendation 2.4 (below) further describes the process undertaken by the
Board and the information considered in relation to appointing a person as a Director.
For the election or re‐election of Directors at Annual General Meetings, the notice of meeting sets out
for shareholders information on candidates, including details of any other directorships and whether
they are considered to be independent.
Director and Senior Executive agreements
The Company has a written agreement with each Director and senior executive clearly outlining the
terms of their appointment.
For non‐executive Directors the agreement includes the Company's expectations concerning the time
Directors will commit to Company matters including involvement with individual committees,
remuneration, circumstances under the Company's constitution in which a Director’s office becomes
vacant, indemnity and insurance arrangements, access to corporate information, confidentiality and a
requirement to comply with Company policies.
For the Managing Director and senior executives the agreement includes similar material (where
relevant) as well as a description of the position, roles and responsibilities, the term of appointment,
resignation and termination processes, and entitlements on resignation or termination. Further details
of the key terms for the employment agreements for the Managing Director and senior executives are
set out in the Remuneration Report.
Company Secretary
The Company Secretary, Geoff Hollis, has a direct reporting line to the Chair of the Board to ensure that
the Board and its committees function efficiently and effectively. The responsibilities of the Company
Secretary include advising on governance matters such as Board and committee policies, supporting
meetings by preparing agendas and minutes, and communicating with ASIC and the ASX.
Diversity
The Company values diversity and recognises the benefits it brings to the organisation. The Company
has developed a Diversity Policy to take advantage of a workforce comprised of people with a diverse
range of skills, backgrounds and experience.

Page 35
The Company supports diversity in its workforce by:
Treating all employees fairly and with respect and dignity as detailed in the Code of Conduct;
Actively and promoting a working environment that values diversity and tolerance of
differences;
Ensuring that applicants and employees of all backgrounds are encouraged to apply for, and
have fair opportunity to be considered for all available roles;
Ensuring that the Company’s policies encourage diversity and address specific barriers to
groups of employees, such as those with domestic responsibilities, by making reasonable
provision for the special needs of these employees, by means such as the Flexible Working
Arrangements, Parental Leave and Other Leave Standards, and recognising and rewarding
innovative strategies to accommodate diverse groups within the workforce;
Setting, reviewing and reporting annually, measurable objectives; and
Complying with all anti‐discrimination and equal opportunity legislation.
Gender diversity is of particular importance as the Company has over 40% of homes occupied by single
females and over 60% the Company’s homeowners are female. The Company has the following
objectives in relation to gender diversity which are assessed by the HR & Remuneration Committee
annually:
• Objective 1: female representation on the Board at all times;
• Objective 2: female representation within the senior management team; and
• Objective 3: 50% or more female employees across its workforce.
This seeks to ensure adequate female representation across all of the Company's business practices.
There is a particular emphasis on gender diversity in the sales and community management functions
of the Company.
During the 2016 financial year each of the three objectives were achieved.
Measuring performance
The Company has an informal evaluation process for Board and committee performance which focuses
on the role of the Board, its size and composition, the procedures and practices of the Board and
meeting arrangements. The evaluation also includes an assessment of the future requirements of the
Board in relation to the skills and experience required to ensure that Board composition is appropriate
for the needs of the Company.
Individual non‐executive Director performance is assessed by the Chair informally to ensure that the
Director continues to operate effectively within the Board. This may involve discussions with the
Director and with other members of the Board, and considering the Director's:
skills, experience, performance and contributions to the Board, committees and other aspects
of the Company;
degree of independence; and
availability to attend and prepare for Board and committee meetings.
An evaluation of the Board, committees and individual directors was undertaken during the 2016
financial year.
The Company has an on‐going evaluation process for senior management. The HR & Remuneration
Committee and Managing Director sets performance objectives for senior executives necessary to
achieve the strategic objectives of the Company. Performance of senior executives is assessed annually
by the Managing Director.

Page 36
2. Structure the Board to add value
Board selection process and induction
The Board believes that the composition, including selection, appointment, renewal and retirement of
members, is of such importance that it is the role of the Board as a whole to manage.
In considering the nomination and appointment of new Directors, the Board assesses candidates with
regard to their experience in the industry, as well as more generally, and their skills, qualifications,
personal qualities and background. In addition, in selecting new Directors, the Board looks for
candidates with skills that complement and balance those of the existing Directors.
The Board reviews succession planning and senior leadership development on at least an annual basis.
Details of the number of Board meetings and attendance at those meetings are set out on page 9 of
the Directors' Report.
The mix of skills and diversity that the Company seeks to achieve on the Board includes:
• accounting, finance and capital markets;
• property development, construction and management;
• asset management;
• information technology;
• financial and business management;
• sales and marketing; and
• legal, tax and regulatory.
The Board has an induction program for newly‐appointed non‐executive Directors. This provides
orientation including written materials, briefings, training on accounting principles (where
appropriate), site visits and educational opportunities designed to make them familiar with the
Company and better equipped to perform their duties. This seeks to build an understanding of the
Company's business, the markets in which it operates, customers, suppliers, employees and community
residents.
Directors are also encouraged to attend external director education programs to develop and maintain
their skills and knowledge.
Independence
The Board comprises Tim Poole, Jim Craig and Philippa Kelly as independent non‐executive Directors,
Bruce Carter as a non‐executive Director (from 1 July 2015) and James Kelly as Managing Director.
Details of their qualifications, experience and length of service are set out on pages 6 and 7 of the
Directors’ Report.
The Board considers an independent Director to be a non‐executive Director who is not a member of
management and who is free of any business or other relationship that could materially interfere with
– or could reasonably be perceived to materially interfere with – the independent exercise of their
judgement as a Director of the Company.
Tim Poole, Jim Craig and Philippa Kelly are considered to be independent under this definition. Further,
none of the aforementioned non‐executive Directors have an interest, position, association or
relationship of the type described in item 2.3 of the ASX Principles and Recommendations. Bruce Carter
is not considered independent as he transitioned from executive to non‐executive Director on 1 July
2015. The Board assesses independence at least annually.

Page 37
The Chair of the Board, Tim Poole, is an independent Director. James Kelly is the Company's Managing
Director.
3. Act ethically and responsibly
The Company recognises that its reputation is one of its most valuable assets to build long‐term value
for its shareholders. The Company’s Code of Conduct applies to its Directors, senior executives and
employees.
The Company is committed to promoting and maintaining a high standard of corporate ethics and
business integrity. As stated in the Company's Code of Conduct, all Directors, senior executives and
employees must act with integrity and professionalism and be scrupulous in the proper use of Company
information, funds, equipment and facilities. Directors, senior executives and employees are to
exercise fairness, equity, proper courtesy, consideration and sensitivity in dealing with customers,
employees and other stakeholders. See also the information in respect of recommendation 7.4 below.
The Code of Conduct is a detailed statement concerning:
• responsibilities of all Directors, senior executives and employees;
• practices to promote the best interests and reputation of the Company;
• confidentiality;
• Company property;
• conflicts of interests;
• public statements;
• policies for preventing the acceptance or offering of bribes or other forms of unlawful or
unethical payments or inducements;
• measures to encourage the reporting of unlawful or unethical behaviour;
• compliance; and
• breaches of the Code.
The Company has a Securities Trading Policy. Under the Company’s Securities Trading Policy, Directors,
senior executives and employees must not trade in any securities of the Company at any time when
they are in possession of unpublished, price sensitive information in relation to those securities.
Provided dealing would not otherwise contravene the insider trading provisions of the Corporations
Act, Directors, senior executives and employees can deal in securities of the Company outside of the
following prohibited periods:
from 1 January to the opening of trading on the second Business Day after the Company’s half‐
yearly results are announced to the ASX;
from 1 July to the opening of trading on the second Business Day after the Company’s annual
results for that year are announced to the ASX;
from the opening of trading on the date that is two weeks prior to the AGM to the opening of
trading on the first Business Day after the close of the AGM; and
any additional period, as specified by the Board.
Trading within a prohibited period can only occur with the prior approval from the Chair.
The Code of Conduct encourages the reporting of unlawful and unethical behaviour and protects
whistle‐blowers. Any employee who makes a complaint and complies with the reporting process will
not be disadvantaged or prejudiced in any way.

Page 38
All complaints are treated as confidential. Directors, senior executives and employees can report
straight to the Managing Director, Company Secretary or the Chair of the Audit Committee if they
believe their immediate supervisor may be implicated.
Directors, senior executives and employees must avoid any personal, financial or other interest that
may conflict with their duties and responsibilities to the Company. Any interest that may constitute a
conflict of interest must be promptly disclosed to the Managing Director, Company Secretary or the
Chair of the Audit Committee.
4. Safeguard integrity in corporate reporting
Audit Committee
The Company has an Audit Committee that consists of three members, Philippa Kelly, Jim Craig and
Bruce Carter (who replaced Tim Poole during the 2016 financial year), who are all independent non‐
executive Directors (see Recommendation 2.1). All three Committee members have and maintain very
good financial literacy. Further information on their skills, qualifications and experience is set out on
pages 6 and 7 of the Directors’ Report.
The Chair of the Audit Committee is Philippa Kelly, and she is not the Chair of the Board.
Details of the number of Audit Committee meetings and attendance at those meetings are set out on
page 9 of the Directors' Report.
The Audit Committee has adopted a formal Charter, which is available on the Company's website. The
Charter sets out the Audit Committee’s composition, responsibilities and powers to ensure the
adequacy of the Company’s financial reporting. The Audit Committee oversees the Company’s internal
financial controls and the appointment of the external auditor. The Audit Committee will consider
matters relevant to the preparation of the Company's financial statements for approval by the Board.
It also monitors the external auditor’s ongoing independence, effectiveness and scope of work, as well
as the rotation of the audit engagement partner. The Audit Committee may seek advice from external
consultants or specialists where it considers necessary.
External auditor
The external auditor, Pitcher Partners, was appointed in November 2008 and was selected based on
having the necessary skills, objectivity and independence. This appointment is reviewed by the Board
annually. The Company's policy on audit rotation requires the partner managing the audit for the
external auditor be changed within a period of five years.
The Company's external auditor is invited to attend meetings of the Audit Committee when
appropriate, including meetings without management being present.
Approval of financial statements
As part of the Company's financial assurance processes, the Directors receive a declaration from the
Managing Director and the Chief Financial Officer before approving financial statements for a full year
or half year period.

Page 39
The declaration confirms to the Directors that, in the opinion of the Managing Director and the Chief
Financial Officer:
• the Company’s financial records have been properly maintained in accordance with the
Corporations Act;
• the financial statements and the notes for the financial period or year comply with the
accounting standards and give a true and fair view of the financial position and performance
of the Company; and
• the declaration is founded on a sound system of risk management and internal control and
that the system is operating effectively in all material respects in relation to financial reporting
risks.
Annual General Meeting
The Company holds a general meeting each year and copies of presentations are lodged with the ASX
and made available on the Company's website. Shareholders have the opportunity to ask questions at
the meeting and meet informally with Directors after the meeting.
The Company's external auditor attends the general meeting each year and is available to answer
questions from shareholders regarding the conduct of the audit, the preparation and content of the
auditor’s report, the accounting policies adopted by the Company in the preparation of its financial
statements and the independence of the auditor in relation to the conduct of the audit. The Company
considers this is an important safeguard for the integrity of the Company’s financial reporting process.
5. Make timely and balanced disclosure
Continuous disclosure
ASX Listing Rule 3.1 requires the Company to inform the ASX immediately once the Company is or
becomes aware of any information concerning it that a reasonable person would expect to have a
material effect on the price or value of the Company’s shares. Procedures are in place to ensure that
items which potentially require announcement to the ASX are promptly notified to relevant parties for
approval. Depending upon content, either the Board, Managing Director or Company Secretary is
responsible for authorising market releases. All market releases are posted to the Company’s website.
The Company takes the spirit of its continuous disclosure obligations seriously and issues market
releases during the year to satisfy these obligations. All ASX announcements are available on the
Company’s website.
6. Respect the rights of security holders
Company’s website
The Company's website is one of the Company’s key communication tools.
The Company endeavours to keep the website up‐to‐date and accurate in order to provide information
about the Company’s performance and governance to investors. The Company values transparency in
all areas of operation, and understands that quality disclosure can foster the trust and confidence of
shareholders and investors.
The Company encourages shareholders to take an active interest in the Company, and publishes
information about the Company’s history, current projects and corporate structure.

Page 40
The following key documents are available for shareholders on the Company’s website under the
‘Investor Information’ section:
corporate profile and biographical information of Directors;
Board Charter;
Audit Committee Charter;
HR and Remuneration Committee Charter;
Communications Policy;
Code of Conduct;
Securities Trading Policy;
Diversity Policy;
financial statements;
notices of Annual General Meetings;
Annual Reports;
investor presentations;
operational updates; and
announcements lodged with the ASX.
Communication with shareholders
The Company recognises the timeliness, convenience and environmental advantages of electronic
communication. Shareholders have the option of communicating with the Company electronically.
Shareholders who wish to update their communication preferences should contact the Company's
share registry.
The Annual General Meeting allows the Company to provide shareholders with a greater understanding
of the Company’s operations, governance, performance and prospects, and gives shareholders the
opportunity to raise questions or concerns.
Communications with analysts, investors, media and others
The Managing Director, James Kelly and the Chief Financial Officer / Company Secretary, Geoff Hollis
generally deal with analysts, investors, media and others, taking account of regulatory guidelines
including those issued by the ASX on continuous disclosure. The presentations on the 30 June and 31
December results and other presentations are sent to the ASX and are available promptly on the
Company’s website. A teleconference held in respect of the 30 June and 31 December presentations
is conducted on the afternoon of the release.
The Company’s Communications Policy is available on the Company’s website.
7. Recognise and manage risk
The Company considers risk management as a core principle of sound corporate governance. The
Company recognises the importance of managing risk and controlling its business activities in a manner
which enables it to protect established value, identify and capitalise on opportunities to create value,
enhance resilience to external events and avoid or reduce risks which may cause injury or loss.

Page 41
Risk management
In view of its size and operational structure, the Board considers that it is able to oversee the Company's
risk management framework efficiently and effectively without establishing a risk committee (stand‐
alone or part of the responsibilities of the audit committee).
A formal risk register has been developed and approved by the Board. The register identifies specific
risks at an operational and strategic level and provides the framework for the reporting and monitoring
of material risks across the Company.
The full Board is responsible for oversight of the Company’s risk management and control framework.
The Board receives periodic reports from management on risk management matters.
The Company has disclosed its current material business risks within the Operating and Financial
Review on page 18 of the Annual Report.
The Company’s risk management processes and systems that were in place over the reporting period
include:
robust planning and budgeting process providing a long‐term financial model that enables
the Board to review timely financial forecasts as well as analyse future opportunities and
sensitivities. The Board also receives regular forecasts in relation to the liquidity of the
business;
comprehensive site selection process that requires Board approval of any acquisition case
prior to any land acquisition. The Board is then notified and approves any changes
(positive or negative) to the acquisition case prior to the commencement of construction;
a system of delegated authorities that cascades authority levels for expenditure and
commitments from the Board, the delegation to the Managing Director and further
cascading of authorities from the Managing Director to the rest of the organisation;
maintaining insurance cover appropriate to the size and nature of the Company’s
operations to reduce the financial impact of any significant insurable losses;
establishing a risk register which identifies the material risks facing the Company and
which is regularly reviewed and updated. This includes providing a risk rating, assessment
of the key controls in place to manage the risk and the person(s) responsible for
implementing and reviewing controls; and
all members of the senior management team report to the Board on financial and non‐
financial matters and meet with the Board at least quarterly.
Internal audit
The Company does not have a formal internal audit function. In view of the size of the Company, such
a function is not considered necessary or appropriate at this time. A natural control mechanism exists
in companies of this size as the Board works closely with the staff and, because the transactional volume
is small, the Directors have a detailed knowledge of the Company.
In the 2016 financial year the board has instructed the Chief Financial Officer to report on the
Company’s financial internal operations and controls; once completed in the 2017 financial year the
plan is to then engage the external auditor to review aspects of internal operations and controls on a
selected basis each year.

Page 42
Environmental risk management
The Company's risk register (described above), identifies specific risks for the Company at an
operational and strategic level.
The sustainability of the Company's business could also be adversely impacted by the way in which the
Company conducts its business and the effects on the Company's residents, employees, suppliers as
well as the Company's shareholders.
The Board has regard to economic, environmental and social sustainability risks. It does so by
considering:
• what issues are important to the sustainability of the Company's business;
• how those issues could be addressed; and
• whether it is in the interests of the Company to adopt particular measures having regard to
the materiality of the risk addressed and the likely costs of doing so or failing to do so.
This process is applied by the Board as part of its annual planning and budget approval process, when
setting the Company's strategy and when considering significant transactions for the Company.
By having regard to economic, environmental and social sustainability risks in the manner described
above, the Board seeks to ensure that it acts in the best interests of the Company.
8. Remunerate fairly and responsibly
Remuneration Committee
The Company has an HR and Remuneration Committee that consists of three members, Jim Craig,
Philippa Kelly and Tim Poole who are all independent non‐executive Directors (see Recommendation
2.1). The Chair of the HR and Remuneration Committee is Jim Craig, and he is not the Chair of the
Board.
Details of the number of HR and Remuneration Committee meetings and attendance at those meetings
are set out on page 9 of the Directors' Report.
The HR and Remuneration Committee has adopted a formal Charter which is available on the
Company's website. The Charter sets out the HR and Remuneration Committee’s responsibilities
including oversight and approval of the human resources and remuneration policies and practices of
the Company. The HR and Remuneration Committee may seek advice from external consultants or
specialists where it considers necessary.
Details of remuneration
Details of remuneration of Directors, the Managing Director and senior management are included in
the Remuneration Report on pages 25 and 26 of the 2016 Annual Report and in notes 25 and 27 to the
financial statements (set out on pages 69 and 70 of the 2016 Annual Report).

Consolidated Statement of Profit or loss and other Comprehensive incomeFor the year ended 30 June 2016
Note 2016 2015$ $
Development revenueHome settlement revenue 54,877,337 66,344,244
Cost of sales (43,080,471) (47,512,020)
Gross profit from home settlements 11,796,866 18,832,224
Management and other revenueRental revenue 11,074,970 9,160,202 Utilities revenue 1,385,214 1,106,306 Deferred management fees 6 2,508,705 1,597,538 Sub-division revenue 95,455 213,636 Finance revenue 209,884 367,702 Total management and other revenue 15,274,228 12,445,384 Fair value adjustments 5 18,924,865 15,050,549
less expensesDevelopment expenses (4,175,959) (3,690,032) Management expenses 6 (5,799,856) (4,413,552) Utilities expenses (1,657,542) (1,013,653) Corporate overheads (4,871,622) (3,959,019) Sub-division expenses (95,455) (126,619) Finance costs 6 (842,529) (1,606,134) Accelerated finance costs due to re-financing 6 - (2,421,488)
Profit before income tax 28,552,996 29,097,660 Income tax expense 7 (7,937,280) (7,222,757)
Net profit from continuing operations 20,615,716 21,874,903
Profit is attributable to: Members of the parent 19,268,682 16,652,690 Non-controlling interests 1,347,034 5,222,213
20,615,716 21,874,903
Total comprehensive income for the year 20,615,716 21,874,903
Total comprehensive income is attributable to: Members of the parent 19,268,682 16,652,690 Non-controlling interests 1,347,034 5,222,213
20,615,716 21,874,903
Earnings per share for profit attributable to the ordinary equity holders of the parent entity:
cents centsBasic earnings per share 23 18.586 16.505 Diluted earnings per share 23 18.474 16.106
The above statement should be read in conjunction with the accompanying notes.
Page 43

Consolidated Statement of Financial PositionFor the year ended 30 June 2016
Note 2016 2015$ $
ASSETSCurrent assetsCash and cash equivalents 9 3,352,040 7,999,152 Trade and other receivables 10 819,425 19,767 Inventories 11 35,548,272 17,962,778 Other current assets 12 650,553 432,736 Other financial assets 14 - 5,000,000 Total current assets 40,370,290 31,414,433
Non-current assetsInventories 11 14,197,573 12,680,744 Property, plant and equipment 13 4,227,618 2,794,430 Investment properties 15 163,676,707 132,757,442 Total non-current assets 182,101,898 148,232,616
TOTAL ASSETS 222,472,188 179,647,049
LIABILITIESCurrent liabilitiesBank overdraft 9 2,558,487 - Trade and other payables 16 14,364,641 5,357,176 Current tax payable 7 360,801 1,807,369 Provisions 17 251,792 148,865 Total current liabilities 17,535,721 7,313,410
Non-current liabilitiesInterest-bearing loans and borrowings 18 46,000,000 36,601,219 Provisions 17 311,074 274,921 Deferred tax liabilities 7 27,320,528 21,689,826 Total non-current liabilities 73,631,602 58,565,966
TOTAL LIABILITIES 91,167,323 65,879,376
NET ASSETS 131,304,865 113,767,673
EQUITY
Contributed equity 19 63,822,710 63,027,710 Reserves 20 1,561,850 1,493,481 Retained earnings 20 65,920,305 49,246,482 Members' interest in equity 131,304,865 113,767,673 Non-controlling interest 21 - -
TOTAL EQUITY 131,304,865 113,767,673
The above statement should be read in conjunction with the accompanying notes.
Page 44
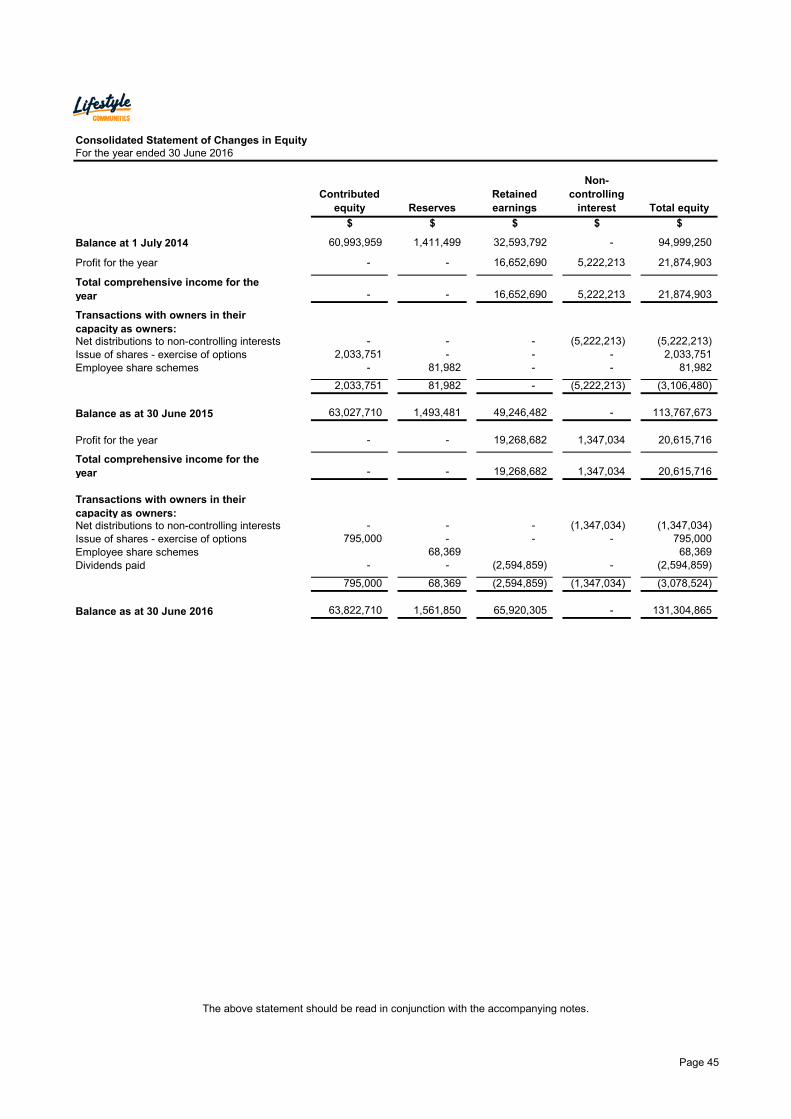
Consolidated Statement of Changes in EquityFor the year ended 30 June 2016
Contributed equity Reserves
Retained earnings
Non-controlling
interest Total equity
$ $ $ $ $
Balance at 1 July 2014 60,993,959 1,411,499 32,593,792 - 94,999,250
Profit for the year - - 16,652,690 5,222,213 21,874,903
Total comprehensive income for the year - - 16,652,690 5,222,213 21,874,903
Transactions with owners in their capacity as owners:
- - - (5,222,213) (5,222,213) Issue of shares - exercise of options 2,033,751 - - - 2,033,751 Employee share schemes - 81,982 - - 81,982
2,033,751 81,982 - (5,222,213) (3,106,480)
Balance as at 30 June 2015 63,027,710 1,493,481 49,246,482 - 113,767,673
Profit for the year - - 19,268,682 1,347,034 20,615,716
Total comprehensive income for the year - - 19,268,682 1,347,034 20,615,716
Transactions with owners in their capacity as owners:
- - - (1,347,034) (1,347,034) Issue of shares - exercise of options 795,000 - - - 795,000 Employee share schemes 68,369 68,369 Dividends paid - - (2,594,859) - (2,594,859)
795,000 68,369 (2,594,859) (1,347,034) (3,078,524)
Balance as at 30 June 2016 63,822,710 1,561,850 65,920,305 - 131,304,865
The above statement should be read in conjunction with the accompanying notes.
Net distributions to non-controlling interests
Net distributions to non-controlling interests
Page 45

Consolidated Cash Flow StatementFor the year ended 30 June 2016
Note 2016 2015$ $
Cash flows from operating activitiesReceipts from customers 76,445,342 85,159,922 Payments to suppliers and employees (84,947,737) (63,098,583)Income tax paid (3,753,146) (1,608,312)Interest received 209,884 367,702 Interest paid (2,150,799) (2,363,458)Loan notes break-fee paid - (2,051,125)
Net cash flows provided by / (used in) operating activities 22 (14,196,456) 16,406,146
Cash flows from investing activitiesPurchase of property, plant and equipment 13(a) (1,043,609) (614,098)Proceeds from long-term deposit 5,000,000 1,000,000 Purchase of investment properties and capitalised costs (1,155,105) (7,007,594)
Net cash flows provided by / (used in) investing activities 2,801,286 (6,621,692)
Cash flows from financing activitiesProceeds from exercise of options 795,000 2,033,751 Proceeds from external borrowings 23,110,819 54,579,335 Repayment of external borrowings (13,712,038) (54,117,427)Distributions paid to non-controlling interests (3,409,351) (7,037,600)Dividends paid 8(a) (2,594,859) -
Net cash flows provided by / (used in) financing activities 4,189,571 (4,541,941)
Net increase / (decrease) in cash held (7,205,599) 5,242,513
Cash at the beginning of the financial year 7,999,152 2,756,639
Cash at the end of the financial year 9 793,553 7,999,152
The above statement should be read in conjunction with the accompanying notes.
Page 46

Notes to the Financial StatementsFor the year ended 30 June 2016
NOTE 1: STATEMENT OF SIGNIFICANT ACCOUNTING POLICIES
The following is a summary of significant accounting policies adopted by the consolidated entity in the preparation and presentationof the financial report. The accounting policies have been consistently applied, unless otherwise stated.
(a) Basis of preparation
This financial report is a general purpose financial report, that has been prepared in accordance with Australian AccountingStandards, Interpretations and other authoritative pronouncements of the Australian Accounting Standards Board and theCorporations Act 2001 .
The financial report covers Lifestyle Communities Limited and controlled entities as a consolidated entity. Lifestyle CommunitiesLimited is a company limited by shares, incorporated and domiciled in Australia. Lifestyle Communities Limited is a for-profit entityfor the purpose of preparing the financial statements.
The financial report was authorised for issue by the directors as at the date of the director's report.
Compliance with IFRSThe consolidated financial statements of Lifestyle Communities Limited also comply with the International Financial ReportingStandards (IFRS) as issued by the International Accounting Standards Board (IASB).
Historical Cost ConventionThe financial report has been prepared under the historical cost convention, as modified by revaluation to fair value for certainclasses of assets as described in the accounting policies.
Significant accounting estimatesThe preparation of the financial report requires the use of certain estimates and judgements in applying the entity's accountingpolicies. Those estimates and judgements significant to the financial report are disclosed in Note 2.
(b) Principles of consolidation The consolidated financial statements are those of the consolidated entity, comprising the financial statements of the parent entityand of all entities which the parent entity controls. The group controls an entity when it is exposed, or has rights, to variable returnsfrom its involvement with the entity and has the ability to affect those returns through its power over the entity.
The financial statements of subsidiaries are prepared for the same reporting period as the parent entity, using consistent accountingpolicies. Adjustments are made to bring into line any dissimilar accounting policies, which may exist.
All inter-company balances and transactions, including any unrealised profits and losses have been eliminated on consolidation.Subsidiaries are consolidated from the date on which control is established and are de-recognised from the date that control ceases.
Equity interests in a subsidiary not attributable, directly or indirectly, to the group are presented as non-controlling interests.
Non-controlling interests in the results of subsidiaries are shown separately in the Consolidated Statement of Profit or loss and otherComprehensive income and consolidated Statement of Financial Position respectively.
(c) Cash and cash equivalents Cash and cash equivalents include cash on hand and at banks, bank overdrafts and short-term deposits with an original maturity ofthree months or less held at call with financial institutions.
(d) Inventories
Inventories are measured at the lower of cost and net realisable value. Inventories include housing units built but not sold as well ascapitalised civils and infrastructure, wages and holding costs. With effect from 1 January 2009 sales contract terms were changedand inventories include civil and infrastructure costs. Inventories are classified as either current or non-current assets pursuant to thetiming of their anticipated sale.
Page 47

Notes to the Financial StatementsFor the year ended 30 June 2016
NOTE 1: STATEMENT OF SIGNIFICANT ACCOUNTING POLICIES (continued)
(e) Revenue recognition
Revenue is recognised and measured at the fair value of the consideration received or receivable to the extent it is probable that theeconomic benefits will flow to the consolidated entity and the revenue can be reliably measured. The following specific recognitioncriteria must also be met before revenue is recognised:
(i) Home settlement revenueRevenue from home settlements is recognised when there is persuasive evidence, usually in the form of settlement of the home,indicating that there has been a transfer of risks and rewards to the customer, no further work or processing is required, the quantityand quality of the goods has been determined, the price is fixed and generally ownership has passed. The consolidated entityconsiders all risks and rewards as transferred to the customer upon receipt of final settlement. (ii) Interest revenueInterest revenue is recognised when it becomes receivable on a proportional basis taking into account the interest rates applicable tothe financial assets.
(iii) Rental revenue Rental revenue from investment properties is derived from home owners and is accounted for on a straight-line basis over the leaseterm.
(iv) Utilities revenue Utilities revenue is derived from homeowners and is billed monthly and recorded as revenue in the month of billing.
(v) Deferred management feeThe deferred management fee is receivable upon a resident selling their home. Revenue is recorded upon the resale settlement ofthe home. For all contracts entered into prior to 1 January 2009, the fee payable is 15% on the resale value of the unit and after a period of occupation of a year and one day.For all contracts entered into post 1 January 2009, the fee payable is up to 20% (the fee accumulates by 4% per year over 5 years up to 20%) on the resale value of the unit.
(vi) Sub-division revenueSub-division revenue is derived from land sold that is surplus to requirements for the residential communities. Sub-division revenue is recognised upon the exchange of an unconditional contract or if the contract is conditional once those conditions have been satisfied.
All revenue is stated net of the amount of goods and services tax (GST).
(f) Property, plant and equipment Property, plant and equipment are stated at cost less accumulated depreciation and any accumulated impairment losses.
Property under development is not depreciated. The depreciable amounts of all other fixed assets are depreciated over theirestimated useful lives commencing from the time the asset is held ready for use.
Depreciation is calculated on either a straight-line or diminishing value basis over the estimated useful life of the assets as follows:
2016 2015Buildings 40 years 40 yearsPlant and equipment 2 to 13 years 2 to 13 yearsComputer equipment 2 to 9 years 2 to 9 yearsMotor vehicles 4 to 7 years 4 to 7 years
The assets' residual values, useful lives and amortisation methods are reviewed, and adjusted if appropriate, at each financial yearend.
Page 48

Notes to the Financial StatementsFor the year ended 30 June 2016
NOTE 1: STATEMENT OF SIGNIFICANT ACCOUNTING POLICIES (continued)
(g) Investment properties
Investment properties are measured initially at cost, including transaction costs. Investment properties include undeveloped land andland subject to residential site lease agreements. Subsequent to initial recognition, investment properties are re-measured at fairvalue, which reflects market conditions. Gains or losses arising from changes in the fair values of investment properties arerecognised in profit or loss in the year in which they arise.
Investment properties are derecognised either when they have been disposed of or when the investment property is permanentlywithdrawn from use and no future economic benefit is expected from its disposal. Any gains or losses on the retirement or disposal ofan investment property are recognised in profit or loss in the year of retirement or disposal.
(h) Leases
Leases are classified at their inception as either operating or finance leases based on the economic substance of the agreement soas to reflect the risks and benefits incidental to ownership.
Operating leasesLease payments for operating leases are recognised as expenses on a straight-line basis over the term of the lease.
(i) Impairment
Assets with an indefinite useful life are not amortised but are tested annually for impairment in accordance with AASB 136Impairment of Assets. Assets subject to annual depreciation or amortisation are reviewed for impairment whenever events orcircumstances arise that indicate that the carrying amount of the asset may be impaired.
An impairment loss is recognised where the carrying amount of the asset or cash generating unit exceeds its recoverable amount.The recoverable amount of an asset cash generating unit is defined as the higher of its fair value less costs of disposal and value inuse.
(j) Borrowing costs
Borrowing costs can include interest, amortisation of discounts or premiums relating to borrowings, and ancillary costs incurred inconnection with arrangement of borrowings.
Borrowing costs are expensed as incurred, except for borrowing costs incurred as part of the cost of the construction of a qualifyingasset which are capitalised until the asset is ready for its intended use or sale. Acceptance fees are amortised over the life of thefacility.
Page 49

Notes to the Financial StatementsFor the year ended 30 June 2016
NOTE 1: STATEMENT OF SIGNIFICANT ACCOUNTING POLICIES (continued)
(k) Income tax
Current income tax expense or revenue is the tax payable on the current period's taxable income based on the applicable income taxrate adjusted by changes in deferred tax assets and liabilities.
Deferred tax balancesDeferred tax assets and liabilities are recognised for temporary differences at the applicable tax rates when the assets are expected tobe recovered or liabilities are settled. No deferred tax asset or liability is recognised in relation to temporary differences if they arose ina transaction, other than a business combination, that at the time of the transaction did not affect either accounting profit or taxableprofit or loss.
Deferred tax assets are recognised for deductible temporary differences and unused tax losses only when it is probable that futuretaxable amounts will be available to utilise those temporary differences and losses.
Current and deferred tax balances attributable to amounts recognised directly in equity are also recognised directly in equity.
Tax consolidationThe parent entity and its wholly owned subsidiaries have implemented tax consolidation and have formed a income tax-consolidatedgroup from 18 March 2011. This mean that: each entity recognises their own current and deferred tax amounts in respect of thetransactions, events and balances of the entity; and the parent entity is assumes the current tax liabilities and deferred tax assets arising in respect of tax losses, arising in the subsidiary, and recognises a contribution to (or distribution from) the subsidiaries. The taxconsolidated group also has a tax sharing agreement in place to limit the liability of subsidiaries in the tax-consolidated group, arisingunder the joint and several liability provisions of the tax consolidation system, in the event of default by the parent entity to meet itspayment obligations.
(l) Employee benefits
(i) Short-term employee benefit obligationsLiabilities arising in respect of wages and salaries, annual leave and any other employee benefits expected to be settled wholly withintwelve months of the reporting date are measured at their nominal amounts based on remuneration rates which are expected to be paidwhen the liability is settled. The expected cost of short-term employee benefits in the form of compensated absences such as annualleave is recognised in the provision for employee benefits. All other short-term employee benefit obligations are presented as payables.
(ii) Long-term employee benefit obligationsThe provision for employee benefits in respect of long service leave and annual leave which, are not expected to be settled wholly withintwelve months of reporting date, are measured at the present value of the estimated future cash outflow to be made in respect ofservices provided by employees up to the reporting date.
Employee benefit obligations are presented as current liabilities in the statement of financial position if the entity does not have anunconditional right to defer settlement for at least twelve months after the reporting date, regardless of when the actual settlement isexpected to occur.
(iii) Retirement benefit obligationsDefined contribution superannuation planThe consolidated entity makes contributions to defined contribution superannuation plans in respect of employee services renderedduring the year. These superannuation contributions are recognised as an expense in the same period when the employee services arereceived.
(iv) Share based paymentsThe consolidated entity operates an equity settled employee option scheme (ESOP) and an employee share loan scheme (ESLP).Under the ESLP, convertible repurchase-able employee shares (CRES) are issued to employees. For accounting purposes CRES aretreated like options until the time of vesting. At the time of vesting an interest-free limited recourse loan is made to the participant withthe value reflected as equity. The CRES are then convertible to ordinary shares at the discretion of the participant prior to their expirywith the loan being due and payable on or before expiry of the CRES. The fair value of the equity to which employees become entitledis measured at grant date and recognised as an expense over the vesting period, with a corresponding increase to an equity account.The number of options and employee share loans expected to vest is reviewed and adjusted at each reporting date such that theamount recognised for services received as consideration for the equity instruments granted shall be based on the number of equityinstruments that eventually vest.
Page 50

Notes to the Financial StatementsFor the year ended 30 June 2016
NOTE 1: STATEMENT OF SIGNIFICANT ACCOUNTING POLICIES (continued)
(m) Goods and services tax (GST)
Revenues, expenses and assets are recognised net of the amount of GST, except where the amount of GST incurred is not recoverablefrom the Australian Taxation Office. In these circumstances the GST is recognised as part of the cost of acquisition of the asset or aspart of an item of the expense. Where applicable receivables and payables in the statement of financial position are shown inclusive ofGST.
Cash flows are presented in the statement of cash flows on a gross basis, except for the GST component of investing and financingactivities, which are disclosed as operating cash flows.
(n) Financial instruments
ClassificationThe consolidated entity classifies its financial instruments in the following categories: financial assets at fair value through profit or loss,loans and receivables, held-to-maturity investments, and available-for-sale financial assets. The classification depends on the purposefor which the instruments were acquired. Management determines the classification of its financial instruments at initial recognition.
Non-derivative financial instrumentsNon-derivative financial instruments consist of trade and other receivables, cash and cash equivalents, loans and borrowings, and tradeand other payables.
Non-derivative financial instruments are initially recognised at fair value, plus directly attributable transactions costs (if any). After initialrecognition, non-derivative financial instruments are measured as described below.
Loans and receivablesLoans and receivables are measured at fair value at inception and subsequently at amortised cost using the effective interest ratemethod.
Interest bearing loans and borrowingsInterest bearing loans and borrowings are initially recognised at the fair value of the consideration received less directly attributabletransaction costs.
After initial recognition, interest-bearing loans and borrowings are subsequently measured at amortised cost using the effective interestmethod. Fees paid on the establishment of loan facilities that are yield related are included as part of the carrying amount of the loansand borrowings.
Borrowings are classified as current liabilities unless the group has an unconditional right to defer settlement of the liability for at least12 months after the balance sheet date.
Financial liabilitiesFinancial liabilities include trade payables, other creditors and loans from third parties.
Non-derivative financial liabilities are recognised at amortised cost, comprising original debt less principal payments and amortisation.
(o) Comparatives
Where necessary, comparative information has been reclassified and repositioned for consistency with current year disclosures.
Page 51

Notes to the Financial StatementsFor the year ended 30 June 2016
NOTE 1: STATEMENT OF SIGNIFICANT ACCOUNTING POLICIES (continued)
(p) Accounting standards issued but not yet effective at 30 June 2016
The following standards and interpretations have been issued at the reporting date but are not yet effective. The directors'assessment of the impact of these standards and interpretations is set out below.
(i) AASB 15: Revenue from Contracts with Customers
AASB 15 introduces a five step process for revenue recognition with the core principle of the new Standard being for entities to recognise revenue to depict the transfer of goods or services to customers in amounts that reflect the consideration (that is, payment) to which the entity expects to be entitled in exchange for those goods or services. The five step approach is as follows: step 1 - identify the contracts with the customer; step 2 - identify the separate performance obligations; step 3 - determine the transaction price; step 4 - allocate the transaction price; and step 5 - recognise revenue when a performance obligation is satisfied.
AASB 15 will also result in enhanced disclosures about revenue, provide guidance for transactions that were not previously addressed comprehensively (for example, service revenue and contract modifications) and improve guidance for multiple-element arrangements.
The effective date is annual reporting periods beginning on or after 1 January 2017.
The changes in revenue recognition requirements in AASB 15 may cause changes to the timing and amount of revenue recorded inthe financial statements as well as additional disclosures. The impact of AASB 15 has not yet been quantified.
(ii) AASB 9: Financial Instruments
Significant revisions to the classification and measurement of financial assets, reducing the number of categories and simplifying the measurement choices, including the removal of impairment testing of assets measured at fair value. The amortised cost model is available for debt assets meeting both business model and cash flow characteristics tests. All investments in equity instruments using AASB 9 are to be measured at fair value.
AASB 9 amends measurement rules for financial liabilities that the entity elects to measure at fair value through profit and loss. Changes in fair value attributable to changes in the entity’s own credit risk are presented in other comprehensive income.
Revised disclosures about an entity’s hedge accounting have also been added to AASB 7 Financial Instruments: Disclosures .
Impairment of assets is now based on expected losses in AASB 9 which requires entities to measure: the 12-month expected credit losses (expected credit losses that result from those default events on the financial instrument that are possible within 12 months after the reporting date); or full lifetime expected credit losses (expected credit losses that result from all possible default events over the life of the financial instrument.
The effective date is annual reporting periods beginning on or after 1 January 2018.
Page 52

Notes to the Financial StatementsFor the year ended 30 June 2016
Consolidation of subsidiaries
(ii) Significant accounting estimates and assumptions Valuation of investment properties
The Group’s principal financial instruments comprise loan notes, bank loans, finance leases, cash and term deposits, trade and other receivables and trade payables.
The Group manages its exposure to key financial risk, including interest rate risk in accordance with the Group's financial risk management policy. The objective of the policy is to support the delivery of the Group’s financial targets whilst protecting future financial security.
The main risks arising from the Group’s financial instruments are interest rate risk, market risk, credit risk and liquidity risk. The Group uses different methods to measure and manage different types of risks to which it is exposed. These include market forecasts for interest rates. Liquidity risk is monitored through the development of future rolling cash flow forecasts. These procedures are sufficient to identify when mitigating action might be required.
NOTE 3: FINANCIAL RISK MANAGEMENT OBJECTIVES & POLICIES
The Group values investment properties at fair value. Fair value is determined by a combination of the discounted annuity streamsassociated with the completed and settled home units and the fair value of the undeveloped land. Inputs for the fair value of investmentproperties are derived from independent valuations and adjusted to reflect actual rental income.
Share based payment transactions
Deferred tax assets are recognised for deductible temporary differences as management considers that it is probable that future taxableprofits will be available to utilise those temporary differences.
The Group measures the cost of equity-settled transactions with employees by reference to the fair value of the equity instruments at the date at which they are granted. The fair value is determined using the Black-Scholes model, with the assumptions detailed in Note 25. The accounting estimates and assumptions relating to equity-settled share-based payments would have no impact on the carrying amounts of assets and liabilities within the next annual reporting period but may impact expenses and equity.
NOTE 2: SIGNIFICANT ACCOUNTING ESTIMATES AND JUDGEMENTS
The preparation of the financial statements requires management to make estimates and assumptions that affect the reported amountsin the financial statements. Management continually evaluates its estimates in relation to assets, liabilities, contingent liabilities,revenue and expenses. Management bases its estimates on historical experience and on other various factors it believes to bereasonable under the circumstances.
(i) Significant accounting judgments
Deferred tax assets and liabilities are based on the assumption that no adverse change will occur in the income tax legislation and theanticipation that the group will derive sufficient future assessable income to enable the benefit to be realised and comply with theconditions of deductibility imposed by the law.
Income tax
The estimates and assumptions based on future events have a significant inherent risk, and where future events are not anticipatedthere could be a material impact on the carrying amounts of the assets and liabilities in future periods, as discussed below.
The Company consolidates its interests in joint venture entities Cameron Street Developments Pty Ltd and Lifestyle Chelsea Heights Pty Ltd in accordance with AASB 10 Consolidated Financial Statements requirements. The Company is exposed to variable returns and is able to influence these returns via the power over the investee due to the structure of the arrangements with its joint venture entities.
Page 53

Notes to the Financial StatementsFor the year ended 30 June 2016
Interest rate risk
Long-term debt obligations
2016 2015$ $
Financial assetsCash and cash equivalents 3,352,040 7,999,152 Other financial assets - term deposits - 5,000,000
3,352,040 12,999,152
Financial liabilitiesBank overdraft 2,558,487 - Secured loans - bank finance 46,000,000 36,601,219
48,558,487 36,601,219
Net exposure (45,206,447) (23,602,067)
2016 2015 2016 2015$ $ $ $
Consolidated +1% (100 basis points) (316,445) (165,214) (316,445) (165,214)-1% (100 basis points) 316,445 165,214 316,445 165,214
Market risk
The Group’s exposure to the risk of changes in market interest rates relates to the Group’s long-term debt obligations. The level ofdebt is disclosed in Note 18.
As at balance date, the Group had the following mix of financial assets and liabilities exposed to Australian variable interest rate risk(being the bank bill business rate):
In the prior year the Group had a $27.6 million long-term loan facility that was subject to variable interest rates. In August 2016 thisfacility was re-financed with an $80 million facility that is subject to variable interest rates.
NOTE 3: FINANCIAL RISK MANAGEMENT OBJECTIVES & POLICIES (continued)
At balance date, the Group has no financial instruments exposed to material market risks other than interest rate risk.
A proportion of the impact on post tax profit is deferred due to the capitalisation of interest to inventory which is recognised when unitsare sold.
If interest rates had moved and been effective for the period, as illustrated in the table below, with all other variables held constant,post tax profit and equity would have been affected as follows:
Post Tax Profit EquityHigher/(Lower) Higher/(Lower)
When determining the parameters for a possible change in interest rate risk, management has taken into consideration the currenteconomic environment at balance sheet date and historical movements.
The Board reviews and agrees policies for managing each of these risks as summarised as follows:
Page 54

Notes to the Financial StatementsFor the year ended 30 June 2016
Risk exposure and responses (continued)
Liquidity risk
2016 2015$ $
6 months or less (1) 14,364,641 5,357,176
6-12 months - - 1-2 years - 9,546,219 2-3 years - 27,055,000
3-4 years (2) 46,000,000 -
60,364,641 41,958,395
The remaining contractual maturities of the Group's financial liabilities are:
The Group has met all required covenants since the arrangements commenced and therefore expects that all current arrangements willcontinue until the sooner of repayment or expiry.
(1) This amount is represented by the following financial liabilities:- $103,606 relates to share of net management income payable in respect of Lifestyle Cranbourne and Lifestyle Chelsea Heights.- $14,261,035 relates to trade and other payables, refer to Note 16 for further detail.
(2) On 26 August 2015 the company re-financed its bank facilities with Westpac Banking Corporation securing an $80,000,000 facilitywith the first drawdown occurring on 25 September 2015. This facility is subject to internal credit management procedures wherebyfunds drawn are allocated between development debt (capitalised to inventory) and pre-development debt (expensed). Developmentdebt includes funding for inventory and pre-development debt includes funding for undeveloped land. As at 30 June 2016 total debtwas $46,000,000 with $33,607,940 allocated to development debt and $12,392,060 allocated to pre-development debt (as at 30 June2015 total debt was $36,601,219 with $15,127,077 allocated to development debt and $21,474,142 allocated to pre-development debt).
The Group's objective is to maintain a balance between continuity of funding and flexibility through the use of a bank facility. The Groupensures that there is sufficient liquidity within the bank facility by maintaining internal credit requirements that are more conservativethan the financier.
The table below represents the undiscounted contractual settlement terms for financial instruments and management expectation forsettlement of undiscounted maturities.
NOTE 3: FINANCIAL RISK MANAGEMENT OBJECTIVES & POLICIES (continued)
Credit risk
There are no significant concentrations of credit risk within the Group.
Credit risk arises from the financial assets for the Group, which comprise cash and cash equivalents, and trade and other receivables.The Group’s exposure to credit risk arises from potential default of the counterparty, with a maximum exposure equal to the carryingamount of these instruments. Exposure at balance date has been assessed as minimal as the financial assets have been assessed ashaving a high likelihood of being received.
The Group's debt as at balance date is outlined at Note 18.
Page 55

Notes to the Financial StatementsFor the year ended 30 June 2016
NOTE 4: FAIR VALUE MEASUREMENTS
(a) Fair value hierarchy
30-Jun-16 Level 1 Level 2 Level 3 TotalRecurring Fair Value Measurements $ $ $ $Investment properties - - 163,676,707 163,676,707 Total assets measured at fair value - - 163,676,707 163,676,707
30-Jun-15 Level 1 Level 2 Level 3 TotalRecurring Fair Value Measurements $ $ $ $Investment properties - - 132,757,442 132,757,442 Total assets measured at fair value - - 132,757,442 132,757,442
(b) Valuation techniques and inputs used in level 3 fair value measurements(i) Investment properties
(c) Significant unobservable inputs used in level 3 fair value measurements(i) Investment propertiesDeferred management fee annuity - the valuation for this component is taken directly from independent valuations.
Undeveloped land - the valuation for this component is taken from inputs within the independent valuations.
Adopted Per valuationsWeekly rentals ($) 174.13 - 183.47 169.65 - 183.03Anticipated % expenses (as a percentage of rental income) 28% - 41.5% 28% - 41.5%Rental capitalisation rates (%) 8% - 8.5% 8% - 8.5%Rental values per unit ($) 67,905 - 81,934 67,905 - 81,934Deferred management fee discount rates (%) 13% - 14% 13% - 14%Deferred management fee values per unit ($) 25,446 - 46,083 25,446 - 46,083Valuation of undeveloped land (per hectare) ($'million) 0.17 - 1.58 0.17 - 1.58
Rental annuity - the directors adjust the weekly rental rate to actuals for those communities not valued within the current year to reflect more actual rents due to annual rent increases.
Below is a summary of the significant unobservable inputs utilised across the portfolio, including the inputs obtained from the independent valuations:
The fair value of investment properties is determined by a combination of inputs from independent valuations and directors' valuations. Fair value is determined by a combination of the discounted annuity streams associated with the completed home units and the fair value of the undeveloped land. Inputs, including capitalisation rates, discount rates, deferred management fee annuity value, and management expense rates are derived from independent valuations. Some inputs relating to the rental annuity streams are adjusted to reflect appropriate data relating to the rental at those communities that weren't valued in the current year. The fair value of undeveloped land is based on inputs from independent valuations. Inputs from independent valuations are provided by property valuers who are industry specialists in valuing these types of investment properties.
Assets and liabilities measured and recognised at fair value have been determined by the following fair value measurement hierarchy:Level 1: Quoted prices (unadjusted) in active markets for identical assets and liabilitiesLevel 2: Input other than quoted prices included within Level 1 that are observable for the asset or liability, either directly or indirectlyLevel 3: Inputs for the asset or liability that are not based on observable market data
Investment properties have been classified as level 3 as it is an internally generated calculation that contains some non-observable market inputs. The company does not adjust the major inputs obtained from the independent valuations such as rental capitalisation rates, discount rates, the deferred management fee annuity values, and the management expense rates.
Page 56

Notes to the Financial StatementsFor the year ended 30 June 2016
2016 2015$ $
NOTE 4: FAIR VALUE MEASUREMENTS (continued)
(d) Reconciliation of recurring level 3 fair value movements(i) Investment propertiesOpening balance 132,757,442 110,652,212 Additions (contracted land and capitalised costs) 11,994,400 7,054,681 Net unrealised gain from fair value adjustments 18,924,865 15,050,549 Closing balance 163,676,707 132,757,442
(e) Valuation processes used for level 3 fair value measurements(i) Investment properties
(f) Sensitivity analysis for recurring level 3 fair value measurements
(i) Investment properties
Rental income
2016 2015 2016 2015$ $ $ $
Rental expense rate+2% (1,947,205) (1,507,695) (1,947,205) (1,507,695) -2% 1,947,205 1,507,695 1,947,205 1,507,695
Rental capitalisation rate+0.50% (3,774,935) (2,889,703) (3,774,935) (2,889,703) -0.50% 4,272,198 3,251,345 4,272,198 3,251,345
Deferred management fee per unit+5% 1,441,886 1,185,176 1,441,886 1,185,176 -5% (1,441,886) (1,185,176) (1,441,886) (1,185,176)
Land prices (undeveloped land)+10% 2,084,286 1,619,259 2,084,286 1,619,259 -10% (2,084,286) (1,619,259) (2,084,286) (1,619,259)
NOTE 5: FAIR VALUE ADJUSTMENTS
18,924,865 15,050,549 Net unrealised gain from fair value adjustments - investment properties (Note 15)
Fair value adjustment results from restating communities to their fair value at balance date. This income represents incremental adjustments to the fair value of investment properties upon settlement of units and reflects the discounted value of future rental and deferred management fee revenues net of expenses as well as the fair value of undeveloped land.
Higher/(Lower)
The impact of changes to the inputs that affect the valuation of investment properties is assessed below:
Rental is contractually fixed to increase by the greater of CPI or 3.5% annually. Therefore it is unlikely that there will be any material sensitivities in relation to rental income.
Gains and losses are recognised in the statement of comprehensive income within fair value adjustments.
The Company obtains independent valuations of each community at least every two years. The Company uses the independent valuers' inputs in relation to the rental and deferred management fee annuity streams apart from making adjustments to the weekly rental income for those communities not valued in the current year. These adjustments are assessed at each period end. The directors assess the value attributed to undeveloped land annually. Land contracted in any period is recognised at cost until the first valuation is obtained.
Post Tax Profit EquityHigher/(Lower)
Page 57

Notes to the Financial StatementsFor the year ended 30 June 2016
2016 2015$ $
NOTE 6: PROFIT FROM CONTINUING OPERATIONS
Revenues
(i) Deferred management feeDeferred management fees received 2,044,930 1,336,088 Selling and administration fees 463,775 261,450
2,508,705 1,597,538
Expenses
(i) Finance costs expensedAccelerated finance costs due to re-financingLoan notes break-fee - 2,051,125 Accelerated amortisation of capitalised costs of loan note finance (a) - 370,363
- 2,421,488 Other finance costsLoan notes - 789,909 Bank loans 708,196 621,002 Amortisation of capitalised costs of loan note finance - 135,212 Amortisation of loan facility fees 134,334 60,011
842,529 1,606,134
Total finance costs 842,529 4,027,622
(ii) Finance costs capitalised
Loan notes - 647,445 Bank loans 1,247,543 594,205
1,247,543 1,241,650
(iii) Management expensesManagement expenses attributable to communities 4,289,729 3,303,000 Deferred management fee sales and marketing expenses 348,690 217,083 Management surplus applicable to joint venture partners 1,161,437 893,469
5,799,856 4,413,552
(iv) Plant and equipmentDepreciation (Note 13) 339,995 246,417 Write-off of plant and equipment (Note 13) - 1,694
339,995 248,111
(v) Employee benefits expenseWages and salaries 4,036,162 3,670,014 Defined contribution superannuation expense 340,825 304,989 Share option expense 68,369 81,982 Movement in employee provisions 139,080 (139,894)
4,584,436 3,917,091
Finance costs expensed excludes the following interest capitalised as part of inventory:
Interest has been capitalised at the prevailing facility interest rate and is expensed through costs of sales as a pro-rata amount per home settled.
Profit from continuing operations before income tax has been determined after the following specific revenues and expenses:
Page 58

Notes to the Financial StatementsFor the year ended 30 June 2016
2016 2015$ $
NOTE 7: INCOME TAX
(a) Components of tax expense Current tax 2,431,998 2,852,871 Deferred income tax 5,630,702 4,903,827 Over provision in prior years (125,420) (533,941)
7,937,280 7,222,757
Decrease / (increase) in deferred tax assets (26,770) 628,001 Increase in deferred tax liabilities 5,657,472 4,275,826
5,630,702 4,903,827
Accounting profit before tax 28,552,996 29,097,660
At the statutory income tax rate of 30% (2015:30%) 8,565,899 8,729,298
Add / (less): Share based payments 20,511 24,595 Non-controlling interests accounting and tax adjustments (517,737) (1,566,923) Other (131,392) 35,787 Income tax expense 7,937,280 7,222,757
(d) Current tax Current tax relates to the following: Opening balance 1,807,369 1,096,751 Income tax 2,431,998 2,852,871 Tax payments (3,753,146) (1,608,312) Over provision (125,420) (533,941) Current tax liabilities 360,801 1,807,369
(e) Deferred taxDeferred tax relates to the following:
Deferred tax assetsThe balance comprises: Borrowing costs 70,298 38,599 Finance arranger costs - 71,206 Capital raising costs 107,075 178,478 Capital losses 465,831 481,872 Tax losses 889,425 950,067 Provision for employee entitlements 168,860 127,136 Accruals & business expenses 172,639 -
1,874,128 1,847,358
Deferred tax liabilitiesThe balance comprises: Interest capitalised 1,249,347 1,269,334 Investment property fair value adjustments 27,945,309 22,267,850
29,194,656 23,537,184
Net deferred tax liability 27,320,528 21,689,826
(c) Reconciliation between tax expense recognised in the income statement and tax expense
(b) Deferred income tax expense included in income tax expense comprises
Page 59

Notes to the Financial StatementsFor the year ended 30 June 2016
2016 2015$ $
NOTE 8: DIVIDENDS
(a) Dividends
2,594,859 -
(b) Dividends declared after balance date and not recognised
Since balance date the directors have recommended a dividend of 1.5 cents per share fully franked at 30% 1,563,177 1,544,427
6,340,221 5,968,951
NOTE 9: CASH & CASH EQUIVALENTS
CURRENT ASSETSCash at bank and on hand 3,145,540 7,792,652 Short-term deposits 206,500 206,500
3,352,040 7,999,152 CURRENT LIABILITIESBank overdraft 2,558,487 -
NET CASH 793,553 7,999,152
NOTE 10: TRADE AND OTHER RECEIVABLES
CURRENTOther receivables 819,425 19,767
Fair value and credit risk
NOTE 11: INVENTORIES
CURRENTCompleted units 19,333,323 10,336,368 Civils & infrastructure 16,214,949 7,626,410
35,548,272 17,962,778
NON-CURRENTCompleted units 1,625,640 603,427 Civils & infrastructure 12,571,933 12,077,317
14,197,573 12,680,744
TOTAL INVENTORIES 49,745,845 30,643,522
(a) Inventory expense Inventories recognised as an expense for the year ended 30 June 2016 totalled $43,080,471 for the Group (2015: $47,512,020). The expense has been included in the cost of sales line item.
Dividends paid $0.025 per share (2015: $nil per share) fully franked
Due to the short term nature of other receivables, their carrying amount is assumed to approximate their fair value. The maximum exposure to credit risk is the fair value of receivables.
Balance of franking account on a tax paid basis at balance date adjusted for franking credits arising from payment of current tax payable and franking debits arising from the payment of dividends declared at balance date:
Page 60

Notes to the Financial StatementsFor the year ended 30 June 2016
2016 2015$ $
NOTE 12: OTHER CURRENT ASSETS
Security deposits 189,067 197,028 Other assets 252,306 177,267 Prepayments 209,180 58,441
650,553 432,736 Fair value and credit risk
(a) Reconciliation of carrying amounts at the beginning and end of the period
Year end 30 June 2016 BuildingsPlant and
equipmentComputer equipment
Motor vehicles Total
$ $ $ $ $At 1 July 2015 net of accumulated depreciation
1,263,814 1,125,844 98,389 306,383 2,794,430
Additions 38,502 739,723 124,402 140,982 1,043,609 Transfer (i) 729,573 - - - 729,573 Depreciation charge for the year (46,347) (168,238) (58,511) (66,899) (339,995)
At 30 June 2016 net of accumulated depreciation 1,985,542 1,697,329 164,280 380,467 4,227,618
At 30 June 2016 Cost 2,184,023 2,589,508 506,412 718,959 5,998,902 Accumulated depreciation (198,481) (892,179) (342,132) (338,493) (1,771,285) Net carrying amount 1,985,542 1,697,329 164,280 380,467 4,227,618
Year end 30 June 2015At 1 July 2014 net of accumulated depreciation
1,292,398 819,537 64,677 251,831 2,428,443
Additions 3,400 436,670 60,424 113,604 614,098 Write-off - (1,694) - - (1,694) Depreciation charge for the year (31,984) (128,669) (26,712) (59,052) (246,417)
At 30 June 2014 net of accumulated depreciation 1,263,814 1,125,844 98,389 306,383 2,794,430
At 30 June 2015 Cost 1,415,911 1,849,785 382,010 577,977 4,225,683 Accumulated depreciation (152,097) (723,941) (283,621) (271,594) (1,431,253) Net carrying amount 1,263,814 1,125,844 98,389 306,383 2,794,430
(i) Community manager's residences at Geelong, Wollert and Officer were reclassified from Inventory to Buildings in the current year.
NOTE 14: OTHER FINANCIAL ASSETS
CURRENTTerm deposits - 5,000,000
NOTE 13: PROPERTY, PLANT AND EQUIPMENT
Due to the short term nature of other current assets, their carrying amount is assumed to approximate their fair value. The maximum exposure to credit risk is the fair value of other current assets.
Page 61

Notes to the Financial StatementsFor the year ended 30 June 2016
2016 2015$ $
NOTE 15: INVESTMENT PROPERTIES
Investment properties at fair value 163,676,707 132,757,442
(a) Reconciliation of carrying amounts at the beginning and end of the period Opening balance as at 1 July 132,757,442 110,652,212 Additions 11,994,400 7,054,681 Net gain from fair value adjustments 18,924,865 15,050,549
Closing balance as at 30 June 163,676,707 132,757,442
(b) Carrying amount of investment properties if the cost method had been applied 66,728,187 54,733,787
CURRENT1,005,733 2,750,778
878,575 638,050 391,673 23,843
1,153,911 615,769 10,934,750 -
- 1,328,736 14,364,641 5,357,176
Other payables are non-traded payables, are non-interest bearing and have an average term of 30 days.
(d) Contracted land
NOTE 16: TRADE AND OTHER PAYABLES
(a) Trade payables
Trade payables (a)Customer deposits (b)GST payableOther payables and accruals (c)Contracted land (d)Trust distributions payable (e)
Trade payables are non-interest bearing and are normally settled on 7 to 30 day terms. Due to the short term nature of trade payables, their carrying amount is assumed to approximate their fair value.
(e) Trust distributions payable
(c) Other payables
Includes $10,305,000 payable on the settlement of land at Berwick Waters (scheduled to settle in the first-half of the 2017 financial year) and $629,750 accrued stamp duty due upon settlement of the land.
These are payable to non-controlling interests and are expected to be paid within six months to two years but the Company has no legal right to defer payment so they are classified as current.
(b) Customer depositsThese represent deposits received from customers that are recognised as revenue upon home settlement.
Investment properties are subject to a first charge, forming, in part, the security of the Group’s loans as disclosed in Note 18.
The investment properties are at various stages of development and are subject to further development until fully completed.
Investment properties are carried at fair value, which has been determined by a combination of inputs from independent valuations and Directors' valuations. Fair value is determined by a combination of the discounted annuity streams associated with the completed home units and the fair value of the undeveloped land. Inputs for the discounted annuity streams associated with the completed home units are derived from independent valuations . The inputs are adjusted to reflect appropriate conditions pertaining to the weekly rental at some communities. The fair value of the land is based on independent valuations. Inputs from independent valuations are provided by property valuers who are industry specialists in valuing these types of investment properties.
The fair value represents the amount at which the assets could be exchanged between a knowledgeable willing buyer and a knowledgeable willing seller in an arms length transaction at the date of the valuation, in accordance with Australian Accounting Standards. In determining fair value, the expected net cash flows applicable to each property have been discounted to their present value using a market determined, risk-adjusted, discount rate applicable to the respective asset.
All rental income and deferred management fee income disclosed in the income statement was generated from investment properties. All management expense relates to investment properties that generated rental income.
Page 62

Notes to the Financial StatementsFor the year ended 30 June 2016
2016 2015$ $
NOTE 17: PROVISIONS
CURRENTEmployee provisions 251,792 148,865
NON-CURRENTEmployee provisions 311,074 274,921
NOTE 18: INTEREST-BEARING LOANS AND BORROWINGS
NON-CURRENTSecured loans - bank finance 46,000,000 36,601,219
For terms and conditions attached to each type of borrowing, refer to section (c)
(a) Secured loans - bank finance maturity
(b) Fair values
(c) Terms and conditions (i) Bank overdraft
(i) Non-current secured loans - bank finance
(d) Assets pledged as security
(e) Defaults and breaches
Mortgage by Lifestyle Investments 2 Pty Ltd over the Shepparton, Hasting, Wollert, Geelong and Officer properties.
During the current or prior year there have been no defaults or breaches of any banking covenants as set out in the various Business Finance Agreements with Westpac.
As at reporting date the company has drawn $46,000,000 in addition to the bank overdraft of $2,558,487. The $80,000,000 facility agreement was signed on 26 August 2015. This facility re-financed the $27,000,000 fully-drawn Westpac facility and $8,577,183 of Westpac development facilities relating to Shepparton, Wollert and Geelong. The facility has an expiry of greater than one year, expiring on 26 August 2020.
The Group has met all required covenants since the arrangements commenced and therefore expects that all current arrangements will continue until the sooner of repayment or expiry.
The new $80,000,000 facility held with Westpac Banking Corporation is secured by the following:- General Security Deeds between Westpac Banking Corporation and Lifestyle Communities Limited, Lifestyle Investments 1 Pty Ltd, Lifestyle Developments 1 Pty Ltd, Lifestyle Management 1 Pty Ltd, Brookfield Village Development Pty Ltd, Brookfield Village Management Pty Ltd, Lifestyle Investments 2 Pty Ltd, Lifestyle Developments 2 Pty Ltd, Lifestyle Management 2 Pty Ltd and Lifestyle Communities Investments Cranbourne Pty Ltd.
Mortgage by Lifestyle Investments 1 Pty Ltd over Melton, Tarneit and Warragul properties.
Unless disclosed below, the carrying amount of the Group's current and non-current borrowings approximate their fair value.
As at reporting date the company has drawn $48,558,487 comprising a facility a loan of $46,000,000 and a bank overdraft of $2,558,487 of the $80,000,000 facility with Westpac Banking Corporation. The facility has an expiry of greater than one year, expiring on 26 August 2020.
As at reporting date the company has a bank overdraft of $2,558,487. The Company has a $5,000,000 overdraft sub-limit as part of the $80,000,000 facility with Westpac Banking Corporation.
Page 63

Notes to the Financial StatementsFor the year ended 30 June 2016
2016 2015$ $
NOTE 19: CONTRIBUTED EQUITY
104,211,800 Ordinary shares (2015: 102,961,799 Ordinary shares) 63,822,710 63,027,710 453,331 Convertible repurchase-able employee shares (CRES) (2015: 533,332 CRES) - -
63,822,710 63,027,710
(i) Reconciliation of Ordinary sharesNumber $
2015Opening balance 99,970,131 60,993,959 Movement 2,991,668 2,033,751 Balance as at 30 June 2015 102,961,799 63,027,710
2016Opening balance 102,961,799 63,027,710 Issue of shares - exercise of options 1,050,000 795,000 Issue of shares - conversion of CRES to ordinary shares 200,001 - Balance as at 30 June 2016 104,211,800 63,822,710
(ii) Reconciliation of CRESNumber $
2015Opening balance 800,000 - Movement (266,668) - Balance as at 30 June 2015 533,332 -
2016Opening balance 533,332 - Conversion to ordinary shares (200,001) - Issue of CRES shares 120,000 - Balance as at 30 June 2016 453,331 -
(a) Ordinary shares
(b) CRES
(c) Capital management
The Group is not subject to externally imposed capital requirements.
As a general principle, the Directors of Lifestyle Communities intend to declare dividends out of post tax, operating cash flow generated from community management. In FY2016 community management cash flows delivered a sufficient surplus to declare and pay an interim fully franked dividend of 1.0 cent per share ($1,040,118) and declare a final fully franked dividend of 1.5 cents per share ($1,563,177).
Considerations in determining the level of free cash flow from which to pay dividends include: operating cash flow generated from community management; the projected tax liability of Lifestyle Communities Limited; the level of corporate overheads attributable to community roll out; the level of interest to be funded from free cash flow; and additional capital needs of the development business.
Dividends
120,000 CRES shares with a conversion price of $2.696 each, exercisable in three tranches upon completion of a continuous two, three and four years of service. Vesting dates 22 July 2017, 22 July 2018 and 22 July 2019; the expiry date is 22 July 2020.
Fully paid ordinary shares carry one vote per share and carry the right to dividends.
800,000 convertible repurchase-able employee shares were issued on 22 May 2013 pursuant to the employee share loan plan approved at the 2012 AGM. On 22 May 2015 and 23 May 2016, the first tranche and part of the second tranche of CRES (466,669 CRES) were converted to ordinary shares. The conversion of 466,669 CRES to ordinary shares has crystallised a non-recourse loan with selected employees. This loan will only be brought to account upon settlement of the loan by the employee. 66,667 CRES shares are available to convert to ordinary shares and the balance of 266,664 can be converted to ordinary shares on 22 May 2017. For further information relating to the value prescribed to the CRES refer to Note 25.
CRES shares are treated as an option for accounting purposes as the employee has the option not to convert them to ordinary shares by not completing the required years of service.
CRES shares carry no right to dividends and holders can only vote on the following matters (one vote per share): on a proposal to reduce the share capital of the company that effects rights attached to CRES; and during the winding up of the company.
When managing capital, management's objective is to ensure the entity continues as a going concern as well as to maintain optimal returns to shareholders and benefits for other stakeholders. Management also aims to maintain a capital structure that ensures the lowest cost of capital available to the entity by assessing the cost of equity (share issue), cost of debt (borrowings) or a combination of both.
Page 64

Notes to the Financial StatementsFor the year ended 30 June 2016
2016 2015$ $
NOTE 20: RETAINED EARNINGS AND RESERVES
(a) Movements in retained earnings were as follows:
Balance 1 July 49,246,482 32,593,792 Net profit 19,268,682 16,652,690 Dividends paid (2,594,859) -
65,920,305 49,246,482
(b) ReservesOption reserve
$2015At 1 July 2014 1,411,499 Option expense 81,982 At 30 June 2015 1,493,481
2016At 1 July 2015 1,493,481 Option expense 68,369 At 30 June 2016 1,561,850
NOTE 21: NON-CONTROLLING INTERESTS
Interest in:Retained earnings - -
Details of subsidiaries with non-controlling interests
2016 2015$ $
Current assets 477,523 639,334Non-current assets - 78,702Total assets 477,523 718,036
Current liabilities 477,523 718,036Non-current liabilities - - Total liabilities 477,523 718,036
Net assets - -
Revenues 653,320 12,119,580Expenses (464,541) (8,685,748) Net profit after tax from continuing operations 188,779 3,433,832
Profit allocated to non-controlling interest 94,389 1,716,916
The joint venture arrangement provides significant restrictions on the use of assets and liabilities to protect the non-controlling interest. There are many key decisions that require agreement from non-controlling interests including: entering into unbudgeted capital commitments greater than $50,000; sales and purchases of assets that are greater than 10% of total assets; and substantial alteration to the strategic direction of the activities.
(i) Summarised financial information for subsidiary:
The option reserve is used to record the fair value of options issued to employees and directors as part of their remuneration as well as the fair value of options issued for services (refer Note 25 for further details).
(a) The Group has a 50% interest (2015: 50%) in the subsidiary entity, Cameron Street Developments Unit Trust, whose principal activity is the development of a master planned residential village. The Group's voting power is equal to its ownership interest. The entity is registered and operates in Australia.
Cameron Street Developments Unit Trust commenced its operations in November 2010.
Page 65

Notes to the Financial StatementsFor the year ended 30 June 2016
2016 2015$ $
NOTE 21: NON-CONTROLLING INTERESTS (continued)
Details of subsidiaries with non-controlling interests (continued)
Cash flows from operating activities 454,315 8,974,585 Cash flows from investing activities (4,169) (4,049) Cash flows from financing activities (383,341) (9,407,311) Net cash flows 66,805 (436,775)
Trust distributions 188,779 3,433,832
Bank guarantees 100,000 100,000
Current assets 111,630 4,761,294Non-current assets - 188,320Total assets 111,630 4,949,614
Current liabilities 111,630 4,949,614Non-current liabilities - - Total liabilities 111,630 4,949,614
Net assets - -
Revenues 8,342,057 20,392,291Expenses (5,836,768) (13,381,696) Net profit after tax from continuing operations 2,505,289 7,010,595
Profit allocated to non-controlling interest 1,252,645 3,505,298
Cash flows from operating activities 3,898,397 7,389,488 Cash flows from investing activities (31,220) (48,617) Cash flows from financing activities (5,269,303) (5,947,272) Net cash flows (1,402,126) 1,393,599
Trust distributions 2,505,289 7,010,595
Contracted development costs - 418,436
Bank guarantees 106,182 106,182
(iv) Summarised financial information for subsidiaries' contingent liabilities:
(ii) Summarised financial information for subsidiaries' cash flows:
(v) Summarised financial information for subsidiaries' contingent liabilities:
(ii) Summarised financial information for subsidiaries' cash flows:
(iv) Summarised financial information for subsidiaries' capital commitments:
(iii) Summarised financial information for subsidiaries' trust distributions:
Bank guarantees are funded by the subsidiaries and are secured by term deposits.
Bank guarantees are funded by the subsidiaries and are secured by term deposits.
(b) The Group has a 50% interest (2015: 50%) in the subsidiary entity, Lifestyle Chelsea Heights Unit Trust, whose principal activity is the development of a master planned residential village. The Group's voting power is equal to its ownership interest. The entity is registered and operates in Australia.
Lifestyle Chelsea Heights Unit Trust commenced its operations in 22 December 2011.
(iii) Summarised financial information for subsidiaries' trust distributions:
(i) Summarised financial information for subsidiary:
The joint venture arrangement provides significant restrictions on the use of assets and liabilities to protect the non-controlling interest. There are many key decisions that require agreement from non-controlling interests including: entering into unbudgeted capital commitments greater than $50,000; sales and purchases of assets that are greater than 10% of total assets; and substantial alteration to the strategic direction of the activities.
Page 66

Notes to the Financial StatementsFor the year ended 30 June 2016
2016 2015$ $
NOTE 22: CASH FLOW STATEMENT RECONCILIATION
Operating profit after income tax 20,615,716 21,874,903
Adjustment for non-cash items:Depreciation 339,995 246,417 Amortisation 134,334 565,586 Write-off of plant and equipment - 1,694 Share option expense 68,369 81,982 Fair value adjustment (18,924,865) (15,050,549)
Add back/(subtract) changes in operating assets and liabilities:(Increase)/decrease in trade and other receivables (102,771) 78,447 (Increase)/decrease in inventories (20,051,895) 1,064,892 Increase/(decrease) in trade and other payables (598,551) 2,068,223 Increase/(decrease) in provisions 139,080 (139,894)Increase/(decrease) in current tax (1,446,568) 710,618 Increase in deferred tax 5,630,701 4,903,827 Net cash flow from operating activities (14,196,456) 16,406,146
NOTE 23: EARNINGS PER SHARE
(a) Earnings used in calculating earnings per share
For basic and diluted earnings per share:Net profit 19,268,682 16,652,690
(b) Weighted average number of shares
103,673,650 100,894,035
Effect of dilution:Share options 629,841 2,498,837
104,303,491 103,392,872
a) Reconciliation of net cash flows from operating activities to operating profit
There have been no transactions involving ordinary shares or potential ordinary shares that would significantly change the number ofordinary shares or potential ordinary shares outstanding between the reporting date and the date of completion of these financialstatements.
Weighted average number of ordinary shares for basic earnings per share
Weighted average number of ordinary shares adjusted for dilution
The following reflects the income and weighted average number of shares used in the basic and diluted earnings per share computations:
Page 67

Notes to the Financial StatementsFor the year ended 30 June 2016
NOTE 24: RELATED PARTY DISCLOSURES
(a) Subsidiaries
Name
2016 2015 2016 2015$ $
Lifestyle Investments 1 Pty Ltd Australia 100% 100% 8,751,551 8,751,551 Lifestyle Developments 1 Pty Ltd Australia 100% 100% - - Lifestyle Management 1 Pty Ltd Australia 100% 100% - - Lifestyle Seasons Pty Ltd Australia 100% 100% 3 3 Lifestyle Cranbourne Pty Ltd Australia 100% 100% 3 3 Brookfield Management Trust (Trustee: Brookfield Village Management Pty Ltd)
Australia 100% 100% - -
Brookfield Development Trust (Trustee: Brookfield Village Development Pty Ltd)
Australia 100% 100% - -
Lifestyle Communities Investments Cranbourne Pty Ltd
Australia 100% 100% - -
Cameron Street Developments Pty Ltd Australia 50% 50% - - Cameron Street Developments Unit Trust (Trustee: Cameron Street Developments Pty Ltd)
Australia 50% 50% - -
Lifestyle Investments 2 Pty Ltd Australia 100% 100% 2 2 Lifestyle Developments 2 Pty Ltd Australia 100% 100% 2 2 Lifestyle Management 2 Pty Ltd Australia 100% 100% 2 2 Lifestyle Chelsea Heights Pty Ltd Australia 50% 50% - - Lifestyle Chelsea Heights Unit Trust (Trustee: Lifestyle Chelsea Heights Trust Pty Ltd)
Australia 50% 50% - -
Lifestyle Warragul Pty Ltd Australia 100% 100% 120 120 Lifestyle Shepparton Pty Ltd Australia 100% 100% 120 120 Lifestyle Whirakee Pty Ltd Australia 100% 100% 3 3 Lifestyle Parks Australia Pty Ltd Australia 100% 100% 3 3
8,751,809 8,751,809
(b) Ultimate parent Lifestyle Communities Limited is the ultimate Australian parent entity.
(c) Loans from related partiesThere are no loans from related parties.
There were no transactions with related parties in the current or prior years.
The consolidated financial statements include the financial statements of Lifestyle Communities Limited and the subsidiaries listed in the following table:
% Equity interestCarrying value of parent
entity’s interest
(d) Transactions with related parties
Country of incorporation
Page 68

Notes to the Financial StatementsFor the year ended 30 June 2016
2016 2015$ $
NOTE 25: SHARE-BASED PAYMENTS
(a) Recognised share-based payment expenses
68,369 81,982
(b) Types of share-based payment plans
Employee Share Loan Plan, 'ESLP'
(c) Summaries of options and CRES granted
2016 2016 2015 2015No. WAEP No. WAEP
A$ A$Outstanding at the beginning of the year 1,583,332 0.797 4,575,000 0.797 CRES issued during the year 120,000 2.696 - - Options exercised during the year (1,050,000) 0.757 (2,725,000) 0.746 CRES exercised during the year (200,001) 0.876 (266,668) 0.876 Outstanding at the end of the year 453,331 1.358 1,583,332 0.797
Exercisable at the end of the year 66,667 0.876 1,050,000 0.757
The outstanding balance as at 30 June 2016 is represented by:
The expense recognised for employee services received during the year is shown in the table below:
Expense arising from equity-settled shared-based payment transactions
The following table illustrates the number (No.) and weighted average exercise price (WAEP) of, and movements in, share optionsissued during the year:
- 266,664 CRES shares with a conversion price of $0.876 each, exercisable in one tranche upon completion of a continuous four years of service. Vesting date 22 May 2017; the expiry date is 22 May 2018 (issued pursuant to the Employee Share Loan Plan).- 120,000 CRES shares with a conversion price of $2.696 each, exercisable in three tranches upon completion of a continuous two, three and four years of service. Vesting dates 22 July 2017, 22 July 2018 and 22 July 2019; the expiry date is 22 July 2020 (issued pursuant to the Employee Share Loan Plan).
The purpose of the ESLP is to provide eligible employees with an opportunity to acquire convertible repurchase‐able employeeshares ("CRES") in the Company and, by virtue of the fact that CRES are convertible into ordinary shares in the Company, therebyenable them to participate in any growth in the value of the Company, encouraging them to improve the longer term performance of the Company and its returns to shareholders, and to motivate and retain them. The issue of a CRES involves the granting of afinancial assistance loan to each participant for each CRES issued. The loan is due and payable on or before expiry of the CRES.
The ESLP was approved at the Company's 2012 AGM and 920,000 CRES shares have been issued under this plan to date. TheESLP is available for selected employees but excludes directors.
When a participant ceases employment prior to the vesting of their CRES shares, the CRES are forfeited and the employee loan iswritten off against CRES capital. The contractual life of each CRES share granted is five years. The vesting conditions require that theowner of the CRES share has completed continuous service requirements with the Company since date of issue. There are no cashsettlement alternatives.
- 66,667 CRES shares with a conversion price of $0.876 each, vested and exercisable in one tranche up until the expiry date of 22 May 2018 (issued pursuant to the Employee Share Loan Plan).
Page 69

Notes to the Financial StatementsFor the year ended 30 June 2016
NOTE 25: SHARE-BASED PAYMENTS (continued)
(e) Weighted average remaining contractual life
(f) Range of exercise price
(g) Weighted average fair value of options and CRES granted during the year
(h) Option and CRES pricing models:
ESOP ESLP (CRES)Options for
services ESLP (CRES)FY2011 FY2013 FY2013 FY2016
Dividend yield (%) 0% 3% 5% 3%Expected volatility (%) (4 year historical monthly) 67% 41% 43% 28%Risk-free interest rate (%) 5.28% 2.81% 2.73% 2.20%Vesting period at issue (years) 2 2, 3, 4 - 2, 3, 4Time to expiry at issue (years) 5 5 5 5Option/CRES exercise price ($) $0.650 $0.876 $0.800 $2.696Weighted average share price at measurement date ($) $0.700 $0.700 $0.700 $2.451
2016 2015$ $
NOTE 27: KEY MANAGEMENT PERSONNEL
Compensation of Key Management Personnel Short-term employee benefits 1,344,078 1,351,552 Post-employment benefits 101,831 106,648 Share-based payments 43,582 81,982
1,489,491 1,540,183
There were no changes to employees defined as key management personnel during the 2016 financial year.
The fair value of the equity-settled share options granted under the 2011 ESOP, the 2013 ESLP (CRES) and the 2013 issue of options to Bellwether Investments Pty Ltd for services is estimated as at the date of grant using a Black-Scholes Model taking into account the terms and conditions upon which the options/CRES were granted.
The expected volatility was determined by reference to the Group's individual historical volatility and is based on a four year monthlycalculation.
The weighted average remaining contractual life for the share options and CRES outstanding as at 30 June 2016 is 2.5 years (2015: 2.4).
The range of exercise prices for options and CRES outstanding at the end of the year was $0.876 to $2.696 (2015: $0.65 to $0.876).
The weighted average fair value of CRES granted during the year was $0.608. There were no options or CRES granted in the prior year.
Operating segments are reported based on internal reporting provided to the Managing Director who is the Group's chief operating decision maker.
NOTE 26: SEGMENT INFORMATION
The consolidated entity operates within one operating segment, being the property development and management industry. As a result disclosures in the consolidated financial statements and notes are representative of this segment.
Page 70

Notes to the Financial StatementsFor the year ended 30 June 2016
2016 2015$ $
NOTE 28: COMMITMENTS AND CONTINGENCIES
(a) Commitments
Operating lease commitments receivable – Group as lessor
Future minimum rentals receivable under non-cancellable operating leases as at balance date were as follows:
Within one year 12,581,362 10,362,827 After one year but not more than five years 50,325,446 41,451,307 After more than five years 1,030,380,327 853,428,936 Total minimum lease payments 1,093,287,134 905,243,070
Operating lease commitments payable - Group as lessee
Future minimum rentals payable under non-cancellable operating leases as at balance date were as follows:
Within one year 162,464 144,228 After one year but not more than five years 135,386 264,418 Total minimum lease payments 297,850 408,646
Contracted construction commitmentsPayable not later than one year 5,080,611 4,699,458
(b) Contingencies
Bank guarantees 206,182 206,182
These non-cancellable leases have remaining terms of between 83 and 90 years and are transferable. All leases include a clause toenable upward revision of the rental charge on an annual basis according to prevailing market conditions.
The Group has entered into commercial property leases with its residents in relation to its investment property portfolio, consisting ofthe Group's land. The residential site leases provide for future lease commitments receivable as disclosed below.
Minimum lease payments were determined by measuring the current years rentals and measuring this over the standard 90 year leaseagreement.
Bank guarantees are funded by the joint venture entities and are secured by term deposits.
The Group has entered into commercial property lease with its landlord for office premises. The contract provides for future leasecommitments payable as disclosed below.
The lease has an initial term of four years from the commencement date being 1 May 2014.
Page 71

Notes to the Financial StatementsFor the year ended 30 June 2016
2016 2015$ $
NOTE 29: AUDITORS REMUNERATION
The auditor of Lifestyle Communities Limited is Pitcher Partners.
Amounts received or due and receivable for current auditors:
115,984 142,500
50,773 42,790
166,757 185,290
NOTE 30: PARENT ENTITY DISCLOSURES
Required disclosures relating to Lifestyle Communities Limited as a parent entity:
Current assets 96,179,594 35,471,178 Total assets 113,856,573 51,839,312
Current liabilities 3,752,740 2,329,597 Total liabilities 50,219,113 2,759,818
Net assets 63,637,460 49,079,494
Equity:Contributed equity 63,465,695 62,670,695 Reserves:Option reserve 1,561,850 1,493,481
Accumulated losses (1,390,085) (15,084,682) Total equity 63,637,460 49,079,494
Net profit 16,289,454 (2,608,900)
Total comprehensive income 16,289,454 (2,608,900)
NOTE 31: SIGNIFICANT EVENTS AFTER BALANCE SHEET DATE
An audit or review of the financial report of the entity and any other entity in the consolidated group.
Other services in relation to the entity and any other entity in the consolidated group - tax compliance, general tax advice, human resources advice, IT consulting and other agreed upon procedures.
There are no matters or affairs that have arisen since balance date which significantly affect or may significantly affect the operations of the consolidated entity.
Subsequent to year end Lifestyle Developments 2 Pty Ltd, a subsidiary of Lifestyle Communities Limited, declared a dividend of $15,000,000. This ensures that there are sufficient retained earnings within Lifestyle Communities Limited to declare its dividend.
Page 72

Notes to the Financial StatementsFor the year ended 30 June 2016
NOTE 32: DEED OF CROSS GUARANTEE
- Lifestyle Communities Limited- Lifestyle Investments 2 Pty Ltd- Lifestyle Developments 2 Pty Ltd
2016 2015$ $
(a) Consolidated Statement of Comprehensive Income of the closed group
Development revenueHome settlement revenue 45,247,665 30,633,341
Cost of sales (36,671,617) (24,743,715)
Gross profit from home settlements 8,576,048 5,889,626
Management and other revenueRental revenue 1,627,355 820,983 Management fee income 760,098 1,681,370 Trust distributions 1,252,644 3,505,297 Finance revenue 134,178 245,499 Total management and other revenue 3,774,275 6,253,149 Fair value adjustments 14,350,213 11,559,738 less ExpensesDevelopment expenses (3,994,273) (3,093,531) Management expenses (1,627,355) (820,983) Corporate overheads (4,850,339) (3,932,304) Finance costs (612,831) -
Profit before income tax 15,615,738 15,855,695 Income tax expense (4,606,034) (4,856,269)
Net profit from continuing operations 11,009,704 10,999,426
Profit is attributable to: Members of the parent 11,009,704 10,999,426 Non-controlling interests - -
11,009,704 10,999,426
Pursuant to ASIC Class Order 98/1418 (as amended) dated 13 August 1998, the wholly-owned subsidiaries listed below are relieved from the Corporations Act 2001 requirements for preparation, audit and lodgement of financial reports, and Directors' reports.
It is a condition of the Class Order that the Company and each of the subsidiaries enter into a Deed of Cross Guarantee. The effect of the Deed is that the Company guarantees to each creditor payment in full of any debt in the event of winding up of any of the subsidiaries under certain provisions of the Corporations Act 2001 . If a winding up occurs under other provisions of the Act, the Company will only be liable in the event that after six months any creditor has not been paid in full. The subsidiaries have also given similar guarantees in the event that the Company is wound up.
The parties subject to the Deed are:
The Deed was executed on 19 June 2015. Lifestyle Developments 2 Pty Ltd obtained relief pursuant to the Class Order for the year ended 30 June 2016 (and prior year). Lifestyle Investments 2 Pty Ltd is ineligible for relief pursuant to the Class Order for the year ended 30 June 2016 (and prior year) as it was a small proprietary company.
A consolidated statement of comprehensive income and consolidated statement of financial position, comprising the Company and controlled entities which are a party to the Deed, after eliminating all transactions between parties to the Deed of Cross Guarantee, for the year ended 30 June 2016 (including prior year comparatives) is set out as follows:
Page 73

Notes to the Financial StatementsFor the year ended 30 June 2016
2016 2015$ $
NOTE 32: DEED OF CROSS GUARANTEE (continued)
(b) Summary of movements in consolidated retained earnings of the closed group
Balance 1 July 8,879,500 (2,119,926) Dividends paid (2,594,859) - Net profit 11,009,704 10,999,426
17,294,345 8,879,500
(c) Consolidated Statement of Financial Position of the closed group
ASSETSCurrent assetsCash and cash equivalents 2,886,063 5,743,116 Trade and other receivables 1,781 563,625 Inventories 34,982,475 15,364,768 Other financial assets - 3,000,000 Other current assets 611,225 366,353 Total current assets 38,481,544 25,037,862
Non-current assetsInventories 15,085,060 13,626,244 Property, plant and equipment 1,481,389 686,175 Other financial assets 8,893,334 8,893,334 Investment properties 84,567,276 58,127,313 Total non-current assets 110,027,059 81,333,066
TOTAL ASSETS 148,508,603 106,370,928
LIABILITIESCurrent liabilitiesBank overdraft 2,558,487 - Trade and other payables 6,979,478 15,970,473 Current tax payable 360,801 1,807,369 Provisions 251,792 148,865 Total current liabilities 10,150,558 17,926,707
Non-current liabilitiesTrade and other payables 155,300 155,300 Interest-bearing loans and borrowings 46,000,000 9,546,219 Provisions 311,073 274,921 Deferred tax liabilities 9,213,767 5,067,090 Total non-current liabilities 55,680,140 15,043,530
TOTAL LIABILITIES 65,830,698 32,970,237
NET ASSETS 82,677,905 73,400,691
EQUITY
Contributed equity 63,822,710 63,027,710 Reserves 1,561,850 1,493,481 Retained earnings 17,293,345 8,879,500 TOTAL EQUITY 82,677,905 73,400,691
Page 74

Directors' Declaration
(a) Comply with Accounting Standards and the Corporations Regulations 2001 , and other mandatory professionalreporting requirements;
(b) As stated in Note 1(a), the consolidated financial statements also comply with International Financial ReportingStandards; and
(c) Give a true and fair view of the financial position of the consolidated entity as at 30 June 2016 and itsperformance for the year ended on that date.
Tim Poole James Kelly Chairman Managing Director
Melbourne, 18 August 2016
The directors declare that the financial statements and notes set out on pages 43 to 74 are in accordance with theCorporations Act 2001 :
In the directors' opinion there are reasonable grounds to believe that Lifestyle Communities Limited will be able to payits debts as and when they become due and payable.
This declaration has been made after receiving the declarations required to be made by the chief executive officer andthe managing director to the directors in accordance with section 295A of the Corporations Act 2001 for the financialyear ending 30 June 2016.
This declaration is made in accordance with a resolution of the Directors.
At the date of this declaration, there are reasonable grounds to believe that the members of the closed group identifiedin Note 32 will be able to meet any obligations or liabilities to which they are, or may become, subject by virtue of thedeed of cross guarantee described in Note 32.
Page 75

An independent Victorian Partnership ABN 27 975 255 196 Pitcher Partners is an association of independent firms Level 19, 15 William Street, Melbourne VIC 3000 Melbourne | Sydney | Perth | Adelaide | Brisbane| NewcastleLiability limited by a scheme approved under Professional Standards Legislation An independent member of Baker Tilly International
Page 76
LIFESTYLE COMMUNITIES LIMITED
AND CONTROLLED ENTITIES
ABN 11 078 675 153
INDEPENDENT AUDITOR'S REPORT TO THE MEMBERS OF
LIFESTYLE COMMUNITIES LIMITED
Report on the Financial Report
We have audited the accompanying financial report of Lifestyle Communities Limited and controlled entities, which comprises the consolidated statement of financial position as at 30 June 2016, the consolidated statement of comprehensive income, consolidated statement of changes in equity and consolidated statement of cash flows for the year then ended, notes comprising a summary of significant accounting policies and other explanatory information, and the directors’ declaration of the consolidated entity comprising the company and the entities it controlled at the year's end or from time to time during the financial year.
Directors’ Responsibility for the Financial Report
The directors of the company are responsible for the preparation of the financial report that gives a true and fair view in accordance with Australian Accounting Standards and the Corporations Act 2001 and for such internal control as the directors determine is necessary to enable the preparation of the financial report that gives a true and fair view and is free from material misstatement, whether due to fraud or error. In Note 1, the directors also state, in accordance with Accounting Standard AASB 101 Presentation of Financial Statements, that the financial statements comply with International Financial Reporting Standards.
Auditor's Responsibility
Our responsibility is to express an opinion on the financial report based on our audit. We conducted our audit in accordance with Australian Auditing Standards. Those standards require that we comply with relevant ethical requirements relating to audit engagements and plan and perform the audit to obtain reasonable assurance about whether the financial report is free from material misstatement.
An audit involves performing procedures to obtain audit evidence about the amounts and disclosures in the financial report. The procedures selected depend on the auditor's judgement, including the assessment of the risks of material misstatement of the financial report, whether due to fraud or error. In making those risk assessments, the auditor considers internal control relevant to the company’s preparation of the financial report that gives a true and fair view in order to design audit procedures that are appropriate in the circumstances, but not for the purpose of expressing an opinion on the effectiveness of the company's internal control. An audit also includes evaluating the appropriateness of accounting policies used and the reasonableness of accounting estimates made by the directors, as well as evaluating the overall presentation of the financial report.
We believe that the audit evidence we have obtained is sufficient and appropriate to provide a basis for our audit opinion.

LIFESTYLE COMMUNITIES LIMITED
AND CONTROLLED ENTITIES ABN 11 078 675 153
INDEPENDENT AUDITOR'S REPORT TO THE MEMBERS OF
LIFESTYLE COMMUNITIES LIMITED
An independent Victorian Partnership ABN 27 975 255 196 Pitcher Partners is an association of independent firms Level 19, 15 William Street, Melbourne VIC 3000 Melbourne | Sydney | Perth | Adelaide | Brisbane| NewcastleLiability limited by a scheme approved under Professional Standards Legislation An independent member of Baker Tilly International
Page 77
Independence
In conducting our audit, we have complied with the independence requirements of the Corporations Act 2001.
Opinion
In our opinion:
(a) the financial report of Lifestyle Communities Limited and controlled entities is in accordance with the Corporations Act 2001, including:
(i) giving a true and fair view of the consolidated entity's financial position as at 30 June 2016 and of its performance for the year ended on that date; and
(ii) complying with Australian Accounting Standards and the Corporations Regulations 2001; and
(b) the consolidated financial report also complies with International Financial Reporting Standards as disclosed in Note 1.
Report on the Remuneration Report
We have audited the Remuneration Report included in pages 19 to 30 of the directors' report for the year ended 30 June 2016. The directors of the company are responsible for the preparation and presentation of the Remuneration Report in accordance with section 300A of the Corporations Act 2001. Our responsibility is to express an opinion on the Remuneration Report, based on our audit conducted in accordance with Australian Auditing Standards.
Opinion
In our opinion, the Remuneration Report of Lifestyle Communities Limited and controlled entities for the year ended 30 June 2016 complies with section 300A of the Corporations Act 2001.
P A JOSE PITCHER PARTNERS Partner Melbourne
18 August 2016

Page 78
ASX additional information Additional information required by the Australian Stock Exchange Limited and not shown elsewhere in
this report is as follows. The information is current as at 17 August 2016.
(a) Distribution of equity securities (i) Ordinary share capital
104,211,800 fully paid ordinary shares are held by 1,674 individual shareholders
(ii) Convertible repurchase‐able employee shares (CRES)
453,331 CRES shares are held by five individual shareholders
(b) Substantial shareholders
Fully paid
ordinary shareholders
Number
Percentage
Current at (last notification date)
James Kelly 13,045,566 12.52% 17 August 2016
Cooper Investors Pty Ltd 9,459,205 9.08% 5 May 2015
Bruce Carter 7,079,433 6.79% 17 August 2016
Perlov family 6,686,637 6.42% 17 August 2016
Commonwealth Bank of Australia 6,092,157 5.85% 8 May 2015
Westpac Banking Corporation 5,750,938 5.52% 9 February 2016
Australian Foundation Investment Company Limited
5,442,211 5.22% 27 April 2016
National Australia Bank 5,390,550 5.17% 17 September 2015
58,946,697 56.56%
Voting rights All ordinary shares carry one vote per share without restriction.
All CRES shares carry one vote per share on the following specific matters:
‐ On a proposal to reduce the share capital of the Company that effects rights attached to CRES, and
‐ During the winding up of the Company.

Page 79
(c) Twenty largest holders of quoted equity securities
Rank Name Units % of
Units
1. MASONKELLY PTY LTD 10,116,265 9.71
2. J P MORGAN NOMINEES AUSTRALIA LIMITED 9,188,043 8.82
3. NATIONAL NOMINEES LIMITED 7,828,465 7.51
4. DAKEN INVESTMENTS PTY LTD 6,649,539 6.38
5. HSBC CUSTODY NOMINEES (AUSTRALIA) LIMITED 5,943,042 5.70
6. B S CARTER INVESTMENTS PTY LTD <B S CARTER FAMILY A/C>
5,492,910 5.27
7. AUSTRALIAN FOUNDATION INVESTMENT COMPANY LIMITED
5,470,436 5.25
8. CITICORP NOMINEES PTY LIMITED 5,134,394 4.93
9. BNP PARIBAS NOMS PTY LTD <DRP> 4,755,941 4.56
10. EQUITAS NOMINEES PTY LIMITED <PB-600687 A/C>
4,000,000 3.84
11. MIRRABOOKA INVESTMENTS LIMITED 3,615,728 3.47
12. PJ COOPER INVESTMENTS PTY LTD <COOPER INVESTMENT A/C>
2,857,142 2.74
13. AMCIL LIMITED 2,621,024 2.52
14. SANDHURST TRUSTEES LTD <ENDEAVOR ASSET MGMT MDA>
2,219,573 2.13
15. KELLY SUPERANNUATION FUND PTY LTD 2,116,801 2.03
16. ARMADA INVESTMENTS PTY LTD 1,908,229 1.83
17. BS CARTER SUPERANNUATION PL <CARTER SUPERFUND PENSION A/C>
1,386,523 1.33
18. GMH SERVICES PTY LTD <GMH FAMILY A/C> 1,165,000 1.12
19. HSBC CUSTODY NOMINEES (AUSTRALIA) LIMITED <NT-COMNWLTH SUPER CORP A/C>
1,067,072 1.02
20. ABN AMRO CLEARING SYDNEY NOMINEES PTY LTD <CUSTODIAN A/C>
1,023,602 0.98
Totals: Top 20 holders of ORDINARY FULLY PAID SHARES 84,559,729 81.14
(d) The number of shareholders by range of units and unmarketable parcel holders
Range of Units Snapshot Composition : ORD
Range Total holders Units % of Issued Capital
1 - 1,000 608 242,986 0.23
1,001 - 5,000 610 1,637,548 1.57
5,001 - 10,000 188 1,460,210 1.40
10,001 - 100,000 217 5,909,671 5.67
100,001 - 1,000,000 31 10,401,656 9.98
1,000,001 - 100,000,000 20 84,559,729 81.14
Rounding 0.01
Total 1,674 104,211,800 100.00
Unmarketable Parcels Minimum
Parcel Size Holders Units
Minimum $ 500.00 parcel at $3.40 per unit
148 215 8,165

Page 80
Corporate information
Lifestyle Communities Limited ABN 11 078 675 153
Registered office
Level 2, 25 Ross Street
South Melbourne Vic 3205
Australia
Directors
Tim Poole – Non‐executive Chair
James Kelly – Managing Director
Bruce Carter – Non‐executive Director
Jim Craig – Non‐executive Director
Philippa Kelly – Non‐executive Director
Company secretary Geoff Hollis
Principal place of business
Level 2, 25 Ross Street
South Melbourne VIC 3205
Australia
Share registry
Computershare Investor Services Pty Limited
Yarra Falls 452 Johnston Street,
Abbotsford VIC 3067
Telephone 61 3 9415 5000
Fax 61 3 9473 2500.
Investor queries (within Australia) 1300 850 505
Lawyers
Thomson Geer
Level 39, 525 Collins Street
Melbourne VIC 3000
Australia
Bankers
Westpac Banking Corporation Limited
Level 7, 150 Collins Street
Melbourne VIC 3000
Australia
Auditors
Pitcher Partners
Accountants Auditors & Advisors
Level 19, 15 William Street
Melbourne VIC 3000
Australia