Embed Size (px)
Citation preview

Energizedtransformation
annual report
2010-11

ContentsCOMPANY OVERVIEW Corporate Information 02
Values | Purpose | Goal 03
Corporate Identity 04
Global Opportunities 08
Financial Highlights 10
Operational Highlights 14
BusINEss REVIEWDivisional Analysis 16
Awards and Accolades 22
Our Fleet 24
Health safety security Environment 26
Board of Directors 28
Chairman’s statement 30
1
2
34
BOARD AND MANAGEMENT REPORTsManagement Discussion and Analysis 32
Directors’ Report 42
Report on Corporate Governance 47
FINANCIAL sTATEMENTsstandalone Financials 61
Consolidated Financials 99

On the global energy landscape, Mercator is an emerging presence to reckon with. As part of our diversification initiatives, we are making sustained efforts to be a significant energy player. The objective is to de-risk ourselves from the cyclical shipping business.
With investments in oil & gas and coal, the organization is part of the vast and evolving dry (coal) and wet (oil) energy orbit. We are reinforcing our presence across the energy value chain from mining to delivery. The energy domain remains attractive as demand is expected to rise significantly with the rapid socio-economic development of emerging economies.
We are navigating a clear and decisive line to deliver the best energy solutions, offering outstanding value and services to our customers globally. We call this motivating journey energized transformation.

202
AUDIT COMMITTEE
Manohar Bidaye Chairman
M. G. Ramkrishna Member
K. R. BharatMember
Atul J. AgarwalMember
SHAREHOLDERS GRIEVANCE COMMITTEE
Manohar Bidaye Chairman
K. R. BharatMember
Atul J. AgarwalMember
COMPANY SECRETARYSuchita Shirambekar
AUDITORSM/s Contractor, Nayak & Kishnadwala
BANKERSState Bank of IndiaICICI BankAxis BankHDFC Bank
DEBENTURE AND SECURITY TRUSTEESAxis Trustee Services Limited
BOARD OF DIRECTORS
H. K. MittalExecutive Chairman
Atul J. AgarwalManaging Director
Manohar Bidaye
Anil Khanna
M. G. Ramkrishna
K. R. Bharat
Kapil Garg
M. M. Agrawal (w.e.f. August 12, 2011)
REGISTERED OFFICE3rd Floor, Mittal Tower, B-Wing.Nariman Point, Mumbai – 400021Tel : + 91 – 22 – 66373333/40373333Fax : + 91 – 22 – 66373344Website : www.mercator.inE-mail : [email protected] [email protected]
REGISTRAR & TRANSFER AGENTSLink Intime India Pvt. Ltd. C-13, Pannalal Silk Mills CompoundLBS Road. Bhandup West, Mumbai – 400078.Tel : 022 – 25963838Fax : 022 - 25946969E-mail : [email protected]
CorporateInformation
2

03
Core Values
Core Purpose
Goal
‘Honouring Commitments’ towards all the stakeholders
Consistent and constant growth
Ensuring that every employee feels pride in being called a ‘Mercatorian’
Innovation...we believe in doing things differently
To become a dominant global player in the Energy Value Chain of Coal, Oil and Marine Infrastructure
Creating the best solutions and offering outstanding value and service to our customers
3

Incorporated in 1983 as a shipping company, Mercator navigated uncharted waters to explore opportunities beyond the familiar world of shipping.
The result is that, today we are not only India’s second largest private sector player (in terms of tonnage) in shipping, but have successfully diversified into coal, oil & gas and dredging.
4

Corporate IdentityCompany Overview
Business verticals
We are present across tankers (or wet bulk carriers) and dry bulk carriers.
8 tankers comprising VLCC, Aframaxes & M.R Tankers
of aggregate DWT of 760,189 MT (As on March
31, 2011)
18 dry bulk carriers comprising VLOC, Panamaxes,
Post Panamaxes and Kamsarmaxes of aggregate DWT
of 1,618,850 MT (As on March 31, 2011)
We are present in oil & gas with:
1 Mobile Offshore Production Unit (MOPU)
1 Floating Storage & Offloading Unit (FSO)
2 oil blocks in India, awarded under NELP VII at
Cambay Basin in Western Gujarat, India
Shipping Oil & Gas
Coal Mining, Procurement & Logistics Dredging
3 coal mines and 1 under acquisition in
Indonesia (As on March 31, 2011)
1 coal mine in MozambiqueWe also procure coal from third parties to augment requirements of our customers. We offer end to end logistics solutions to the customers, encompassing loading at ports to the place of usage.
We serve the infrastructure needs of the Indian coast line.
4 TSHD Dredgers with a total dredging capacity of
DWT of 30,445 MT (As on March 31, 2011)
5
annual report
2010-11
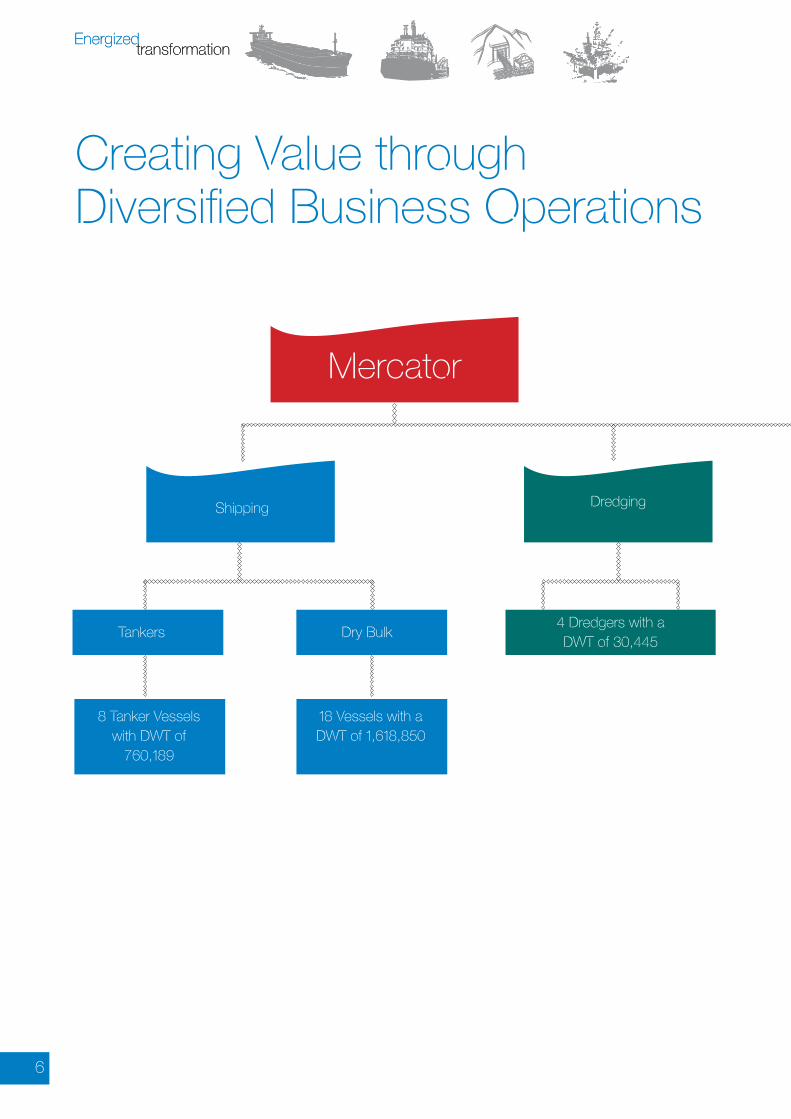
Creating Value through Diversified Business Operations
Mercator
Shipping
Tankers
8 Tanker Vessels with DWT of
760,189
18 Vessels with a DWT of 1,618,850
Dry Bulk
Dredging
4 Dredgers with a DWT of 30,445
6

annual report
2010-11
Onshore (2 Oil Blocks)
Offshore(MOPU & FSO)
Oil & Gas Coal
Mining
Equipment
Chartered Barges Trucks /
Equipment
Chartered Barges
Complete Solutions
Procurement
3 mines in Indonesia & 1 mine
in Mozambique
Lighterage
Logistics
Company OverviewCorporate Identity
7
annual report
2010-11

Focused on Global OpportunitiesWe acknowledge the reality that in
order to deliver consistent economic
value, we need to leverage emerging
global opportunities. The strength of
our business model is the result of our
accumulated expertise in offering end
to end customised specialised services
and problem-solving abilities based on
them.
Coal Mining, Procurement & Logistics
Mercator strategically acquired four coal mines (including 1 under acquisition) in Indonesia and one in Mozambique. It is seeking opportunities to acquire a few more coal mines in Indonesia in the coming years. Rising coal demand has propelled growth in the Company’s strategic endeavours of coal mining. With backward integration, our coal value chain now stands as this
Coal Mining
Coal Procurement
Dry Bulk-Shipping
Coal logistics
8
annual report
2010-11
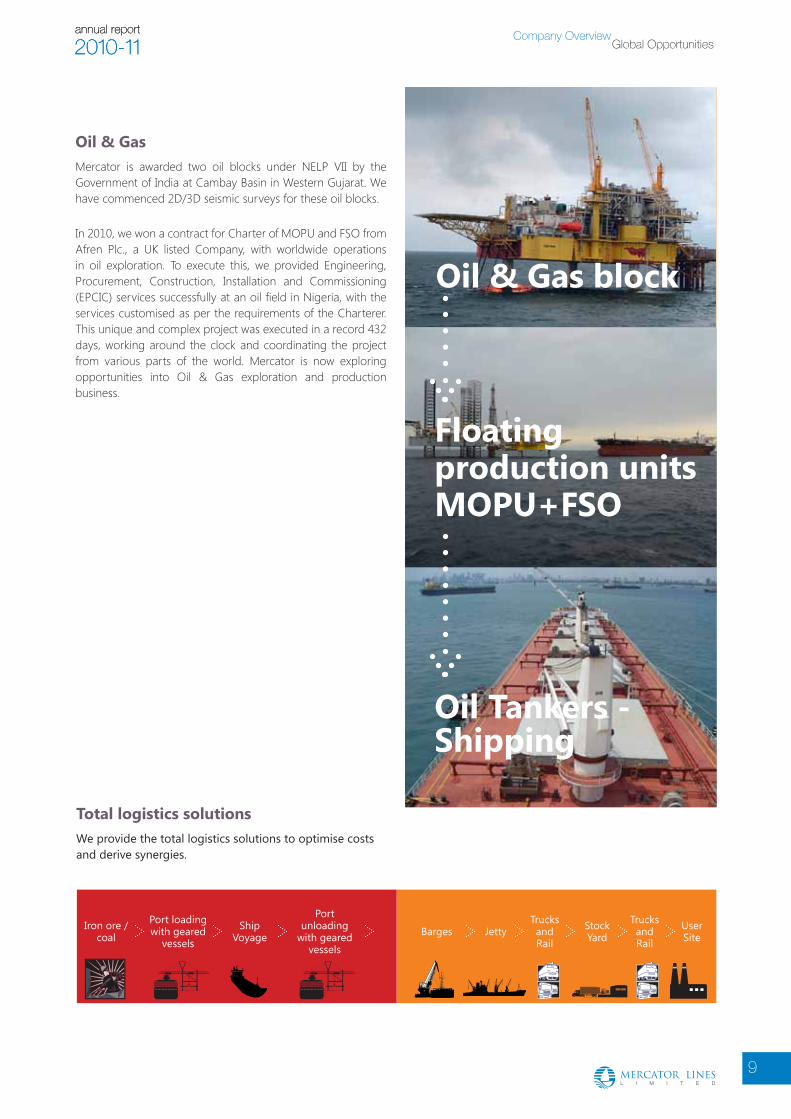
Oil & Gas Mercator is awarded two oil blocks under NELP VII by the Government of India at Cambay Basin in Western Gujarat. We have commenced 2D/3D seismic surveys for these oil blocks.
In 2010, we won a contract for Charter of MOPU and FSO from Afren Plc., a UK listed Company, with worldwide operations in oil exploration. To execute this, we provided Engineering, Procurement, Construction, Installation and Commissioning (EPCIC) services successfully at an oil field in Nigeria, with the services customised as per the requirements of the Charterer. This unique and complex project was executed in a record 432 days, working around the clock and coordinating the project from various parts of the world. Mercator is now exploring opportunities into Oil & Gas exploration and production business.
Oil Tankers -Shipping
Oil & Gas block
Floating production unitsMOPU+FSO
Total logistics solutionsWe provide the total logistics solutions to optimise costs and derive synergies.
Iron ore /coal
Port loading with geared
vessels
Ship Voyage
Port unloading
with geared vessels
Barges JettyTrucks and Rail
Trucks and Rail
User Site
Stock Yard
Global OpportunitiesCompany Overview
9
annual report
2010-11

Financial Highlights
(` in Lakhs)
2006
-07
1,13
,868
.38
1,55
,618
.74 2,
21,0
50.7
3
1,80
,872
.69
2,82
,888
.46
2007
-08
2008
-09
2009
-10
2010
-11
OPERATING INCOME20
06-0
713
,834
.46
40,9
35.0
8
(` in Lakhs)
47,5
21.5
0
10,9
25.3
3
9,93
8.83
2007
-08
2008
-09
2009
-10
2010
-11
PROFIT BEFORE TAX (PBT)(` in Lakhs)
2006
-07
1,14
,269
.03
1,58
,898
.49 2,17
,381
.87
1,81
,972
.34
2,81
,164
.05
2007
-08
2008
-09
2009
-10
2010
-11
TOTAL INCOME
10

annual report
2010-11
2006
-07
13,4
93.4
3
40,0
33.1
9
(` in Lakhs)
46,7
03.4
8
10,4
20.6
9
8,58
5.73
2007
-08
2008
-09
2009
-10
2010
-11
PROFIT AFTER TAX (PAT)
2006
-07
23,8
73.8
2
56,7
83.1
1
(` in Lakhs)
73,5
74.0
4
44,5
11.3
4
39,2
52.4
0
2007
-08
2008
-09
2009
-10
2010
-11
CASH PROFIT20
06-0
732
,291
.69
72,1
49.2
8(` in Lakhs)
91,0
24.3
5
65,5
93.1
3
62,1
28.8
1
2007
-08
2008
-09
2009
-10
2010
-11
EBITDA
11
annual report
2010-11 Financial HighlightsCompany Overview

2006
-07
2.18
1.01
1.57
1.45
1.44
2007
-08
2008
-09
2009
-10
2010
-11
DEBT EQUITY RATIO(` in Lakhs)
35.2
4
272.
20
6,24
5.78
281,
164.
05
1984
1993
2003
2011
TURNOVER(` in Lakhs)
64.9
3
376.
23
7,57
4.05
537,
060.
24
1984
1993
2003
2011
FIXED ASSETS (GROSS BLOCk)
Financial Highlights
12

(dWT in MT)
Vessels Owned Vessels Chartered Vessels
19,3
1,37
4
2,80
,161
2009-10
21,1
1,14
8
2,98
,336
2010-11
FLEET TONNAGE CAPACITY
SEGMENTAL REVENUE BREAk-UP
Shipping
Dredging
Coal
Offshore
43
49
3
5
63
24
5
9
FY2010-11
FY2009-10
(%)
13
annual report
2010-11 Financial HighlightsCompany Overview

Operational Highlights
Bagged a nine-year contract with Afren, a U.K. listed oil company, for providing FPU. Executed this Floating Production Unit (FPU) project, an offshore project in Nigeria,
in a record 432 days. The MOPU has a
processing capacity of 50,000 barrels of oil per day and the FSO
has a storage capacity of 1.2 mn barrelsof oil.
14

annual report
2010-11
Commenced 2/3D seismic surveys at the oil block awarded under NELP VII in Gujarat.
Achieved the turnover of about 5 mn tonnes from the coal business.
Bagged numerous projects in dredging.
Added 1 Aframax, 2 Panamax & 1 Post Panamax, 1 MOPU and 1 FSO during the year.
Operational HighlightsCompany Overview
15
annual report
2010-11

Divisional AnalysisShipping
Tankers
We transport wet bulk cargo (usually crude oil and petroleum products) by ship, both between domestic and international ports.
Key features of the division comprise the following:
Entered into crude oil transportation in 2003.
First Indian shipping player to comply with IMO Regulations to phase out the entire fleet of single hull vessels.
The tanker fleet consists of medium and large-sized double hull vessels of an average age of 12 years.
Undertake both spot contracts (single-voyage) and period contracts (fixed-term voyages).
The Tanker Fleet
Very Large Crude CarrierAframaxesProduct TankersChemical Tanker
16

annual report
2010-11
Dry Bulk Carriers
Our dry bulk shipping business is mainly handled through the Singapore listed subsidiary, Mercator Lines (Singapore) Limited.
Key features of the division are:
Commenced coal and iron ore transportation in 2005.
Services large thermal plants and steel conglomerates in India and China.
Key focus area is the triangular route of Indonesia-India-China, wherein coal is imported into India from Indonesia and Iron Ore is exported to China from India.
Fleet of 18 ships of which 15 are owned vessels and 3 are in-chartered geared/gearless Panamaxes; Kamsarmaxes and Post Panamaxes with younger age of 8 years. The largest of the fleet is the VLOC vessel, which is deployed on 14 years contract with one of the iron ore major.
Divisional AnalysisBusiness Review
The dry Bulk Fleet
Very Large Ore CarrierPanamaxesPost PanamaxesKamsarmaxes
17
annual report
2010-11

Divisional Analysis
Dredging
The rapid expansion in port infrastructure and marine sector has opened up multiple opportunities in the field of dredging. We entered the dredging business in 2007.
Key features of the division are the following:
Acquired four technologically advanced Trailer Suction Hopper Dredgers of an average age of 4 years.
Execution of capital and maintenance dredging projects on both long-term and short-term basis.
Booked 100% capacity utilization.
Some of our key projects include:
Capital Dredging at Paradip Port
Capital Dredging at Jaigad Port
Maintenance Dredging at Paradip Port
Capital Dredging at Chennai Port
Capital Dredging of ICTT Terminal, Cochin Port
18

annual report
2010-11
Oil & Gas
The business includes Oil & Gas Blocks, Floating Storage & Offloading (FSO) and Mobile Offshore Production Units (MOPU).
Key features of the division are:
Awarded two Oil & Gas bearing blocks in Cambay Basin, Gujarat, India in December 2008, under the Seventh New Exploration Licensing Policy (NELP-VII).
Bagged a long term contract from a UK based Company having worldwide operations in Nigeria to charter a Floating Production Unit (FPU) in 2010. The FPU, a combination of a MOPU and a FSO, is designed to process 50,000 barrels of oil per day. These are upgradeable to customised requirements
of the charterers, who wish to use them as a central process unit at other oil fields in the same region.
Mercator is the only Indian company to have Engineered, Procured, Constructed, Installed and Commissioned such MOPU & FSO.
Divisional AnalysisBusiness Review
19
annual report
2010-11

Divisional Analysis
Coal
The coal business includes Coal Mining, Coal Procurement and Logistics.
Key features of the division are:
Entered into coal transportation & logistics early in 1998, wherein we have successfully provided end-to-end solutions to many thermal power stations in India.
Entered the coal mining business in 2007.
Three coal mines and one under acquisition in Indonesia, as on March 31, 2011.
One coal mine in Mozambique, Africa.
We are one of the largest exporters of coal from Indonesia.
We procure different qualities and varieties of coal, as per the requirements of our end users, from Indonesia for our customers.
A strong customer base.
20

annual report
2010-11
We are well poised to take advantage of the growing global and domestic coal demand. Our integrated logistics solutions provide the competitive edge and help us attract customers and retain the existing ones.
Integrated cycle of loading at ports to coal usage
Coal Mining &Procuring
Load PortLogistic
Mother Vessel
Dry Bulk Shipping
Customer Plant
Stock Yard
Discharge Port Logistics
Divisional AnalysisBusiness Review
21
annual report
2010-11

Awards and Accolades
Mr. H. K. Mittal, Chairman, has been honoured with a number of awards
‘Entrepreneur of the Year 2005-06’ award by The Economic Times for corporate excellence. He received the award from the Prime Minister of India.
‘Entrepreneur of the Year 2005 (Service Sector)’ award by Ernst & Young.
Ranked among the ‘Top 100 most influential people in shipping globally’ by Trade Winds.
Mercator has been honoured with multiple awards
Received the ‘Star Company of the Year 2004’ award across all sectors by Business Standard.
Awarded the ‘Star Company of the Year 2005’ award in Small and Medium Sector (SME) by Business Standard.
Rated as the ‘Fastest Growing Small Company of India’ across all the sectors by Business Today in 2005.
Rated in Top 10 companies for its Total Shareholders returns (TSR) for over a decade.
22

Awards and AccoladesBusiness Review
Mercator Lines (Singapore) has been honoured with a number of awards
Recognised as ‘Approved International Shipping Enterprise’.
Best Annual Report in 2009 (Silver) and 2010 (Bronze) amongst Singapore listed companies at the Singapore Corporate Awards.
Ranked 23rd in ‘Governance and Transparency Index (GTI)’ amongst the public listed companies by Business Times and the Corporate Governance and Financial Reporting Centre at NUS.
Ranks as Singapore International 100 Company 2011.
Best Investor Relations 2011 (Silver) at the Singapore Corporate Awards.
Ranked 18th in overall performance amongst listed shipping companies in the world by Marine Money in 2011.
Global Entrepreneur of the Year 2010 Award at the Emerging India Awards 2010.
MCS Ltd., another subsidiary, is awarded Global Trader Awards 2011, Singapore.
Recognized as esteemed Singapore 1000 Company in 2009 as well as in 2011
Mr. K. S. Raheja receiving the Global Trader Award, 2011 on behalf of MCS Ltd.
23
annual report
2010-11

TankersSr. No. Name of the vessel Vessel type DWT/ capacity Ownership
1. M.T. Kamakshi Prem VLCC 299,235 Owned
2. M.T. Prem Pride Aframax 109,610 Owned
3. M.T. Prem Divya Aframax 109,227 Owned
4. M.T. Prem Mala MR Tanker 47,044 Owned
5. M.T. Harsha Prem MR Tanker 42,235 Owned
6. M.T. Vedika Prem MR Tanker 42,235 Owned
7. M.T. Omvati Prem Aframax 90,607 Owned
8. Royal Natura Chemical Tanker 19,996 Chartered In
DredgersSr. No. Name of the vessel Vessel type DWT/ capacity Ownership
1. Bhagvati Prem TSHD 8,556 Owned
2. Darshani Prem TSHD 8,538 Owned
3. Tridevi Prem TSHD 7,059 Owned
4. Omkara Prem TSHD 6,292 Owned
Oil & GasSr. No. Name of the vessel Vessel type Capacity
1. Virini Prem FSO 1.2 mn storage
2. Veer Prem MOPU 50,000 BOPD Processing
Our Fleet
24

Our FleetBusiness Review
Dry Bulk CarriersSr. No. Name of the vessel Vessel type DWT/ capacity Ownership
1. M.V. Prem Putli VLOC 279,022 Owned
2. M.V. Prem Poorva Panamax 69,286 Owned
3. M.V. Gaurav Prem Panamax 73,901 Owned
4. M.V. Prem Aparna Panamax 73,461 Owned
5. M.V. Garv Prem Panamax 74,444 Owned
6. M.V. Garima Prem Panamax 74,456 Owned
7. M.V. Kesari Prem Panamax 69,186 Owned
8. M.V. Prem Varsha Kamsarmax 82,379 Owned
9. M.V. Prem Vidya Kamsarmax 82,273 Owned
10. M.V. Prem Veena Kamsarmax 82,459 Owned
11. M.V. Kanak Prem Panamax 69,221 Owned
12. M.V. Kalpana Prem Panamax 73,652 Owned
13. M.V. Gauri Prem Panamax 74,483 Owned
14. M.V. Aarti Prem Panamax 69,087 Owned
15. M.V. Chitra Prem Post Panamax 93,200 Owned
16. M.V. Maria Laura Prem Post Panamax 91,800 Chartered In
17. M.V. Chaitali Prem Post Panamax 93,270 Chartered In
18. M.V. Chanchal Prem Post Panamax 93,270 Chartered In
25
annual report
2010-11

Health Safety Security Environment (HSSE)
At Mercator, we are committed to safeguard the health, safety and security of
our employees, while protecting the environment. The overriding objective is to
ensure our business sustainability. The key features of our HSSE initiative comprise
the following:
Provide visible management leadership and support for excellent safety performance.
Possess an HSSE management system, which reflects best industry practice; is adequately resourced and followed across the organization.
Ensure a safe and secured working environment, while at the same time encouraging eco-sensitivity.
Promote a culture such that our employees and associates feel empowered to voice their HSSE concerns, if any and make positive contribution to the HSSE performance.
Work seamlessly with our customers, contract partners and business associates to deliver the HSSE expectations and learn continually from each other’s experiences.
Impart education, support, training and supervision to ensure that all employees understand the HSSE expectations from them and the consequences of non-compliance.
Adopt a risk-based approach to the design, construction and operation of our vessels and facilities throughout their life cycle and protect all our assets from damage.
26

HSSEBusiness Review
Develop, maintain and test effective contingency plans, wherever appropriate in conjunction with the authorities, our customers and emergency services providers.
Take account of HSSE concerns of those working on our facilities through involving and consulting with them on regular basis.
Continually measure and improve our HSSE performance so that work related ill health and incidents are reduced.
Continually improve by ensuring that lessons are always learned and learnings implemented.
Comply with this Policy and drive HSSE improvements by setting expectations, objectives as well as reviewing, monitoring and auditing performance.
Fully co-operate with relevant government agencies, regulatory bodies and work with them to improve HSSE practices within our organization.
Regularly review HSSE policy.
27
annual report
2010-11
Board ofDirectors
H. K. MITTALExecutive Chairman
Mr. H. K. Mittal, 61 has completed his Masters from the Indian Institute of Technology (IIT), Roorkee. He then started his proprietorship firm, which was engaged in the production of Sulphuric Acid and Ferric Alum in 1975. He expanded this business both vertically and horizontally and even converted the organization into a limited Company. Apart from the Sulphuric Acid production plant in North India, his other business ventures include a shipbuilding yard in Mumbai and a healthcare unit.
In 1988, Mr. Mittal acquired Mercator Lines Limited. His vision and strong entrepreneurial acumen have been the driving force behind Mercator’s expansions, success and growth. He is also the Chairman of Board of Mercator Lines (Singapore) Ltd. (step-down subsidiary listed on SGX), Mercator Offshore Ltd. (WOS, Singapore), Mercator Oil & Gas Ltd., and Mercator Petroleum Ltd.
ATUL J. AGARwALManaging Director
Mr. Atul J. Agarwal, 53 is a Chartered Accountant, with 28 years of professional experience. He is associated with the organization since its inception. As a Chartered Accountant, Mr. Agarwal specialises in the financial aspects of the business, and is responsible for the financial and strategic planning and execution. He manages the day-to-day operations of the organization. He has also been instrumental in the successful implementation of many of the Company’s projects.
Mr. Agarwal has been accredited with memberships of various committees formed by the Government for shipping reforms. He is on the Board of Directors of Indian National Shipowners’ Association (INSA), Thirumalai Chemicals Ltd., Mercator Petroleum Ltd., and other step down overseas subsidiaries.
MANOHAR BIDAYEIndependent and Non-executive Director
Mr. Manohar Bidaye, 47, is a Master of Commerce (M.Com) from the University of Mumbai, and has a degree in Law (LLB - Gen.). He is also a Senior Member of The Institute of Company Secretaries of India. He has a rich experience in corporate planning, strategy formulation, corporate laws and taxation, finance and other related areas. He has been honoured with the ‘Yashashree 2008’ Award, bestowed by the Maharashtra Times, recognizing his achievements across various industry segments.
Mr. Bidaye is a Promoter and the Chairman of Zicom Electronic Security Systems Limited, where he is involved with the overall Corporate Planning, Strategy Forming and Implementation, Financial Management, Banking, Accounts, Taxation and Legal affairs.
28

annual report
2010-11
ANIL KHANNAIndependent and Non-executive Director
Mr. Anil Khanna, 52, a Fellow Chartered Accountant, is a practicing professional with over 10 years of experience in the field of consultancy. He specialises in business management, joint ventures and auditing. Mr Khanna has been on the Board of Directors of several Indian and multinational companies.
M. G. RAMKRISHNAIndependent and Non-executive Director
M. G. Ramkrishna, 67, is an M. A., L. L. B. and CAIIB, and a veteran banker. He has over 31 years of experience in various segments of banking, such as, commercial, investment and international. He has worked as Group Head of a reputed industrial group, managing the treasury functions. Presently, he is engaged as an advisor/consultant on financial matters. He is also on the Board of several companies as an Independant Director.
K. R. BHARATIndependent and Non-executive Director
Mr. K. R. Bharat, 49, is an MBA from the Indian Institute of Management. He has been associated with the capital markets for more than 27 years in various segments, such as Merchant Banking, Equities and Investment Banking, Risk Management and Research, among others.
He is on the Boards of Advent Advisory Services Pvt. Ltd., BSR Advent Advisors Ltd., Maruti Koatsu Cylinders Ltd., and Vaitarna Marine Infrastructure Pvt. Ltd. He has worked as the Managing director at Credit Suisse First Boston Securities (CSFB) India and Peregrine Securities (India). He has also worked in Citi Bank for more than a decade. Mr Bharat also has been a member of the Market Advisory Committee of the Bombay Stock Exchange.
KAPIL GARGNon-executive Director
Mr. Kapil Garg, 45, is a graduate in Chemical Engineering from the Indian Institute of Technology, Roorkee. Mr. Garg has over twenty years of intensive management experience in both upstream and downstream businesses with companies, such as ONGC, Enron Oil and Gas India Ltd. (EOGIL), BG-Group, located in India and in other nations of the world. He is also on the Board of Mercator Petroleum Ltd., Oilmax Energy Pvt. Ltd., Optimum Oil & Gas Pvt. Ltd. and Ivorene Oil Services Nigeria Ltd.
M. M. AGRAwALIndependent and Non-executive Director
Mr. M. M. Agrawal, 61, is a Bachelor of Engineering from Nagpur University. He has around thirty five years of experience in the Banking and Finance industry, having worked with State Bank of Bikaner & Jaipur and Axis Bank Ltd (as dy. Managing director). He is on Board of many companies such as Axis Private Equity Ltd., Essar Power Ltd., Jaguar Overseas Ltd., Bombay Rayon Fashion Ltd.
Board of DirectorsBusiness Review
29
annual report
2010-11

Chairman’sStatement
Dear Shareholders,
Even in a world of persistent economic uncertainty, most
people will agree that global energy demand will continue to
escalate in future. The reason is simple: the burgeoning global
population and the sustained efforts of developing economies
to attain the socio-economic standards of the advanced
countries of the world have set into motion a spiralling energy
demand. The result is that although developed economies
have not curtailed their energy demand considerably, fresh
demand at a humongous scale is being generated from the
emerging economies.
Global economic volatilities have impacted the shipping industry considerably. In such a scenario, our diversification initiatives stood us in good stead. Today, a major portion of our revenue pie is derived from the non-shipping business.
H. K. Mittal Executive Chairman
30

Our energized transformation from being a focused shipping player to a diversified player in shipping and energy sector testifies to that fact that Mercator is not guided by conventional ways of thinking and doing things.
Seen against this backdrop, our decision to emerge as an integrated energy player can be interpreted as a pragmatic decision. As a major provider of smart shipping solutions globally, we had forged close relationships with coal mines and oil exploration companies to understand the dynamics of Coal mining and Oil & Gas businesses. The decision to focus more on the energy sector was largely influenced from that experience.
Last year, shipping companies were badly hit by the global economic recession that led to a steep decline in world trade and caused freight rates to fall. The global economy (especially the US and the Eurozone) is still encountering considerable turbulence and recovery is sluggish. Global economic volatilities have impacted the shipping industry considerably. In such a scenario, our diversification initiatives stood us in good stead. Today, a major portion of our revenue pie is derived from the non-shipping business.
Mercator is proud to be the only Indian company to have executed the unique and complex Floating Production Unit (FPU) project. The project is an offshore venture in Nigeria, execution of which involved many countries across the world on a 24/7 basis. Capitalizing on the experience, we now look forward to executing more such projects. during the year, we commenced exploration activities with 2/3D seismic surveys at the oil blocks awarded to us by the government under NELP VII.
during the year, we had turnover of about 5 mn metric tonnes of coal, and won a 5 year contract with the Ceylon Shipping Corporation for coal logistics in Sri Lanka.
We are in the process of finalizing the acquisition of one more coal mine in Kalimantan, Indonesia, taking the total number of coal mines to five in the upcoming year.
The demand for dredging services has been fairly robust during the year, with a number of Indian ports increasingly demanding such services. We have already successfully executed multiple dredging projects, and on the basis of our strong track record, we now possess a healthy order book and a good revenue visibility.
With sound risk management strategies in place and with proven expertise in the dry and wet energy segments, we plan to leverage the available market opportunities to grow profitably in the energy segment.
Our energized transformation from being a focused shipping player to a diversified player in shipping and energy sector testifies to that fact that Mercator is not guided by conventional ways of thinking and doing things. We are not afraid of navigating uncharted waters and we will continue to explore new opportunities to grow our business. Nevertheless, we are guided by market pragmatism and deep insight to deliver exceptional value for all stakeholders.
Warm regards,
H. K. MITTAL
August 12, 2011
Chairman’s StatementBusiness Review
31
annual report
2010-11

32
Management
and AnalysisDiscussion
Mercator is present across multiple verticals: Shipping | Oil and Gas | Coal Mining; Procurement and Logistics | Dredging
The Shipping induSTryThe shipping industry is prone to cyclicality. It is influenced by socio-economic scenarios, natural calamities, government regulations and availability of natural resources globally. The shipping industry can be broadly classified into:
Wet bulk carriers : Also known as oil tankers, they transport crude oil and other petroleum products
dry bulk carriers : They transport iron ore, steel, coal, and other bulk commodities
The global scenarioOver 90% of global trade is conducted by ships. The total world merchant fleet grew 7%, touching 1,276 mn tonnes in 2010. It is further expected that global seaborne trade will reach 11.5 bn tonnes and 16.04 bn tonnes by 2020 and 2031, respectively. The global shipping industry is regulated by the International Maritime Organization (Source: Review of Maritime Transport, UNCTAD).
There are about 50,000 merchant ships trading in multiple cargoes globally, generating over USD 380 bn in freight rates during the year (Source: PwC).
The indian scenario Over the years, bilateral trade between India and other countries has improved significantly, benefiting the Indian shipping industry. The domestic shipping industry currently handles 95% of the country’s international trade volume and almost 70% of the total traded value. The industry’s fleet stood at 10 mn tonnes, about 1% of the global fleet, ranking 16th in global shipping tonnage. It is targeting 43
mn tonnes by 2020. In 2010, petroleum, oil and lubricants comprised 31.2%, while iron ore and coal comprised 17.7% and 12.3%, respectively.
Shipping industry segmentsWet Bulk CarriersA strong link exists between demand of tankers and demand of oil. Crude oil is the single largest commodity in international trade. Tankers basically transport crude oil from ports near production fields to ports near refineries. Global crude oil demand has grown over the last five years, which is mainly driven by developed economies. The share of US in the global crude oil demand is 26.4%, and of Europe is 23.5%. It is expected that by 2030, crude oil will form 34% of the total world energy consumption (Sources: International Energy Agency and FICCI E&Y 2010 report).
With growth in the economy, urbanization, population and disposable incomes, and a change in lifestyle patterns, oil consumption has increased in India over the years. Between 2006 and 2010, the consumption of crude oil in India has grown at a CAGR of 5.3% to reach 160 mn tonne barrels.
Though the shipping market witnessed spikes in 2010, the tanker freight rates remained subdued during the year, on account of sluggish demand for crude oil and refined products combined with large supply of new vessels. The shipping rates remained volatile during the year due to fluctuating demands from countries all over the world, crisis in MENA region (Middle East & North Africa), delays in new deliveries; and supply demand mismatches.
annual report
2010-11
33
Management Discussion and AnalysisBoard and Management Reports
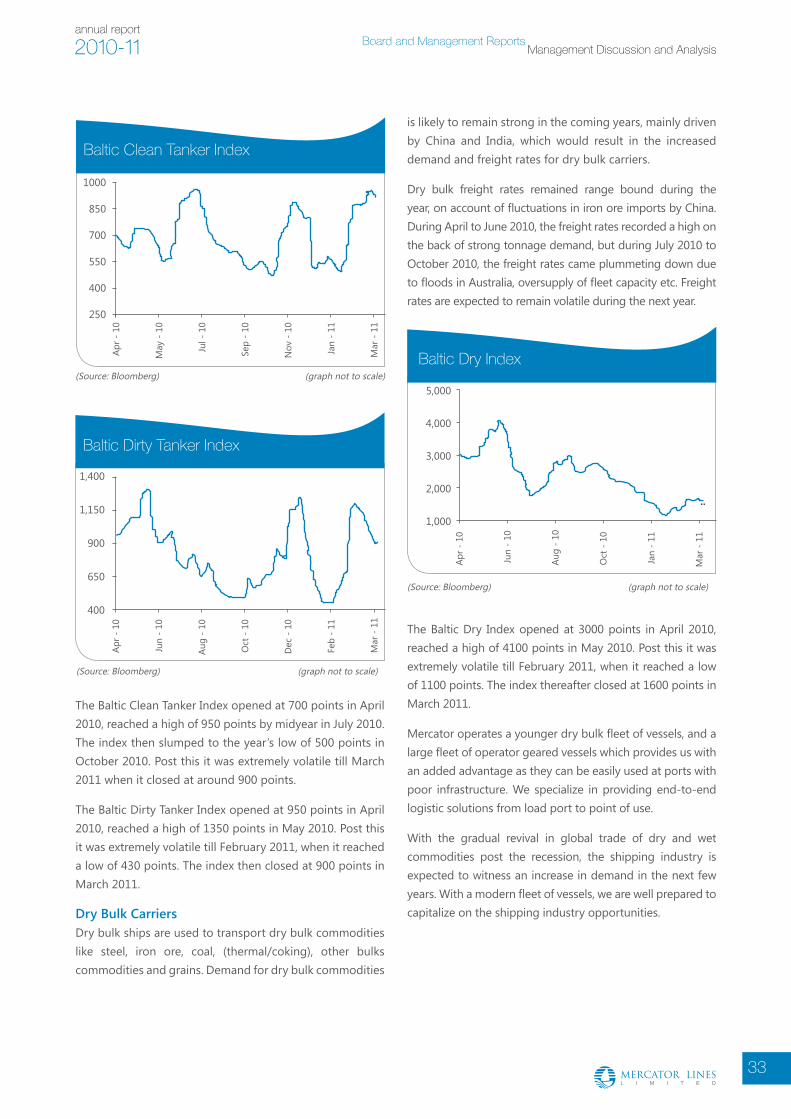
The Baltic Clean Tanker Index opened at 700 points in April 2010, reached a high of 950 points by midyear in July 2010. The index then slumped to the year’s low of 500 points in October 2010. Post this it was extremely volatile till March 2011 when it closed at around 900 points.
The Baltic Dirty Tanker Index opened at 950 points in April 2010, reached a high of 1350 points in May 2010. Post this it was extremely volatile till February 2011, when it reached a low of 430 points. The index then closed at 900 points in March 2011.
Dry Bulk CarriersDry bulk ships are used to transport dry bulk commodities like steel, iron ore, coal, (thermal/coking), other bulks commodities and grains. Demand for dry bulk commodities
The Baltic Dry Index opened at 3000 points in April 2010, reached a high of 4100 points in May 2010. Post this it was extremely volatile till February 2011, when it reached a low of 1100 points. The index thereafter closed at 1600 points in March 2011.
Mercator operates a younger dry bulk fleet of vessels, and a large fleet of operator geared vessels which provides us with an added advantage as they can be easily used at ports with poor infrastructure. We specialize in providing end-to-end logistic solutions from load port to point of use.
With the gradual revival in global trade of dry and wet commodities post the recession, the shipping industry is expected to witness an increase in demand in the next few years. With a modern fleet of vessels, we are well prepared to capitalize on the shipping industry opportunities.
1000
Apr -
10
May
- 1
0
Jul -
10
Sep
- 10
Nov
- 1
0
Jan
- 11
850
700
550
400
250
Mar
- 1
1
Baltic Clean Tanker Index
(Source: Bloomberg) (graph not to scale)
(Source: Bloomberg)
Baltic Dirty Tanker Index
1,400
1,150
900
650
400
Feb
- 11
Mar
- 1
1
Apr -
10
Jun
- 10
Aug
- 10
Oct
- 1
0
Dec
- 1
0
(graph not to scale)
is likely to remain strong in the coming years, mainly driven by China and India, which would result in the increased demand and freight rates for dry bulk carriers.
Dry bulk freight rates remained range bound during the year, on account of fluctuations in iron ore imports by China. During April to June 2010, the freight rates recorded a high on the back of strong tonnage demand, but during July 2010 to October 2010, the freight rates came plummeting down due to floods in Australia, oversupply of fleet capacity etc. Freight rates are expected to remain volatile during the next year.
(Source: Bloomberg)
5,000
4,000
3,000
2,000
1,000
Apr -
10
Jun
- 10
Aug
- 10
Oct
- 1
0
Jan
- 11
Mar
- 1
1
Baltic Dry Index
(graph not to scale)

34
National Exploration and Licensing Policy
(NELP) - Catalysing Indian Economy
The Government of India through its National Exploration and Licensing Policy (NELP) is reforming the E&P sector by liberalizing it and opening the sector for private and foreign investment. The government has allowed 100% foreign direct investment in the sector and has awarded 300 oil and gas blocks under the eighth bidding round of National Exploration and Licensing Policy (NELP) and is expecting at least USD 10 bn in investments.
In India, the oil and gas sector is one of the core industries. India’s import dependence on crude oil and petroleum products is more than 79%, with crude oil contributing about 32% of primary energy consumption in India. Natural gas accounts for about 10% of the total energy consumed in India, which is expected to increase to 20% by 2025. India produces about 1% of the world’s natural gas and has around 0.4% of the world’s natural gas reserves. The consumption of crude oil and natural gas is expected to grow further, driven by India’s overall economic growth. In order to meet the growing demand, the indigenous crude oil production has to be augmented by acceleration of exploration activity in deep offshore, unexplored offshore and onshore areas (Sources: BMI India Oil and Gas Report Q4 2010 and BP statistical review of world energy 2010).
E&P spending trend and crude oil price movement
Source : DnB NOR Markets, FactSet
600,000 120
100
80
60
40
20
0
500,000
400,000
300,000
200,000
100,000
1975
1980
1990
2000
2005
2010
2011
2012
e20
13e
0
USD
mn
USD
/bbl
WTI crude priceE&P Spending
7%8%
14%
Oil and gaS The OPEC countries have enjoyed monopoly production of oil since mid 70s, and hence charge a premium in oil trading. Oil, being the basic fuel required in various industries and for transportation, has extensive forward linkages with the economy. Hence, countries all over the world have begun to extensively undertake oil exploration projects that would help them secure their natural resources needs. Surveys
indicate that oil companies tend to reduce their E&P spending when average oil price goes below USD 65/bbl. Oil prices have constantly been on an increase since 2000, except during the economic recession.
Oil companies are heavily investing in equipment and are increasing their capacities.. The E&P spending was estimated to rise by 14% in 2011 and forecasted to rise 8% in 2012, and 7% in 2013.

annual report
2010-11
35
Management Discussion and AnalysisBoard and Management Reports
The oil and gas value chain comprises upstream (exploration, development & production) and downstream (refining, processing and distributing) activities which are carried out at onshore and offshore sites. The upstream oil and gas segment is vital for country’s energy needs and to accelerate the growth momentum in the years to come. In recent times, India has undertaken a number of exploration activities and has built upon its refining base. India has a refining base of 3.54 mbpd in 2010, which is expected to increase by 40% to reach 5 mbpd by 2012. Three green-field projects are being developed in India currently, wherein PSU’s are expected to refine 600,000 barrels per day.
Countries all over the world are increasingly undertaking refining projects.
As per the current import policy, coal can be freely imported by consumers directly under the Open General License. In 2010, India imported 90 MT of Coal which is expected to touch 110 MT in 2011 with an anticipated annual shortage of 142 MT in 2011-12 (Source: McCloskey Coal Report and CEA)
High oil prices has led to opportunities in the Oil & Gas sector for oil major companies as well as small independent companies. Oil majors have developed hostile environment and deep terrain at large E&P cost to extract new oil. Small independent oil companies have been able to develop marginal field which previously were uneconomical. Mercator has adopted later approach whereby we have taken prospective acreage at Cambay Basin under NELP VII and have commenced exploration activities there.
In addition we are participating in oil services sector of upstream segment by providing tailormade production facilities. We have successfully commenced production in Nigeria at EBOK field of our principals M/s. Afren.
(Source: Investment in exploration-production and refining in 2010, IFP Énergies nouvelles, October 2010)
Refining projects - distillation capacity by geographic region
200820092010
10000
100020003000400050006000700080009000
Atlantic Basin
Middle East Asia Pacific Total
bpd
000,
0
COal India is the third largest coal producing and consuming nations of the world after China and USA. The coal consumption is driven by the energy sector in India as most of the operating power plants (around 55%) in India depend on coal as a fuel. With large scale capacity expansion plans in the power sector, the demand for coal is set to increase further. Coal is therefore a very important resource in the context of India’s power generation. Furthermore, the recent earthquake in Japan and its resultant impact has also raised safety concerns on worldwide nuclear installations. As a result, the previous plans to invest in more nuclear power plants may take a backseat and the preference for thermal power plant will increase, which shall further generate additional demand for coal.
As per the graph below, the world’s consumption of coal has been on an uptrend since 2005, and is expected to continue in the future.
World coal consumption by country grouping, 2005-20
2005
180.00
160.00
140.00
120.00
100.00
80.00
60.00
40.00
20.00
00.00
2006
2007
2008
2009
2010
2011
2012
2013
2014
2015
2016
2017
2018
2019
2020
TotalOECD Non-OECD
quad
rillio
n Bt
u
(Source: EIA)

36
In recent times, more players have entered the dredging market. The current dredging capacity is not enough to meet the port demand. The ` 568 bn National Maritime Development Programme (NMDP) has been providing considerable dredging opportunities wherein about ` 49 bn has been earmarked for 21 dredging projects at all major ports in the country by 2011-12.
It is expected that the cargo handling capacity of Indian ports would increase to 1,855 MT by 2012 from the present 758 MT. During the 11th Five Year Plan (2007–12) about USD 8.5 bn is expected to be invested in the ports sector (Source: Planning Commission of India). The demand for dredging continues to grow in India as it is driven by infrastructure development, port construction, use of larger vessels, increased attention to coastal shipping and inland water transportation, and increased private sector participation.
Mercator has consolidated its dredging business and having maintained a strong track record with its customers, the Company has secured a good order book with repetitive
Projections for 2030
Global coal production is expected to reach 7 bn tonnes
Steam coal production is projected to have reached around 5.2 bn tonnes
Coking coal manufacture is planned to reach 624 mn tonnes
What is Dredging?
Dredging is the process carried out in shallow sea and fresh water areas, and uses a dredger to scrap or suck the seabed, which helps create wider and deeper waterways. The main objective of dredging is to enhance navigation of ships.
India and other nations import coal from Indonesia and Mozambique to meet the fuel demands. In order to capitalize on this opportunity, we have acquired a number of coal mines in the coal mine rich countries of Indonesia and Mozambique. The Indonesian mines are equipped with high end state of the art infrastructure facilities and are located very close to the port. Our own fleet of ships and expertise in logistics provides us with an added advantage.
dredgingIndia has a 7,517 km coastline that has 13 major ports and 200 non major ports. India is increasingly undertaking both capital and maintenance dredging at the major ports.
Coal generation by region
12000
10000
8000
6000
4000
2000
1990
1995
2000
2005
2010
2015
2020
2025
2030
2035
0
China India Other non - OECD OECD
(Source: IEA, world energy outlook 2010)
TWh
Coal prices have risen during the year, as coal is the primary fuel required by power and steel plants in India, and other countries of the world. Coal prices are expected to further increase in the international market due to the surge in imports of coking coal by China and growth in Japanese steel output. Global prices of coking coal have risen from about USD 160-170 a tonne in early 2010-11 to about USD 200 a tonne in the second half of 2010-11 (Source: Business Standard).
India has imported about 70 mn tonnes of thermal coal during the year 2010-11. Internationally, the thermal coal prices hovered around USD 70-80 a tonne. Resurgence in Chinese demand and increased demands from India for thermal coal has fuelled growth in this segment (Sources: The Hindu Business Line and Business Standard).

annual report
2010-11
37
Management Discussion and AnalysisBoard and Management Reports
orders. With new ports coming up and existing port’s dredging requirements increasing, Mercator is poised to capitalize on the opportunity available in the upcoming dredging industry.
indian gOvernmenT rOleInfrastructure development in developing countries and increasing demand for various commodities amongst countries all over the world are expected to drive the demand for shipping services. The Indian Government plays a key role in driving infrastructural growth and the shipping industry growth through the following shipping industry targets set under the 11th Five Year Plan –
Parameters Target I Target II Target III
GRT target (mn tonnes) 10 12 15Additional vessels required 56 181 386Investments required (` bn)
350 550 800
The Indian shipping industry is adopting a more global outlook to utilize the cross trade opportunities, which would be achieved significantly with the help of these targets.
In the energy segment, the Indian Government has undertaken a number of policies and investments across a number of projects to increase the power generation capacity of the country. In the Oil and Gas segment, the Government has been awarding oil blocks under NELP and has been striving to create India as a refining hub and in building strategic petroleum reserves through public private partnership.
riSk gOvernanCe aT merCaTOrMercator has clearly identified the risk management objectives which helps the company in mitigating the risks through incessant risk management initiatives. The Group’s approach to identifying, assessing, and managing risks is formalized through an in depth process of market research, collection of updated industry information and data and research intelligence.
risk - Cyclical nature of shipping businessrisk mitigation- The shipping business is highly cyclical in nature. The management has taken strategic steps to diversify the business by entering into the oil and gas, and
the coal mining. Resultantly, the sources of revenues for the Company have been diversified. More than 50% of revenue is from non-shipping.
risk- Capital intensive naturerisk mitigation- The various business segments of the Company are capital intensive in nature. Large capital is required for the smooth functioning of shipping, dredging, oil exploration and drilling, and coal mining. The shipping and dredging vessels, oil rigs and equipment needs proper maintenance and repairs are expensive. The Company ensures strict adherence to all the timelines, and regularly maintains all its assets. Moreover, the high capital intensive nature of the very business creates a significant entry barrier for new entrants in the business. This in turn helps reduce potential competition.
risk-dependence on economic growthrisk mitigation- The Company’s inherent nature of business makes it dependent on economic growth of the country. The Company’s successful track record, rich management experience, and diversified portfolio of business segments, aids the company in derisking itself to a large extent.
risk - rising fuel costs and freight rate volatilityrisk mitigation- The shipping industry is characterized by extremely volatile freight rates and rising fuel costs. Long term contracts with counter parties serve as a cushion against freight rate volatilities. The strategy of Mercator has been to deploy 70% of the fleet on long term contracts with passing on cost of fuels on charterers.
risk -Counter- partyrisk mitigation- The Company has a large base of credit worthy clients. Mercator continuously engages with strong counter parties to avoid any defaults.
risk - accidents and natural disastersrisk mitigation- The Company has insured all its vessels, and before embarking on any voyage, all the ships are tested and scrutinized.
risk - environment concernsrisk mitigation- The risk of environmental concern due to oil spillage during transportation, oil drilling and exploration, and coal mining and transportation is extremely critical. Mercator strictly adheres to globally accepted environmental regulations.

38
OperaTiOnal and FinanCial perFOrmanCeMercator (standalone as well as through various subsidiaries); has diversified operations with its own fleet of Tankers, Bulk Carriers; Dredgers and Floating Production Units (FPU). Mercator owns and operates coal mine licences in Indonesia and Mozambique. Mercator has also executed production sharing contract with Government of India in respect of two oil blocks; which are in Cambay basin in Western India; awarded under NELP-VII.
The consolidated income from the operations was ` 2829 cr for the year under review as compared to ` 1809 cr in the previous year. The Profit After Tax and Minority Interest was ` 47 cr against ` 53 cr in the previous year.
Tanker (Wet Bulk) performanceMercator tanker fleet consists of Very Large Crude Carrier (VLCC), Aframaxes, Product tankers and Chemical tanker.
Within the tanker segment, Mercator Lines Limited had 7 own tankers of aggregate capacity of 797,935 DWT at the beginning of the year and 1 in-chartered chemical tanker of 19,996 DWT. During the year, 1 Suezmax single hull tanker of aggregate capacity of 148,349 DWT was converted into Floating Storage Offshore Unit. 1 Aframax tanker of 90,607 DWT was acquired during the year. At the end of the year, Mercator Lines Limited had 7 own tankers of an aggregate tonnage of 740,193 DWT and 1 in-chartered chemical tanker of 19,996 DWT.
Mercator achieved a turnover of ` 463 cr as compared to ` 444 cr in the previous year recording 4% increase on YOY basis; the performance was primarily affected due to tanker market remaining soft throughout the year; and dry-docking of couple of vessels. The numbers of operating days were reduced by about 25% to 2672 days (previous year 3,541 days). The Time Charter Equivalent (TCE) at USD 15,728 increased by 7% from USD 14,684 in the previous year. Overall contribution from the tanker division was 16% (previous year 25%) of the total operating income.
dry Bulk performanceMercator’s bulk carrier fleet is comprised of Geared and Gearless Panamaxes; Kamsarmaxes and Very Large Ore Carrier (VLOC).
At the beginning of the year, there were 12 own bulk carriers aggregating tonnage of 1,103,740 DWT and 3 chartered-in bulk carriers with an aggregate capacity of
260,165 DWT. During the year, 2 Panamaxes of 143,570 DWT; one Kamsarmax of 93,200 DWT were acquired. Further delivery of an in-chartered Kamsarmax of 91,800 DWT was also received. One panamax of 73,625 DWT was re-delivered to owners on expiry of charter. Thus at the end of the year Mercator had 15 bulk carriers with an aggregate capacity of 1,340,510 DWT and 3 chartered in bulk carriers of 278,340 DWT.
Mercator achieved a turnover of ` 751 cr (` 680 cr previous year). Though vessel operating days increased by about 17% over the last year to 5908 days (previous year 5,038 days) TCE of USD 25,997 declined by 1% against previous year of USD 26,310. This segment contributed about 27% of the total operating income (Previous year 38%).
dredging performanceIn Dredging; at the beginning of the year; Mercator had 4 dredgers of Aggregate capacity 23500 Cubic meter. There was no change during the year in the fleet. On 583 (previous year 1090) days of operating, Mercator achieved a turnover of ` 85 cr (Previous year ` 86 cr). TCE at USD 19,560 increased by about 44% against previous year’s USD 13,557 This segment contributed about 3% of total operating income (Previous year 5%). Mercator has bagged many new contracts and its order book is full.
Oil & gasOffshore performance:The jack-up rig continued to be deployed on bare boat charter @ USD 92,700 per day. On 337 (previous year 365), operating days; a turnover of ` 142 cr (Pr. Yr. ` 160 cr.) was achieved. This contributed about 5% of the total operating income (previous year 9%). The Rig was sold during the year.
During the year; Mercator acquired one Mobile Offshore Production Unit (MOPU) and refurbished it for deployment under a nine year charter with Afren Plc. Mercator also converted one of its Suezmax tanker into Floating Storage Offloading Unit (FSO) and deployed under the said contract. Both these MOPU and FSO collectively called Floating Production Unit (FPU) have been commissioned successfully subsequent to the year end. MOPU has a processing capacity of 50,000 barrels oil per day whereas FSO has storage capacity of 1.2 mn barrels oil.
Oil Blocks:Mercator has entered into Production Sharing Contracts for two oil blocks awarded to it under NELP VII at Cambay Basin in Western Gujarat. Mercator has commenced exploration activities with 2D – 3D studies.

annual report
2010-11
39
Management Discussion and AnalysisBoard and Management Reports
Coal mining, procurement and logisticsDuring the year, coal mining productions were scaled up as well as there was substantial increase in trading; both contributing increase in topline. During the year, 0.83 mn MT (previous year 0.7 mn MT) coal was generated from coal mines in Indonesia. In all 4.88 mn MT (previous year 1.7 mn MT) of coal was mined, procured and sold. Total turnover of ` 1388 cr (previous year ` 439 cr) was achieved. This contributed about 49% of the total operating income (previous year 21%).
revieW OF OperaTiOnS OF SuBSidiarieS1. mercator international pte. ltd. (mipl) –
(Wholly Owned Overseas Subsidiary - WOS): MIPL was incorporated in Singapore in January 2007
as WOS. This company has multiple subsidiaries and fellow subsidiaries in Singapore and other countries. As at the beginning of the year; MIPL had one in-chartered chemical tanker of 19,926 DWT on standalone basis. There was no change in the tonnage capacity during the year. MIPL has also diversified interest through its Subsidiaries; in commodity mining and trade business as a move towards backward integration of the Company’s business strategy.
During the year under review, it achieved a turnover of about ` 115 cr equivalent of USD 25.263 mn (as against ` 83.37 cr equivalent to USD 17.605 mn in the previous year) with a net profit of ` 47 cr equivalent of USD 10.365 mn (previous year net loss of ` 8.63 cr equivalent of USD 1.82 mn) on standalone basis; that is excluding contribution from its fellow subsidiaries.
2. mercator lines (Singapore) ltd. (mlS) This is a Singapore Stock Exchange listed subsidiary
of MIPL that owns 71.95% controlling interest in the company. MLS has four fully owned subsidiaries; namely, Varsha Marine Pte. Ltd., Vidya Marine Pte. Ltd.; Mercator Lines (Panama) Inc. and Chitra Prem Pte. Ltd. and one joint venture with MIPL viz. Target Ship Management Pte. Ltd. Consolidated fleet of MLS as at March 31, 2011, comprised of 14 own vessels of aggregate capacity of 1,271,224 DWT and 4 chartered-in vessels of aggregate capacity of 278,340 DWT.
During the year, MLS achieved a consolidated turnover of ` 708 cr equivalent of USD 155.360 mn (as against ` 684.21 cr equivalent to USD 144.470 mn in the
previous year) and earned net profit after tax of ` 142 cr equivalent to USD 31.100 mn (as against ` 192.98 cr equivalent to USD 40.748 mn in previous year).
The Board of Directors of MLS recommended dividend at 0.73 cents per share that was paid interim dividend as final dividend for year ended on March 31, 2011.
The Board of Directors of wholly owned subsidiaries of MLS; namely Varsha Marine; Vidya Marine and Chitra Prem declared and paid interim dividends of USD 3 mn (Pre. Year USD 1.20 mn); USD 4.9 mn (Pre. Year USD 5.20 mn) and USD 0.2 mn (not in existence).
Mercator Lines Panama was holding and assigning charter hire rights of Panamax vessels on a back to back basis that was expired on maturity and redelivered the vessel in may 2011. It remained dormant subsequently.
3. mercator Offshore holdings pte. ltd. (mOhpl) and mercator Offshore ltd. (mOl)-WOS:
MOHPL is a holding Company of MOL. At the begining of the year; MOL was owning a Jack up Rig which was sold in March 2011. The Rig was operated for 337 days.
MOL achieved turnover of ` 142 cr equivalent of USD 31.100 mn (previous year ` 160 cr equivalent of USD 33.718 mn) and earned net profit of ` 24 cr equivalent of USD 5.275 mn (previous year ` 71.84 cr equivalent of USD 15.169 mn).
4. mercator Oil & gas ltd. (mOgl): An Indian based non-listed subsidiary. No commercial
activities undertaken during the year.
5. mercator petroleum ltd. (mpl): This is an Indian non-listed subsidiary. During the
year; the status of the company was changed from Private Limited Company to Public Limited Company and accordingly name was changed to Mercator Petroleum Limited. The company has entered into a Production Sharing Contract with the Government of India for exploration of Petroleum under the Seventh New Exploration Licensing Policy round (NELP-VII) and has been allotted two blocks under the scheme in Cambay Basin, Western India. MPL has initiated exploration activities and undertaken surveys.

40
6. Oorja holdings pte. ltd. (Ohpl) and its subsidiaries:
OHPL is 100% subsidiary of Mercator International Pte. Ltd. (MIPL) based in Singapore with the objective to explore business opportunities in commodity mining and trade. As at March 31, 2011, OHPL had six wholly owned subsidiaries; namely, Oorja 1 Pte. Ltd., Oorja 2 Pte. Ltd., Oorja 3 Pte. Ltd.; Oorja Mozambique Minas Limitada; MCS Holdings Pte. Ltd. and Oorja (Batua) Pte. Ltd.
Oorja 1 has a further subsidiary by the name of Oorja Indo Petangis Four (OIP-4) incorporated in Indonesia. Oorja 2 has further subsidiary by the name of Oorja Indo Petangis Three incorporated in Indonesia (OIP-3). Oorja 3 has further subsidiary named Oorja Indo KGS incorporated in Indonesia. OIP -3 and OIP-4 jointly have wholly owned subsidiaries named PT Mincon Indo Resources; PT Bima Gema Permata and PT Nusa Sakti Kencana all incorporated in Jakarta. Oorja Mozambique has a step-down subsidiary named Broadtec Mozambique Minas Limitada with 85% holding; incorporated in Mozambique. Subsequent to year end; Oorja Batua acquired a subsidiary in Indonesia by name PT Karya Putra Borneo.
During the year; OHPL achieved consolidated turnover of ̀ 1338 cr equivalent of USD 293.424 mn (previous year ` 377.42 cr equivalent of USD 79.69 mn) and earned profit of ` 37 cr equivalent of USD 8.200 mn (previous year loss of ` 17.01 cr equivalent of USD 3.59 mn).
7. mercator Offshore (p) pte. ltd. (mOppl): This subsidiary formerly known as Mercator Offshore
(Nigeria) Pte. Ltd. (MONPL) based in Singapore has been awarded a contract for charter out of Floating
Production Unit (FPU) comprising of Mobile Offshore Production Unit (MOPU) and Floating Storage Offshore Unit (FSO) to UK listed Company M/s. Afren PLC for deployment in their EBOK field in Nigeria. During the year; the Company acquired and refurbished MOPU and converted one of its Suezmax tanker into FSO. The FPU have been commissioned successfully on April 30, 2011.
MOPPL has a subsidiary located in Nigeria by name IVORENE Oil Services Ltd. to undertake local support activities.
None of above subsidiary’s Audit Report contains any qualification.
During the year, following subsidiaries viz. Mercator PH (Dutch) Holding BV, Netherland; Mercator Petroleum (Turkey) BV, Netherlands; and Mercator Petroleum (Romania) Pte. Ltd., Singapore were closed down voluntarily.
(For the purpose of financial performances conversion rate of per dollar has been taken as ` 45.59 for Profit and Loss account (previous year ` 47.36) and ` 44.65 for Balance Sheet items (previous year ` 45.14).
QualiTy, SaFeTy & envirOnmenTFor excellent business performance we have recognized and imbibed safety, quality and environmental conservation in our daily routine. We follow Health Safety Security Environment (HSSE) management system which provides direction, education, support, training and supervision to ensure that all employees understand and follow the Company policy and procedure. This has been achieved by having adequate systems and procedures in place which safeguard the health and safety of our people, the

annual report
2010-11
41
Management Discussion and AnalysisBoard and Management Reports
security of our personnel, security of our physical assets and reputation and the protection of the environment. Our fleet has maintained the highest level of safety and cost effective quality during the year, and are in compliance with the international pollution and prevention protocols. The robust system and procedures helps the company achieve its aim of safe shipping across cleaner oceans.
inTernal COnTrOl SySTem and Their adeQuaCy The Company’s internal control systems are adequate and ensure that all corporate policies are strictly adhered to and that transparency is maintained at all levels and functions throughout the organization.
The Internal Auditors ensure that adequate internal controls are in place and all mandatory accounting policies are complied with. The Audit Committee constituted by the Board of Directors regularly assesses the financials of the Company, in consultation with internal and statutory auditors.
human reSOurCeS pOliCieSThe Company has always believed that Human Resources are extremely integral to the functioning of the organization. This is reflected through its philosophy of ‘People First’.
We provide a work environment which is healthy, safe and secure and make positive contribution to the protection of our employees. We initiate various programs that enables our people to share knowledge and understand more
rapidly, working as a single team towards a unified vision and mission.
As on March 31, 2011 there were 105 employees with Mercator Lines Ltd. Globally, Mercator employs 343 persons as at March 31, 2011.
CauTiOnary STaTemenTThe Statement in this Management Discussion and Analysis Report describing the Company’s objectives, projections, estimates, expectations or predictions may be ‘forward looking statements’ within the meaning of applicable laws and regulations. Actual results might differ substantially or materially from those expressed or implied. Important developments that could affect the Company’s operations include demand-supply conditions, changes in Government and
International regulations, tax regimes, economic developments within and outside India and other factors such as litigation and labour relations.
For and on behalf of the BoardH. K. Mittal
Executive Chairman
Regd. Office:3rd Floor, Mittal Tower, B-wing,Nariman Point, Mumbai - 400021Dtd: August 12, 2011

42
To
The Members,
Mercator Lines Limited
We take pleasure in presenting Twenty-Seventh Annual Report of your Company for the year ended on March 31, 2011.
FINANCIAL HIGHLIGHTS
(Amount ` in cr)Consolidated Standalone
Particulars Year ended March 31, 2011
Year ended March 31, 2010
Year ended March 31, 2011
Year ended March 31, 2010
Income from operations 2828.88 1808.73 638.99 580.79Total Income 2811.64 1837.56 639.15 699.91Operating Profit 621.29 655.93 108.58 242.90Interest 215.23 205.77 85.99 94.94Depreciation 306.67 340.91 116.63 137.12Profit before Tax & Minority Interest 99.39 109.25 (94.04) 10.85Minority Interest (39.01) (50.97) N.A. N.A.Taxes- Current Year (15.74) (23.33) (4.00) (21.95)- Deferred Tax 2.21 0.79 - -- MAT Credit Entitlement - 17.50 - 17.50Net Profit/(Loss) After Tax 46.85 53.24 (98.04) 6.40Balance brought forward from last year 604.06 726.03 117.49 286.30Excess provision of earlier years 47.15 - 0.07 -Profit available for appropriations: 698.06 779.27 19.52 292.69Less: Appropriations:Transfers to Reserves- General Reserve - 1.00 - 1.00- Debenture Redemption Reserve - 168.7 - 168.7Provision for final Dividend on Equity Shares - 4.72 - 4.72Tax on Dividend - 0.78 - 0.78Balance carried to Balance Sheet 698.06 604.06 19.52 117.49
Directors’Report

annual report
2010-11
43
Directors’ ReportBoard and Management Reports
On consolidated basis, a milestone was achieved during the year with consolidated income from operations crossing the ` 2500 cr mark. The income from operations was at ` 2829 cr as against ̀ 1809 cr in the previous year; registering a growth of 56%. The operating profit for the year was ` 621 cr against previous year’s ` 656 cr.
After providing for the minority interest of ` 39 cr (previous year ̀ 51 cr) the net profit was recorded at ̀ 47 cr as against ` 53 cr in the previous year. Scale up in Coal mining and procurement activities boosted revenues of the Company. However, overall performance was affected due to lower realizations of shipping freight. Exceptional items in the nature of loss on account of write offs against sale of Rig and Dry docking expenses also added to lower profits.
On a standalone basis, the income from operations for the year under review was ` 639 cr as against ` 581 cr in the previous year, registering a growth of 10% for the year. The Company suffered a loss of ` 94 cr against as Profit Before Tax (PBT) of ` 11 cr in the previous year. Loss after provision of tax was ` 98 cr against Net Profit of ` 6 cr in the previous year. This was mainly on account of dry docking of two vessels on which an amount of ` 15 cr was spent besides loss of revenue from those vessels during the period of dry-dock, coupled with lower Time Charter Yield in dredger division. Lower realization of shipping freight further aggravated the loss. Dredger deployment has improved substantially since the year end, and your Company expects better standalone performance in the coming years.
EXPANSION AND FINANCEDuring the year under review, one aframax; two panamax and one post panamax vessels were acquired at an aggregate cost of ` 542.50 cr (equivalent of USD 121.50 mn). A Mobile Offshore Production Unit (MOPU) was acquired & refurbished and a suezmax was converted into a Floating Storage Offshore Unit (FSO) collectively called FPU. The total cost incurred for FPU as at March 31, 2011 was ` 805 cr.
The aframax has been deployed gainfully since its acquisition. Panamaxes/post-panamaxes too were deployed immediately upon their acquisitions on long-term charter ranging a period of 35 to 74 months. The MOPU and the FSO have been deployed on a nine-year contract. The acquisition of key assets such as these proves the Company’s foresight and its ability to monetise future opportunities. A mix of internal resources and debts financed these expansions.
Towards the end of the year, your Company issued Un-Secured Redeemable Non-convertible Debentures of an
aggregate amount of ` 100 cr on private placement basis, which have been listed on the Bombay Stock Exchange.
Your Company would consider raising of funds for general corporate purposes including capital expenditure, working capital requirements, strategic investments by way of issue of securities (whether in India and/or abroad) at appropriate time.
BUSINESS OPERATIONS AND FUTURE OUTLOOKYour Company has well diversified business segments i.e. Shipping (Tanker & Dry bulk); Dredging; Oil & Gas; Coal (Mines & Procurement); and Logistics. While the Coal division performed extremely well, the Dry bulk & Logistics division performed satisfactorily. The tanker and dredging divisions were affected due to subdued market conditions. Exploration activities have commenced on two oil blocks that the Company owns. The FPU (MOPU & FSO) has been commissioned successfully subsequent to the end of the year. The commissioning of the FPU project is expected to add substantial revenue from current year. During the year; the Jack-up Rig was sold.
Going forward, performance of Coal mining and procurement is estimated to scale up further. While the Dredging Division has good improvements in terms of order book, Dry Bulk and Logistics are expected to continue to perform satisfactorily except in the event of any downturn in the world economy. The tanker division may remain soft with exceptional spikes.
SHARE CAPITALDuring the year, 2,77,80,000 warrants were issued to Promoters/Persons Acting in concert/Directors/entities controlled by them on a preferential basis in accordance with SEBI Regulations, as approved by the shareholders of the Company in their Extra-Ordinary General meeting held on October 28, 2010. The warrants carried an option to apply and subscribe for an equivalent number of equity shares of ` 1/- each at a price not less than ` 55 per share. Out of these, one of the promoters exercised the option and 89,00,000 warrants were converted into equivalent equity shares of ` 1/- each at a price of ` 55 per share. Consequently; the issued and paid up share capital increased from 23,59,92,073 equity shares of ` 1/- each aggregating ̀ 23.60 cr to 24,48,92,073 equity shares of ̀ 1/- each aggregating ` 24.49 cr. At the year end, 1,88,80,000 warrants were outstanding.
DIVIDENDIn view of losses suffered by the Company during the year under review, your Directors do not recommend any dividend.

44
DIRECTORSIn accordance with the provisions of the Companies Act, 1956, and the Articles of Association of the Company, Mr. K. R. Bharat and Mr. Anil Khanna are the Directors liable to retire by rotation at the ensuing Annual General Meeting. Mr. Bharat, being eligible, has offered himself for re-appointment. Mr. Anil Khanna has expressed his inability to continue as Director of the Company. The Directors place on record their gratitude for the guidance extended by Mr. Anil Khanna during his tenure. Your Directors do not intend to fill the vacancy caused by the retirement of Mr. Anil Khanna.
Subsequent to year end, the Board of Directors in their meeting held on August 12, 2011 appointed Mr. M. M. Agrawal as an Additional Director of the Company. He being the Additional Director, holds office only up to the ensuing Annual General Meeting. Resolution for appointment of Mr. M. M. Agrawal as Director is proposed for approval of shareholders at ensuing Annual General Meeting in response to notices received from member of the Company proposing his candidature.
A brief resume of Mr. K. R. Bharat and Mr. M. M. Agrawal is included in the notice of the ensuing Annual General Meeting scheduled to be held on September 22, 2011.
The Directors recommend their re-appointment for approval of the members.
SUBSIDIARY COMPANIES AND CONSOLIDATED FINANCIAL STATEMENTSAs at March 31, 2011, your Company had 27 subsidiaries/step-down subsidiaries. Pursuant to the Accounting Standard (AS 21) issued by the Institute of Chartered Accountants of India, audited consolidated financial statements together with Auditors’ Report thereon form part of his Annual Report includes financial information of the subsidiaries.
Pursuant to general exemption granted vide notification dated February 8, 2011, issued by the Ministry of Corporate Affairs, Government of India, this Annual Report is presented without attaching annual accounts of the subsidiaries for the year ended March 31, 2011. A statement in respect of the said subsidiaries pursuant to Section 212 of the Companies Act, 1956, is enclosed herewith as required. The annual reports and accounts of subsidiaries will be made available for inspection at the registered office of the Company and also of the subsidiary companies concerned during working hours. The same, along with related detailed information will be made available to the investors of the Company as
well as of subsidiaries, on request. The brief financial details of the subsidiaries for the year ended March 31, 2011, as prescribed under the said notification have been disclosed in the consolidated balance sheet of the Company.
AUDITORSThe Auditors of your Company, M/s. Contractor, Nayak & Kishnadwala, Chartered Accountants, retire at the ensuing Annual General Meeting and have confirmed their eligibility for re-appointment under Section 224 (1-B) of the Companies Act, 1956.
The Directors recommend their re-appointment for approval of the members.
PARTICULARS OF EMPLOYEESAs required under the provisions of Section 217(2A) of the Companies Act, 1956 (the Act), read with the Companies (Particulars of Employees) Rules 1975 as amended, the requisite particulars with respect to the employees of the Company, who were in receipt of remuneration in excess of the limits specified under the said section are set out in the annexure forming part of this report. However, as per the provisions of Section 219(b) (iv) of the Act, the report and the accounts are being sent to all members of the Company excluding this annexure of particulars of employees. Any member interested in obtaining such particulars may write to the Company at the registered office.
CONSERVATION OF ENERGY, TECHNOLOGY ABSORPTION, EXPORT MARKET DEVELOPMENT AND FOREIGN EXCHANGE EARNINGS and OUTGOThe Conservation of Energy and Technology Absorption under the Companies (Disclosure of Particulars in the Report of the Board of Directors) Rules, 1988, are not applicable to your Company. However, the Directors would like to assure you that every measure is taken to save and conserve energy at all the stages of operating the vessels, as well as, in our shore activities.
In its endeavor to develop the export market, your Company has formed/acquired new overseas subsidiaries during the year.
Your Company has not imported any technology during the year. It has earned foreign exchange of ` 132.85 cr (as against previous year’s earnings of ` 216.46 cr) and spent ` 312.16 cr (as against ` 379.91 cr for the previous year) in foreign exchange, on account of acquisition of vessels, charter hire, other vessel expenses, and interests etc.
CORPORATE GOVERNANCEA separate report on Corporate Governance, along with the requisite certificate from the Auditors of the Company, as

annual report
2010-11
45
Directors’ ReportBoard and Management Reports
required under the provisions of Clause 49 of the Listing Agreements with the Stock Exchanges, is annexed herewith forming a part of this Annual Report. Management Discussion and Analysis Report, as per the Corporate Governance requirement is also annexed herewith as part of this Report.
The Ministry of Corporate Affairs (MCA), India, has issued ”Corporate Governance Voluntary Guidelines 2009”. While following the Corporate Governance requirements prescribed under Clause 49 of the Listing Agreement, your Company has adopted many of the recommendations of the MCA which are in consonance with the Clause 49 of Listing Agreement of Stock Exchanges. It is in the process of reviewing the possibilities to implement the remaining recommendations as well.
INSURANCEAll properties of the Company are adequately insured.
FIXED DEPOSITSThe Company has not accepted any public deposits falling under the purview of section 58-A of the Companies Act, 1956.
DIRECTORS’ RESPONSIBILITY STATEMENTPursuant to the provisions of Section 217(2AA) of the Companies Act, 1956, the Directors hereby confirm that:
(i) In preparation of the annual accounts, all applicable accounting standards have been followed along with proper explanation relating to material departures;
(ii) They have selected such accounting policies in consultation with Statutory Auditors and applied them consistently and made judgments and estimates that are reasonable and prudent, so as to give a true and fair view of the state of affairs of the Company at the end of the financial year and of the loss for the year under review;
(iii) They have taken proper and sufficient care for the maintenance of adequate accounting records in accordance with the provision of the Companies Act, 1956, to safeguard the assets of the Company and to prevent and detect fraud and other irregularities;
(iv) They have prepared the annual accounts on a going concern basis.
GROUP FOR INTERSE TRANSFER OF SHARESAs required under clause 3(1) (e) of the Securities and Exchange Board of India (Substantial Acquisition of Shares and Takeovers) Regulations, 1997, persons constituting a “Group” (within the meaning as defined in the Monopolies and Restrictive Trade Practices Act, 1969) for the purpose of availing exemption from applicability of the provisions of Regulation 10 to 12 of the aforesaid Regulations, are given in the Annexure A attached herewith and forms a part of this Annual Report.
ACKNOWLEDGEMENTSThe Directors would like to express their gratitude to customers, suppliers, service providers, regulators and Governmental agencies, such as Ministry of Shipping, Ministry of Petroleum & Natural Gas, the Directorate General of Shipping; Directorate General of Hydrocarbon; and other statutory authorities for their continual support and encouragement.
We also acknowledge the support lent and confidence bestowed upon us by our bankers, stakeholders and all Mercatorians.
For and on behalf of the BoardH. K. Mittal
Executive Chairman
Regd. Office:3rd Floor, Mittal Tower, B-wing,Nariman Point, Mumbai - 400021Dtd: August 12, 2011

46
1. Mr. H. K. Mittal
2. Mrs. Archana Mittal
3. Mr. A. J. Agarwal
4. AHM Investments Pvt. Ltd.
5. Mr. Shalabh Mittal
6. Mr. Adip Mittal
7. Mrs. Shruti Mittal
8. Mrs. Manjuli Agarwal
9. Mr. Aayush Agarwal
10. Ms. Arooshi Agarwal
11. Ms. Tanvi Mittal
12. Mr. Amol Mittal
13. Mercator Healthcare Ltd.
14. MLL Logistics Pvt. Ltd.
15. Mercator Mechmarine Ltd.
16. Ankur Fertilizers Pvt. Ltd.
17. Rishi Holdings Pvt. Ltd.
18. AAAM Properties Private Ltd.
19. MMAXX Dredging Private Ltd.
20. Oorja Resources India Private Ltd.
21. Vaitarna Marine Infrastructure Private Ltd. (Formerly known as Mech Marine Engineers Pvt. Ltd.)
22. CMA Constructions & Properties Private Limited
23. Mercator International Pte. Ltd
24. Mercator Oil & Gas Ltd.
25. Mercator Petroleum Ltd.
ANNEXURE – A TO THE DIRECTORS’ REPORT
For the purpose of interse transfer of shares under Regulation 3 (1) (e) of the Securities and Exchange board of India (Substantial Acquisition of Shares and Takeovers) Regulations, 1997, the following persons constitute “Group” as defined in the Monopolistic & Restrictive Trade Practices, 1969, (54 of 1969):
26. Mercator Offshore Holdings Pte. Ltd.
27. Mercator Offshore Ltd.
28. Mercator Lines (Singapore) Ltd.
29. Varsha Marine Pte. Ltd.
30. Vidya Marine Pte. Ltd.
31. Mercator Lines (Panama) Inc.
32. Oorja Holdings Pte. Ltd.
33. Oorja 1 Pte. Ltd.
34. Oorja 2 Pte. Ltd.
35. Oorja 3 Pte. Ltd.
36. Oorja Mocambique Minas Limitada
37. Broadtec Mocambique Minas Limitada
38. PT Oorja Indo Petangis Four
39. PT Oorja Indo Petangis Three
40. PT Oorja Indo KGS
41. MCS Holdings Pte. Ltd.
42. PT Mincon Indo Resources
43. Mercaor Offshore (Nigeria) Pte. Ltd.
44. Ivorene Oil Services (Nigeria) Ltd.
45. Oorja (Batua) Pte Ltd.
46. Bima Gema Permata Pt.
47. Nusa Sakti Kencana Pt.
48. Chitra Prem Pte. Ltd.
49. Target Ship Management Pte. Ltd.

annual report
2010-11
47
Report on Corporate GovernanceBoard and Management Reports
COMPANY’S PHILOSOPHYThe Company strongly believes in ethical way of conducting business. The Company upholds its relationship with the society and hence its social responsibility of environmental safety and human welfare.
Corporate governance to the company is not just a compliance issue but central guiding principle for everything it does. It’s a way of thinking, way of conducting business and a way to steer the organization to take on challenges for now and for the future.
The Company recognizes its responsibility towards its shareholders and therefore constantly endeavors to create and enhance shareholder’s wealth and value by implementing its business plans at appropriate times and thus taking maximum advantage of available opportunities to benefit the Company, its shareholders and the society at large. The Company believes in monitoring its performance regularly and with utmost transparency to ensure ethical governance at all levels within the organization.
I. Board Of Directors: As at the year end March 31, 2011, the Board of Directors of the Company comprises of seven Directors; Two Executive
Directors and five Non-Executive Directors. Among the two Executive Directors; one is the Executive Chairman and the other is Managing Director. The Company is in compliance with the requirement of at least half of the Board comprising of Independent Directors as the Chairman of the Board is an Executive Director and a Promoter.
There is no Nominee Director on the Board of the Company.
No Director of the Company is either member in more than ten committees and/or Chairman of more than five committees across all Companies in which he is Director and necessary disclosures to this effect has been received by the Company from all the Directors.
During the year, in all Five Board meetings were held i.e. on May 25, 2010; July 31, 2010, September 30, 2010; October 28, 2010 and February 12, 2011. The time interval between any two meetings was not more than 4 months.
The details of Directors and their attendance record at Board Meetings held during the year, at last Annual General Meeting and number of other Directorships and Chairmanships/membership of Committees is given below
Report onCorporate
Governance(Forming part of Directors’ report for the year ended on March 31, 2011)

48
Sr.No
Name of Director
Category No. of Board
MeetingsAttended
Attendance at last AGM
No. of other Directorships
in Indian Public
Companies*
No. of committee
membership in other
Companies **
No. of committee
Chairmanship in other
Companies **
1 Mr. H. K. Mittal Executive Chairman & Promoter
5 Yes 3 Nil Nil
2 Mr. A. J. Agarwal Managing Director, Executive-Promoter
5 Yes 2 1 Nil
3 Mr. Manohar Bidaye
Non-Executive Independent
3 Yes 2 1 1
4 Mr. Anil Khanna Non-Executive Independent
5 Yes 1 1 Nil
5 Mr. M. G. Ramkrishna
Non-Executive Independent
4 Yes 2 Nil 1
6 Mr. K. R. Bharat Non-Executive Independent
3 Yes 3 Nil Nil
7 Mr. Kapil Garg Non-Executive Not Independent
3 Yes 1 Nil Nil
* Other directorships does not include Private Companies, Companies registered u/s 25 of the Companies Act, 1956, Alternate directorships and foreign Companies.
** In accordance with Clause 49 of the Listing Agreement, Memberships/Chairmanships of only the Audit Committees and Shareholders’/Investors’ Grievance Committees of all Public Limited Companies have been considered.
None of the independent directors had resigned nor removed from the Board of the Company during the year and hence compliance in respect of replacement thereof did not arise.
All the information required to be furnished to the Board was made available to them along with detailed agenda notes.
The Board reviews compliance reports of all laws applicable to the Company, presented by Managing Director at the meeting.
Subsequent to year end, Mr. M. M. Agrawal was appointed as Additional Director of the Company w.e.f. August 12, 2011. Mr. Agrawal is Non-executive Independent Director.
Code of Conduct: The Board has laid down a Code of Conduct for all Board members and Senior Management personnel of the Company,
which has been posted on the website of the Company www.mercator.in
All Board members and Senior Management personnel have affirmed compliance with the code for the year ended on March 31, 2011. Declaration to this effect signed by the Chief Executive Officer for the year ended on March 31, 2011 has been included elsewhere in this annual report.
II. Audit Committee:
Composition: Pursuant to the provisions of Section 292(A) of the Companies Act, 1956 and Clause 49 of the Listing Agreements, the
Company has a qualified and independent Audit Committee. As at March 31, 2011, the Committee comprised of three Independent Non-Executive Directors. Mr. Anil Khanna, Senior member of Institute of Chartered Accountants of India, having a sound accounting and financial background, was the Chairman of the Committee, the other members being Mr. Manohar Bidaye, Senior member of Institute of Company Secretaries of India and Mr. M. G. Ramkrishna, a veteran from the banking & finance industry. The Managing Director, Head of Finance Department along with the Internal Auditors and Statutory Auditors are always invitees to the Audit Committee Meeting. All other Functional Managers are invited to attend the meeting, as and when necessary. The Committee is vested, inter alia, with following powers and terms of references as prescribed under relevant provisions of the Companies Act, 1956 and Stock Exchanges Listing Agreement.
Subsequent to year end, the Audit Committee was reconstituted by the Board of Directors at its meeting held on May 28, 2011. Audit Committee now comprises of three Independent Non-Executive Directors and one Executive

annual report
2010-11
49
Report on Corporate GovernanceBoard and Management Reports
(g) Qualifications in the draft audit report.
5. Reviewing, with the management, the quarterly financial statements before submission to the board for approval.
5A. Reviewing, with the management, the statement of uses/application of funds raised through an issue (public issue, rights issue, preferential issue, etc.), the statement of funds utilized for purposes other than those stated in the offer document/prospectus/notice and the report submitted by the monitoring agency monitoring the utilisation of proceeds of a public or rights issue, and making appropriate recommendations to the Board to take up steps in this matter.
6. Reviewing, with the management, performance of statutory and internal auditors, and adequacy of the internal control systems.
7. Reviewing the adequacy of internal audit function, if any, including the structure of the internal audit department, staffing and seniority of the official heading the department, reporting structure coverage and frequency of internal audit.
8. Discussion with internal auditors on any significant findings and follow up there on.
9. Reviewing the findings of any internal investigations by the internal auditors into matters where there is suspected fraud or irregularity or a failure of internal control systems of a material nature and reporting the matter to the board.
10. Discussion with statutory auditors before the audit commences, about the nature and scope of audit, as well as, post-audit discussion to ascertain any area of concern.
11. To look into the reasons for substantial defaults in the payment to the depositors, debenture holders, shareholders (in case of non payment of declared dividends) and creditors.
12. To review the functioning of the Whistle Blower mechanism, in case the same is existing.
12A. Approval of appointment of CFO (i.e. the whole-time finance director or any other person heading the finance function and discharging the function) after assessing the qualifications, experience & background etc. of the candidate.
13. Carrying out any other function as is mentioned in the terms of reference of the Audit Committee.
Meetings:
During the year, in all four meetings of the Committee were held i.e. on May 25, 2010; July 31, 2010; October 28, 2010 and February 12, 2011. The time intervals
Promoter Director. Mr. Manohar Bidaye has been appointed as Chairman of Audit Committee, Mr. K. R. Bharat, MBA from Indian Institute of Management, Ahmedabad; and Mr. Atul Agarwal – Fellow member of Institute of Chartered Accountants are the new members of the Committee in addition to existing member Mr. M. G. Ramkrishna.
Mr. Anil Khanna, then Chairman of the Audit Committee was present at the last Annual General Meeting to answer the shareholder queries.
Powers:a) To investigate any activity within its terms of
reference.b) To seek information from any employee.c) To obtain outside legal or other professional
advice.d) To secure attendance of outsiders with relevant
expertise, if it considers necessary.
Terms of Reference: The Audit committee reviews the reports of the Internal
Auditors and the Statutory Auditors periodically and discuss their findings and suggest the corrective measures. The role of the Audit Committee is as follows:
1. Overview of the company’s financial reporting process and the disclosure of its financial information to ensure that the financial statement is correct, sufficient and credible.
2. Recommending to the Board, the appointment, re-appointment and, if required, the replacement or removal of the statutory auditor and the fixation of audit fees.
3. Approval of payment to statutory auditors for any other services rendered by the statutory auditors.
4. Reviewing, with the management, the annual financial statements before submission to the board for approval, with particular reference to:
(a) Matters required to be included in the Director’s Responsibility Statement to be included in the Board’s Report in terms of clause (2AA) of Section 217 of the Companies Act, 1956.
(b) Changes, if any, in accounting policies and practices and reasons for the same.
(c) Major accounting entries involving estimates based on the exercise of judgment by the management.
(d) Significant adjustments made in the financial statements arising out of the audit findings.
(e) Compliance with listing and other legal requirements relating to financial statements.
(f) Disclosure of any related party transactions.

50
between two meetings of the Committee were not more than four months.
Attendance of each member at the audit Committee Meetings:
Name of Director No. of Meetings attended
Mr. Anil Khanna 4Mr. Manohar Bidaye 2Mr. M. G. Ramkrishna 3
The Managing Director, along with Chief Financial Officer, Statutory Auditors and Internal Auditors attended all the four meetings. The Company Secretary and in his/her absence Sr. Manager, Secretarial acted as the Secretary to the Committee.
Review of Information: The Audit committee was presented with and reviewed
necessary information as required under Clause 49 of the Listing Agreement.
There was no instance of management letter/letter of internal control weaknesses issued by the Statutory Auditors during the financial year 2010-11.
Remuneration-Cum-Selection Committee: The Company has Remuneration Committee comprising
of three Non-executive Independent Directors. Mr. Manohar Bidaye is the Chairman of the Committee with Mr. Anil Khanna and Mr. M. G. Ramkrishna being other members. The committee, on behalf of the Board and the shareholders, determines, with agreed terms of reference, the Company’s policy on specific remuneration packages for Executive Directors and Senior Management people including pension rights and any compensation payment. This Committee also acts as a Remuneration Committee under Schedule XIII and as Selection Committee under Section 314 of the Companies Act, 1956.
Four meetings of Remuneration Committee were held during the year. Attendance of each member at the Remuneration Committee Meetings:
Name of Director No. of Meetings attendedMr. Manohar Bidaye 4Mr. Anil Khanna 4Mr. M. G. Ramkrishna 3
With effect from May 28, 2011, Mr. K. R. Bharat was appointed as member in place of Mr. Anil Khanna
Expansion Committee: The Company has Expansion Committee comprising
of two Executive Directors viz. Mr. H. K. Mittal & Mr. A. J. Agarwal and two Non-executive Independent
Directors viz. Mr. Anil Khanna & Mr. K. R. Bharat. The Committee is authorized to assess the business opportunities and take the decisions from time to time on expansion/modernization/diversification projects; means of finance and other related matters, within the limits sanctioned by the Board. During the year eight meetings were held.
Attendance of each member at the Expansion Committee Meetings:Name of Director No. of Meetings attended
Mr. H. K. Mittal 8Mr. Atul J. Agarwal 8Mr. Anil Khanna (upto May 28, 2011)
8
Mr. K. R. Bharat 8
ESOP Compensation Committee: The Company has Employee Stock Purchase Committee
(ESPS) of Directors comprising of two Executive Directors viz. Mr. H. K. Mittal & Mr. A. J. Agarwal and three Non-executive Independent Directors viz. Mr. Manohar Bidaye; Mr. Anil Khanna (upto May 28, 2011) & Mr. M. G. Ramkrishna, to implement the Employee Stock Purchase Scheme of the Company. No meeting was held during the year. The Committee was renamed as ESOP Compensation Committee during the year and is authorized to formulate entire Employee Stock Option scheme; to carry out process of determining eligibility criteria; to issue and allot the shares and to do all acts, deeds, things, matters as may be required in this regard, in accordance with the provisions of SEBI (Employee Stock Option Scheme and Employee Stock Purchase Scheme) Guidelines, 1999.
III. Subsidiary Companies: As at March 31, 2011 the Company had total 27
subsidiaries. The Indian Subsidiaries viz. Mercator Oil & Gas Ltd. and Mercator Petroleum Limited were neither listed nor material as at March 31, 2011.
The Audit Committee reviews the financial statements of all the subsidiary companies including the investment made by the Company.
The Minutes/resolutions of the Board Meetings of all the subsidiary companies (including the step down subsidiary Companies) are placed before the Board periodically.
The management periodically reviews a statement of all significant transactions, if any, entered into by the subsidiary companies.
IV. Disclosures:(A) Basis of related party transactions:
i. A statement in summary form of transactions

annual report
2010-11
51
Report on Corporate GovernanceBoard and Management Reports
with related parties in the ordinary course of business is placed periodically before the audit committee.
ii. Details of material individual transaction with related parties, which are not in the normal course of business, are placed before the audit committee, whenever applicable.
iii. During the year, there was no material individual transaction with related parties or others, that was not on an arm’s length basis.
(B) Disclosure of Accounting Treatment: In the preparation of financial statements for the year ended on March 31, 2011; there was no treatment different
from that prescribed in an Accounting Standard and applicable Laws and Regulations that had been followed.
(C) Board Disclosures-Risk Management: The Company has laid down procedures to inform Board members about the risk assessment and minimization
procedures. These procedures are periodically reviewed to ensure that executive management controls risk through means of properly defined framework.
(D) Proceeds from public issues, rights issues, preferential issues etc. During the year; the Company raised an amount of ` 38.20 cr by issue of 2,77,80,000 warrants with an option to
acquire one equity share against each such warrants to the Promoters/Directors/Entities in which Directors were interested, ` 36.71 cr by issue of 89,00,000 shares pursuant to conversion of part of the warrants into shares and ` 100 cr through issue of unsecured Non-convertible Redeemable Debentures on private placement basis; proceeds of which were utilized for the intended purpose. Besides this, the Company did not raise any amount through public or right or preferential issues. The auditor’s certificate confirming the same was placed at the relative Audit Committee meeting.
(E) Remuneration of Directors: The remuneration of non-executive Directors is decided by the Board/Shareholders.
Details of remuneration paid to Directors for the financial year ended March 31, 2011:
Executive Directors:
Amount ` in LakhsName Salary Perquisites Total Mr. H. K. Mittal 40.47 7.53 48.00Executive Chairman Mr. A. J. Agarwal 39.96 8.04 48.00Managing Director
The remuneration to the Executive Directors is governed by the agreements executed with them as approved by the members of the Company in their General Meeting. As per the agreement, salary and perquisites are a fixed component and the commission is based on the performance of the Company, i.e. on the net profit of the year. However, aggregate of which shall not exceed 5% of net profit calculated as per the provisions of the Companies Act, 1956; per Executive Director with payment of minimum remuneration to them in case of loss or inadequacy of profit in any financial year during their tenure, subject however, to the ceiling prescribed under the Companies Act, 1956; and approval of the Central Government, if required.
The Executive Directors were not issued any Stock Options during the year.
Both the above Executive Directors were re-appointed for a period of three years w.e.f. August 1, 2010; and the same was approved by the Members of the Company at their AGM held on September 7, 2010. The appointments can be terminated by either party by giving six moths’ notice in writing. There is no severance fees payable.
Non-executive Directors: The Board decides the payment of commission within the limits approved by members of the Company in their
Annual General Meeting held on September 26, 2007 not exceeding 1% of its net profit to Non-executive directors. However, in view of losses suffered by the Company for the year ended on March 31, 2011; no commission was

52
paid to the Non-executive Directors.
Remuneration by way of sitting fees for attending Board meetings and Audit Committee meetings are paid to Non-executive Directors @ ` 20,000/- per meeting attended by them. Details of sitting fees paid to Non-executive Directors are as follows:
Name of the Director ` in lakhsMr. Manohar Bidaye 1.00Mr. Anil Khanna 1.80Mr. M. G. Ramkrishna 1.40Mr. K. R. Bharat 0.60Mr. Kapil Garg 0.60
All the Non-executive Directors have disclosed their shareholdings as at March 31, 2011 to the Company. Details of the same and of the warrants convertible into equivalent number of equity shares issued to the Non-executive Directors are as under:
Name of the Director No of equity shares held No of warrants held Mr. Manohar Bidaye 97,500 5,00,000
Company in which Mr. Manohar Bidaye and his wife are Directors and hold 100% shares
Mr. Anil Khanna 2,47,120 70,000 Company in which Mr. Anil Khanna and his wife are Directors and hold 100% shares
Mr. M. G. Ramkrishna 15,000 10,000Mr. K. R. Bharat Nil 25,00,000
Company in which Mr. K. R. Bharat and his wife are Directors and hold 50% of shares.
Mr. Kapil Garg Nil 5,00,000
The Company did not have any pecuniary relationship or transaction with the Non-executive Directors.
No stock options were issued to the Non-executive Directors during the year.
(F) Management A Management Discussion and Analysis report forming part of this Directors’ report is attached herewith.
Based on the disclosures received from the Senior Management personnel, during the year, there was no material financial and commercial transaction by senior management that may have a potential conflict with the interest of the Company at large.
G) Shareholders (i) General Body Meetings: Details of General Meetings held during last three years are given below:
Financial Year Date Time Venue Special Resolution(s)2010-11 (EGM) 28/10/2010 4:30
P.M.C. K. Nayudu Hall, The Cricket Club of India Limited, Brabourne Stadium, Churchgate, Mumbai-400020
1. Issue of Warrants convertible into equity shares on Preferential Basis to Promoters/Directors/their entitites
2. Issue of Employee Stock Options

annual report
2010-11
53
Report on Corporate GovernanceBoard and Management Reports
3. Appointment of Mr. Adip Mittal, relative of Director as Business Associate.
2010-11 (AGM) 07/09/2010 3:30 P.M.
C. K. Nayudu Hall, The Cricket Club of India Limited, Brabourne Stadium, Churchgate, Mumbai-400020
1. Payment of Minimum Remuneration to and Re-Appointment of Executive Chairman and Managing Director
2009-10 (AGM) 24/09/2009 4:00 P.M.
C. K. Nayudu Hall, The Cricket Club of India Limited, Brabourne Stadium, Churchgate, Mumbai-400020
1. Issue of securities (whether in form of equity and/or securities convertible into and/or carrying rights to subscribe to equity shares of the Company) in India and/or abroad for an amount not exceeding USD 40 mn
2. Issue of Redeemable cumulative preference shares for an aggregate amount of not exceeding ` 200 cr
2008-09 (AGM) 16/07/2008 4:00 P.M.
C. K. Nayudu Hall, The Cricket Club of India Limited, Brabourne Stadium, Churchgate, Mumbai-400020
NIL
No special resolution through postal ballot was passed last year; nor proposed at the ensuing Annual General Meeting.
(ii) Disclosures: During the year, there were no transactions of materially significant nature with the Promoters or Directors
or the Management or their subsidiaries or relatives etc. that had potential conflict with the interest of the Company. However, the transactions entered into with the related parties are reported as per Accounting Standard 18 at Note No. 19 of Notes forming part of the Accounts under Schedule I (B) annexed to the Accounts for the year under review.
There were no instances of non-compliance and that no penalties or strictures were imposed on the Company by any Stock Exchange or SEBI or any statutory authority on any matter related to capital market during the past three years.
Presently the Company does not have any Whistle Blower Policy. However, no person has been denied access to the Audit Committee on any matter.
Financial Year Date Time Venue Special Resolution(s)

54
(iii) Means Of Communication: Quarterly/half-yearly/yearly results are published as per stipulations of Listing Agreement. The audited annual
accounts are posted to every member of the Company. Quarterly shareholding distribution and quarterly/half yearly/yearly results submitted to the Stock Exchanges are posted on the website of the Company www.mercator.in. The Company also displays official news releases on its website i.e. www.mercator.in The Company has created an email id [email protected] to facilitate redressal of investors’/shareholders’ grievances.
The presentations if any, made to institutional investors/analysts through personal meetings are also displayed on website of the Company and submitted to the Stock Exchanges simultaneously.
(iv) Annual General Meeting Twenty Seventh Annual General Meeting is scheduled to be held on Thursday, September 22, 2011 at C. K.
Nayudu Hall, The Brabourne Stadium, Churchgate, Mumbai - 400020.
(v) Re-Appointment Of Directors Brief resume of the Directors re-appointing at the ensuing annual general meeting along with their expertise
in specific functional areas and names of the companies in which they hold directorships and chairmanships/membership of Committees of the Board are provided in the notice of the ensuing Annual General Meeting scheduled to be held on September 22, 2011.
(vi) Financial Calender For The Year 2010-11:
First Quarter Results (June 30) August 12, 2011Mailing of Annual Reports End August 2011Annual General Meeting September 22, 2011Second Quarter Results (September 30) Mid of November 2011Third Quarter Results (December 31) Mid of February 2012Fourth Quarter/Annual Results End May 2012
(vii) Dates Of Book-Closure: The Share Transfer Books and Register of Members of the Company will remain Closed from Thursday, the
September 15, 2011 to Thursday the September 22, 2011 (both days inclusive).
(viii) Dividend: In view of the loss suffered during the year ; the Board of Directors have not recommended any dividend on
Equity Shares of the Company.
(ix) Listing Of Shares, Non-Convertible Debentures: The Equity Shares of the Company are listed on Bombay Stock Exchange (Scrip Code 526235); National Stock
Exchange (Scrip Code MLL EQ) and the annual listing fees in respect of the year 2011-2012 have been paid to these exchanges.
The monthly high-low quotations of the equity shares of the Company on Bombay Stock Exchange and National Stock Exchange during the financial year 2010-11 vis-à-vis Sensex performance of Bombay Stock Exchange is given below:
BSE
Month Share Price (`) Sensex PerformanceHigh Low High Low
April 2010 62.80 56.15 18,047.86 17,276.80May 2010 66.00 43.05 17,536.86 15,960.15June 2010 48.45 42.45 17,919.62 16,318.39July 2010 49.55 45.55 18,237.56 17,395.58August 2010 55.15 46.50 18,475.27 17,819.99September 2010 58.90 47.00 20,267.98 18,027.12October 2010 71.65 56.60 20,854.55 19,768.96

annual report
2010-11
55
Report on Corporate GovernanceBoard and Management Reports
November 2010 76.90 49.35 21,108.64 18,954.82December 2010 63.95 47.00 20,552.03 19,074.57January 2011 59.25 43.30 20,664.80 18,038.48February 2011 45.60 33.65 18,690.97 17,295.62March 2011 40.50 34.85 19,575.16 17,792.17
NSE:
Month Share Price (`)High Low
April 2010 62.75 56.00May 2010 59.35 43.20June 2010 48.35 41.00July 2010 49.60 45.70August 2010 55.15 41.75September 2010 59.70 44.00October 2010 71.60 56.50November 2010 76.90 49.65December 2010 62.40 46.50January 2011 59.30 43.05February 2011 45.60 33.55March 2011 40.50 35.10
As at March 31, 2011; the Company had following series of listed Redeemable Non-Convertible Debentures
Month Share Price (`) Sensex PerformanceHigh Low High Low
Share Price (`) High
Share Price (`) LowSensex Performance High
80 22,000.00
21,000.00
20,000.00
19,000.00
18,000.00
17,000.00
16,000.00
15,000.00
75
70
65
60
55
45 40
30
Apr -
10
May
- 1
0
Jun
- 10
Jul -
10
Aug
- 10
Sep
- 10
Oct
- 1
0
Nov
- 1
0
Dec
- 1
0
Jan
- 11
Feb
- 11
Mar
- 1
1
35
Shar
e Pr
ice
(`)
Sens
ex P
erfo
rman
ce
Sensex Performance Low
Mercator Share Prices Vs Sensex Performance

56
issued on private placement basis in dematerialized form:
Series No
No. of NCDs
Coupon rate O/s. Face valueAs on 31/03/2011
Outstanding Amount
ISIN
VII-A 900 10.50% ` 3,12,500/- each ` 28.13 cr INE934B07066IX-A 1500 11.90% ` 10,00,000/- each ` 150.00 cr INE934B07207X- A 400 9.50% ` 10,00,000/- each ` 40.00 cr INE934B07215X- A1 100 9.50% ` 10,00,000/- each ` 10.00 cr INE934B07249X- B 400 9.50% ` 10,00,000/- each ` 40.00 cr INE934B07223X- B1 100 9.50% ` 10,00,000/- each ` 10.00 cr INE934B07256X- C 1200 9.50% ` 10,00,000/- each ` 120.00 cr INE934B07231X- C1 300 9.50% ` 10,00,000/- each ` 30.00 cr INE934B07264
XI 1000 9.50% ` 10,00,000/- each ` 100.00 cr INE934B07272- 1000 10.25% ` 10,00,000/- each ` 100.00 cr INE934B08072
OUTSTANDING GDRs/ADRs OR WARRANTS OR ANY CONVERTIBLE INSTRUMENTS, CONVERSION DATE AND LIKELY IMPACT ON EQUITY
2,77,80,000 warrants carrying an option/entitlement for equivalent number of equity shares ` 1/- each in the Company; were issued in November, on preferential/private placement basis to Promoters/Directors/Entities in which directors were interested in accordance with SEBI Regulations for preferential issue, as approved by shareholders in their meeting held on October 28, 2010. Out of the said issued warrants, one of the warrant holder exercised its option attached to the warrants allotted and acquired 89,00,000 equity shares of ` 1/- each at a premium of ` 54/- per share.
The number of warrants outstanding as at March 31, 2011 were 1,88,80,000.
(x) Share Transfer:Shareholders’/Investors’ Grievances Committee:
The Company has Shareholders’/Investors’ Grievances Committee comprising of one Executive Director and two Non-executive Directors to look after share transfer and other related matters, including the shareholders’ grievances. Mr. Manohar Bidaye, a Fellow Member of Institute of Company Secretaries of India, is the Chairman of the Committee with the other members being, Mr. A. J. Agarwal and Mr. Anil Khanna, both senior members of Institute of Chartered Accountants of India. With effect from May 28, 2011, Mr. K. R. Bharat was appointed as member in place of Mr. Anil Khanna. The Committee normally meets fortnightly and looks into the shareholder & investor grievances that are not settled at the level of the Company Secretary/Compliance Officer and helps to expedite share transfers & related matters. The committee has also delegated power of transfer/transmission; dematerialisation/rematerialisation of shares; issue of duplicate/split/consolidated certificates to expedite relative process.
Twenty nine Meetings of the Committee were held during the year. All the members attended all the meetings.
Shar
e Pr
ice
(`)
Share Price (`) High
Share Price (`) Low
80
75
70
65
60
55
45 40
30
Apr -
10
May
- 1
0
Jun
- 10
Jul -
10
Aug
- 10
Sep
- 10
Oct
- 1
0
Nov
- 1
0
Dec
- 1
0
Jan
- 11
Feb
- 11
Mar
- 1
1
35
Mercator Share Prices at NSE

annual report
2010-11
57
Report on Corporate GovernanceBoard and Management Reports
As at March 31, 2011; Ms. Suchita Shirambekar, Company Secretary and Mr. Deepak Dalvi- Sr. Manager - Secretarial were acting as Compliance Officer.
During the year, the Company received 67 complaints from the shareholders all of which were duly resolved. There were no pending complaints as on 31.03.2011.
Further, during the year requests for transfer of 25,501 equity shares; and for demat of 91,60,500 equity shares were received and processed.
Registrar and Transfer Agents and Share Transfer System:
Link Intime India Private Limited (erstwhile Intime Spectrum Registry Ltd.) having their office at C-13, Pannalal Silk Mills Compound, LBS Road, Bhandup (W), Mumbai - 400 078 (Tel No. 91-22-25963838) and branch office at 203, Dawer House, 197/199, D.N. Road, Mumbai - 400 001 (Tel No. 91-22-22694127) are the Registrar and Transfer Agents (RTA) as also the registrar for electronic connectivity. Entire functions of Share Registry, both for physical transfer, as well as, dematerialization/rematerialization of shares, issue of duplicate/split/consolidation of shares is being carried out by the RTA at their above address.
The correspondence regarding query of dividends shall be addressed to Compliance Officer at the registered office of the Company.
(xi) Distribution of Shareholding as on March 31, 2011:
Shareholding of nominal value of
No. of Shareholders
% to total Shareholders
No. of Shares % to total Capital
Upto 5000 103157 98.01 42397642 17.315001 10000 1056 1.00 7949769 3.2510001 20000 511 0.49 7306381 2.9820001 30000 180 0.17 4504179 1.8430001 40000 84 0.08 2966810 1.2140001 50000 52 0.05 2412143 0.9950001 100000 93 0.09 6594478 2.69100001 and above 118 0.11 170760671 69.73Total 105251 100.00 244892073 100.00
(xii) Shareholding Pattern as on March 31, 2011:
Sr. No Category No. of Shares % to Capital No. of Holders1 Promoters/Directors and their Relatives 98484066 40.22 112 Mutual Funds/UTI 7961664 3.25 173 Banks; FIs etc. 2135190 0.87 54 FIIs 43994012 17.96 515 Private Corporate Bodies 16690530 6.82 14456 Indian Public 70847869 28.93 1018107 NRIs /OCBs 2855880 1.17 16148 Non-promoter Independent Directors
and their relatives496195 0.20 9
9 Clearing members 1426667 0.58 289Total 244892073 100 105251

58
(xii) Dematerialisation Of Securities: The equity shares of the Company are under compulsory trading in demat form. Out of total capital of
24,48,92,073 equity shares; 24,21,17,057 equity shares representing 98.87% were held in demat form and balance 2775016 equity shares representing 1.13% were in physical form as on March 31, 2011. The ISIN of the equity shares of the Company is INE934B01028.
The shares are actively traded on BSE and NSE and the turnover data during the financial year 2010-11; was as under:
Particulars BSE NSE TotalNo of shares 17,67,14,699 55,67,86,101 73,35,00,800Value (` in Lakhs) 97,330.45 3,04,469.73 4,01,800.18
V) CEO/CFO Certification: The necessary certification from Chief Executive Officer, Mr. H. K. Mittal and Chief Financial Officer, Mr. V. S. Mani in
respect of the financial year ended on March 31, 2011 has been annexed to this report.Vi) Compliance: The Company has complied with all the mandatory requirements of Corporate Governance Clause 49 of the Listing
Agreement with Stock Exchanges. Further, the Company has also adopted Remuneration committee requirements out of Non-mandatory requirements of the Clause.
A certificate from the Auditors of the Company regarding compliance of conditions of corporate governance is annexed to the Directors’ Report.
Vii) Plant Locations: The Company does not have any plant. Address for correspondence: Mercator Lines Limited 3rd Floor, Mittal Tower, B-wing, Nariman Point, Mumbai-400 021 Tel Nos: 91-22-66373333 Fax Nos: 91-22-66373344 E-mail: [email protected]/[email protected]
For and on behalf of the Board
H. K. MITTAL Executive Chairman
Regd. Office:3rd Floor, Mittal Tower, B-Wing, Nariman Point, Mumbai-400021Dated.: August 12, 2011
Shareholding Pattern as on March 31, 2011
Mutual Funds/UTI - 3.25%
Banks; FIs etc. - 0.87%FIIs - 17.96%
Private Corporate Bodies - 6.82%
Promoters/Directors and their Relatives - 40.22%
Indian Public - 28.93%
NRIs /OCBs - 1.17%
Non-promoter Independent Directors and their relatives - 0.20%
Clearing members - 0.58%

annual report
2010-11
59
Report on Corporate GovernanceBoard and Management Reports
CEO/CFO Certification
To,
The Board of Directors,
Mercator Lines Limited
Mumbai
This is to certify that:
(a) we have reviewed financial statements for the financial year ended on March 31 2011 and the cash flow statement for the year (consolidated and unconsolidated) and that to the best of their knowledge and belief:
(i) these statements do not contain any materially untrue statement or omit any material fact or contain statements that might be misleading;
(ii) these statements together present a true and fair view of the company’s affairs and are in compliance with existing accounting standards, applicable laws and regulations.
(b) There are, to the best of their knowledge and belief, no transactions entered into by the company during the year which are fraudulent, illegal or violative of the company’s code of conduct.
(c) We accept responsibility for establishing and maintaining internal controls and that we have evaluated the effectiveness of internal control systems of the company and we have disclosed to the auditors and the Audit Committee, deficiencies in the design or operation of such internal controls, if any, of which we are aware and the steps we have taken or propose to take to rectify these deficiencies.
(d) We have indicated to the auditors and the Audit committee
(i) significant changes in internal control during the year, whenever applicable;
(ii) that there were no significant changes in accounting policies during the year and that the same have been disclosed in the notes to the financial statements; and
(iii) that there were no instances of significant fraud of which they have become aware and the involvement therein, if any, of the management or an employee having a significant role in the company’s internal control system.
(e) We further declare that all Board members and Senior Management personnel have affirmed compliance with the Code of conduct for the current year.
For Mercator Lines Limited For Mercator Lines Limited
H. K. MITTAL V. S. MANI Executive Chairman & Designated as Chief Executive Officer Chief Financial Officer
Place: MumbaiDated: May 26, 2011

60
Auditors’ Certificate on Corporate Governance
To the members,
Mercator Lines Limited,
Mumbai
We have examined the compliance of conditions of corporate governance by Mercator Lines Limited for the year ended on March 31, 2011 as stipulated in Clause 49 of the Listing Agreement of the said Company with stock exchange.
The compliance of conditions of corporate governance is the responsibility of the management. Our examination was limited to procedure and implementation thereof, adopted by the Company for ensuring the compliance of the conditions of the corporate Governance. It is neither an audit nor an expression of the financial statement of the company.
We certify that the Company has compiled with the conditions of corporate Governance as stipulated in the above mentioned Listing Agreement.
We state that such compliance is neither an assurance as to the future viability of the Company nor the efficiency or effectiveness with which the management has conducted the affairs of the Company.
For and on behalf of
Contractor, Nayak & Kishnadwala
Chartered Accountants
Firm Registration Number 101961W
Himanshu Kishnadwala
Partner,
Membership No 37391
Mumbai
May 28, 2011

annual report
2010-11
61
Auditors’ ReportStandalone Financial Statements
The Members of
Mercator Lines Limited
1. WehaveauditedtheattachedBalanceSheetofMERCATORLINESLIMITEDasatMarch31,2011,therelatedProfitandLoss Account and the Cash Flow Statement of the Company for the year ended on that date annexed thereto. These financialstatementsaretheresponsibilityoftheCompany’smanagement.Ourresponsibilityistoexpressanopiniononthesefinancialstatementsbasedonouraudit.
2. WeconductedourauditinaccordancewithauditingstandardsgenerallyacceptedinIndia.TheseStandardsrequirethatweplanandperformtheaudittoobtainreasonableassuranceaboutwhetherthefinancialstatementsarefreeofmaterialmisstatements.Anauditincludesexamining,onatestbasis,evidencesupportingtheamountsanddisclosuresinfinancialstatements.Anauditalsoincludesassessingtheaccountingprinciplesusedandsignificantestimatesmadebymanagement,aswellasevaluatingtheoverallfinancialstatementpresentation.Webelievethatourauditprovidesa reasonable basis for our opinion.
3. AsrequiredbytheCompanies(Auditor’sReport)Order,2003,issuedbytheCentralGovernmentintermsofSection227(4A)oftheCompaniesAct,1956,andonthebasisofsuchchecksasconsideredappropriateandaccordingtotheinformationandexplanationsgiventousduringthecourseoftheaudit,weencloseintheAnnexureheretoastatementonthemattersspecifiedinParagraphs4and5ofthesaidOrder.
4. FurthertoourcommentsintheAnnexurereferredtoinaboveparagraph,wereportthat:
a) Wehaveobtainedall the informationandexplanations,whichto thebestofourknowledgeandbeliefwerenecessary for the purposes of our audit;
b) Inouropinion,properbooksofaccount,asrequiredbylawhavebeenkeptbytheCompanysofarasappearsfromourexaminationofthebooksoftheCompany;
c) TheBalanceSheet,ProfitandLossAccountandtheCashFlowStatementdealtwithbythereportareinagreementwiththebooksofaccountoftheCompany;
d) In our opinion, the Balance Sheet, Profit and Loss Account and the Cash Flow Statement comply with themandatoryAccountingStandardsreferredtoinSection211(3C)oftheCompaniesAct,1956.
e) OnthebasisofwrittenrepresentationsreceivedfromthedirectorsoftheCompanyasonMarch31,2011,andtakenonrecordbytheBoardofDirectors,wereportthatnoneofthedirectorsisdisqualifiedasonMarch31,2011,frombeingappointedasadirectorintermsofSection274(1)(g)oftheCompaniesAct,1956.
f) Inouropinionandtothebestofourinformationandaccordingtotheexplanationsgiventous,thesaidaccountsreadtogetherwiththeNotestoAccountsinSchedule‘I’,givetheinformationrequiredbytheCompaniesAct,1956 in themanner so required and give a true and fair view in conformity with the accounting principlesgenerallyacceptedinIndia:
a. In the case of the Balance Sheet, of the state of affairs of the Company as at March 31, 2011;
b. InthecaseoftheProfitandLossAccount,ofthelossfortheyearendedonthatdate,
c. InthecaseoftheCashFlowStatement,ofthecashflowsoftheCompanyfortheyearendedonthatdate.
For and on behalf of
Contractor Nayak & Kishnadwala
Chartered Accountants
FirmRegistrationNo101961W
Himanshu Kishnadwala
Partner,
MembershipNo37391
Mumbai
May 28, 2011
Auditors’ Report

62
Statement referred to in paragraph 3 of the Auditors’ Report of even date to the Members of MERCATOR LINES LIMITED on the accounts for the year ended March 31, 2011.
Onthebasisofsuchchecksasconsideredappropriateandintermsoftheinformationandexplanationsgiventous,westateasunder:
1(a) Thecompanyhasmaintainedproperrecordsshowingfullparticularsincludingquantitativedetailsandsituationofthefixedassets.
1(b) Asexplainedtous,themanagementatreasonableintervalscarriesoutthephysicalverificationofthefixedassets.Thediscrepanciesnoticedonsuchverification,whichwerenotmaterial,havebeenappropriatelydealtwith intheaccounts.
1(c) According to the information and explanations given by themanagement and on the basis of audit proceduresperformedbyus,weareoftheopinionthatthedisposaloffixedassetshasnotaffectedthegoingconcernofthecompany.
2(a) Asexplainedtous,theinventoriesofbunkerandlubehavebeenphysicallyverifiedduringtheyearbythemanagement.In our opinion, having regard to the nature and location of stocks, the frequency of the physical verification isreasonable.
2(b) Inouropinionandaccordingtotheinformationandexplanationsgiventous,theproceduresofphysicalverificationoftheabovementionedinventoryfollowedbythemanagementarereasonableandadequateinrelationtothesizeof the Company and the nature of its business.
2(c) Inouropinion,theCompanyismaintainingproperrecordsofinventoryandnomaterialdiscrepancieswerenoticedonphysicalverification.
3(a) Aspertheinformationandexplanationsgiventous,theCompanyhasnotgrantedanyloans,securedorunsecured,tocompanies,firmsorotherpartiescoveredintheregistermaintainedundersection301oftheCompaniesAct,1956.Hence,provisionsofclauses3(b),3(c),3(d)arenotapplicabletothecompany.
3(e) Aspertheinformationandexplanationsgiventous,theCompanyhasnottakenanyloans,securedorunsecured,fromCompanies,firmsorotherpartiescoveredintheregistermaintainedundersection301oftheCompaniesAct,1956.Hence,provisionsofClauses3(f)and3(g)arenotapplicabletothecompany.
4. Inouropinionandasexplainedtous,thereareadequateinternalcontrolprocedurescommensuratewiththesizeoftheCompanyandthenatureofitsbusinesswithregardtopurchaseofinventoryandfixedassetsandforthesaleofgoodsandservices.Duringthecourseofouraudit,nomajorweaknesshasbeennoticedintheinternalcontrolsystemandthereisnocontinuingfailureforthesame.
5(a) Asperinformationandexplanationsgivenbythemanagementandbasedontheauditproceduresappliedbyus,duringtheyearthecompanyhasnotenteredintoanycontractsorarrangementsreferredtoinsection301oftheAct.Hence,clauses5(a)and5(b)arenotapplicabletothecompany
6. TheCompanyhasnotacceptedanydepositsfrompublicduringtheyear.
7. Inouropinion,theCompanyhasaninternalauditsystemcommensuratewiththesizeoftheCompanyandthenatureof its business.
8. ThemaintenanceofcostrecordshasnotbeenprescribedbytheCentralGovernmentundersection209(1)(d)oftheCompaniesact,1956.
9(a) Accordingtotheinformationandexplanationsgiventousandtherecordsexaminedbyus,theCompanyisregularindepositingwithappropriateauthoritiesundisputedstatutoryduesincludingprovidentfund,investoreducationandprotectionfund,employees’stateinsurance,income-tax,sales-tax,wealth-tax,servicetax,customduty,excise-duty,cessandotherstatutoryduesandtherearenoundisputedstatutoryduesoutstandingasatMarch31,2011,foraperiod of more than six months from the date they became payable.
Auditors’ Report

annual report
2010-11
63
Auditors’ ReportStandalone Financial Statements
9(b) Accordingtotheinformationandexplanationsgiventous,thedisputedstatutoryduesthathavenotbeendepositedonaccountofdisputedmatterspendingbeforeappropriateauthoritiesareasunder:
Name of the Statute Nature of the dues Amounth (`Inlakhs)
Year/s to which the amount relates
Forum where disputeispending
Service Tax under FinanceAct,1994
Service Tax 6,809.00 2006-07to2009-10 Commissioner of Service tax
Income Tax Income Tax 597.47 47.67
2006-07 2002-03
Commissioner of Incometax(Appeals)
(AlsoreferNotes3and4ofScheduleI)
10. ThecompanydoesnothaveanyaccumulatedlossesasonMarch31,2011andhasnotincurredanycashlossesduringthefinancialyearandintheimmediatelyprecedingfinancialyear.
11. Basedontheinformationandexplanationsgiventous,theCompanyhasnotdefaultedinrepaymentofanyduestofinancialinstitutions,banksordebentureholders.
12. Basedonourexaminationof therecordsandasexplainedtous, theCompanyhasnotgrantedany loansand/oradvancesonthebasisofsecuritybywayofpledgeofshares,debenturesandothersecurities.
13. Inouropinion,thecompanyisnotachitfund,nidhi/mutualbenefitfund/society.Theprovisionsofclause4(xiii)aretherefore not applicable to the company.
14. Accordingtotheinformationandexplanationsgiventous,theCompanyhasduringtheyearnotdealingortradingin shares, securities, debentures and other investments. All shares, debentures and other investments are held by the company in its own name
15. According to the informationandexplanationsgiven tous, the termsandconditionsonwhich theCompanyhasgivenguaranteesforloanstakenbysubsidiariesfrombanksandfinancialinstitutionsare,consideringthelongterminvolvementofthecompanyintheseentities,notprejudicialtotheinterestsofthecompany.
16. Accordingtothe informationandexplanationgiventous, term loansraisedduringtheyearwereappliedfor thepurpose for which the loans were obtained.
17. As explained to us and on an overall examination of the balance sheet of the Company, in our opinion there are no fundsraisedonshort-termbasiswhichhavebeenusedforlong-terminvestmentbytheCompany.
18. Accordingtotheinformationandexplanationgiventous,theCompanyhasmadepreferentialallotmentofshares/warrantstopartiescoveredintheregistermaintainedundersection301oftheCompaniesAct,1956atpricesnotprejudicialtotheinterestsofthecompany.
19. Duringtheperiodcoveredbyouraudit,thecompanyhasnotissuedanySecuredDebentures.
20. TheCompanyhasnotraisedanymoneybypublicissuesduringtheperiodcoveredbyourreport.
21. Based upon the audit procedures performed for the purpose of reporting the true and fair viewof the financialstatementsandaspertheinformationandexplanationsgivenbythemanagement,wereportthatnofraudonorbythecompanyhasbeennoticedorreportedduringthecourseofouraudit.
For and on behalf of
Contractor Nayak & Kishnadwala
Chartered Accountants
FirmRegistrationNo101961W
Himanshu Kishnadwala
Partner,
MembershipNo37391
Mumbai
May 28, 2011
Auditors’ Report

64
Amount `inLakhs
Particulars ScheduleAs at
March 31, 2011As at
March 31, 2010
SOURCES OF FUNDS Shareholders Funds Share Capital A 2,448.92 2,359.92WarrantsagainstShareCapital A 1 2,596.00 -Reserves and Surplus B 97,589.28 1,03,034.15
1,02,634.20 1,05,394.07Loan Funds Secured Loans C 1,24,454.07 1,34,186.56Unsecured Loans D 10,000.00 13,159.80
1,34,454.07 1,47,346.36ToTaL 2,37,088.27 2,52,740.43APPLICATION OF FUNDS Fixed assets EGrossBlock 2,13,433.81 2,22,009.09Depreciation (43,464.88) (41,116.39)NetBlock 1,69,968.93 1,80,892.70Investments F 612.18 5,856.34Current assets, Loans & advances GInventories 2,348.64 2,421.55Sundry Debtors 16,070.83 11,896.40CashandBankBalances 44,273.11 66,840.20Loans and Advances 73,451.00 66,941.45
1,36,143.58 1,48,099.60Current Liabilities and Provisions HCurrent Liabilities 69,118.53 82,080.22Provisions 217.58 693.82IncompleteVoyages(Net) 300.31 (665.83)
69,636.42 82,108.21Net Current Assets 66,507.16 65,991.39ToTaL 2,37,088.27 2,52,740.43Significant Accounting Policies & Notes to the Accounts I
Balance Sheet as at March 31, 2011
As per our report of even date For and on behalf of the Board
For Contractor,Nayak&Kishnadwala H.K.Mittal A.J.Agarwal MG.RamkrishnaChartered Accountants Executive Chairman ManagingDirector Director
HimanshuKishnadwalaPartner KapilGarg SuchitaShirambekar
Director Company Secretary
Dated:May28,2011 Dated:May28,2011Place:Mumbai Place:Mumbai

annual report
2010-11
65
Standalone Financial StatementsBalance Sheet | Profit and Loss Account
Profit and Loss Account for the year ended on March 31, 2011
As per our report of even date For and on behalf of the Board
For Contractor,Nayak&Kishnadwala H.K.Mittal A.J.Agarwal MG.RamkrishnaChartered Accountants Executive Chairman ManagingDirector Director
HimanshuKishnadwalaPartner KapilGarg SuchitaShirambekar
Director Company Secretary
Dated:May28,2011 Dated:May28,2011Place:Mumbai Place:Mumbai
Amount ` inLakhs
Particulars ScheduleYear Ended
March 31, 2011Year Ended
March 31, 2010
INCOME ShippingIncome J 63,724.08 57,628.70Other Income K 175.39 450.77Profit/(loss)onSaleofInvestments(Net) 18.41 (3.00)Profit/(loss)onSaleofAssets(Net) (3.24) 11,914.07ToTaL 63,914.64 69,990.54EXPENSES ShipOperatingExpenses L 50,184.47 41,823.67Administrative and Other Expenses M 2,872.40 3,876.70FinanceCharges N 8,599.03 9,493.97Depreciation 11,662.55 13,711.63ToTaL 73,318.45 68,905.97Profit / (Loss) Before Taxes (9,403.81) 1,084.57Provision for Taxation Current Tax (400.00) (2,195.00)MAT Credit Entitlement - 1,750.00Profit /(Loss) After Taxes (9,803.81) 639.57Short Provision for Tax of earlier Year 6.74 -Balancebroughtforwardfromlastyear 11,749.03 28,629.83Available for Appropriations 1,951.96 29,269.40Less/(Add):AppropriationsTransfertoGeneralReserve - 100.00 Transfer to Debenture Redemption Reserve - 16,870.00ProposedDividendonEquityShares - 471.98Tax on Dividend - 78.39Balance Carried to Balance Sheet 1,951.96 11,749.03EarningPerShare(EquityShareof`1/-Each)Basic (4.12) 0.27Diluted (4.12) 0.27Significant Accounting Policies & Notes to the Accounts I

66
Cash Flow Statement for the year ended March 31, 2011
Amount `Lakhs
Particulars Current Year Previous Year
CASH FLOw FROM OPERATINg ACTIvITIES Net(Loss)/ProfitBeforeTax (9,403.81) 1,084.57Adjustmentfor:Depreciation 11,662.55 13,711.63Interest Paid 8,599.03 9,493.97(Profit)/LossonFixedAssetsScrapped/Sold 3.24 (11,914.07)(Profit)/LossonSaleofInvestment (18.41) 3.00Dividend Income (31.39) (300.36)Operating Profit before Working Capital Changes 10,811.21 12,078.74Adjustmentfor:Trade and Other Receivables (10,358.09) 10,505.80Trade Payables (12,471.80) (41,131.95)CashGeneratedfromOperations (12,018.68) (18,547.41)Direct Taxes Paid (393.25) (445.00)Total Cash Generated from Operating Activites (12,411.93) (18,992.41)CASH FLOw FROM INvESTINg ACTIvITIES AcqusitionofFixedAssetsincludingCapitalWorkinProgress (9,954.79) (5,656.68)Sale of Fixed Assets 9,212.77 56,043.42Proceed from sale of Non Trade Investments 18.41 (3.00)(Purchase)/saleofInvestment 5,244.16 (1,513.55)Dividend Income 31.39 300.36NetCashfromInvestingActivities 4,551.95 49,170.55CASH FLOw FROM FINANCINg ACTIvITIES Proceeds from Issue of Share Capital from conversion of Bonds and warrants 2,685.00 (1,667.25)ProceedsfromLongTermBorrowings (12,892.29) 6,052.55Increase/Decrease in Reserves 4,352.20 (4,150.30)Interest Paid (8,599.03) (9,493.97)DividendsPaidincludingtaxthereon - (550.37)NetCashfromFinancingActivities (14,454.12) (9,809.34)
NetIncreaseinCashandCashEquivalents (22,314.11) 20,368.80CashandCashEquivalentsasatbeginningoftheyear(AsperScheduleG) 67,527.51 5,730.18CashandCashEquivalentsasatendoftheyear(AsperScheduleG) 45,213.40 67,527.51CashandCashEquivalentscompriseof:CashandBankBalances(ReferScheduleG) 44,273.11 66,840.20AccruedInterestonfixeddepositwithbanks 940.29 687.31
Notes: 1) Figuresinbracketrepresentoutflows 2) Cashandcashequivalentsinclude: (a) Gain/(loss)onforeignexchangerevaluationof`86.84Lakhs(PreviousYearlossof`258.98Lakhs). (b) FixedDepositof` 36019.50Lakhs(PreviousYear` 37979.34Lakhs)asmargindepositagainstanacceptance. (c) Unclaimeddividendaccountof`77.17(Pr.Yr.73.82)whicharenotavialbleforusebythecompany.3) PreviousYear’sfigureshavebeenrecast/restatedwherevernecessary.
As per our report of even date For and on behalf of the Board
For Contractor,Nayak&Kishnadwala H.K.Mittal A.J.Agarwal MG.RamkrishnaChartered Accountants Executive Chairman ManagingDirector Director
HimanshuKishnadwalaPartner KapilGarg SuchitaShirambekar
Director Company Secretary
Dated:May28,2011 Dated:May28,2011Place:Mumbai Place:Mumbai

annual report
2010-11
67
Standalone Financial StatementsCash Flow Statement | Schedules
Schedules formingpartofAnnualAccounts
Amount `inLakhs
Particulars Current Year Previous Year
SCHEDULE ‘A’ Share Capital Authorised 35,00,00,000EquitySharesof`1/-each. 3,500.00 3,500.00200,00,000 Preference Shares of ` 100 each. 20,000.00 20,000.00
23,500.00 23,500.00Issued Capital 24,48,92,073(23,59,92,073)EquitySharesof`1/-eachfullypaidup 2,448.92 2,359.92
2,448.92 2,359.92Subscribed and Paid Up Capital Equity24,48,92,073(23,59,92,073)EquitySharesof`1/-eachfullypaidup. 2,359.92 2,359.92(a)89,00,000sharesof`1/-allotedonexerciseofoptionofconversionof89,00,000warrantsissuedonpreferentialbasisduringtheyear.
89.00
(b)11,83,45,500sharesof`1/-wereallotedasbonusSharesbycapitalisationofSecuritiesPremiumAccountduringtheyear2005-06.
2,448.92 2,359.92SCHEDULE ‘A1’ Warrants against Share Capital 1,88,80,000 warrants of face value of `13.75each 2,596.00 -Duringtheyear2,77,80,000warrants(eachwarrantcarryingoption/entitlementtosubscribe1numberofequityshareof`1/-each)onorbefore May 2012 at a price of `55/-persharewereallottedonpreferentialbasis.Outoftheseoptionforconversionof89,00,000warrantswasexcercisedduringtheyear.
2,596.00 -
SCHEDULE ‘B’ Reserves and Surplus Capital Reserve As per last Balance Sheet 1,693.49 26.24Add:TransferfromShareWarrantApplicationmoneyonforfeitureofWarrants - 1,667.25
1,693.49 1,693.49Capital Redempetion Reserve As per last Balance Sheet 4,000.00 4,000.00(Createdintheyear2007-08onRedemptionofPreferenceshares) -
4,000.00 4,000.00 Securities Premium account As per last Balance Sheet 31,765.21 32,557.57Add:Receivedduringtheyearonconversionofwarrants 4,806.00 -Less:PremiumpaidonredemptionofFCCBs (91.39) (792.36) Less:Expensesonissueofsharespursuanttoconversionofwarrantsduringtheyear (4.90)Less:PremiumpayableonredemptionofUnsecureddebentures (18.35) -
36,456.57 31,765.21Tonnage Tax Reserve As per last Balance Sheet - 5,700.00Less:TransferredtoUtilisedAccount - (5,700.00)
- -

68
Schedules formingpartofAnnualAccounts
Tonnage Tax Reserve (Utilised) As per last Balance Sheet 17,524.83 11,824.83Add:TransferfromTonnageTaxReserve - 5,700.00
17,524.83 17,524.83Debenture Redemption Reserve As per last Balance Sheet 26,970.00 10,100.00 Add:TransferredfromprofitandLossAccount - 16,870.00Less:TransferredtoGeneralReserve (5,637.50) -
21,332.50 26,970.00General Reserve As per last Balance Sheet 7,756.83 7,656.83Add:TransferredFromProfitandLossAccount - 100.00 Add:TransferredFromDebentureRedemptionReserve 5,637.50
13,394.33 7,756.83Foreign Exchange Fluctuation Reserve As per last Balance Sheet 1,574.76 6,571.15Less:ExchangefluctuationonLongTermLoansinrelationtononintegralforeignoperations(Net)
(631.76) (4,996.39)
Add:TransfertoProfit/LossAccount 292.60 1,235.60 1,574.76
SurplusinProfitandLossAccount 1,951.96 11,749.03 97,589.28 1,03,034.15
Amount `inLakhs
Particulars Current Year Previous Year
SCHEDULE ‘B’
SCHEDULE ‘C’ Secured Loans (A) Debentures
(1) 900(900)10.50%(11.25%uptoJune30,2009)NonConvertibleSecured Debentures of ` 3,12,500/- (` 4,37,500/-) each,redeemablein12halfyearlyinstalmentsof6.25%andlasttwoof12.50%offacevaluefo` 10,00,000/-eachcommencingfromsix months after one year from the date of allotment i.e. June 30, 2004towardfacevalueSeriesVIIA.Thereisaput/calloptiononJune 30th every year.
2,812.50 3,937.50
(2) 150011.90%NonConvertibleSecuredDebenturesSeriesIXAof`10,00,000/-eachwiththetenorof10years,redeemablein3yearlyinstalmentsattheendof8th,9thand10thyearfromthedateofallotment(i.eNovember4,2008).Thereiscalloptionattheendof4thyearfromthedateofallotment.Intheevent,thiscalloptionisnotexercisedbytheIssuerattheendof4thyear,the couponon the debentures would be increased to 12.35%p.a payable half yearly effective immediately there after for the balance tenor.
15,000.00 15,000.00
(3) 25009.50%NonConvertibleSecuredDebenturesSeries(NCDs)X of`10,00,000/- eachwiththetenorof5years, redeemablein3yearlyinstalmentsattheendof3rd,4thand5thyearfromthedateofallotment (i.e October9,2009for2000NCDsandOctober22,2009for500NCDs).
25,000.00 25,000.00

annual report
2010-11
69
Standalone Financial StatementsSchedules
Schedules formingpartofAnnualAccounts
(4) 1000 9.50% Non Convertible Secured Debentures Series XI of `10,00,000/-eachwiththetenorof5years,redeemableattheendof5thyearfromthedateofallotment(November17,2009).
10,000.00 10,000.00
(B) Foreign Currency Loans from Banks(1) ExternalCommercialBorrowings 9,488.13 13,699.99(2) ForeignCurrencyNon-Resident(B)LoanScheme 12,691.32 14,968.42
(C) Term Loans from Scheduled Banks 48,098.80 44,198.80(D) working Capital facilities from Scheduled Banks 1,363.32 7,381.85
1,24,454.07 1,34,186.56Note:1) Debenturesreferredin(A)abovearesecuredbyfirstmortgage
onspecifiedvesselsofthecompanyonpari-passubasiswithotherlendersandfirst/pari-passuchargeonthespecifiedimmovableproperties.
2) Foreign Currency Loan refered in (B) above are secured byfirstChargeon specified vesselsof the companyonpari-passubasis with other lenders and also include a External Commercial Borrowings of ` 9488.13 Lakhs (` 10,269.35 Lakhs) which issecuredbyexclusivechargeonspecifiedvesselsofthecompany.
3) Term Loan refered in (C)above are secured by first charge onspecifiedvessels,onparipassubasiswithotherlenders.
4) Working capital facilities from Scheduled Banks are securedby second charge on specified vessels and 1st charge on allreceivables and other current assets of the company on pari-passu basis.
Amount `inLakhs
Particulars Current Year Previous Year
SCHEDULE ‘C’
SCHEDULE ‘D’ Unsecured Loans 1) NIL(700)1.50%ForeignCurrencyConvertibleBondsofUSD10,000each - 3,159.802) Commercial Paper (Maximum balance outstanding for commercial
paper `10,000Lakhs(`10,000Lakhs)) - 10,000.00
3) 1000 - 10.25% Non convertible Redeemable Debentures of ` 10,00,000 each redeemable in January 2012 with 1% redemptionpremium
10,000.00 -
(Amountrepayablewithinoneyear`10,000Lakhs(` 10,000Lakhs)) - -
10,000.00 13,159.80

70
Schedules formingpartofAnnualAccounts
SCH
EDU
LE E
Fixe
d a
sset
s
Am
ount
` in
Lak
hsF
Cost
Dep
reci
atio
nN
et B
lock
Net
Blo
ckPa
rtic
ular
sAs
at
April
1,
2010
Addi
tion
for
the
year
Ded
uctio
n fo
r the
yea
ra
s at
M
arch
31
, 201
1
Upt
o M
arch
31,
20
10
Adjustment
in re
spec
t of
Asse
ts S
old/
Dis
card
ed /
held
for
disp
osal
For t
he
Year
Up
to
Mar
ch
31, 2
011
as
at
Mar
ch
31, 2
011
As a
t M
arch
31
, 201
0
Land
11.
31
-
-
11.
31
-
-
-
-
11.
31
11.
31
OfficePremises(ReferNote1,2)
344.28
-
-
344
.28
115.04
-
11.46
126
.50
217
.78
229.24
Vessels(ReferNote3,4)
2,20,896.17
9,907.32
18,514.81
2,1
2,28
8.68
40,551.76
9,308.11
11,550.84
42,
794.
49
1,6
9,49
4.19
1,80,344.41
OfficeandCom
puterEquipments
211
.88
8.47
-
220
.35
126.78
-
20.
81
147
.59
72.
76
85.09
Furn
iture
and
Fix
ture
s 3
17.2
2 -
2.65
314
.57
198.02
2.1
2 50.11
246
.01
68.
56
119.20
Vehi
cles
228
.23
38.99
12.60
254
.62
124.79
3.8
3 29.33
150
.29
104
.33
103.44
Plan
t and
mac
hine
ry-
-
-
-
-
-
-
-
-
-
TOTA
L2,22,009.09
9,954.78
18,530.06
2,1
3,43
3.81
41,116.39
9,314.06
11,662.55
43,
464.
88
1,6
9,96
8.93
1,80,892.69
Prev
ious
Yea
r2,39,581.03
10,570.80
28,142.74
2,2
2,00
9.09
37,478.73
10,073.9613,711.63
41,
116.
39
1,8
0,89
2.70
2
,02,
102.
30
CapitalW
orkInProgress
(ReferNote4)
-
-
-
--
-
-
-
-
-
Not
e
1)
Includescostof10sharesof`50/-eachfullypaidinMittalTowerPremisesCo-op.SocietyLtd.
2)
Officepremiseshavinggrossvalue`343.16/-Lakhs(`
343.16/-Lakhs)andaccum
ulateddepreciation
` 126.11Lakhs(`
114.68/-Lakhs)aregivenonoperatingLease.
3)
DeductionincludesexchangefluctuationgainonLongtermforeigncurrencyloans`
385.52Lakhs(11,685.99)(AlsoreferN
ote26OfScheduleI)
4)
DuringtheyearendedM
arch
31,
201
0,theCompanyhassoldoneofitsvesselsM.T.PremputlitoasubsidiaryoftheCompany.ThisvesselwasclassifiedasAssetheldfordisposal
intheearlieryearasitwasunderconversion.Thebreakupofthecostsincurredforthesam
eisasunder:
Amou
nt `inLakhs
Part
icul
ars
Curr
ent Y
ear
Prev
ious
Yea
r
WD
V as
on
date
of t
rans
fer t
o As
set h
eld
for d
ispo
sal
--
BalanceasonApril1,2009
-26,060.57
Furt
her C
osts
incu
rred
-
6532.73
Furt
hr e
stim
ated
Cos
ts to
be
incu
rred
in fu
ture
--
TOTA
L-
32,593.30

annual report
2010-11
71
Standalone Financial StatementsSchedules
ParticularsCurrent Year Previous Year
Nos Cost Nos Cost
SCHEDULE FInvestmentsItemsNon-Trade (Unquoted)Long Term (At cost) In shares of Subsidiaries MercatorOilandGasLtd 1,50,000 15.00 1,50,000 15.00Mercator International Pte Ltd 1,00,000 28.80 1,00,000 28.80 Mercator Offshore Ltd - - - -MercatorOffshoreHoldingsPte.Ltd** 1 - 1 -Mercator Petroleum Private Ltd 89,000 8.90 89,000 8.90MercatorOffshore(Nigeria)PteLtd 13,992 4.57 - -Note:1) The Company has agreed to maintain its
beneficial stake of 100% in its subsidiary viz.MercatorInternationalPte.Ltd.andupto51%insubsidiary /step down subsidiary viz.MercatorOffshore(Nigeria)Pte.Ltd.;andMercatorLines(Singapore)ltd.totherespectivelendersundertheirfinancialassistance.**Cost`51/-In shares of Companys (Unquoted) MargSwarnabhoomiPortPrivateLtd 1,250 0.13 1,250 0.13
57.40 52.83In others (Unquoted)Units of Indian Real Opportunity Venture Capital Fund 40,479 404.78 50,000 500.00
404.78 500.00 462.18 552.83
Current Investments (at lower of cost and Market value) In units of Mutual Funds (Quoted) AxisEquityFund-DividendOption 5,00,000 50.00 5,00,000 50.00SBIMagnumInstaCashFundDailyDividend 5,97,004 100.00 3,13,63,754 5,253.52Sub Total 150.00 5,303.52(RepurchaseValueofcurrentinvestmentsonMarch31,2011 is `150.00Lakhs(PreviousYear`5,303.52Lakhs)grand Total 612.18 5,856.35
Schedules formingpartofAnnualAccounts

72
Amount ` inLakhs
Particulars Current Year Previous Year
SCHEDULE ‘g’ Current assets Sundry Debtors (Unsecured,ConsideredGood)Over Six Months 8,371.19 6,717.74Others 7,699.64 5,178.66(Includes` 2.06Lakhs(`42.63Lakhs)duefromSubsidiaryCompanies)
16,070.83 11,896.40Cash and Bank Balances Cash in hand 3.31 6.19BalanceswithScheduledBanksIn Fixed Deposit Accounts 43,121.08 37,979.34(IncludesMarginDepositof` 36,019Lakhs(` 37979.34Lakhs)givenagainstAcceptances/BankGuranteeissuedbybanks.)In Current Accounts 619.05 16,625.53InExchangeEarnersForeignCurrencyAccount 32.19 9,879.57In Dividend Accounts 77.17 73.82 BankBalance/FixedDepositswithForeignBanks(ReferNoteB(11)ofScheduleI) 420.31 2,275.75
44,273.11 66,840.20Loans and advances (UnsecuredConsideredGood)Loan to Subsidiary Companies 56,564.15 55,324.91TheloansgrantedbytheCompanytoitssubsidiariesviz.MercatorInternationalPte.Ltd.andMercatorOffshore(Nigeria)Pte.Ltd.;issubordinated to the loans availed by the subsidiaries from their respective lenders with stipulation on repaymentsAdvancesrecoverableincashorinkindorforvaluetobereceived 10,560.18 6,592.26DepositswithGovernmentandsemiGovernmentBodies 17.28 16.93Inter Corporate Deposits 1,253.39 268.98Other Deposits 927.71 1,000.89AccruedInterestonfixeddepositwithbanks 940.28 687.31Advancepaymentoftax(Netofprovisions) 1,653.01 1,300.15MAT Credit available 1,535.00 1,750.00
73,451.00 66,941.43
Schedules formingpartofAnnualAccounts

annual report
2010-11
73
Standalone Financial StatementsSchedules
Amount `inLakhs
Particulars Current Year Previous Year
SCHEDULE ‘H’ Current Liabilities Sundry Creditors For Services and expenses DuetoMicroandSmallEnterprises(ReferNoteB(9)ofScheduleI) - -Others 4,752.52 6,411.19Acceptances 55,879.48 69,538.17Advances from Customers 165.66 128.34Deposits 4.20 4.20UnclaimedDividend* 77.17 73.82 Other liabilities 8,239.50 5,924.51*(ThereisnoamountdueandoutstandingtobecreditedtoInvestorEducationandProtectionFund)
69,118.53 82,080.23
Provisions Proposed Dividend - 471.98Tax on Proposed Dividend - 78.39EmployeesRetirementBenefits 217.58 143.45
217.58 693.82
Schedules formingpartofAnnualAccounts
SCHEDULE ‘J’ Shipping and related Income Freight 43,143.66 22,915.81Charter Hire 13,423.72 26,633.47DispatchandDemurrage 1,999.50 1,322.88 Shipmanagementfees 168.38 576.05CargoHandlingServices 4,988.82 6,180.49
63,724.08 57,628.70
SCHEDULE ‘K’ other Income Dividend from Current Investments 31.39 306.37Rent Received 144.00 144.00Miscellaneous Income - 0.40
175.39 450.77

74
Amount ` in Lakhs
Particulars Current Year Previous Year
SCHEDULE ‘L’ Ship Operating Expenses Bunker Consumed 14,284.87 13,912.23 Vessel /Equipment hire charges 15,575.62 5,715.46 Technical Service Expenses 4,342.85 4,842.79 Agency, Professional and Service charges 639.58 558.82 Crew expenses 2,050.16 2,313.64 Communication expenses 124.30 117.13 Miscellaneous expenses 808.02 383.31 Commission 351.08 167.63 Insurance 678.68 1,046.26 Port expenses 2,413.81 3,586.96 Repairs and Maintenance 6,807.90 6,775.73 Stevedoring, Transport and Freight 2,107.60 2,403.71
50,184.47 41,823.67
SCHEDULE ‘M’ Administrative and Other Expenses Advertisement 4.29 9.36 Auditors Remuneration 32.35 24.25 Conveyance, Car Hire and Travelling 206.77 158.52 Communication expenses 46.95 54.23 Donation 0.60 5.36 Directors' Remuneration 101.40 100.60 Miscellaneous expenses 260.55 316.60 Exchange Fluctuations (Net) 425.22 1,600.83 Insurance 21.34 14.98 Legal, Professional and Consultancy expenses 132.61 171.73 Rent 407.47 395.56 Repairs and Maintenance 69.93 67.89 Salary, Wages, Bonus etc. 1,045.92 870.85 Staff Welfare, Training etc. 65.38 59.04 Contribution to Provident and other funds 49.21 46.63 Bad Debts and other amounts written off/back (Net) 2.41 (19.73)
2,872.40 3,876.70
SCHEDULE ‘N’ Finance Charges Interest on Debentures 5,652.69 3,733.77 Loans 9,272.44 12,223.12
14,925.13 15,956.89 Less : Interest received (TDS ` 201.46 Lakhs Previous Year ` 228.14 Lakhs) (6,326.10) (6,462.92)
8,599.03 9,493.97
Schedules forming part of Annual Accounts

annual report
2010-11
75
Standalone Financial StatementsSchedules
SCHEDULE ‘I’
A. Significant Accounting Policies
1. Basis of Accounting Thefinancialstatementsarepreparedunderthehistoricalcostconvention,ontheaccrualbasisofaccounting
andinconformitywithGenerallyAcceptedAccountingPrinciplesinIndia,AccountingStandardsasnotifiedbytheCompanies(AccountingStandards)Rules,2006andtheotherrelevantprovisionsoftheCompaniesAct,1956.
2. Use of Estimates Thepreparationoffinancialstatements inconformitywithGenerallyAcceptedAccountingPrinciples requires
themanagementtomakeestimatesandassumptionsthataffectthereportedbalancesofassetsandliabilitiesasof thedateof thefinancial statementsandreportedamountsof incomeandexpensesduringtheperiod.Themanagementbelievesthattheestimatesusedinthepreparationoffinancialstatementsareprudentandreasonable.
3. Fixed Assets a) Fixedassetsarestatedatcostlessaccumulateddepreciation.
b) Costincludescostofacquisitionorconstructionincludingattributableborrowingcost,dutiesandotherincidentalexpensesrelatedtotheacquisitionoftheasset.
c) Operatingcostsandotherincidentalcostsincludinginitialstoresandsparesofnewlyacquiredvesselstilltheportoffirstloadingareincludedinthecostoftherespectivevessels.
d) Exchangedifferencesarisingonrepaymentofforeigncurrencyloansandyearendtranslationofforeigncurrencyliabilitiesrelatingtoacquisitionofdepreciableassetsare,followingoptiongivenbynotificationofMinistryofCorporateAffairs(MCA)dated.March31,2009,adjustedtocarryingcostoftherespectivefixedassets.
e) Individualfixedassetscostingupto`25,000arefullywrittenoff.
4. Depreciation a) DepreciationonallthevesselsiscomputedonStraightLineMethodsoastowriteofftheoriginalcostas
reduced by the expected/estimated scrap value over the balance useful life of the vessels or the rates as prescribedundertheScheduleXIVoftheCompaniesAct,1956,whicheverarehigher.Thesaidhigherraterangesfrom5%to9%oftheoriginalcostofthevessel.
b) DepreciationonallassetsotherthanvesselsiscomputedontheWrittenDownValuemethodinthemannerandattheratesprescribedunderscheduleXIVoftheCompaniesAct,1956.
c) Onadditionsmadetotheexistingvesselsdepreciationisprovidedforthefullyearovertheremainingusefullife of the ships.
d) Depreciationonfurniture,fixturesandelectricalfittingsinstalledatofficepremisestakenonleaseisprovidedover the initial period of lease.
5. Capital work in Progress All expenditure, including advances given to contractors and borrowings cost incurred during the vessel
acquisitionperiod,areaccumulatedandshownunderthisheadtillthevesselisputtocommercialuse.
6. Retirement and Disposal of Ships a) Profitsonsaleofvesselsareaccountedforoncompletionofsalethereof.
b) Assetswhichareretiredfromactiveuseandareheldfordisposalarestatedattheloweroftheirnetbookvalue or net releasable value.
Schedules formingpartofAnnualAccounts

76
7. Inventories BunkerandLubesonvesselsarevaluedatlowerofcostandNetRealisableValueascertainedonFirstinFirstoutbasis.
8. Investments a) InvestmentsareclassifiedintoLongTermandCurrentinvestments.
b) LongTermInvestmentsarestatedatcostofacquisitionandrelatedexpenses.Provisionfordiminution,ifany,inthevalueofsuchinvestmentsismadetorecogniseadecline,otherthanofatemporarynature.
c) CurrentInvestmentsarestatedatcostofacquisitionincludingincidental/relatedexpensesoratfairvalueasatMarch312011,whicheverislessandtheresultantdecline,ifany,ischargedtorevenue.
d) InvestmentinsharesofsubsidiariesoutsideIndiaisstatedatcostbyconvertingattherateofexchangeatthetimeoftheiracquisition.
9. Incomplete voyages Incompletevoyagesrepresentfreightreceivedanddirectoperatingexpensesonvoyageswhicharenotcompleteas
at the Balance Sheet date.
10. Borrowing Costs Borrowingcostsincurredfortheacquisitionofvesselsarecapitalizedtillfirstloadingofcargo,onlyifthetimegap
betweendateofMemorandumofAgreementand“Datewhenvesselisreadyforuse”ismorethanthreemonths.
Incidentalexpensesrelatedtoborrowingareamortizedoverthetermofthesaidborrowings.
11. Revenue Recognition a) Incomeonaccountoffreightearningsisrecognisedinallcaseswhereloadingofthecargoiscompleted
beforethecloseoftheyear.Allcorrespondingdirectexpensesarealsoprovided.
b) Whereloadingofthecargoisnotcompletedbeforethecloseoftheyear,revenueisnotrecognisedandthecorrespondingexpensesarecarriedforwardtothenextaccountingyear.
c) Incomefromcharterhireanddemurragearerecognisedonaccrualbasis.
d) Incomefromservicesisaccountedonaccrualbasisasperthetermsoftherelevantagreement.
e) Dividendoninvestmentsisrecognisedwhentherighttoreceivethesameisestablished.
f) Insuranceclaimsareaccountedonaccrualbasiswhenthereisareasonablecertaintyoftherealisabilityofthe claim amount.
12. Foreign Exchange Transactions a) MonetaryCurrentassetsandliabilitiesdenominatedinforeigncurrencyoutstandingattheendoftheyear
are valued at the rates prevalent on that date.
b) ExchangedifferencesarisingonLongTermForeignCurrencyMonetary(LTFCM)itemsare,followingoptiongivenbynotificationofMCAdatedMarch31,2009,treatedinthefollowingmanner:
i. Inrespectofborrowingsrelatingtoorutilizedforacquisitionofdepreciablecapitalassets,thesameisadjustedto the cost of the relevant capital asset and depreciated over the balance life of the said capital asset.
ii. Inothercases,thesameisaccumulatedina‘ForeignCurrencyMonetaryItemTranslationDifferenceAccount’.Theamountsoaccumulatedinthisaccount isamortizedoverthebalanceperiodofsuchassets / liabilities or March 31, 2011, whichever is earlier.
c) DifferencesintranslationofothermonetaryassetsandliabilitiesandrealisedgainsandlossesonforeigncurrencytransactionsarerecognisedintheProfitandLossAccount.
d) Exchangedifferencesarisingonlongtermforeigncurrencyloansgiventononintegralforeignoperationsis
Schedules formingpartofAnnualAccounts
annual report
2010-11
77
Standalone Financial StatementsSchedules
accumulatedinForeignCurrencyFluctuationReserve.Ondisposalofinvestment,thebalanceinthereserveistransferredtoprofitandlossaccount.
e) Contractsinthenatureofforeigncurrencyswaps,areconvertedattheexchangerateprevailingasonMarch31,2011andtheprofitsorlossthereonarechargedtotheProfitandLossaccount.
f) DifferencesonaccountofswapcontractsforinterestpayableinforeigncurrencyareaccountedonaccrualbasisandtheprofitorlossthereonchargedtotheProfitandLossaccount.
13. Employees Benefits a) Short–termemployeebenefits
Allemployeebenefitspayablewhollywithintwelvemonthsofrenderingtheserviceareclassifiedasshorttermemployeebenefits.Benefits suchas salaries,wages,performance incentives,etc.are recognisedatactual amounts due in the period in which the employee renders the related service.
b) Post–employmentbenefits
i. DefinedContributionPlans
PaymentsmadetodefinedcontributionplanssuchasProvidentFundarechargedasanexpenseasthey fall due.
ii. DefinedBenefitPlans
Thecostofprovidingbenefiti.e.gratuityisdeterminedusingtheProjectedUnitCreditMethod,withactuarialvaluationcarriedoutasatthebalancesheetdate.ActuarialgainsandlossesarerecognisedimmediatelyintheProfitandLossAccount.
c) OtherLong–termemployeebenefits
i. OtherLong–termemployeebenefitviz.leaveencashmentisrecognisedasanexpenseintheprofitandlossaccountasandwhenitaccrues.ThecompanydeterminestheliabilityusingtheProjectedUnitCreditMethod,withactuarialvaluationcarriedoutasatthebalancesheetdate.Theactuarialgainsandlossesinrespectofsuchbenefitarechargedtotheprofitandlossaccount.
14. Lease Accounting a) InrespectofoperatingleaseagreementsenteredintobytheCompanyasalessee,theleasepaymentsare
recognisedasexpenseintheprofitandlossaccountovertheleaseterm.
b) InrespectofoperatingleaseagreemententeredintobytheCompanyasalessor,theinitialdirectcostsarerecognisedasexpensesintheyearinwhichtheyareincurred.
15. Earning per share: Thecompanyreportsbasicanddilutedearningspershare(EPS)inaccordancewithAccountingStandard–20.
TheBasic EPShasbeen computedbydividing the incomeavailable toequity shareholdersby theweightedaveragenumberofequitysharesoutstandingduringtheaccountingyear.ThedilutedEPShavebeencomputedusingtheweightedaveragenumberofequitysharesanddilutivepotentialequitysharesoutstandingattheendof the year.
16. Provision for Taxation : a) ThecompanyhasoptedfortheTonnageTaxschemeandprovisionfortaxhasbeenaccordinglymadeunder
therelevantprovisionsoftheIncomeTaxAct,1961.
b) TaxonincomesonwhichtheTonnageTaxisnotapplicableisprovidedasperotherprovisionsoftheIncomeTaxAct,1961.
Schedules formingpartofAnnualAccounts
78
c) Deferredtaxresultingfromtimingdifferences,ifany,betweenbookandtaxprofitsforincomeotherthan thatcoveredunderTonnageTaxschemeisaccountedforundertheliabilitymethod,atthecurrentrateof tax,totheextentthatthetimingdifferencesareexpectedtoreverseinfuture.
17. Impairment of assets The Company reviews the carrying values of tangible and intangible assets for any possible impairment at each
balancesheetdate.Impairmentloss,ifany,isrecognizedintheyearinwhichimpairmenttakesplace.
18. Provisions and Contingent Liabilities: Provisionsarerecognized intheaccounts inrespectofpresentprobableobligations,theamountofwhichcanbe
reliablyestimated.ContingentLiabilitiesaredisclosedinrespectofpossibleobligationsthatarisefrompasteventsbuttheirexistenceisconfirmedbytheoccurrenceornonoccurrenceofoneormoreuncertainfutureeventsnotwhollywithin the control of the Company.
19. Premium on redemption of Bonds / Debentures Premiumonredemptionofbonds/debenturesisadjustedagainstSecuritiesPremiumAccount.
B] Notes To The Accounts1. Contingent Liabilities not provided for
`inLakhs
Current Year Previous Year
CounterguaranteesissuedbytheCompanyforguaranteesobtainedfrombank
2,573.94 2,305.53
Corporateguaranteesissuedbythecompanyonbehalfofwhollyowned subsidiaries
49,828.28 19,635.90
TOTAL 52,402.22 21,941.43
2. Letters of comfort issued`inLakhs
Current Year Previous Year
Letters of comfort issued by the company on behalf of wholly owned / step down subsidiaries.
50,231.25 104,950.50
3. Duringourearlieryear,thecompanyhasreceivedShowCausecumDemandnoticesfromtheCommissionerofservicetaxaggregatingto`6,809LakhsforFY2006-07toFY2009-10.TheCompanyhasfileditsreplyagainstthesaid notices. There is no further communication for the same from the authorities. The company is advised that the saiddemandislegallyunsustainableandhencetheCompanydoesnotexpectanyliabilityinthematter.
4. No provision has beenmade in respect of disputed demands from Income-tax Authorities to the extent of`645.14Lakhs(`37.73Lakhs),sincethecompanyhasreasonstobelievethatitwouldgetreliefattheappellatestageasthesaiddemandsareexcessiveanderroneous.
5. Estimated amount of contracts remaining to be executed on capital accounts and not provided for (net ofadvances)asatMarch31,2011`NIL(`NIL).
Schedules formingpartofAnnualAccounts

annual report
2010-11
79
Standalone Financial StatementsSchedules
6. Investments purchased and sold during the financial year 2010-11Amount `inLakhs
Quantity PurchaseSr. No.
MF House Name Scheme (Units) Amount Sold Amount
1 AxisLiquidfund AxisEquity Fund-DividendOption
1,000,265.23 (NIL)
10,003.34 (NIL)
10,003.34 (NIL)
2 Birla Sun Life Mutual Fund
BirlaSunLifeCashPlus-Instl.Prem-DDR
NIL (94,161,881.98)
NIL (9,434.55)
NIL (9,434.55)
BirlaSunLifeSavings Fund-Inst.-DDR
NIL (74,385,914.97)
NIL (7,443.65)
NIL (7,443.65)
3 Deutsche Asset Management Mutual Fund
DWS Insta Cash Plus Fund-SIP-DDR
NIL (23,504,097.15)
NIL (2,357.40)
NIL (2,357.40)
4 HDFC Mutual Fund HDFCLiquidFundPremium Plan-DDR
NIL (35,909,438.37)
NIL (4,402.45)
NIL (4,402.45)
HDFCCashManagement Fund-TAP-W-DDR
NIL (40,163,339.90)
NIL (4,028.99)
NIL (4,028.99)
5 ICICI Prudential Mutual Fund
ICICIPrudentialLiquid Fund-Inst.-DDR
NIL (59,344,905.94)
NIL (5,974.60)
NIL (5,974.65)
ICICIPrudentialLiquid Fund-SuperInst.-DDR
3,554,604.39 (6,534,490.37)
3,555.41 (6,535.93)
3,555.41 (6,535.93)
ICICI Prudential Flexible Income-DDR
NIL (32,736,597.95)
NIL (3,461.40)
NIL (3,462.02)
ICICI Prudential Flexible Income-Premium-DDR
757,239.72 (4,288,348.30)
800.67 (4,534.90)
800.67 (4,534.90)
6 IDFC Mutual Fund IDFCCashFund-SIP-DDR NIL (80,183,324.02)
NIL (8,020.34)
NIL (8,020.34)
IDFC Money Manager-TP-MD
NIL (8,994,411.83)
NIL (904.75)
NIL (901.55)
IDFC Money Manager-TP-SIPC-DDR
NIL (44,197,347.55)
NIL (4,420.40)
NIL (4,420.40)
7 KotakMutualFund KotakLiquid Fund-Institutional-DDR
NIL (45,155,769.68)
NIL (5,521.69)
NIL (5,521.69)
KotakFloaterLong Term-DDR
NIL (54,869,243.64)
NIL (5,530.71)
NIL (5,530.71)
8 LIC Mutual Fund LICLiquidFund–DDR 16,394,930.37(31,878,575.77)
1,800.18 (3,500.30)
1,800.18 (3,500.30)
LICSavingPlusFund–DDR 18,022,982.47 (35,242,931.57)
1,802.30 (3,524.29)
1,802.30 (3,524.29)
9
Reliance Mutual Fund
RelianceLiquidityFund-DDR
NIL (168,017,426.97)
NIL (16,806.95)
NIL (16,806.95)
RelianceLiquidPlus Fund-DDR/
NIL NIL NIL
RelianceMoneyManager Fund-DDR
(1,292,183.90) (12,936.52) (12,936.52)
Schedules formingpartofAnnualAccounts

80
10 SBI Mutual Fund SBIPremierLiquid Fund–SuperIP–DDR
NIL (10,967,397.78)
NIL (1,100.30)
NIL (1,100.30)
SBIMagnumInsta CashFund–DDR
24,296,145.10 (30,774,611.52)
4,069.68 (5,154.84)
4,069.68 (5,154.84)
SBI-SHF-LIQUID PLUS–Inst-DDR
NIL (40,572,459.62)
NIL (4,059.68)
NIL (4,059.68)
11
Tata Mutual Fund
TATALiquidFund-SHIPDDR NIL (529,815.44)
NIL (5,904.90)
NIL (5,904.90)
TATAFloaterFund–DDR
NIL (348,329.46)
NIL (3,519.23)
NIL (3,519.23)
12 UTI Mutual Fund UTILiquidCashPlan Instit.-DDR
NIL (359,354.12)
NIL (3,663.42)
NIL (3,663.42)
UTI Treasury Adv Fund-IP-DDR
NIL (651,385.44)
NIL (6,515.25)
NIL (6,515.25)
7. Inviewoflongterminterestofthecompanyinitssubsidiariesandstepdownsubsidiariesnoprovisionismadefor diminution in value of investment, if any, in these subsidiary companies and step down subsidiary companies.
8. a) DuringtheyearthecompanyraisedForeignCurrencyLoansaggregatingtoNIL(USDNIL)
b) TheCompanyestablishedLettersofCreditaggregating to`NIL (`3,720.72Lakhs).Thesamehasbeenutilizedforacquisitionofvessels.
9. ThecompanyhasnotreceivedanyintimationfromitsvendorsregardingthestatusundertheMicroandSmallEnterprisesDevelopmentAct2006andhencedisclosuresrequiredunderthesaidActhavenotbeenmade.
10. ThebalanceintheExchangeEarnersForeignCurrencyaccountismaintainedinUSDandshowninequivalentIndianRupees.ThebalanceinthesaidaccountasattheBalanceSheetdatewasUSD0.72Lakhs(PreviousYearUSD218.87Lakhs)
11. Details of bank balances with Foreign banks
`inLakhs
Name of the BankBalance as at
March 31, 2011Maximum Balance
during the year
HSBCBankSingapore 420.31 (2,235.52)
2,871.17 (3,120.27)
HSBCBankSingapore(FixedDeposit) Nil (40.22)
40.22 (40.22)
6. Investments purchased and sold during the financial year 2010-11Amount `inLakhs
Quantity PurchaseSr. No.
MF House Name Scheme (Units) Amount Sold Amount
Schedules formingpartofAnnualAccounts

annual report
2010-11
81
Standalone Financial StatementsSchedules
12. Disclosure as required under clause 32 of the Listing agreement`inLakhs
Loans and Advances in nature of Loans given to subsidiaries Current Year Previous Year
MercatorInternational(Pte)Ltd.Balanceoutstandingatyearend 35,601.86 49,896.15MaximumamountOutstandingduringtheyear. 67,792.24 84,698.68MercatorOil&GasLimitedBalanceoutstandingatyearend 92.04 91.40MaximumamountOutstandingduringtheyear. 92.04 91.40Mercator Offshore LimitedBalanceoutstandingatyearend NIL 85.70MaximumamountOutstandingduringtheyear. 85.70 5,121.32Mercator Petroleum LimitedBalanceoutstandingatyearend 282.74 242.74MaximumamountOutstandingduringtheyear. 342.74 242.74MCSHoldingsPteLimitedBalanceoutstandingatyearend 21.95 23.31MaximumamountOutstandingduringtheyear. 31.46 23.31OorjaIndoPetangisBalanceoutstandingatyearend NIL NILMaximumamountOutstandingduringtheyear. NIL 4.10MercatorOffshoreHoldingPte.Ltd.Balanceoutstandingatyearend 44.65 45.14Maximumamountoutstandingduringtheyear 45.14 51.47MercatorOffshore(Nigeria)Pte.Ltd.Balanceoutstandingatyearend 20,542.85 NILMaximumamountoutstandingduringtheyear 20,634.35 NIL
Note:There isno repayment schedule for theaboveLoansandAdvancesand thesameare repayableondemand.AlltheaboveLoansandAdvancesareinterestbearingexceptthoseinthenatureofcurrentaccounttransactions.
13. a) Remuneration to Directors Executive Chairman and Managing Directors
`inLakhsSalary 80.43 80.58Perquisites 15.57 15.42Commission NIL NILNon-ExecutiveDirectorsCommission NIL NILSittingFees 5.40 4.60
101.40 100.60b) Computation of Net Profit in accordance with section 349
of the Companies Act, 1956ProfitbeforeTax (9,403.81) 1,084.57Add:RemunerationpaidtoDirectors 96.00 96.00Add:SittingfeespaidtoDirectors 5.40 4.60Less:GainonsaleofFixedAssets(Net) (3.24) 3,354.24ProfitasperSection349oftheCompaniesAct,1956 (9,299.17) (2,169.07)
Schedules formingpartofAnnualAccounts

82
Add:BalanceBroughtforwardfrompreviousyear (2,169.07) -Total(tobeadjustedagainstsurplusinsubsequentyears) (11,468.24) (2,169.07)EligibilityofMaximumRemunerationtoExecutiveDirectors(ExecutiveChairmanandManagingDirector)asperSection198and309oftheCompaniesAct,1956@5%toeach
NIL NIL
Less:RemunerationpaidasperserviceagreementincaseofExecutiveChairmanandManagingDirector(excludingCommission)
96.00 96.00
Balance Available for payment of Commission Executive ChairmanandManagingDirector
NIL NIL
Restricted to NIL NILMaximum permissible commission to Non Executive Directors underSection198oftheCompaniesAct,1956@1%
NIL NIL
Restricted to NIL NIL
14. Payment to Auditors`inLakhs
Current Year Previous Year
Audit Fees 15.00 12.50Tax Audit Fees 1.75 1.75For Quarterly Limited Review 3.00 2.25Forcertificationandothermatters 12.60 7.75Service Tax 3.33 0.80TOTAL 35.68 25.05
15. (a) TheMinistryofCorporateAffairs,GovernmentofIndiavideitsGeneralNotificationNo.S.O.301(E)datedFebruary8,2011 issuedunderSection211(3)of theCompaniesAct,1956hasexemptedcertainclassesofcompaniesfromdisclosingcertaininformationintheirprofitandlossaccount.TheCompanybeinga‘shippingcompany’isentitledtotheexemption.Accordingly,disclosuresmandatedbyparagraphs4-D(a),(b),(c)&(e)ofPartII,ScheduleVItotheCompaniesAct,1956havenotbeenprovided.
(b) TheMinistryofCorporateAffairs,GovernmentofIndia,videGeneralCircularNo.2and3datedFebruary8,2011andFebruary21,2011respectivelyhasgrantedageneralexemptionfromcompliancewithsection212oftheCompaniesAct,1956,subjecttofulfillmentofconditionsstipulatedinthecircular.TheCompanyhassatisfiedtheconditionsstipulated inthecircularandhence isentitledtotheexemption. NecessaryInformationrelatingtothesubsidiarieshasbeenincludedintheConsolidatedFinancialStatements.
16. Remittance in foreign currencies for dividends TheCompanyhasnotremittedanyamountinforeigncurrenciesonaccountofdividendsduringtheyearand
does not have information as to the extent towhich remittance, if any, of foreign currencies on account ofdividendshavebeenmadeby/onbehalfofnon-residentshareholders.Theparticularsofdividendpayabletonon-residentshareholdersdeclaredduringtheyearisasunder:
Current Year Previous Year
i) Numberofnon-residentshareholders 1,839 1,759
ii) Number of ordinary shares held by them 4,74,55,857 4,35,89,785iii) Grossamountofdividend 94.91 217.95
13 b) Remuneration to Directors Executive Chairman and Managing Directors`inLakhs
Current Year Previous Year
Schedules formingpartofAnnualAccounts

annual report
2010-11
83
Standalone Financial StatementsSchedules
17. Disclosures in accordance with Revised Accounting Standard (AS) -15 on “Employee Benefits”:DisclosureasrequiredbyAS-15isasunder:(A) DefinedContributionPlans:
TheCompanyhasrecognizedthefollowingamountsintheProfitandLossAccountfortheyear:`inLakhs
Sr. No. Current Year Previous Year
i ContributiontoEmployees’ProvidentFund 42.96 41.01ii ContributiontoEmployees’FamilyPensionFund NIL NILiii ContributiontoEmployees’SuperannuationFund NIL NIL
TOTAL 42.96 41.01
(B) DefinedBenefitPlans:(i) ChangesinthePresentValueofObligation
`inLakhsSr. No.
Particulars For the Year Ended March 31, 2011
For the Year Ended March 31, 2010
Gratuity Leave Encashment
Gratuity Leave Encashment
a. PresentValueofObligationasat April1,2010(Opening)
87.28 58.56 79.33 45.12
b. Interest Cost 6.55 4.39 5.55 3.16c. Past Service Cost NIL NIL NIL NILd. Current Service Cost 44.18 27.84 40.26 18.19e. CurtailmentCost/(Credit) NIL NIL NIL NILf. SettlementCost/(Credit) NIL NIL NIL NILg. Benefitspaid (4.89) (18.34) NIL (7.54)h. Actuarial(Gain)/Loss (1.24) 13.25 (37.86) (0.37)i. PresentValueofObligationasat
March 31, 2011131.88 85.70 87.28 58.56
(ii) ExpensesrecognizedintheProfitandLossAccount`inLakhs
Sr. No.
Particulars For the Year Ended March 31, 2011
For the Year Ended March 31, 2010
Gratuity Leave Encashment
Gratuity Leave Encashment
a. Current Service Cost 44.18 27.84 40.26 18.19b. Past Service Cost NIL NIL NIL NILc. Interest cost 6.55 4.39 5.55 3.16d. CurtailmentCost/(Credit) NIL NIL NIL NILe. SettlementCost/(Credit) NIL NIL NIL NILf. NetActuarial(Gain)/Loss (1.24) 13.25 (37.86) (0.37)g. Employees’Contribution NIL NIL NIL NILh. TotalExpensesrecognizedinProfit
and Loss A/c 49.49 45.48 7.95 20.98
Schedules formingpartofAnnualAccounts

84
(iii) FollowingarethePrincipalActuarialAssumptionsusedasatthebalancesheetdate:`inLakhs
Sr. No.
Particulars FY 2010-11 gratuity and Leave
Encashment
FY 2009-10 gratuity and Leave
Encashment
a. Discount Rate 7.5% 7%b. SalaryEscalationRate–Management 12% 12%c. Staff Turnover Rate 11% 11%d. Mortality Table LIC (1994-96)
UltimateLIC(1994-96)
Ultimate
Theestimatesof futuresalary increasesconsidered inactuarialvaluation takes intoaccount inflation,seniority, promotion and other relevant factors.
18. Segment Reporting Inaccordancewithparagraph4ofAccountingStandard(AS)17‘SegmentReporting’,thecompanyhasdisclosed
segmentresultonthebasisofConsolidationFinancialStatements.Thesamearethereforenotdisclosedforstandalonefinancialstatements.
19. RelatedPartyDisclosures(asperAccountingStandard(AS)18“RelatedPartyDisclosures’
Schedules formingpartofAnnualAccounts
Related Party Disclosures:
A List of Related Parties
I Subsidiaries
1 MercatorInternationalPteLimited(MIPL)-Singapore
2 MercatorOilandGasLimited(MOGL)-India
3 MercatorPetroleumPrivateLimited-India
4 MercatorOffshoreHoldingsPteLtd(MOHPL)-Singapore
5 MercatorOffshore(Nigeria)PteLtd-SubsidiaryofMIPL
6 OorjaHoldingsPte.Limited.(OHL)Singapore-subsidiaryofMIPL
7 MercatorPH(Dutch)HoldingBV(Netherlands)-SubsidiaryofMIPL(Liquidatedduringtheyear)
8 MercatorPetroleum(Romania)PteLtd-SubsidiaryofMIPL(Liquidatedduringtheyear)
9 MercatorLinesSingaporePteLtd(MLS)-SubsidiaryofMIPL
10 MercatorOffshoreLtdSingapore-SubsidiaryofMOHPL
11 MercatorPetroleum(Turkey)BV(Netherlands)-SubsidiaryofMercatorPH(Dutch)HoldingBV(Netherlands)(Liquidatedduringtheyear)
12 IvoreneOilServicesNigeriaLtd.(Singapore)-SubsidaryofMONPL
13 VarshaMarinePteLtd(Singapore)-SubsidiaryofMLS
14 VidyaMarinePteLtd(Singapore)-SubsidiaryofMLS
15 MercatorLines(Panama)Inc-SubsidiaryofMLS
16 ChitraPremPte.Ltd.(Singapore)-SubsidaryofMLS
17 TargetShipManagementPte.Ltd.(Singapore)-SubsidiaryofMLS
18 Oorja1PteLtd(Singapore)-SubsidiaryofOHL
19 Oorja2PteLtd(Singapore)-SubsidiaryofOHL

annual report
2010-11
85
Standalone Financial StatementsSchedules
Schedules formingpartofAnnualAccounts
20 Oorja3PteLtd(Singapore)-SubsidiaryofOHL
21 OorjaMozambiqueLimitada(Mozambique)-SubsidiaryofOHL
22 MCSHoldingsPteLtd(Singapore)-SubsidiaryofOHL
23 Oorja(Batua)Pte.Ltd.(Singapore)-SubsidiaryofOHL
24 OorjaIndoPetangisFour(Indonesia)-SubsidiaryofOorja1PteLtd.
25 OorjaIndoPetangisThree(Indonesia)-SubsidiaryofOorja2PteLtd.
26 OorjaIndoKGS(Indonesia)-SubsidiaryofOorja3PteLtd
27 BroadtecMozambiqueMinasLimitada(Mozambique)-SubsidiaryofOorjaMozambiqueLimitada
28 PTMinconIndoResources(Jakarta)-SubsidiaryofOorjaIndoPetangisThree(Indonesia).
29 BimaGemaPermataPT(Jakarta)-SubsidiaryofOorjaIndoPetangisThree(Indonesia).
30 NusaSaktiKencanaPT(Jakarta)-SubsidiaryofOorjaIndoPetangisFour(Indonesia).
II Promoter group Companies / Companies in which Director(s) is/are substantially interested
1 MLLLogisticsPrivateLimited
2 Mercator Mechmarine Limited
3 Mercator Healthcare Limited
4 AnkurFertilizersPrivateLimited
5 RishiHoldingPrivateLimited
6 AHMInvestmentsPrivateLimited.
7 OorjaResourcesIndiaPvtLtd
8 AAAM Properties Pvt Ltd
9 MMAXXDredgingPvtLtd
10 VaitarnaMarineInfrastructureLtd.(ErstwhileMechMarineEngineersPvtLtd)
11 OilmaxEnergyPvtLtd
12 OptimumOil&GasLtd
13 CMAConstructions&PropertiesPvtLtd
14 OMCIShipManagementPvtLtd
III Directors of the Company
1 H.KMittal
2 A.JAgarwal
3 Manohar Bidaye
4 AnilKhanna
5 M.GRamakrishna
6 K.RBharat
7 KapilGarg
Iv Key Management Personnel
1 H.KMittal
2 A.J.Agarwal
v Relative of Key Management Personnel
1 Adip Mittal

86
Schedules formingpartofAnnualAccountsB
Det
ails
of T
rans
acti
ons
wit
h ab
ove
Part
ies
Amou
nt `inLakhs
Nam
e of
the
Tran
sact
ion
Sub
sidi
ary
Com
pani
es
PromoterGroupCom
panies/
Co
mpa
nies
in w
hich
Dire
ctor
(s)
is/a
re s
ubst
antia
lly in
tere
sted
T
otal
Cur
rent
Yr
Pre
viou
s Yr
C
urre
nt Y
r P
revi
ous
Yr
Cur
rent
Yr
Pre
viou
s Yr
Se
rvic
es R
ende
red
452
.32
668.17
-
1,912.51
452
.32
2,580.68
Inte
rest
Inco
me
4,2
41.9
4 4,186.17
-
-
4,2
41.9
4 4,186.17
Serv
ices
Rec
eive
d -
-
36.
37
3.60
36.
37
3.60
Sale
of C
apita
l Ass
et 8
,825
.00
40,927.50
-
-
8,8
25.0
0 40,927.50
Purc
hase
of C
apita
l Ass
ets
7,4
81.6
0 -
-
-
7,4
81.6
0 -
ReimbursmentsofExpenses/Stores/BunkerPaid
102
.31
48.13
642
.95
60.99
745
.27
109.13
ReimbursmentsofExpenses/Stores/BunkerReceived
4,1
48.1
1 6,595.48
0.0
8 0.51
4,1
48.1
9 6,595.99
Fina
nce
Prov
ided
(IncludingLoans&EquityConributions)
Loan
sLoansGivenduringtheYear
29,
872.
36
9,933.43
-
-
29,
872.
36
9,933.43
LoansRepaidDuringtheYear
33,
833.
22
18,530.67
-
-
33,
833.
22
18,530.67
EquityContributionsDuringtheyear
4.5
7 7.90
-
-
4.5
7 7.90
Tran
sfer
of I
nves
tmen
t to
Subs
idia
ry -
1,546.13
-
-
-
1,546.13
Adva
nces
AdvancesGivenDuringtheYear
-
-
4,9
14.4
6 259.97
4,9
14.4
6 259.97
AdvancesReturnedBackDuringtheYear
-
8,747.79
10.
16
5,114.46
10.
16
13,862.24
Adva
nces
Rec
eive
d Fr
om C
usto
mer
s 4
65.6
5 -
-
-
465
.65
-
AdvancesAdjustedAgainstServicesRendered
299
.99
-
-
-
299
.99
-
GuaranteesandComfortLetters
GuaranteesGiven
50,
081.
92
22,570.00
-
-
50,
081.
92
22,570.00
OutstandingasonMarch31,2011
Com
fort
Let
ter
50,
231.
25
1,04,950.50
-
-
50,
231.
25
1,04,950.50
Guarantees
50,
081.
92
39,948.90
-
-
50,
081.
92
39,948.90

annual report
2010-11
87
Standalone Financial StatementsSchedules
Schedules formingpartofAnnualAccounts
OutstandingbalancesasonMarch31,2011
Loan
s, Ad
vanc
es a
nd R
ecei
vabl
esLo
ans
5
6,58
6.09
55,324.90
-
-
56,
586.
09
55,324.90
Adva
nces
-
-
318
.13
328
.27
318
.13
328
.27
Rece
ivab
les
759
.91
1,634.27
-
-
759
.91
1,634.27
OutstandingBalancesofSundryDebtorsand
Sund
ry C
redi
tors
as
on M
arch
31,
201
1Su
ndry
Deb
tors
2.0
6 42.63
1,0
03.5
3 41.49
1,0
05.5
9 84.12
Sund
ry C
redi
tors
-
457.27
129
.33
-
129
.33
457.27
Adva
nce
Rece
ived
Fro
m C
usto
mer
s 1
65.6
6 -
-
-
165
.66
-
Dep
osits
Ba
lanc
e as
on
Mar
ch 3
1, 2
011
-
-
515
.00
515.00
515
.00
515.00
RemunerationpaidtoKeyManagem
entPersonnel
96.
00
96.00
CommissionPaidtoNon-ExecutiveDirectors
-
-
SittingFeesPaidtoNon-ExecutiveDirectors
5.4
0 4.60
RemunerationpaidtoRelativeofKeyManagem
ent
Pers
onne
l 5
.58
2.2
7
Not
e
1LoansGivenandRepaidduringtheYearincludestransactionsonaccountofexchangefluctuation.
BD
etai
ls o
f Tra
nsac
tion
s w
ith
abov
e Pa
rtie
sAm
ount
`inLakhs
Nam
e of
the
Tran
sact
ion
Sub
sidi
ary
Com
pani
es
PromoterGroupCom
panies/
Co
mpa
nies
in w
hich
Dire
ctor
(s)
is/a
re s
ubst
antia
lly in
tere
sted
T
otal

88
CPa
rtyw
ise
Det
ails
of M
ater
ial T
rans
acti
ons
Amou
nt `inLakhs
Nam
e of
the
Tran
sact
ion
Sub
sidi
ary
Com
pani
es
Pro
mot
er g
roup
Com
pani
es
/ Co
mpa
nies
in w
hich
D
irect
or(s
) is/
are
subs
tant
ially
in
tere
sted
Tot
al
Cur
rent
Yr
Pre
viou
s Yr
C
urre
nt Y
r P
revi
ous
Yr
Cur
rent
Yr
Pre
viou
s Yr
Se
rvic
es R
ende
red
MercatorLines(Singapore)PteLimited
452
.32
576.05
-
-
452
.32
576.05
Mer
cato
r Int
erna
tiona
l Pte
Lim
ited
-
92.12
-
-
-
92.12
MLLLogisticsPrivateLimited
-
-
-
1,912.51
-
1,912.51
TOTA
L 4
52.3
2 668.17
-
1,912.51
452
.32
2,580.68
Inte
rest
Inco
me
Mer
cato
r Int
erna
tiona
l Pte
Lim
ited
3,4
68.4
3 4,186.17
-
-
3,4
68.4
3 4,186.17
MercatorO
ffshore(Nigeria)Pte.Ltd.
773
.51
-
-
-
773
.51
-
TOTA
L 4
,241
.94
4,186.17
-
-
4,2
41.9
4 4,186.17
Serv
ices
Rec
eive
d -
--
--
-MLLLogisticsPrivateLimited
-
-
3.6
0 3.60
3.6
0 3.60
OMCIShipManagem
entPvtLimited
-
-
32.
77
-
32.
77
-
TOTA
L -
-
36.
37
3.60
36.
37
3.60
Sale
of C
apita
l Ass
et-
-
-
-40,927.50
MercatorO
ffshore(Nigeria)Pte.Limited
8,82
5.00
-8,
825.
00MercatorLines(Singapore)Limited
-40,927.50
--
-40,927.50
TOTA
L8,
825.
0040,927.50
-
-
8,82
5.00
40,927.50
Purc
hase
of C
apita
l Ass
et-
--
--
-M
erca
tor I
nter
natio
nal P
te. L
imite
d 7
,481
.60
--
- 7
,481
.60
-
TOTA
L 7
,481
.60
-
-
-
7,4
81.6
0 -
ReimbursmentofExpenses/Stores/BunkerPaid
--
--
--
AnkurFertilizersPrivateLimited
-
-
-
60.29
-
60.29
MercatorLines(Singapore)PteLimited
-
48.13
-
-
-
48.13
Mer
cato
r Int
erna
tiona
l Pte
Lim
ited
102
.31
-
-
-
102
.31
-
OMCIShipManagem
entPvtLimited
-
-
630
.85
-
630
.85
-
TOTA
L 1
02.3
1 48.13
630
.85
60.29
733
.16
108.43
ReimbursmentofExpenses/Stores/BunkerReceived
MercatorLines(Singapore)PteLimited
2,8
98.8
0 6,478.29
-
-
2,8
98.8
0 6,478.29
MechMarineEngineersPvtLtd
-
-
0.0
6 0.34
0.0
6 0.34
Schedules formingpartofAnnualAccounts

annual report
2010-11
89
Standalone Financial StatementsSchedules
MMAXXDredgingPvtLtd
-
-
0.0
2 0
.17
0.0
2 0
.17
MercatorO
ffshore(Nigeria)Pte.Ltd.
1,2
15.5
8 -
-
-
1,2
15.5
8 -
TOTA
L 4
,114
.38
6,478.29
0.0
8 0.51
4,1
14.4
6 6,478.80
Fina
nce
Prov
ided
(IncludingLoans&EquityContributions)
Loan
sLoansGivenduringtheYear
Mer
cato
r Int
erna
tiona
l Pte
Lim
ited
10,
007.
74
9,816.43
-
-
10,
007.
74
9,816.43
Mer
cato
r Offs
hore
Ltd
-
-
-
-
-
-
Mer
cato
r Mec
hmar
ine
Ltd
-
-
-
-
-
-
MercatorO
ffshore(Nigeria)Pte.Ltd.
19,
724.
63
-
-
-
19,
724.
63
-
TOTA
L 2
9,73
2.36
9,816.43
-
-
29,
732.
36
9,816.43
LoansRepaidDuringtheYear
Mer
cato
r Int
erna
tiona
l Pte
Lim
ited
32,
703.
82
13,403.01
-
-
32,
703.
82
13,403.01
Mer
cato
r Offs
hore
Ltd
-
5,121.32
-
-
-
5,121.32
TOTA
L 3
2,70
3.82
18,524.34
-
-
32,
703.
82
18,524.34
EquityContributionsDuringtheYear
MercatorO
ffshore(Nigeria)Pte.Ltd
4.5
7-
- 4
.57
-M
erca
tor P
etro
leum
Pvt
Ltd
7.90
-
-
7.90
TOTA
L 4
.57
7.90
-
-
4.5
7 7.90
Tran
sfer
of I
nves
tmen
t to
Subs
idia
ry
Mer
cato
r Offs
hore
Ltd
-
1,546.13
-
-
-
1,546.13
TOTA
L -
1,546.13
-
-
-
1,546.13
Adva
nces
AdvancesGivenDuringtheYear
MLLLogisticsPvtLtd
250.00
250.00
MechMarineengineersPvtLtd
-
-
4,9
14.4
6 -
4,9
14.4
6 -
TOTA
L -
-
4,9
14.4
6 250.00
4,9
14.4
6 250.00
AdvancesReceivedBackDuringtheYear
MechMarineengineersPvtLtd
-
-
-
4,914.46
-
4,914.46
Schedules formingpartofAnnualAccountsC
Part
ywis
e D
etai
ls o
f Mat
eria
l Tra
nsac
tion
s Am
ount
`inLakhs
Nam
e of
the
Tran
sact
ion
Sub
sidi
ary
Com
pani
es
Pro
mot
er g
roup
Com
pani
es
/ Co
mpa
nies
in w
hich
D
irect
or(s
) is/
are
subs
tant
ially
in
tere
sted
Tot
al

90
MercatorLines(Singapore)PteLimited-ForCapitalGoods
-
8,747.79
--
-
8,747.79
OorjaResourcesIndiaPvtLtd
-
-
9.9
7 -
9.9
7 -
TOTA
L -
8,747.79
9.9
7 4,914.46
9.9
7 13,662.24
Adva
nces
Rec
eive
d Fr
om C
usto
mer
sMercatorLines(Singapore)PteLimited
465
.65
465
.65
-
TOTA
L 4
65.6
5 -
-
-
465
.65
-
AdvancesAdjustedAgainstServicesRendered
MercatorLines(Singapore)PteLimited
299
.99
299
.99
-
TOTA
L 2
99.9
9 -
-
-
299
.99
-
GuaranteesandComfortLetters
GuaranteesGiven
Mer
cato
r Int
erna
tiona
l Pte
Ltd
9,8
23.0
0 22,570.00
-
-
9,8
23.0
0 22,570.00
MercatorO
ffshore(Nigeria)Pte.Ltd.
37,
282.
75
37,
282.
75
-
TOTA
L 4
7,10
5.75
22,570.00
-
-
47,
105.
75
22,570.00
OutstandingCom
fortLetter/Guaranteesason
31/0
3/20
11Co
mfo
rt L
ette
rMercatorLines(Singapore)PteLimited
10,0
46.2
510,156.50
10,0
46.2
510,156.50
Vars
ha M
arin
e Pt
e Lt
d/Vi
dya
Mar
ine
Pte
Ltd
40,1
85.0
040,626.00
40,1
85.0
040,626.00
MercatorO
ffshoreHoldingsPteLimited
-54,168.00
-54,168.00
TOTA
L 5
0,23
1.25
1,04,950.50
-
-
50,
231.
25
1,04,950.50
Guarantees
Mer
cato
r Offs
hore
Lim
ited
17,378.90
-
-
17,378.90
Mer
cato
r Int
erna
tiona
l Pte
Ltd
9,8
23.0
0 22,570.00
-
-
9,8
23.0
0 22,570.00
MercatorO
ffshore(Nigeria)Pte.Ltd.
37,
282.
75
-
-
37,
282.
75
-
TOTA
L 4
7,10
5.75
39,948.90
-
-
47,
105.
75
39,948.90
OutstandingbalancesasonMarch31,2011
Loan
s, Ad
vanc
es a
nd R
ecei
vabl
esLo
ans
Adva
nces
and
Rec
eiva
bles
Loan
s
Schedules formingpartofAnnualAccounts
CPa
rtyw
ise
Det
ails
of M
ater
ial T
rans
acti
ons
Amou
nt `inLakhs
Nam
e of
the
Tran
sact
ion
Sub
sidi
ary
Com
pani
es
Pro
mot
er g
roup
Com
pani
es
/ Co
mpa
nies
in w
hich
D
irect
or(s
) is/
are
subs
tant
ially
in
tere
sted
Tot
al

annual report
2010-11
91
Standalone Financial StatementsSchedules
Mer
cato
r Int
erna
tiona
l Pte
Lim
ited
35,
601.
86
54,836.61
-
-
35,
601.
86
54,836.61
MercatorO
ffshore(Nigeria)Pte.Ltd.
20,
542.
85
-
-
-
20,
542.
85
-
TOTA
L 5
6,14
4.71
54,836.61
-
-
56,
144.
71
54,836.61
Adva
nces
MLLLogisticsPvtLtd
-
-
318
.13
318
.13
318
.13
318
.13
TOTA
L -
-
318
.13
318
.13
318
.13
318
.13
Rece
ivab
les
MercatorLines(Singapore)PteLimited
759
.91
1,634.27
-
-
759
.91
1,634.27
TOTA
L 7
59.9
1 1,634.27
-
-
759
.91
1,634.27
OutstandingBalancesofSundryDebtorsand
Sund
ry C
redi
tors
as
on M
arch
31,
201
1Su
ndry
Deb
tors
MLLLogisticsPrivateLimited
-
-
1,0
03.5
3 41.49
1,0
03.5
3 41.49
MercatorLines(Singapore)PteLimited
2.0
6 42.63
-
-
2.0
6 42.63
TOTA
L 2
.06
42.63
1,0
03.5
3 41.49
1,0
05.5
9 84.12
Sund
ry C
redi
tors
MercatorLines(Singapore)PteLimited
-
457.27
-
-
-
457.27
OMCIShipManagem
entPvtLimited
-
-
129
.33
-
129
.33
-
TOTA
L -
457.27
129
.33
-
129
.33
457.27
Adv
ance
Rec
eive
d Fr
om C
usto
mer
s MercatorLines(Singapore)PteLimited
165
.66
-
-
-
165
.66
-
TOTA
L 1
65.6
6 -
-
-
165
.66
-
Dep
osits
Bala
nce
as o
n M
arch
31,
201
1MLLLogisticsPrivateLimited
-
-
500
.00
500.00
500
.00
500.00
TOTA
L -
-
500
.00
500.00
500
.00
500.00
Not
e
1LoansGivenandRepaidduringtheYearincludestransactionsonaccountofexchangefluctuation.
Schedules formingpartofAnnualAccountsC
Part
ywis
e D
etai
ls o
f Mat
eria
l Tra
nsac
tion
s Am
ount
`inLakhs
Nam
e of
the
Tran
sact
ion
Sub
sidi
ary
Com
pani
es
Pro
mot
er g
roup
Com
pani
es
/ Co
mpa
nies
in w
hich
D
irect
or(s
) is/
are
subs
tant
ially
in
tere
sted
Tot
al

92
20. Disclosure in respect of Operating Leases (as Lessee):`inLakhs
March 31, 2011 Year Ended
March 31, 2010 Year ended
(a) OperatingLeasesDisclosuresinrespectofcancellableagreementsforofficepremisestakenonlease(i) LeasepaymentsrecognizedintheProfitandLossAccount 383.63 373.78(ii) Significantleasingarrangements
TheCompanyhasgivenrefundableinterestfreesecuritydepositsundertheagreements.Theleaseagreementsareforaperiodfrom60to108months.Theseagreementsalsoprovidedforincreaseinrent.Theseagreementsarenoncancellablebyboththepartiesforperiodof12/60monthsexceptincertainexceptional circumstances.
(iii) Future minimum lease payments under non-cancellableagreementsNot later than one year 181.93 401.44Laterthanoneyearandnotlaterthanfiveyears NIL 181.93Laterthanfiveyears
21. Disclosure in respect of Operating Leases (as Lessor):`inLakhs
Year EndedMarch 31, 2011
Year endedMarch 31, 2010
(a) OperatingLeasesDisclosuresinrespectofcancellableagreementsforofficepremisesgivenonlease(i) LeasepaymentsrecognizedintheProfitandLossAccount 144.00 144.00(ii) Significantleasingarrangements- TheCompanyhastakenrefundableinterestfree
securitydepositsundertheagreements.- Theleaseagreementsareforaperiodofsixtymonths.- Theseagreementsarenoncancelablebyboththe
parties for 18 months except in certain exceptional circumstances.
(iii) Futureminimumleasepaymentsundernon-cancellableagreements
- Not later than one year Nil Nil- Laterthanoneyearandnotlaterthanfiveyears Nil Nil- Laterthanfiveyears Nil Nil
GeneralDescriptionofleasingarrangement(i) LeasedAssets:Premises,Godown(ii) Futureleaserentalsaredeterminedonthebasisofagreedterms
Schedules formingpartofAnnualAccounts

annual report
2010-11
93
Standalone Financial StatementsSchedules
22. Earning Per Share `inLakhs
Year EndedMarch31, 2011
Year endedMarch31, 2010
NetProfitafterTaxandpreferencedividendincludingtaxthereon-Basic (9803.81) 639.57-Diluted (9803.81) 639.57NumberofSharesusedincomputingEarningPerShare-Basic 237,893,941 235,992,073-Diluted 237,893,941 235,992,073Earningpershare(equitysharesoffacevalue`1/-)-Basic(in`) (4.12) 0.27-Diluted(in`) (4.12) 0.27
23. DuringFY2008-09,thecompanyhadoptedforaccountingtheexchangedifferencesarisingonreportingoflongtermforeigncurrencymonetaryitemsinlinewiththenotificationofMinistryofCorporateAffairs(MCA)datedMarch31,2009,onAccountingStandard(AS)-11.Inlinewiththeabovenotification,gains/lossesarisingduringtheyearfromtheeffectofchangesinforeignexchangeratesonforeigncurrencyloansrelatingtoacquisitionofdepreciablecapitalassets,areadjustedtothecostofthefixedassets.Thenetdeductionfromfixedassetsonaccount of the same is `385.53Lakhs(previousyear`11,685.99Lakhs).
24. Derivative Instruments The Company uses foreign currency forward contracts to hedge its risks associated with foreign Currency
fluctuations relating to certain firm commitments and forecasted transactions. The use of foreign currencyforwardcontracts isgovernedbytheCompany’sstrategyapprovedbytheBoardofDirectors,whichprovideprincipleson theuseof such forwardcontractsconsistentwith theCompany’sRiskManagementPolicy.TheCompanydoesnotuseforwardcontractsforspeculativepurposes.TherearenooutstandingForwardExchangeContracts entered into by the Company as on March 31, 2011.
25. Tonnage Tax reserve Intermsofsection115VToftheIncomeTaxAct,1961,thecompanyisrequiredtotransferamountsoutofitsprofit
toTonnageTaxReserve.InviewofNIL“Incomefromshipping”(Asdefinedu/s115V–Isubclause(i)and(ii)ofIncomeTaxAct,1961),thereisnotransferduringtheyearaswellasinthepreviousyeartotheTonnageTaxReserve.
Schedules formingpartofAnnualAccounts

94
26. Foreign Currency ExposuresTheyearendexposureincurrenciesotherthanthefinancialcurrencyoftheCompany,thatwerenothedgedbyaderivativeinstrumentorotherwisearegivenbelow:
2010-11 2009-10
` in Lakhs Fx. mn ` in Lakhs Fx. mnAccounts Receivable 9,370.76 USD 20.99 7,006.56 USD15.52Balance in EEFC Account 32.19 USD 0.07 9,879.57 USD21.89FixedDepositwithforeignBank Nil Nil 40.22 USD0.09Loan&Advances 3,832.82 USD 8.18
SGD 0.21EURo 0.13
JPY 3.020.00
SLR 0.13DKK 0.05
3,379.75 USD6.96 SGD0.28Euro0.14JPY11.64AUD 0.01SLR 0.02
Advance from Customers 165.66 USD 0.37 127.17 USD 0.28Accounts Payable/Acceptances(includingcapitalcommitmentsmadebutnotprovidedfor)
2,732.68 USD 6.09Euro 0.01SGD 0.01JPY 0.28
4,100.01 USD8.26Euro 0.07SGD0.44JPY29.88DKR0.26AED0.09HKD0.04NOK0.05
Borrowings 78,058.92 USD 174.82 1,01,366.38 USD224.56
27. Previousyearsfigureshavebeenregrouped/rearrangedwherevernecessary.
Schedules formingpartofAnnualAccounts

annual report
2010-11
95
Standalone Financial StatementsBalance Sheet Abstract
Balance Sheet Abstract And Company’s General Business Profile
I. REGISTRATIONDETAILSRegistrationNo. : 1 1 - 3 1 4 1 8 State Code : 0 1 1
Balance Sheet Date : 3 1 0 3 2 0 1 1Date Month Year
II. CAPITALRAISEDDURINGTHEYEAR(Amountin`Thousands)
Public Issue : N I L RightIssue : N I L
Bonus Issue : N I L Private Placement : 2 5 9 6 0 0
III. POSITION OF MOBILISATION AND DEPLOYMENT OF FUNDS(Amountin`Thousands)
Total Liabilities : 2 3 7 0 8 8 2 7 Total Assets : 2 3 7 0 8 8 2 7
Sources of Funds
Paid-upCapital : 5 0 4 4 9 2 Reserves&Surplus : 9 7 5 8 9 2 8
Secured Loans : 1 2 4 4 5 4 0 7 Unsecured Loans : 1 0 0 0 0 0 0
Application of Funds
Net Fixed Assets : 1 6 9 9 6 8 9 3 Investments : 6 1 2 1 8
Net Current Assets : 6 6 5 0 7 1 6 Misc. Expenditure : N I L
IV. PERFORMANCE OF COMPANY(Amountin`Thousands)
Turnover* : 6 3 9 1 4 6 4 Total Expenditure : 7 3 3 1 8 4 5
Profit/(Loss)Beforetax : (9 4 0 3 8 1) Profit/(Loss)aftertax : (9 8 0 3 8 1)
Earningpershare : (4 . 1 2) DividendRate% : N A
*includesotherincome
V. GENERICNAMESOFPRINCIPALPRODUCTS/SERVICESOFCOMPANY(asPerMonetaryTerms)
Item Code No. : N A
Product Description : ShippingServices
For and on behalf of the Board
H.K.Mittal A.J.Agarwal MG.RamkrishnaExecutive Chairman ManagingDirector Director
KapilGarg SuchitaShirambekarDirector Company Secretary
Dated:May28,2011Place:Mumbai

96
Sr.
No.
Nam
e of
Com
pany
Fina
ncia
l Ye
ar E
nded
Capi
tal
Rese
rves
Tota
l Ass
ets
Tota
l Li
abili
tyIn
vest
men
t (except
Inve
stm
ent i
n su
bsid
iarie
s
Turn
over
Profit/Loss
befo
re T
axPr
ovis
ion
for
Taxa
tion
ProfitAfter
Tax
Prop
osed
D
ivid
end
1MercatorLines(Singapore)Pte.Ltd.
31-Mar-11
90588.15
74263.22
263468.04
1008
33.1
02216.43
59941.28
13816.05
3.65
13812.40
0.00
2MercatorLine(Panam
a)Inc.
31-Mar-11
4.47
(5.36)
(0.89)
-
-
-
-
-
-
-
3M
erca
tor I
nter
natio
nal P
te. L
td.
31-Mar-11
26.79
5,122.77
59,255.07
54,105.51
1,351.29
4,725.46
-
4,725.40
-
4M
erca
tor O
ffsho
re L
td.
31-Mar-11
1,400.09
107.58
1,511.45
3.7
8 -
14,178.88
2,406.11
(1.12)
2,404.99
-
5Vi
dya
Mar
ine
Pte.
Ltd
.31-Mar-11
-
1,685.98
27,645.94
25,959.96
-
5,366.40
2,760.93
5.01
2,755.92
501.49
6Va
rsha
Mar
ine
Pte.
Ltd
.31-Mar-11
-
5,940.24
26,347.07
20,406.84
-
4,850.78
2,065.23
4.10
2,061.12
911.80
7MercatorO
il&GasLtd.
31-Mar-11
15.00
-
110
.87
95.87
-
-
(1.75)
-
(1.75)
-
8OorjaHoldingsPteLtd
31-Mar-11
0.0
0 (409.24)
10,432.99
10,842.23
-
-
(119.15)
-
(119.15)
-
9Oorja1Pte.Ltd
31-Mar-11
0.0
0 (165.74)
2,181.14
2,346.88
-
-
(105.31)
(3.33)
(108.64)
-
10Oorja2Pte.Ltd
31-Mar-11
0.0
0 (262.44)
2,7
37.1
7 2,999.61
-
-
(157.39)
-
(157.39)
-
11Oorja3Pte.LTd
31-Mar-11
0.0
0 (237.32)
1,807.24
2,040.54
-
9.24
(130.16)
-
(130.16)
-
12OorjaIndoKGSPT
31-Mar-11
111.63
(653.89)
15,315.12
15,857.39
-
92,633.18
64.94
(38.24)
107.19
-
13OorjaMozam
biqueMinasLDA
31-Mar-11
0.36
-
15.76
15.40
-
-
(4.58)
-
(4.58)
-
14BroadtechMozam
biqueMinasLDA
31-Mar-11
0.36
-
28.
80
28.43
-
-
(4.64)
-
(4.64)
-
15OorjaIndoPetangisThreePT
31-Mar-11
245.58
(1,149.15)
2,347.22
3,250.80
-
6,711.30
(623.59)
99.97
(523.63)
-
16OorjaPetangisFourPT
31-Mar-11
245.58
(1,015.79)
2,216.91
2,987.12
-
8,378.42
326.56
29.85
356.42
-
17MCSHoldingsPteLtd.
31-Mar-11
16.47
7,657.61
24,458.84
16,784.76
-1,32,566.36
(7,974.90)
(912.39)
7,062.51
-
18M
erca
tor P
etro
leum
Ltd
.31-Mar-11
10.
00
-
431.69
421.69
-
-
(0.47)
-
(0.47)
-
19MercatorO
ffshoreHoldingsPte.Ltd.
31-Mar-11
0.0
7 6,246.57
7,184.64
938.00
-
9,620.58
7,936.96
-
7,936.96
-
20PT
Min
con
Indo
Res
ourc
es31-Mar-11
111.63
(708.97)
954.81
1,552.15
-
1,052.89
(313.83)
(42.05)
(271.78)
21MercatorO
ffshore(Nigeria)Pte.Ltd.
31-Mar-11
89.30
(3.71)
82,097.35
82,011.76
-
-
(1.93)
-
(1.93)
-
22IvoreneOilServices(Nigeria)Pte.Ltd.
31-Mar-11
29.18
-
156.16
126.99
-
-
-
-
-
-
23Oorja(Batua)Pte.Ltd.
31-Mar-11
0.0
0 (1.03)
2,679.00
2,680.03
-
-
(1.05)
-
(1.05)
-
24BimaGem
aPermataPt.
31-Mar-11
279.69
(148.14)
583.94
452.39
-
-
(42.83)
-
(42.83)
-
25NusaSaktiKencanaPt.
31-Mar-11
278
.30
(171.17)
512.69
405.55
-
-
(39.86)
-
(39.86)
-
26 C
hitr
a Pr
em P
te. L
td.
31-Mar-11
-
54.03
20,422.46
20,368.44
-
643.73
123.55
-
123.55
91.18
27TargetShipManagem
netPte.Ltd.
31-Mar-11
-
7.14
785.84
778
.70
-
102
.12
7.29
-
7.29
-
For a
nd o
n be
half
of th
e Bo
ard
H.K.M
ittal
A.J.Agarwal
MG.Ram
krishna
Exec
utiv
e Ch
airm
anManagingDirector
Dire
ctor
KapilGarg
SuchitaShirambekar
Dire
ctor
Com
pany
Sec
reta
ry
Dated:M
ay28,2011
Place:Mum
bai
Stat
emen
t pur
suan
t to
Sect
ion
212
of th
e Co
mpa
nies
Act
, 195
6 re
latin
g to
Sub
sidi
ary
Com
pani
es fo
r the
Ye
ar E
nded
Mar
ch 3
1, 2
011
Am
ount
`inLakhs

annual report
2010-11
97
Standalone Financial StatementsSection 212
(Am
ount
` in
Lak
hs)
Sr.
No.
Nam
e of
Com
pany
Fina
ncia
l Ye
ar E
nded
Exte
nt o
f in
tere
st o
f th
e H
oldi
ng
Com
pany
in
the
capi
tal o
f su
bsid
iary
No.
of S
hare
s he
ld b
y Co
mpa
ny
dire
ctly
or
thro
ugh
its
subs
idia
ry
Net
agg
rega
te o
f the
pro
fit
or lo
sses
of
the
sub
sidi
ary
for
the
curr
ent
peri
od s
o fa
r as
it c
once
rns
the
mem
bers
of t
he h
oldi
ng c
ompa
ny.
Net
agg
rega
te o
f pro
fits
or
loss
es
for
prev
ious
fina
ncia
l yea
rs o
f the
su
bsid
iary
so
far
as it
con
cern
s th
e m
embe
rs o
f the
hol
ding
com
pany
not
deal
t w
ith
or p
rovi
ded
for
in t
he a
ccou
nts
of t
he h
oldi
ng
com
pany
deal
t w
ith
or
prov
ided
for
in
the
acco
unt
of t
he
hold
ing
com
pany
not
deal
t w
ith
or p
rovi
ded
for
in t
he a
ccou
nts
of t
he h
oldi
ng
com
pany
deal
t w
ith
or
prov
ided
for
in t
he a
ccou
nt
of t
he h
oldi
ng
com
pany
1M
erca
tor L
ines
(S
inga
pore
) Ltd
.31
-Mar
-11
71.9
5%90
,08,
50,0
00Profit
NIL
Profit
NIL
13,
812.
40
19,
875.
80
2M
erca
tor L
ine
(Pan
ama)
In
c.31
-Mar
-11
100%
10,0
00N
ILN
ILN
ILN
IL
3M
erca
tor I
nter
natio
nal
Pte.
Ltd
.31
-Mar
-11
100%
1,00
,000
Profit
NIL
Loss
NIL
4,7
25.4
0 (8
62.7
1)4
Mer
cato
r Offs
hore
Ltd
.31
-Mar
-11
100%
52,2
6,17
0Profit
NIL
Profit
NIL
2,4
04.9
9 7
,184
.05
5Vi
dya
Mar
ine
Pte.
Ltd
.31
-Mar
-11
100%
2Profit
NIL
Profit
NIL
2,7
55.9
2 3
,327
.51
6Va
rsha
Mar
ine
Pte.
Ltd
.31
-Mar
-11
100%
2Profit
NIL
Profit
NIL
2,0
61.1
2 6
88.6
1 7
Mer
cato
r Oil
& G
as L
td.
31-M
ar-1
110
0%1,
50,0
00Lo
ssN
ILLo
ssN
IL (1
.75)
(10.
70)
8O
orja
Hol
ding
s Pt
e Lt
d31
-Mar
-11
100%
2Lo
ssN
ILLo
ssN
IL (1
19.1
5) (9
5.07
)9
Oor
ja 1
Pte
. Ltd
31-M
ar-1
110
0%2
Loss
NIL
Profit
NIL
(108
.64)
41.
58
10O
orja
2 P
te. L
td31
-Mar
-11
100%
2Lo
ssN
ILLo
ssN
IL (1
57.3
9) (1
5.80
)11
Oor
ja 3
Pte
. LTd
31-M
ar-1
110
0%2
Loss
NIL
Loss
NIL
(130
.16)
(23.
68)
12O
orja
Indo
KG
S PT
31-M
ar-1
195
%95
0Profit
NIL
Loss
NIL
107
.19
(89.
05)
13O
orja
Moz
ambi
que
Min
as L
DA
31-M
ar-1
110
0%25
,000
Loss
NIL
Loss
NIL
(4.5
8) (4
.15)
Stat
emen
t pur
suan
t to
Sect
ion
212(
3) o
f the
Com
pani
es A
ct, 1
956
rela
ting
to S
ubsi
diar
y Co
mpa
nies

98
Stat
emen
t pur
suan
t to
Sect
ion
212(
3) o
f the
Com
pani
es A
ct, 1
956
rela
ting
to S
ubsi
diar
y Co
mpa
nies
14BroadtechMozam
bique
Min
as L
DA
31-Mar-11
85%
21,250
Loss
NIL
Loss
NIL
(4.64)
(5.15)
15OorjaIndoPetangis
Thre
e PT
31-Mar-11
100%
2,20
0Lo
ssN
ILLo
ssN
IL(523.63)
(210.65)
16OorjaPetangisFourPT
31-Mar-11
100%
2,20
0Profit
NIL
Loss
NIL
356.42
(601.59)
17MCSHoldingsPteLtd.
31-Mar-11
100%
50002
Profit
NIL
Profit
NIL
7,062.51
580.43
18M
erca
tor P
etro
leum
Ltd
.31-Mar-11
100%
1,00
,000
Profit
NIL
Loss
NIL
(0.47)
(0.42)
19M
erca
tor O
ffsho
re
HoldingsPteLtd.
31-Mar-11
100%
200
Profit
NIL
Loss
NIL
7,936.96
(1,618.46)
20PT
Min
con
Indo
Re
sour
ces
31-Mar-11
100%
2,50,000
Loss
NIL
Loss
NIL
(271.78)
(407.54)
21M
erca
tor O
ffsho
re
(Nigeria)Pte.Ltd.
31-Mar-11
100%
2,79,840
Loss
NIL
Loss
NIL
(1.93)
(1.93)
22Iv
oren
e O
il Se
rvic
es
(Nigeria)Pte.Ltd.
31-Mar-11
100%
99,99,999
-N
IL-
NIL
23Oorja(Batua)Pte.Ltd.
31-Mar-11
100%
2Lo
ssN
IL-
NIL
(1.05)
-
24BimaGemaPermataPt.
31-Mar-11
100%
5,100
Loss
NIL
-N
IL(42.83)
-
25NusaSaktiKencanaPt.
31-Mar-11
100%
5,100
Loss
NIL
-N
IL(39.86)
-
26Ch
itra
Prem
Pte
. Ltd
. 31-Mar-11
100%
2Profit
NIL
-N
IL123.55
-
27TargetShip
Managem
netPte.Ltd.
31-Mar-11
100%
526
Profit
NIL
-N
IL7.29
-
For a
nd o
n be
half
of th
e Bo
ard
H.K.M
ittal
A.J.Agarwal
MG.Ram
krishna
Exec
utiv
e Ch
airm
anManagingDirector
Dire
ctor
KapilGarg
SuchitaShirambekar
Dire
ctor
Com
pany
Sec
reta
ry
Dated:M
ay28,2011
Place:Mum
bai
Am
ount
`inLakhs

annual report
2010-11
99
Auditors’ ReportConsolidated Financial Statements
Auditors’ Report to the Board of Directors on the Consolidated Financial Statements of Mercator Lines Limited and its subsidiaries
1. We have audited the attached Consolidated Balance Sheet of Mercator Lines Limited (the Company) and its subsidiaries (collectively called ‘the Mercator Group’) as at March 31, 2011, the Consolidated Profit and Loss Account and the Consolidated Cash Flow Statement for the year ended on that date, annexed thereto. These financial statements are the responsibility of the Company’s management. Our responsibility is to express an opinion on these financial statements based on our audit.
2. We conducted our audit in accordance with the auditing standards generally accepted in India. Those Standards require that we plan and perform the audit to obtain reasonable assurance about whether the financial statements are free of material misstatements. An audit includes examining, on a test basis, evidence supporting the amounts and disclosures in the financial statements. An audit also includes assessing the accounting principles used and significant estimates made by management, as well as evaluating the overall financial statement presentation. We believe that our audit provides a reasonable basis for our opinion.
3. We did not audit the financial statements of subsidiaries, whose financial statements reflect total assets(net) of ` 4,125.35 cr as at March 31, 2011 and total revenues(net) of ` 2,172.49 cr. These financial statements and other financial information have been audited by other auditors whose reports have been furnished to us, and our opinion is based solely on the report of the other auditors.
4. We report that the consolidated financial statements have been prepared by the Company’s management in accordance with the requirements of Accounting Standard (AS) 21, Consolidated Financial Statements, as notified by the Companies (Accounting Standards) Rules, 2006.
5. In our opinion and to the best of our information and according to the explanations given to us, the consolidated financial statements give a true and fair view in conformity with the accounting principles generally accepted in India:
a. in the case of the Consolidated Balance Sheet, of the state of affairs of the Mercator Group as at March 31, 2011;
b. in the case of the Consolidated Profit and Loss Account, of the profit of the Mercator Group for the year ended on that date; and
c. in the case of the Consolidated Cash Flow Statement, of the cash flows of the Mercator Group for the year ended on that date.
For and on behalf of
Contractor Nayak & Kishnadwala
Chartered Accountants
Firm Registration No 101961W
H. V. Kishnadwala
Partner,
M. No 37391
Mumbai
May 28, 2011

100
Consolidated Balance Sheet as at March 31, 2011
As per our report of even date For and on behalf of the Board
For Contractor, Nayak & Kishnadwala H. K. Mittal A. J. Agarwal M G. RamkrishnaChartered Accountants Executive Chairman Managing Director Director
Himanshu Kishnadwala Partner Kapil Garg Suchita Shirambekar
Director Company Secretery
Dated: May 28, 2011 Dated: May 28, 2011Place: Mumbai Place: Mumbai
Amount ` in Lakhs Particulars
ScheduleAs at
March 31, 2011As at
March 31, 2010
SOURCES OF FUNDS Shareholders Funds Share Capital A 2,448.92 2,359.92 Warrants against Share Capital A 1 2,596.00 - Reserves and Surplus B 2,24,617.58 2,11,898.29 Minority Interest 34,985.00 31,500.81
2,64,647.50 2,45,759.02 Loan Funds Secured Loans C 3,10,200.91 2,90,377.92 Unsecured Loans D 17,144.00 21,220.86
3,27,344.91 3,11,598.78 ToTaL 5,91,992.41 5,57,357.80 APPLICATION OF FUNDS Fixed assets EGross Block 5,37,060.24 5,91,715.79 Depreciation (88,431.36) (79,883.49)Net Block 4,48,628.88 5,11,832.30 Capital work in progress 80,504.61 8,737.09 Cost of Mine 7,156.05 -
5,36,289.54 5,20,569.39 Investments F 2,845.42 7,458.78 Deferred Tax 323.64 983.84 Current assets, Loans & advances GInventories 6,271.71 6,143.53 Sundry Debtors 37,634.19 20,133.76 Cash and Bank Balances 71,159.44 88,798.28 Loans and Advances 37,996.30 24,167.93
1,53,061.64 1,39,243.50 Current Liabilities and Provisions HCurrent Liabilities 97,913.64 1,09,269.06Provisions 280.53 693.82Incomplete Voyages (Net) 2,333.66 934.83
1,00,527.83 1,10,897.71Net Current Assets 52,533.81 28,345.79ToTaL 5,91,992.41 5,57,357.80Significant Accounting Policies & Notes to the Accounts I
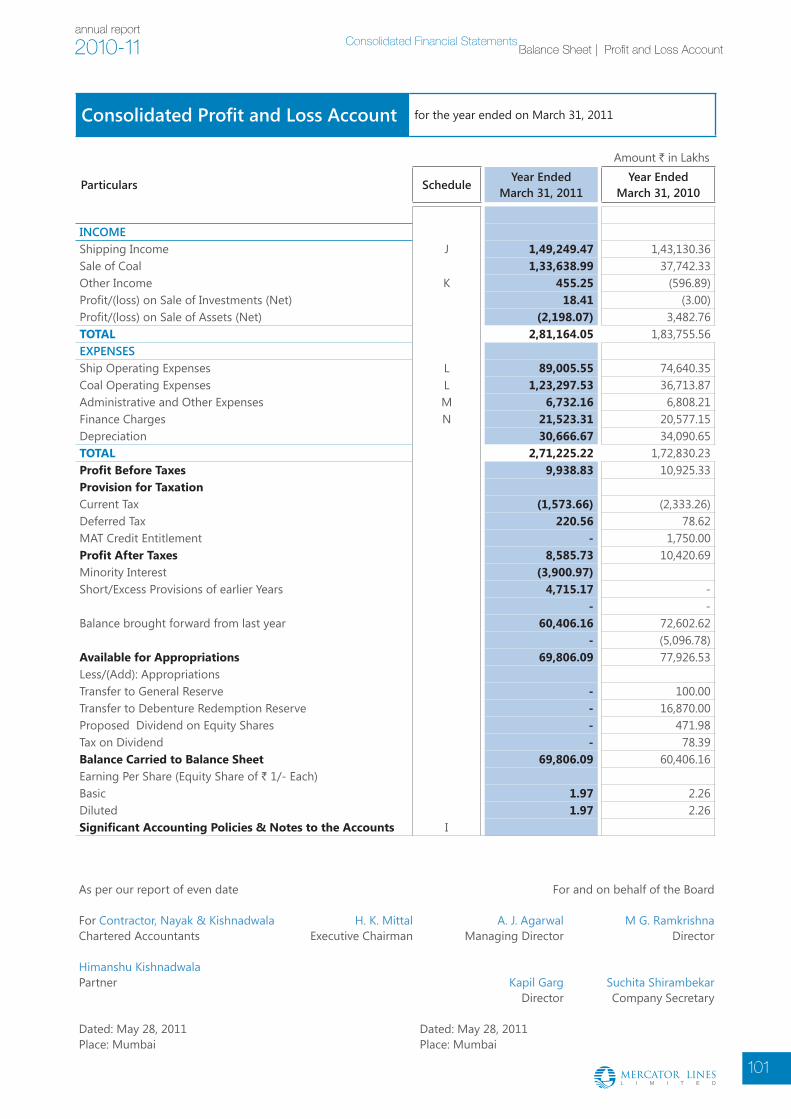
annual report
2010-11
101
Consolidated Financial StatementsBalance Sheet | Profit and Loss Account
Consolidated Profit and Loss Account for the year ended on March 31, 2011
As per our report of even date For and on behalf of the Board
For Contractor, Nayak & Kishnadwala H. K. Mittal A. J. Agarwal M G. RamkrishnaChartered Accountants Executive Chairman Managing Director Director
Himanshu Kishnadwala Partner Kapil Garg Suchita Shirambekar
Director Company Secretary
Dated: May 28, 2011 Dated: May 28, 2011Place: Mumbai Place: Mumbai
Amount ` in Lakhs
Particulars ScheduleYear Ended
March 31, 2011Year Ended
March 31, 2010
INCOME Shipping Income J 1,49,249.47 1,43,130.36Sale of Coal 1,33,638.99 37,742.33Other Income K 455.25 (596.89)Profit/(loss) on Sale of Investments (Net) 18.41 (3.00)Profit/(loss) on Sale of Assets (Net) (2,198.07) 3,482.76ToTaL 2,81,164.05 1,83,755.56 EXPENSES Ship Operating Expenses L 89,005.55 74,640.35Coal Operating Expenses L 1,23,297.53 36,713.87Administrative and Other Expenses M 6,732.16 6,808.21Finance Charges N 21,523.31 20,577.15Depreciation 30,666.67 34,090.65ToTaL 2,71,225.22 1,72,830.23 Profit Before Taxes 9,938.83 10,925.33 Provision for Taxation Current Tax (1,573.66) (2,333.26)Deferred Tax 220.56 78.62 MAT Credit Entitlement - 1,750.00 Profit After Taxes 8,585.73 10,420.69 Minority Interest (3,900.97)Short/Excess Provisions of earlier Years 4,715.17 -
- - Balance brought forward from last year 60,406.16 72,602.62
- (5,096.78)Available for Appropriations 69,806.09 77,926.53 Less/(Add): Appropriations Transfer to General Reserve - 100.00 Transfer to Debenture Redemption Reserve - 16,870.00 Proposed Dividend on Equity Shares - 471.98 Tax on Dividend - 78.39 Balance Carried to Balance Sheet 69,806.09 60,406.16 Earning Per Share (Equity Share of ` 1/- Each) Basic 1.97 2.26Diluted 1.97 2.26Significant Accounting Policies & Notes to the Accounts I
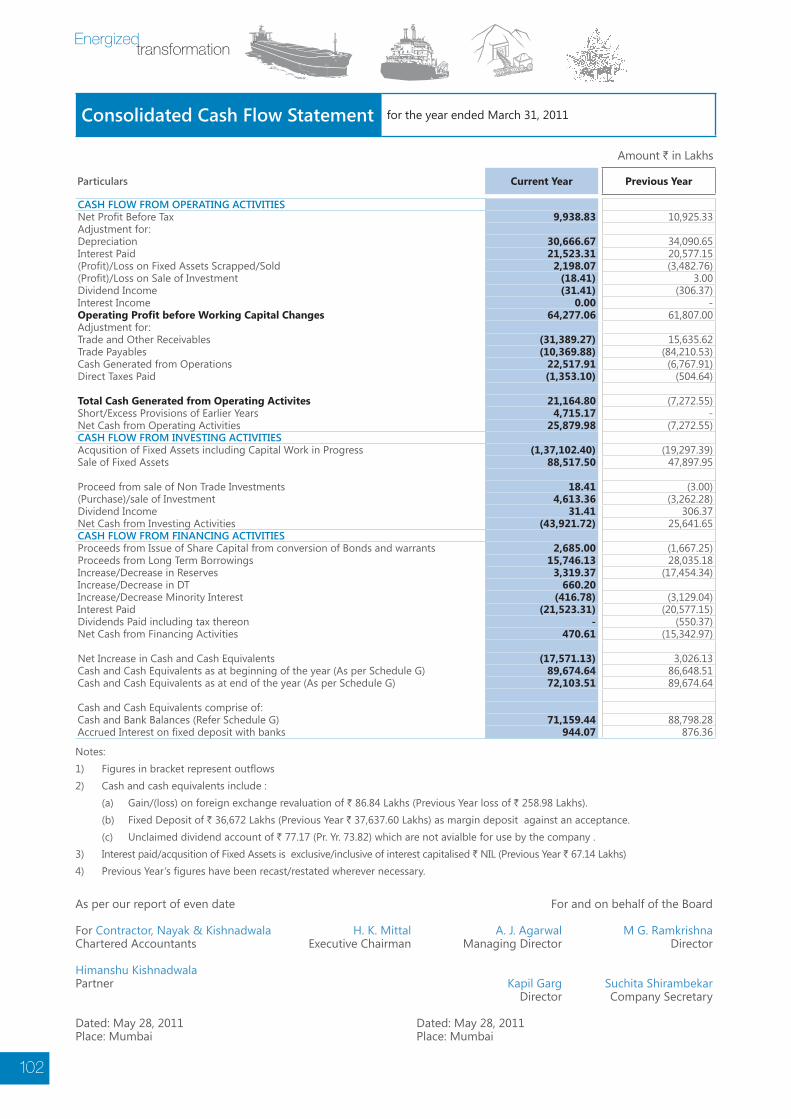
102
Consolidated Cash Flow Statement for the year ended March 31, 2011
As per our report of even date For and on behalf of the Board
For Contractor, Nayak & Kishnadwala H. K. Mittal A. J. Agarwal M G. RamkrishnaChartered Accountants Executive Chairman Managing Director Director
Himanshu Kishnadwala Partner Kapil Garg Suchita Shirambekar
Director Company Secretary
Dated: May 28, 2011 Dated: May 28, 2011Place: Mumbai Place: Mumbai
Amount ` in Lakhs
Particulars Current Year Previous Year
CASh FLOw FROM OPERATINg ACTIvITIES Net Profit Before Tax 9,938.83 10,925.33Adjustment for: Depreciation 30,666.67 34,090.65Interest Paid 21,523.31 20,577.15(Profit)/Loss on Fixed Assets Scrapped/Sold 2,198.07 (3,482.76)(Profit)/Loss on Sale of Investment (18.41) 3.00Dividend Income (31.41) (306.37)Interest Income 0.00 -Operating Profit before Working Capital Changes 64,277.06 61,807.00Adjustment for: Trade and Other Receivables (31,389.27) 15,635.62Trade Payables (10,369.88) (84,210.53)Cash Generated from Operations 22,517.91 (6,767.91)Direct Taxes Paid (1,353.10) (504.64)
Total Cash Generated from Operating Activites 21,164.80 (7,272.55)Short/Excess Provisions of Earlier Years 4,715.17 -Net Cash from Operating Activities 25,879.98 (7,272.55)CASh FLOw FROM INvESTINg ACTIvITIES Acqusition of Fixed Assets including Capital Work in Progress (1,37,102.40) (19,297.39)Sale of Fixed Assets 88,517.50 47,897.95
Proceed from sale of Non Trade Investments 18.41 (3.00)(Purchase)/sale of Investment 4,613.36 (3,262.28)Dividend Income 31.41 306.37Net Cash from Investing Activities (43,921.72) 25,641.65CASh FLOw FROM FINANCINg ACTIvITIES Proceeds from Issue of Share Capital from conversion of Bonds and warrants 2,685.00 (1,667.25)Proceeds from Long Term Borrowings 15,746.13 28,035.18Increase/Decrease in Reserves 3,319.37 (17,454.34)Increase/Decrease in DT 660.20 Increase/Decrease Minority Interest (416.78) (3,129.04)Interest Paid (21,523.31) (20,577.15)Dividends Paid including tax thereon - (550.37)Net Cash from Financing Activities 470.61 (15,342.97)
Net Increase in Cash and Cash Equivalents (17,571.13) 3,026.13Cash and Cash Equivalents as at beginning of the year (As per Schedule G) 89,674.64 86,648.51Cash and Cash Equivalents as at end of the year (As per Schedule G) 72,103.51 89,674.64
Cash and Cash Equivalents comprise of: Cash and Bank Balances (Refer Schedule G) 71,159.44 88,798.28 Accrued Interest on fixed deposit with banks 944.07 876.36
Notes: 1) Figures in bracket represent outflows 2) Cash and cash equivalents include : (a) Gain/(loss) on foreign exchange revaluation of ` 86.84 Lakhs (Previous Year loss of ` 258.98 Lakhs). (b) Fixed Deposit of ` 36,672 Lakhs (Previous Year ` 37,637.60 Lakhs) as margin deposit against an acceptance. (c) Unclaimed dividend account of ` 77.17 (Pr. Yr. 73.82) which are not avialble for use by the company . 3) Interest paid/acqusition of Fixed Assets is exclusive/inclusive of interest capitalised ` NIL (Previous Year ` 67.14 Lakhs)4) Previous Year’s figures have been recast/restated wherever necessary.

annual report
2010-11
103
Consolidated Financial StatementsCash Flow Statement | Schedules
Consolidated Schedules forming part of Annual Accounts
Amount ` in Lakhs
Particulars Current Year Previous Year
SChEDULE ‘A’ Share Capital Authorised 35,00,00,000 Equity Shares of ` 1/- each. 3,500.00 3,500.00 200,00,000 Preference Shares of ` 100 each. 20,000.00 20,000.00
23,500.00 23,500.00 Issued Capital 24,48,92,073 (23,59,92,073)Equity Shares of ` 1/- each fully paid up 2,448.92 2,359.92
2,448.92 2,359.92 Subscribed and Paid Up Capital Equity 24,48,92,073(23,59,92,073) Equity Shares of ` 1/- each fully paid up. 2,359.92 2,359.92 (a) 89,00,000 shares of ` 1/- alloted on exercise of option of conversion of 89,00,000 warrants issued on preferential basis during the year.
89.00
(b) 11,83,45,500 shares of ` 1/-were alloted as bonus Shares by capitalisation of Securities Premium Account during the year 2005-06.
2,448.92 2,359.92 SChEDULE ‘A1’ Warrants against Share Capital 1,88,80,000 warrants of face value of ` 13.75 each 2,596.00 -
During the year 2,77,80,000 warrants (each warrant carrying option/entitlement to subscribe 1 number of equity share of ` 1/- each) on or before May 2012 at a price of ` 55/- per share were allotted on preferential basis. Out of these option for conversion of 89,00,000 warrants was excercised during the year.
2,596.00 -
SChEDULE ‘B’ Reserves and Surplus Capital Reserve As per last Balance Sheet 1,693.49 26.24 Add: Transfer from Share Warrant Application money on forfeiture of Warrants - 1,667.25
1,693.49 1,693.49Capital Redempetion Reserve As per last Balance Sheet 4,000.00 4,000.00 (Created in the year 2007-08 on Redemption of Preference shares)
4,000.00 4,000.00 Securities Premium account As per last Balance Sheet 31,765.21 32,557.57 Add: Received during the year on conversion of warrants 4,806.00 Less: Premium payable on redemption of FCCBs (91.39) (792.36)
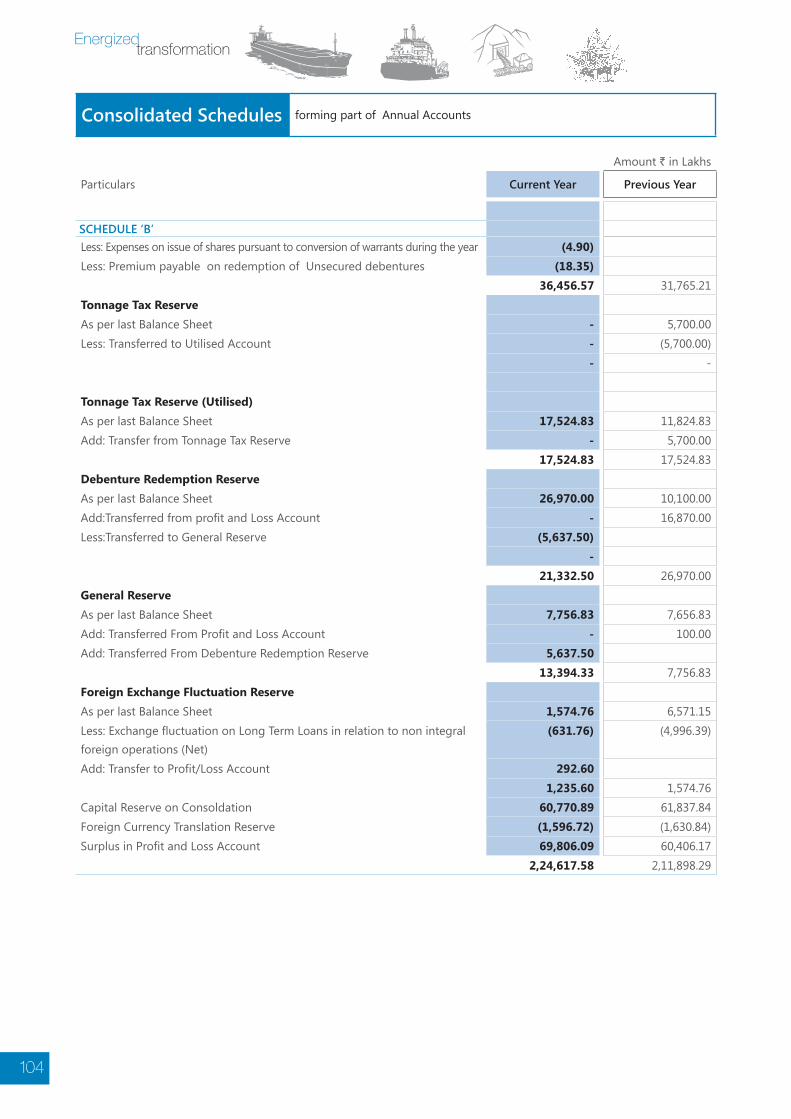
104
Consolidated Schedules forming part of Annual Accounts
Amount ` in Lakhs
Particulars Current Year Previous Year
SChEDULE ‘B’ Less: Expenses on issue of shares pursuant to conversion of warrants during the year (4.90)Less: Premium payable on redemption of Unsecured debentures (18.35)
36,456.57 31,765.21 Tonnage Tax Reserve As per last Balance Sheet - 5,700.00 Less: Transferred to Utilised Account - (5,700.00)
- -
Tonnage Tax Reserve (Utilised) As per last Balance Sheet 17,524.83 11,824.83 Add: Transfer from Tonnage Tax Reserve - 5,700.00
17,524.83 17,524.83 Debenture Redemption Reserve As per last Balance Sheet 26,970.00 10,100.00 Add:Transferred from profit and Loss Account - 16,870.00 Less:Transferred to General Reserve (5,637.50)
- 21,332.50 26,970.00
General Reserve As per last Balance Sheet 7,756.83 7,656.83 Add: Transferred From Profit and Loss Account - 100.00 Add: Transferred From Debenture Redemption Reserve 5,637.50
13,394.33 7,756.83 Foreign Exchange Fluctuation Reserve As per last Balance Sheet 1,574.76 6,571.15 Less: Exchange fluctuation on Long Term Loans in relation to non integral foreign operations (Net)
(631.76) (4,996.39)
Add: Transfer to Profit/Loss Account 292.60 1,235.60 1,574.76
Capital Reserve on Consoldation 60,770.89 61,837.84Foreign Currency Translation Reserve (1,596.72) (1,630.84)Surplus in Profit and Loss Account 69,806.09 60,406.17
2,24,617.58 2,11,898.29

annual report
2010-11
105
Consolidated Financial StatementsSchedules
Consolidated Schedules forming part of Annual Accounts
Amount ` in Lakhs
Particulars Current Year Previous Year
SChEDULE ‘C’ Secured Loans (A) Debentures
(1) 900 (900) 10.50% (11.25% upto June 30, 2009) Non Convertible Secured Debentures of ` 3,12,500/- (` 4,37,500/-) each, redeemable in 12 half yearly instalments of 6.25% and last two of 12.50 % of face value fo ` 10,00,000/- each commencing from six months after one year from the date of allotment i.e. June 30, 2004 toward face value Series VII A.There is a put/call option on June 30, every year.
2,812.50 3,937.50
- (2) 1500 11.90% Non Convertible Secured Debentures Series IXA of
` 10,00,000/- each with the tenor of 10 years, redeemable in 3 yearly instalments at the end of 8th, 9th and 10th year from the date of allotment (i.e November 4, 2008). There is call option at the end of 4th year from the date of allotment.In the event, this call option is not exercised by the Issuer at the end of 4th year, the coupon on the debentures would be increased to 12.35% p.a payable half yearly effective immediately there after for the balance tenor.
15,000.00 15,000.00
(3) 2500 9.50% Non Convertible Secured Debentures Series (NCDs) X of ` 10,00,000/- each with the tenor of 5 years, redeemable in 3 yearly instalments at the end of 3rd, 4th and 5th year from the date of allotment (i.e October 9, 2009 for 2000 NCDs and October 22, 2009 for 500 NCDs).
25,000.00 25,000.00
(4) 1000 9.50% Non Convertible Secured Debentures Series XI of `.10,00,000/- each with the tenor of 5 years, redeemable at the end of 5th year from the date of allotment (November 17, 2009).
10,000.00 10,000.00
(B) Foreign Currency Loans from Banks 2,07,926.29 1,84,859.77 (C) Term Loans from Scheduled Banks 48,098.80 44,198.80
- (D) working Capital facilities from Scheduled Banks 1,363.32 7,381.85
3,10,200.91 2,90,377.92 Note: 1) Debentures referred in (A) above are secured by first mortgage
on specified vessels of the company on pari-passu basis with other lenders and first/pari- passu charge on the specified immovable properties.
2) Foreign Currency Loan refered in (B) above are secured by, wherever applicablei) By way of exclusive charge on specifyed vesselsii) By way of pari-passu chargeon specified vesselsiii) By way of exclusive charge on specifyed mining assetsiv) Corporate guaranteesv) Personal guaranteesvi) Hypothecation of Stocks
3) Term Loan refered in (C) above are secured by first charge on specified vessels, on pari passu basis with other lenders.
4) Working capital facilities from Scheduled Banks are secured by second charge on specified vessels and 1st charge on all receivables and other current assets of the company on pari-passu basis.

106
Amount ` in Lakhs
Particulars Current Year Previous Year
SChEDULE ‘D’ Unsecured Loans 1) NIL (700) 1.50 %Foreign Currency Convertible Bonds of USD 10,000 each - 3,159.80
During the year, pursuant to notices received from Bondholders NIL (150) FCCBs of aggregate amount of NIL (USD 15,00,000) were converted into NIL (10,96,686) equity shares of ` 1/- each at a predetermined price of `
59.81 per share at a fixed exchange rate of ` 43.73 per USDThe balance bonds are convertible at any time up to the close of Business on April 20, 2010 by holders into newly issued ordinary shares of ` 1 each at agreed conversion price.The Bonds may be redeemed in whole at the option of the Company at any time on or after May 15, 2008 and or prior to April 20, 2010 at the accreted principal amount together with accrued interest.(The option on the bonds has not been exercised by the bond holders and hence they have been subscquently redeemed as per the terms.)
2) Commercial Paper (Maximum balance outstanding for commercial paper ` 10,000 Lakhs (` 10,000 Lakhs))
- 10,000.00
3) 1000 - 10.25% Non convertible Redeemable Debentures of ` 10,00,000 each redeemable in January 2012 with 1% redemption premium
10,000.00 -
(Amount repayable within one year ` 10,000 Lakhs (` 10,000 Lakhs)) - 4) USD 16,000,000 2.50 % Convertible Bonds B 7,144.00 8,061.06
Bonds B are 2.50 % unsecured convertible bonds due 2012. Bonds B are optionally
17,144.00 21,220.86
Consolidated Schedules forming part of Annual Accounts

annual report
2010-11
107
Consolidated Financial StatementsSchedules
SCh
EDU
LE E
Fixe
d a
sset
sAm
ount
` in
Lak
hsCo
stD
epre
ciat
ion
Net
Blo
ckN
et B
lock
Part
icul
ars
As a
t Apr
il 1,
201
0Tr
ansla
tion/
Adju
stm
ent
Addi
tion
for t
he
year
Ded
uctio
n fo
r the
yea
rAs
at M
arch
31
, 201
1U
pto
Mar
ch
31, 2
010
Tran
slatio
n/Ad
just
men
tAd
just
men
t in
resp
ect o
f As
sets
Sol
d/D
iscar
ded/
held
for
disp
osal
For t
he
Year
Up
to
Mar
ch 3
1,
2011
As a
t Mar
ch
31, 2
011
As a
t Mar
ch
31, 2
010
Goo
dwill
141
.17
-1.5
3 -
- 1
39.6
4 -
- -
- -
139
.64
141
.18
Land
12.
01
- 2
18.5
9 -
230
.60
0.0
8 -0
.31
- 1
5.02
1
4.79
2
15.8
1 1
1.92
Ro
ad a
nd b
ridge
s 3
19.9
7 -5
.60
- -
314
.37
53.
47
-4.0
5 -
45.
10
94.
52
219
.85
266
.51
Offi
ce P
rem
ises
570
.42
-2.8
0 1
6.86
-
584
.48
211
.23
-0.5
5 -
65.
29
275
.97
308
.51
359
.19
Vess
els
4,98
,793
.99
-3,1
07.0
8 55
,686
.67
18,
514.
81
5,3
2,85
8.77
7
4,80
2.31
-5
,666
.04
9,3
08.1
1 2
6,69
8.08
8
6,52
6.24
4
,46,
332.
53
4,2
3,99
1.67
O
ffice
and
Com
pute
r Eq
uipm
ent
246
.76
4.7
1 4
1.28
-
292
.75
144
.02
2.2
0 -0
.25
34.
62
181
.09
111
.66
102
.73
Furn
iture
and
Fix
ture
382
.13
-1.2
9 9
0.40
2
.65
468
.59
227
.85
-0.9
9 2
.12
67.
63
292
.37
176
.22
154
.29
Vehi
cles
363
.23
3.8
9 3
26.2
5 4
7.15
6
46.2
2 1
77.6
5 -0
.20
25.
35
118
.16
270
.26
375
.96
185
.59
Rig
89,
539.
16
-971
.96
- 8
8,56
7.20
0
.00
3,8
38.4
7 -1
10.8
1 7
,080
.90
3,3
53.2
4 -
0.0
0 8
5,70
0.70
M
inin
g Eq
uipm
ent
1,3
46.9
4 1
64.6
9 1
3.19
-
1,5
24.8
2 4
28.4
1 7
8.19
-
269
.52
776
.12
748
.70
918
.52
TOTA
L5,
91,7
15.7
8 -3
,916
.97
56,3
93.2
4 1,
07,1
31.8
1 5,
37,0
60.2
4 7
9,88
3.49
-5,7
02.5
6 1
6,41
6.23
3
0,66
6.66
8
8,43
1.36
4,
48,6
28.8
8 5,
11,8
32.3
0 Pr
evio
us Y
ear
6,07
,876
.71
-41,
998.
00
54,2
66.2
8 2
8,42
9.21
5,
91,7
15.7
8 5
9,34
5.14
-3
,477
.71
10,
074.
59
34,
090.
64
79,
883.
48
5,11
,832
.30
5,48
,531
.58
1)
Incl
udes
cos
t of 1
0 sh
ares
of `
50/
- ea
ch fu
lly p
aid
in M
ittal
Tow
er P
rem
ises
Co-
op. S
ocie
ty L
td.
2)
Offi
ce p
rem
ises
hav
ing
gros
s v
alue
` 3
43.1
6/-
Lakh
s ( `
343
.16/
-Lak
hs) a
nd a
ccum
ulat
ed d
epre
ciat
ion
` 12
6.11
Lak
hs (`
114
.68/
- La
khs)
are
giv
en o
n op
erat
ing
Leas
e.
3)
Ded
uctio
n in
clud
es e
xcha
nge
fluct
uatio
n ga
in o
n Lo
ng te
rm fo
reig
n cu
rren
cy lo
ans
` 3
85.5
2 La
khs
(11,
685.
99) (
Also
refe
r Not
e 26
Of
Sche
dule
I)
Consolidated Schedules forming part of Annual Accounts
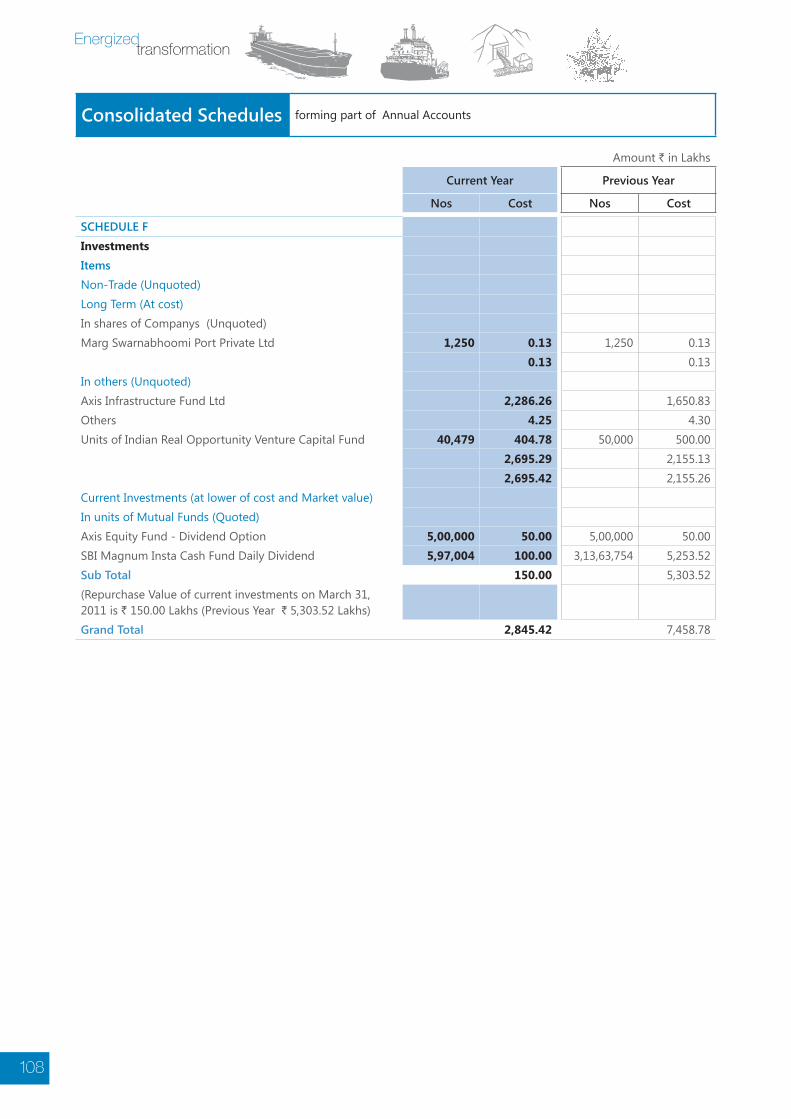
108
Amount ` in Lakhs
Current Year Previous Year
Nos Cost Nos Cost
SChEDULE F Investments ItemsNon-Trade (Unquoted) Long Term (At cost) In shares of Companys (Unquoted) Marg Swarnabhoomi Port Private Ltd 1,250 0.13 1,250 0.13
0.13 0.13 In others (Unquoted) Axis Infrastructure Fund Ltd 2,286.26 1,650.83 Others 4.25 4.30 Units of Indian Real Opportunity Venture Capital Fund 40,479 404.78 50,000 500.00
2,695.29 2,155.13 2,695.42 2,155.26
Current Investments (at lower of cost and Market value) In units of Mutual Funds (Quoted) Axis Equity Fund - Dividend Option 5,00,000 50.00 5,00,000 50.00 SBI Magnum Insta Cash Fund Daily Dividend 5,97,004 100.00 3,13,63,754 5,253.52 Sub Total 150.00 5,303.52 (Repurchase Value of current investments on March 31, 2011 is ` 150.00 Lakhs (Previous Year ` 5,303.52 Lakhs) grand Total 2,845.42 7,458.78
Consolidated Schedules forming part of Annual Accounts

annual report
2010-11
109
Consolidated Financial StatementsSchedules
Amount ` in Lakhs
Particulars Current Year Previous Year
SChEDULE ‘g’ Current assets Sundry Debtors (Unsecured, Considered Good) Over Six Months 8,462.66 6,486.85 Others 29,171.53 13,646.91
37,634.19 20,133.76Cash and Bank Balances Cash in hand 10.82 8.97 Balances with Scheduled Banks - In Fixed Deposit Accounts 62,240.96 39,163.02 (Includes Margin Deposit of ` 36,672 Lakhs (` 37,637.60 Lakhs) given against Acceptances/Bank Gurantee issued by banks)
In Current Accounts 8,377.99 37,397.15 In Exchange Earners Foreign Currency Account 32.19 9,879.57 In Dividend Accounts 77.17 73.82 Bank Balance/Fixed Deposits with Foreign Banks (Refer Note B(11)of Schedule I)
420.31 2,275.75
71,159.44 88,798.28 Loans and advances Advances recoverable in cash or in kind or for value to be received (Net of Provsions of DoubtFul Debts)
31,551.64 19,089.68
Deposits with Government and semi Government Bodies 17.28 16.93 Inter Corporate Deposits 1,253.39 268.98 Other Deposits 1,173.29 1,052.89 Accrued Interest on fixed deposit with banks 944.07 876.36 Advance payment of tax (Net of provisions) 1,521.63 1,113.09 MAT Credit available 1,535.00 1,750.00
37,996.30 24,167.93
Consolidated Schedules forming part of Annual Accounts

110
Amount ` in Lakhs
Particulars Current Year Previous Year
SChEDULE ‘h’ Current Liabilities Sundry Creditors Due to Micro and Small Enterprises (Refer Note B(9) of Schedule I) - For Services and expenses 18,557.23 13,427.19 Acceptances 55,879.48 85,152.67 Advances from Customers 9,068.39 4,642.34 Deposits 4.20 4.20 Unclaimed Dividend * 77.17 73.82 Other liabilities 14,327.17 5,968.84 *(There is no amount due and outstanding to be credited to Investor Education and Protection Fund)
97,913.64 1,09,269.06
Provisions Proposed Dividend - 471.98 Tax on Proposed Dividend - 78.39 Employees Retirement Benefits 280.53 143.45
280.53 693.82
SChEDULE ‘J’ Shipping and related Income Freight 61,911.84 46,189.22 Charter Hire 78,266.11 87,200.66 Dispatch and Demurrage 3,904.52 3,559.99 Cargo Handling Services 5,167.00 6,180.49
1,49,249.47 1,43,130.36
SChEDULE ‘K’ other Income Dividend from Current Investments 31.41 306.37 Rent Received 144.00 144.00 Gain/(loss) on FFA Transaction - (1,100.42)Insurance Claims - 52.76 Miscellaneous Income 279.84 0.40
455.25 (596.89)
Consolidated Schedules forming part of Annual Accounts
SChEDULE ‘L’ Ship Operating Expenses Bunker Consumed 17,546.60 20,132.03 Vessel/Equipment hire charges 33,250.29 18,484.30 Technical Service Expenses 8,952.19 8,598.80 Agency, Professional and Service charges 1,190.39 975.65 Crew expenses 2,830.64 3,013.09

annual report
2010-11
111
Consolidated Financial StatementsSchedules
Communication expenses 124.30 117.13 Miscellaneous expenses 855.72 756.21 Commission 2,552.63 1,876.35 Insurance 1,678.52 1,814.30 Port expenses 3,325.65 4,726.52Repairs and Maintenance 14,591.02 11,730.48 Stevedoring, Transport and Freight 2,107.60 2,415.49 89,005.55 74,640.35 Coal Operation Expenses Purchase of Coal 98,122.77 25,032.04 Distribution Cost 14,240.39 3,657.90 Government Payments 2,257.20 1,567.94 Mining Cost 8,677.17 6,039.59 Miscelleneous Expenses - 416.40 1,23,297.53 36,713.87
Consolidated Schedules forming part of Annual Accounts
Amount ` in Lakhs
Particulars Current Year Previous Year
SChEDULE ‘L’
SChEDULE ‘M’ Administrative and Other Expenses Advertisement 5.16 9.36 Auditors Remuneration 104.36 71.79 Conveyance, Car Hire and Travelling 524.12 364.14 Communication expenses 101.75 107.37 Donation 44.31 65.33 Directors’ Remuneration 207.79 522.32 Miscellaneous expenses 1,078.45 699.73 Exchange Fluctuations (Net) 539.59 1,783.22 Insurance 36.68 46.52 Legal, Professional and Consultancy expenses 713.75 354.35 Rent 555.09 605.97 Repairs and Maintenance 108.20 163.89 Salary, Wages, Bonus etc. 2,236.94 1,812.76 Staff Welfare, Training etc. 128.85 88.69 Contribution to Provident and other funds 79.33 54.06 Provision for Doubtful Debts - 84.41 Bad Debts and other amounts written off/back (Net) 267.79 (25.70)
6,732.16 6,808.21
SChEDULE ‘N’ Finance Charges Interest on Debentures 5,652.69 3,733.77 Loans 18,137.89 19,120.12
23,790.58 Less : Interest received (2,267.27) (2,276.74)
21,523.31 20,577.15

112
Consolidated Schedules forming part of Annual Accounts
SChEDULE I
A. Basis Of Consolidation
The Consolidated Financial Statements relate to Mercator Lines Limited (the company) and its subsidiary companies. The Company and its subsidiaries constitute the Group.
a) Basis of Accounting I. The financial statements of the subsidiary companies used in the consolidation are drawn upto the same
reporting date as of the Company i.e. year ended March 31, 2011.
II. The financial statements of the Group have been prepared in accordance with the principles and procedures required for the preparation and presentation of consolidated financial statements as laid down under the Accounting Standard 21 “Consolidated Financial Statements” as notified by the Companies (Accounting Standards) Rules, 2006.
b) Principles of consolidation The Consolidated Financial Statements have been prepared on the following basis:
I. The Financial statements of the Company and its subsidiary companies have been combined on a line by line basis by adding together book values of similar items of assets, liabilities income and expenses. The intra-group balances and intra-group transactions have been fully eliminated.
II. The difference between the cost of investments in the subsidiaries, over the net assets at the time of acquisition of shares in the subsidiaries is recognized in the financial statements as Goodwill or Capital Reserve, as the case may be.
III. Minority Interest in the net assets of consolidated subsidiaries consists of the amount of equity attributable to the minority shareholders at the date on which investments are made by the company in the subsidiary companies and further movements in their share in equity, subsequent to the date of the investment as stated above.
IV. Consolidated Financial Statements are prepared by applying uniform accounting policies to the extent possible, in use at the group.
V. Indian Rupee is the reporting currency for the Group. However, the reporting currencies of non-integral overseas subsidiaries are different from the reporting currency of the Group. The translation of those currencies into Indian Rupee is performed for assets and liabilities, using the exchange rate as at the balance sheet date, and for revenues, costs and expenses using average exchange rate during the reporting period. Resultant currency translation exchange gain/loss is carried as Foreign Currency Translation Reserve under Reserves and Surplus.

annual report
2010-11
113
Consolidated Financial StatementsSchedules
Consolidated Schedules forming part of Annual Accounts
Name of the Subsidiary Company Country of incorporation
% of holding either directly or through
subsidiary as at March 31, 2011
% of holding either directly or through
subsidiary as at March 31, 2010
Mercator International Pte.Ltd. Singapore 100 100Mercator Oil & Gas Ltd India 100 100Mercator Petroleum Ltd. India 100 100Mercator Offshore Holdings Pte. Ltd. Singapore 100 100Mercator Offshore (Nigeria) Pte Ltd Singapore 100 100Oorja Holdings Pte. Ltd Singapore 100 100Mercator PH (Dutch) Holding BV ** Netherlands - 89Mercator Petroleum (Romania) Pte Ltd** - 100Mercator Lines (Singapore) Ltd Singapore 71.95 72.15Mercator Offshore Ltd Singapore 100 100Mercator Petroleum (Turkey) BV ** Netherlands - 89Varsha Marine Pte. Ltd Singapore 100 100Vidya Marine Pte. Ltd Singapore 100 100Mercator Lines (Panama) Inc Panama 100 100Oorja 1 Pte. Ltd. Singapore 100 100Oorja 2 Pte. Ltd. Singapore 100 100Oorja 3 Pte. Ltd. Singapore 100 100Oorja Mocambique Minas, Limitada Mozambique 100 100MCS Holdings Pte. Ltd. Singapore 100 100Pt Oorja Indo Petangis Four Indonesia 100 50*Pt Oorja Indo Petangis Three Indonesia 100 50*Pt Oorja Indo KGS Indonesia 95 70Broadtec Mocambique Minas, Lda Mozambique 85 85PT Mincon Indo Resources Indonesia 100 100Target Ship Management Pte. Ltd Singapore 100 -Chitra Prem Pte. Ltd Singapore 100 -Bima Gema Permata PT Jakarta 100 -Nuansa Sakti Kenca PT Jakarta 100 -Ivorene Oil Services Nigeria Ltd Singapore 100 -Oorja (Batua) Pte Ltd Singapore 100 -
* Considered as subsidiaries for consolidation purposes on account of control as per principles of AS-21.
** Liquidated during the year.

114
B. Significant Accounting Policies
1. Basis of Accounting The financial statements are prepared under the historical cost convention, on the accrual basis of accounting and
in conformity with Generally Accepted Accounting Principles in India, Accounting Standards as notified by the Companies (Accounting Standards) Rules, 2006 and the other relevant provisions of the Companies Act, 1956.
2. Use of Estimates The preparation of financial statements in conformity with Generally Accepted Accounting Principles requires the
management to make estimates and assumptions that affect the reported balances of assets and liabilities as of the date of the financial statements and reported amounts of income and expenses during the period. The management believes that the estimates used in the preparation of financial statements are prudent and reasonable.
3. Fixed Assets a) Fixed assets are stated at cost less accumulated depreciation.
b) Cost includes cost of acquisition or construction including attributable interest, duties and other incidental expenses related to the acquisition of the asset.
c) Operating costs and other incidental costs including initial stores and spares of newly acquired vessels till the port of first loading are included in the cost of the respective vessels.
d) Exchange differences arising on repayment of foreign currency loans and year end translation of foreign currency liabilities relating to acquisition of depreciable assets are, following option given by notification of Ministry of Corporate Affairs (MCA) dated March 31, 2009, adjusted to carrying cost of the respective assets.
e) Individual fixed assets costing up to ` 25,000 are fully written off under the head fixed assets written off.
4. Exploration and evaluation expenditures Exploration and evaluation expenditure are capitalized when it is considered likely to be recoverable by future
exploitation or sale. This policy requires management to make certain estimates and assumptions as to future events and circumstances, in particular whether an economically viable extraction operation can be established. Any such estimates and assumptions may change as new information becomes available. If, after having capitalized the expenditure under the policy, a judgment is made that recovery of the expenditure is unlikely, the relevant capitalized amount will be written off to the profit and loss account.
5. Environmental Obligations Restoration, rehabilitation and environmental expenditures incurred during the production phase are charged to
profit and loss account as incurred.
Provision for decommissioning, demobilization and restoration provides for the legal obligations associated with the retirement of the tangible long-lived asset that result from the acquisition, construction or development and/or the normal operation of a long-lived asset. The retirement of a long-lived asset is it’s other than temporary removal from service, including its sale abandonment, recycling or disposal in some other manner.
These obligations are recognized as liabilities when a legal obligation with respect to the retirement of an asset is incurred, with the initial measurement of the obligation at fair value. These obligations are accreted to full value over time through charges to the statement of income. In addition, an asset retirement cost equivalent to these liabilities is capitalized as part of the related asset’s carrying value and is subsequently depreciated or depleted over the asset’s useful life. A liability for asset retirement obligation is incurred over more than one reporting period when the event creating the obligation occur over more than one reporting period. For example, if a facility is permanently closed but the closure plan is developed over more than one reporting period, the cost of closure of the facility is incurred over those reporting period when the closure plan is finalized. Any incremental liability incurred in a subsequent reporting period is considered to be an addition layer of the original liability.
Consolidated Schedules forming part of Annual Accounts

annual report
2010-11
115
Consolidated Financial StatementsSchedules
Each layer is initially measured at fair value. A separate layer shall be measure, recognized and accounted for prospectively. The obligations consist primarily of costs associated with mine reclamation, decommissioning and demobilization of facilities and other closure activities.
For environmental issues that may not involve the retirement of an asset, where the Company is a responsible party and is determined that a liability exists, and amounts can be quantified, the Company accrues for the estimated liability existing in respect of such environmental issues. The Company applies the criteria for liability recognition under the applicable accounting standards.
6. Depreciation a) Depreciation on Vessels and on fixed assets held outside India is provided using straight line method based
on estimated useful life or on the basis of depreciation rates prescribed under respective local laws.
b) Depreciation on all other assets is computed on the Written Down Value method in the manner and at the rates prescribed under schedule XIV of the Companies Act, 1956.
c) Depreciation on assets acquired under lease is spread over the lease terms.
7. Capital work in Progress All expenditures, including advances given to contractors and borrowings cost incurred during the asset
acquisition period, are accumulated and shown under this head till the asset is put to commercial use.
8. Retirement and Disposal of Assets a) Profit on sale of assets is accounted for on completion of sale thereof.
b) Assets which are retired from active use and are held for disposal are stated at the lower of their net book value or net releasable value.
9. Inventories Bunker and Lubes on vessels are valued at lower of cost and net realisable value ascertained on first in first out basis.
Inventory of coal is valued at the lower of cost or net realizable value. Cost is determined based on the weighted average cost incurred during the period and includes an appropriate portion of fixed and variable overheads. Net realizable value is the estimated sales amount in the ordinary course of business less the costs of completion and selling expense.
10. Oil and gas Assets: The Successful Efforts method is followed for accounting for oil and gas as per the Guidance Note issued by the
Institute of Chartered Accountants of India on “Accounting for Oil and Gas producing activities”.
Expenditure incurred on the acquisition of a license interest is initially capitalised on a license by license basis. Costs are held, undepleted, within exploratory and development wells-in- progress until the exploration phase relating to the license area is complete or commercial oil and gas reserves have been discovered.
11. Investments a) Investments are classified into Long Term and Current investments.
b) Long Term Investments are stated at cost of acquisition and related expenses. Provision for diminution, if any, in the value of such investments is made to recognise a decline, other than of a temporary nature.
c) Current Investments are stated at cost of acquisition including incidental/related expenses or at fair value as at March 31, 2011, whichever is less and the resultant decline, if any, is charged to revenue.
12. Incomplete voyages Incomplete voyages represent freight received and direct operating expenses on voyages which are not complete
as at the Balance sheet date.
Consolidated Schedules forming part of Annual Accounts

116
13. Borrowing Costs Borrowing costs incurred for the year for acquisition of vessels are capitalized till first loading of cargo, only if the time
gap between date of Memorandum of Agreement and Date when vessel is ready for use is more than three months.
In respect of other assets, borrowing cost incurred till the date when asset is put to use is capitalized.
Incidental expenses related to borrowing are amortized over the term of the said borrowings.
14. Revenue Recognition a) Income on account of freight earnings is recognised in all cases where loading of the cargo is completed
before the close of the year. All corresponding direct expenses are also provided.
b) Where loading of the cargo is not completed before the close of the year, revenue is not recognised and the corresponding expenses are carried forward to the next accounting year.
c) Income from charter hire and demurrage are recognised on accrual basis.
d) Income from services is accounted on accrual basis as per the terms of the relevant agreement.
e) Dividend on investments is recognised when the right to receive the same is established.
f) Insurance claims are accounted on accrual basis when there is a reasonable certainty of the realisability of the claim amount.
g) Revenue from coal mining is recognized on transfer of risk, reward and ownership of the goods, and is recorded net of returns, trade allowance, and government duties.
15. Foreign Exchange Transactions a) Monetary Current assets and liabilities denominated in foreign currency, outstanding at the end of the year
are valued at the rates prevalent on that date.
b) Exchange differences arising on Long Term Foreign Currency Monetary (LTFCM) items are, following option given by notification of MCA dated March 31, 2009, treated in the following manner:
i) In respect of borrowings relating to or utilized for acquisition of depreciable capital assets, the same is adjusted to the cost of the relevant capital asset and depreciated over the balance life of the said capital asset.
ii) In other cases, the same is accumulated in a ‘Foreign Currency Monetary Item Translation Difference Account’. The amount so accumulated in this account is amortized over the balance period of such assets/liabilities or March 31, 2011, whichever is earlier.
c) Differences in translation of other monetary assets and liabilities and realised gains and losses on foreign currency transactions are recognised in the Profit and Loss Account.
d) Exchange difference arising on long term foreign currency loans given to non integral foreign operations is accumulated in foreign currency fluctuation reserve. On disposal of investment , the balance in the reserve will be transferred to profit and loss account
e) Contracts in the nature of foreign currency swaps, are converted at the exchange rate prevailing as on March 31, 2011,and the profit or loss thereon is charged to the Profit and Loss account.
f) Differences on account of swap contracts for interest payable in foreign currency are accounted on accrual basis and the profit or loss thereon is charged to the Profit and Loss account.
Consolidated Schedules forming part of Annual Accounts

annual report
2010-11
117
Consolidated Financial StatementsSchedules
16. Employees Benefits a) Short – term employee benefits
All employee benefits payable wholly within twelve months of rendering the service are classified as short term employee benefits. Benefits such as salaries, wages, performance incentives, etc. are recognised at actual amounts due in the period in which the employee renders the related service.
b) Post – employment benefits
i. Defined Contribution Plans
Payments made to defined contribution plans such as Provident Fund are charged as an expense as they fall due.
ii. Defined Benefit Plans
The cost of providing benefit i.e. gratuity is determined using the Projected Unit Credit Method, with actuarial valuation carried out as at the balance sheet date. Actuarial gains and losses are recognised immediately in the Profit and Loss Account.
c) Other Long – term employee benefits
i. Other Long – term employee benefit viz. leave encashment is recognised as an expense in the profit and loss account as and when it accrues. The company determines the liability using the Projected Unit Credit Method, with actuarial valuation carried out as at the balance sheet date. The Actuarial gains and losses in respect of such benefit are charged to the profit and loss account.
17. Lease Accounting a) In respect of operating lease agreements entered into as a lessee, the lease payments are recognised as
expense in the profit and loss account over the lease term.
b) In respect of operating lease agreement entered into as a lessor, the initial direct costs are recognised as expenses in the year in which they are incurred.
c) At the beginning of the lease period, the finance lease is capitalised based on the fair value of leased assets or based on the present value of a minimum lease payment, if the present value is lower than the fair value. The minimum lease payment is bifurcated between the financial cost and the payment obligation so as to produce a constant periodical interest rate for the obligation. Lease expense is recorded in the Profit & Loss Account. Leased assets under finance lease are recorded in the fixed assets account and depreciated based on the useful lives of the assets or the lease period, whichever is shorter.
18. Earning per share: Basic and diluted earnings per share (EPS) are reported in accordance with Accounting Standard – 20. The
Basic EPS has been computed by dividing the income available to equity shareholders by the weighted average number of equity shares outstanding during the accounting year. The diluted EPS have been computed using the weighted average number of equity shares and dilutive potential equity shares outstanding at the end of the year.
19. Provision for Taxation : a) The holding company has opted for the Tonnage Tax scheme and provision for tax has been accordingly
made under the relevant provisions of the Indian Income Tax Act, 1961.
b) Tax on incomes on which the Tonnage Tax is not applicable is provided as per the other provisions of the Indian Income Tax Act, 1961.
Consolidated Schedules forming part of Annual Accounts

118
c) In case of subsidiary companies engaged in shipping and incorporated in Singapore, no provision is made for taxation on qualifying shipping income derived which is exempt form taxation under section 13 A of the Singapore Income Tax Act and the Singapore Approved International shipping enterprise Tax Incentive.
d) In respect of a subsidiary company in Singapore engaged in offshore drilling & support services, no provision for tax is made for qualifying offshore income as it is exempt from taxation under Section 13 F of Singapore Income Tax Act.
e) In respect of subsidiary companies incorporated in Singapore and Indonesia and engaged in activities other than shipping and offshore, provision for taxation is made as per the applicable local laws of the respective countries.
f) Deferred tax resulting from timing differences, if any, between book and tax profits for income other than that covered under relevant Tax exempt scheme is accounted for under the liability method, at the current rate of tax, to the extent that the timing differences are expected to be reversed in future.
20. Impairment of assets A review is done of the carrying values of tangible and intangible assets for any possible impairment at each
balance sheet date. Impairment loss, if any, is recognized in the year in which impairment takes place.
21. Provisions and Contingent Liabilities: Provisions are recognized in the accounts in respect of present probable obligations, the amount of which can
be reliably estimated. Contingent Liabilities are disclosed in respect of possible obligations that arise from past events but their existence is confirmed by the occurrence or non occurrence of one or more uncertain future events not wholly within the control of the Company or its subsidiary companies.
22. Derivative instruments and hedge accounting The Group uses foreign currency forward contracts; forward freight agreements, options on forward freight
agreements and currency options to hedge its risks associated with foreign currency fluctuations and fluctuations in freight rates relating to certain firm commitments and forecasted transactions. The Company has designated these hedging instruments as cash flow hedges or economic hedges applying the recognition and measurement principles set out in the Accounting Standard 30 “Financial Instruments : Recognition and Measurement” (AS – 30
The use of hedging instruments is governed by the Company’s policies approved by the board of directors, which provide principles on the use of such financial derivatives consistent with the Company’s risk management strategy
Derivatives are initially recognised at fair value at the dates the derivative contracts are entered into and are subsequently re-measured to their fair values at each balance sheet date.
The resulting gain or loss is recognised in the profit and loss statement immediately unless the derivative is designated and effective as a hedging instrument, in which event the timing of the recognition in the profit and loss statement depends on the nature of the hedge relationship.
Hedge accounting Hedges which include derivatives, embedded derivatives and non-derivatives in respect of price risk, are
designated as either hedges of fair value of recognised assets or liabilities or fair commitments (fair value hedges) or hedges of highly probable forecast transactions (cash flow hedges).
Some forward freight agreements that the Group has entered into fall within the definition of fair value hedge. Some other forward freight agreements fall within the definition of cash flow hedge as described below.
At the inception of the hedge relationship, the relationship between the hedging instrument and hedged item is determined, along with its risk management objectives and the strategy for undertaking the hedge. At the inception of the hedge and on a quarterly basis, the effectiveness of the hedging relationship in offsetting changes in fair values or cash flows of the hedged item is determined.
Fair value hedge Changes in the fair value of derivatives that are designated and qualify as fair value hedges will be recorded in
the profit and loss statement immediately, together with any changes in the fair value of the hedged item that is
Consolidated Schedules forming part of Annual Accounts

annual report
2010-11
119
Consolidated Financial StatementsSchedules
attributable to the hedged risk.
Hedge accounting will be discontinued when the Group revokes the hedging relationship, the hedging instrument expires or is sold, terminated, or exercised, or no longer qualifies for hedge accounting. The adjustment to the carrying amount of the hedged item arising from the hedged risk will be amortised to the profit and loss statement from that date.
Cash flow hedge The effective portion of changes in the fair value of derivatives that are designated as and qualify as cash flow
hedges are deferred in equity. The gain or loss relating to the ineffective portion of the hedge, if any, is recognised immediately in the profit and loss statement.
Amounts deferred in equity will be recycled in the profit or loss in the periods when the hedged item is recognised in the profit and loss statement. However, when the forecast transaction that is hedged results in the recognition of a non-financial asset or a non-financial liability, the gains and losses previously deferred in equity will be transferred from equity and included in the initial measurement of the cost of the asset or liability.
Hedge accounting will be discontinued when the Group revokes the hedging relationship, the hedging instrument expires or is sold, terminated, or exercised, or no longer qualifies for hedge accounting. Any cumulative gain or loss deferred in equity at that time will remain in equity and will be recognised when the forecast transaction is ultimately recognised in the profit and loss statement. When a forecast transaction is no longer expected to occur, the cumulative gain or loss that had been deferred in equity will be recognised immediately in the profit and loss statement.
C. Notes To The Accounts1. Contingent Liabilities not provided for
` in LakhsCurrent Year Previous Year
Counter guarantees issued by the Company for guarantees for guarantees obtained the bank
3,130.87 2,863.08
Corporate guarantees issued by the company on behalf of wholly owned subsidiaries
2,722.53 NIL
Total 5,853.40 2,863.08
2. Estimated amount of contracts remaining to be executed on capital accounts and not provided for (net of advances) as at March 31, 2011, ` NIL (` 58,682 Lakhs).
3. Estimated amount of commitments outstanding towards contributions to funds are ` 900.59 Lakhs (` 993.98 Lakhs)
4. No provision has been made in respect of disputed demands from Income-tax Authorities to the extent of ` 666.67 Lakhs (` 37.73 Lakhs), since the company has reasons to believe that it would get relief at the appellate stage as the said demands are excessive and erroneous.
5. Remuneration to holding Company Directors
Current Year Previous Year
Executive Chairman and Managing Directors Salary 80.43 80.58Perquisites 15.57 15.42Commission NIL -
Non-Executive DirectorsCommission NIL -Sitting Fees 5.40 4.60Total 101.40 100.60
Consolidated Schedules forming part of Annual Accounts

120
6. Disclosure requirement of accounting Standard 17 “Segment Reporting” issued under Companies (Accounting Standards) Rules 2006.
Primary Segments: The group has identified Business Segment as the primary segment. Segments have been identified taking
into account the nature of the services/products, the differing risks and returns, the organisation structure and internal reporting system. The group’s operations predominantly relate to
a) Shipping
b) Offshore
c) Coal Mining, Trading and Logistics.
Secondary Segment: The shipping activities are managed from India and Singapore. The Off Shore activities are managed from
Singapore. The Coal Mining, Coal Trading and logistics are managed from India, Singapore and Indonesia.
Segment Revenue, Segment Results, Segment Assets and Segment Liabilities include the respective amounts identifiable to each of the segments as also amounts allocated on a reasonable basis. The expenses, which are not directly attributable to the business segment, are shown as others.
Assets and Liabilities that cannot be allocated between the segments are shown as a part of unallocated corporate assets and liabilities respectively.
There are no Inter Segment transfers.
Consolidated Schedules forming part of Annual Accounts

annual report
2010-11
121
Consolidated Financial StatementsSchedules
Consolidated Schedules forming part of Annual Accounts
Segm
ent R
even
ueSh
ippi
ngO
ffsho
reCo
al M
inin
g,
Trad
ing
and
Logi
stic
s
Oth
ers
Una
lloca
ted
Tota
l
2010
-11
2009
-10
2010
-11
2009
-10
2010
-11
2009
-10
2010
-11
2009
-10
2010
-11
2009
-10
2010
-11
2009
-10
Reve
nue
1,29
,903
.59
1,21
,666
.50
11,9
80.8
115
,970
.06
1,38
,805
.99
43,8
32.2
5-
473.
6650
3.53
2,81
,164
.05
1,81
,972
.34
Resu
lts
Profi
t/(L
oss)
bef
ore
tax
and
inte
rest
13,0
83.8
8
18,7
20.0
0 8,
351.
1411
,676
.96
9,55
5.66
601.
99(2
.21)
473.
6650
3.53
31,4
62.1
431
,502
.48
Less
:Int
eres
t (2
1,52
3.31
)20
,577
.15
Tota
l Pro
fit B
efor
e Ta
x 9,
938.
8210
,925
.35
Prov
isio
n fo
r Tax
atio
n
Curr
ent T
ax
(1
,573
.66)
(2,3
33.2
6)
Def
erre
d Ta
x
220.
5678
.62
Min
imum
Alte
rnat
e Ta
x
-1,
750.
00
Net
Pro
fit
8,
585.
7210
,420
.71
Oth
er In
form
atio
n
Asse
ts
5,67
,527
.04
551
748.
6282
,527
.22
95,7
47.0
539
,283
.58
13,3
01.1
233
6.42
2,84
5.42
7,45
8.78
6,92
,520
.24
6,68
,255
.57
Liab
ilitie
s 21
,454
.76
22,4
62.4
814
,949
.33
78.4
38,
101.
492,
436.
4814
2.77
3,83
,224
.39
3,97
,519
.09
4,27
,872
.74
4,22
,946
.48
Capi
tal E
xpen
ditu
re
55,8
92.8
354
,196
.00
22.
0147
8.39
70.2
856
,393
.23
54,2
66.2
8
Dep
reci
atio
n 26
,842
.93
29
,825
.70
3,35
5.48
3,76
9.70
468.
25
49
5.25
30
,666
.67
34,0
90.6
5

122
Consolidated Schedules forming part of Annual Accounts
7 Related Party Disclosures:
A List of Related Parties
I Promoter group Companies / Companies in which Director(s) is/are substantially interested
1 MLL Logistics Private Limited
2 Mercator Mechmarine Limited
3 Mercator Healthcare Limited
4 Ankur Fertilizers Private Limited
5 Rishi Holding Private Limited
6 AHM Investments Private Limited.
7 Oorja Resources India Pvt Ltd
8 AAAM Properties Pvt Ltd
9 MMAXX Dredging Pvt Ltd
10 Vaitarna Marine Infrastructure Ltd. (earlier Mech Marine Engineers Pvt Ltd)
11 Oilmax Energy Pvt Ltd
12 Optimum Oil & Gas Ltd
13 CMA Constructions & Properties Pvt Ltd
14 OMCI Ship Management Pvt Ltd
II Key Management Personnel
1 H.K Mittal
2 A.J. Agarwal
3 Shalabh Mittal
4 K. Raheja
III Relative of Key Management Personnel
1 Adip Mittal
2 Shruti Mittal
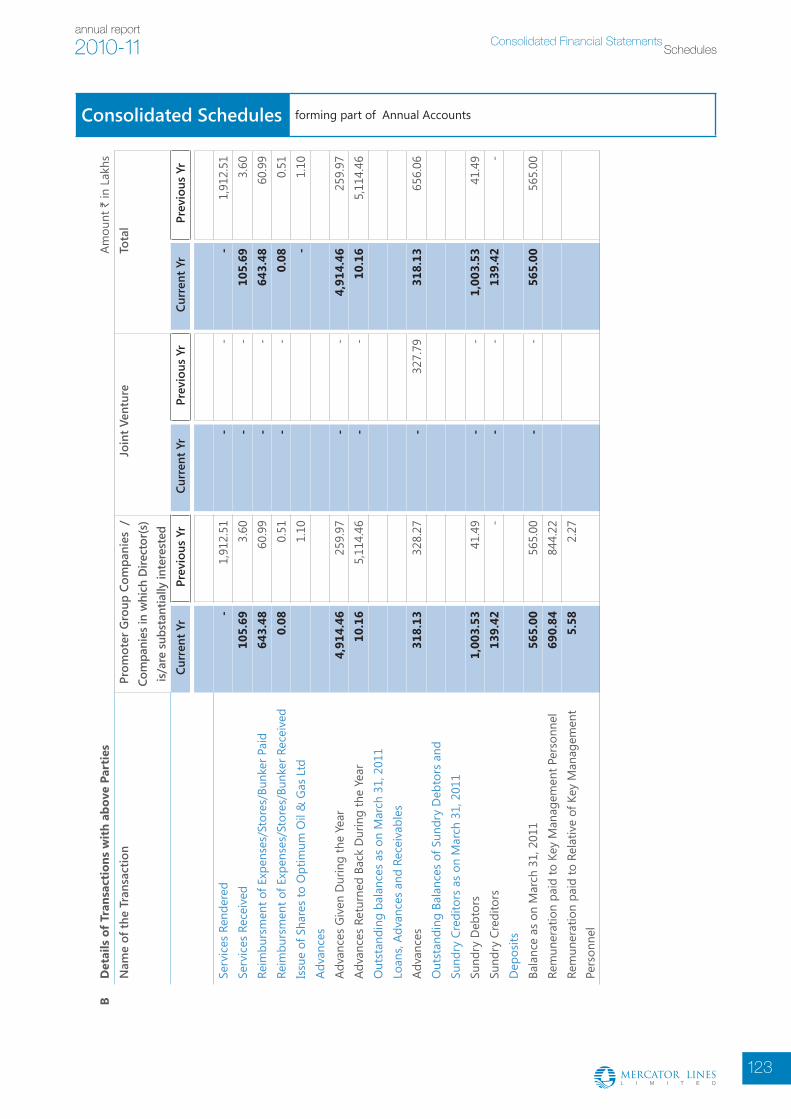
annual report
2010-11
123
Consolidated Financial StatementsSchedules
BD
etai
ls o
f Tra
nsac
tion
s w
ith
abov
e Pa
rtie
sAm
ount
` in
Lak
hsN
ame
of th
e Tr
ansa
ctio
n P
rom
oter
gro
up C
ompa
nies
/
Com
pani
es in
whi
ch D
irect
or(s
) is
/are
sub
stan
tially
inte
rest
ed
Joi
nt v
entu
re
Tot
al
Cur
rent
Yr
Pre
viou
s Yr
C
urre
nt Y
r P
revi
ous
Yr
Cur
rent
Yr
Pre
viou
s Yr
Serv
ices
Ren
dere
d -
1
,912
.51
-
-
-
1,9
12.5
1 Se
rvic
es R
ecei
ved
105.
69 3
.60
-
-
105.
69 3
.60
Reim
burs
men
t of E
xpen
ses/
Stor
es/B
unke
r Pai
d64
3.48
60.9
9 -
-
64
3.48
60.9
9Re
imbu
rsm
ent o
f Exp
ense
s/St
ores
/Bun
ker R
ecei
ved
0.0
8 0
.51
-
-
0.0
8 0
.51
Issu
e of
Sha
res
to O
ptim
um O
il &
Gas
Ltd
1.1
0 -
1
.10
Adva
nces
Ad
vanc
es G
iven
Dur
ing
the
Year
4
,914
.46
259.
97 -
-
4
,914
.46
259.
97Ad
vanc
es R
etur
ned
Back
Dur
ing
the
Year
10
.16
5,11
4.46
-
-
10.1
65,
114.
46O
utst
andi
ng b
alan
ces
as o
n M
arch
31,
201
1Lo
ans,
Adva
nces
and
Rec
eiva
bles
Adva
nces
318
.13
328.
27 -
3
27.7
9 3
18.1
3 65
6.06
Out
stan
ding
Bal
ance
s of
Sun
dry
Deb
tors
and
Su
ndry
Cre
dito
rs a
s on
Mar
ch 3
1, 2
011
Sund
ry D
ebto
rs 1
,003
.53
41.
49
-
-
1,0
03.5
3 4
1.49
Su
ndry
Cre
dito
rs13
9.42
-
-
-
139.
42 -
D
epos
its
Bala
nce
as o
n M
arch
31,
201
156
5.00
565.
00 -
-
56
5.00
565.
00Re
mun
erat
ion
paid
to K
ey M
anag
emen
t Per
sonn
el 6
90.8
4 8
44.2
2 Re
mun
erat
ion
paid
to R
elat
ive
of K
ey M
anag
emen
t Pe
rson
nel
5.5
8 2
.27
Consolidated Schedules forming part of Annual Accounts

124
CPa
rtyw
ise
Det
ails
of M
ater
ial T
rans
acti
ons
Amou
nt `
in L
akhs
Nam
e of
the
Tran
sact
ion
Pro
mot
er g
roup
Com
pani
es /
Co
mpa
nies
in w
hich
Dire
ctor
(s)
is/a
re s
ubst
antia
lly in
tere
sted
Joi
nt v
entu
re
Tot
al
Cur
rent
Yr
Pre
viou
s Yr
C
urre
nt Y
r P
revi
ous
Yr
Cur
rent
Yr
Pre
viou
s Yr
Serv
ices
Ren
dere
dM
LL L
ogis
tics
Priv
ate
Lim
ited
-
1,9
12.5
1 -
-
-
1
,912
.51
TOTA
L -
1
,912
.51
-
-
-
1,9
12.5
1 Se
rvic
es R
ecei
ved
MLL
Log
istic
s Pr
ivat
e Li
mite
d 3
.60
3.6
0 -
-
3
.60
3.6
0 O
MCI
Shi
p M
anag
emen
t Pvt
Lim
ited
32.
77
-
-
-
32.
77
-
Oilm
ax E
nerg
y Pr
ivat
e Li
mite
d69
.32
69.3
2TO
TAL
105.
69 3
.60
-
-
105.
69 3
.60
Reim
burs
men
ts o
f Exp
ense
s/St
ores
/Bun
ker P
aid
Anku
r Fer
tiliz
ers
Priv
ate
Lim
ited
-
60.
29
-
-
-
60.
29
OM
CI S
hip
Man
agem
ent P
vt L
imite
d 6
30.8
5 -
-
-
6
30.8
5 -
TO
TAL
630
.85
60.
29
-
-
630
.85
60.
29
Reim
burs
men
ts o
f Exp
ense
s/St
ores
/Bun
ker R
ecei
ved
Mec
h M
arin
e En
gine
ers
Pvt L
td0.
060.
340.
060.
34M
MAX
X D
redg
ing
Pvt L
td 0
.02
0.1
7 -
-
0
.02
0.1
7 TO
TAL
0.0
8 0
.51
-
-
0.0
8 0
.51
Issu
e of
Sha
res
to O
ptim
um O
il &
Gas
Ltd
1.1
0 -
- -
1
.10
Adva
nces
Ad
vanc
es G
iven
Dur
ing
the
Year
M
LL L
ogis
tics
Pvt L
td
-
250
.00
-
-
-
250
.00
Mec
h M
arin
e en
gine
ers
Pvt L
td
4,9
14.4
6 -
-
-
4
,914
.46
-
TOTA
L 4
,914
.46
250
.00
-
-
4,9
14.4
6 2
50.0
0 Ad
vanc
es R
ecei
ved
Back
Dur
ing
the
Year
M
ech
Mar
ine
engi
neer
s Pv
t Ltd
-
4
,914
.46
-
-
-
4,9
14.4
6 O
orja
Res
ourc
es In
dia
Pvt L
td 9
.97
--
- 9
.97
-TO
TAL
9.9
7 4
,914
.46
-
-
9.9
7 4
,914
.46
Consolidated Schedules forming part of Annual Accounts

annual report
2010-11
125
Consolidated Financial StatementsSchedules
Out
stan
ding
bal
ance
s as
on
Mar
ch 3
1, 2
011
Loan
s, Ad
vanc
es a
nd R
ecei
vabl
esAd
vanc
esM
LL L
ogis
tics
Pvt L
td 3
18.1
3 3
18.1
3 -
-
3
18.1
3 3
18.1
3 PT
Meg
a Co
al In
dom
ine
327
.79
-
327
.79
TOTA
L 3
18.1
3 31
8.13
-
327
.79
318
.13
645.
92O
utst
andi
ng B
alan
ces
of S
undr
y D
ebto
rs a
nd
Sund
ry C
redi
tors
as
on M
arch
31,
201
1Su
ndry
Deb
tors
MLL
Log
istic
s Pr
ivat
e Li
mite
d 1
,003
.53
41.
49
-
-
1,0
03.5
3 4
1.49
TO
TAL
1,0
03.5
3 4
1.49
-
-
1
,003
.53
41.
49
Sund
ry C
redi
tors
OM
CI S
hip
Man
agem
ent P
vt L
imite
d 1
29.3
3 -
-
-
1
29.3
3 -
TO
TAL
129
.33
-
-
-
129
.33
-
Dep
osit
Bala
nce
as o
n M
arch
31,
201
1M
LL L
ogis
tics
Priv
ate
Lim
ited
500
.00
500
.00
-
-
500
.00
500
.00
TOTA
L 5
00.0
0 5
00.0
0 -
-
5
00.0
0 5
00.0
0
Part
ywis
e D
etai
ls o
f Mat
eria
l Tra
nsac
tion
sAm
ount
` in
Lak
hsN
ame
of th
e Tr
ansa
ctio
n P
rom
oter
gro
up C
ompa
nies
/
Com
pani
es in
whi
ch D
irect
or(s
) is
/are
sub
stan
tially
inte
rest
ed
Joi
nt v
entu
re
Tot
al
Cur
rent
Yr
Pre
viou
s Yr
C
urre
nt Y
r P
revi
ous
Yr
Cur
rent
Yr
Pre
viou
s Yr
Consolidated Schedules forming part of Annual Accounts

126
8. Disclosure in respect of operating lease (as Lessee):` in Lakhs
Year Ended March 31, 2011
Year ended March 31, 2010
(a) Operating LeasesDisclosures in respect of cancelable agreements for office premises taken on lease(i) Lease payments recognized in the Profit and Loss Account 1,458.64 512.07(ii) Significant leasing arrangements
The Company has given refundable interest free security deposits under the agreements.The lease agreements are for a period from 60- 108 months.
These agreements also provided for increase in rent.These agreements are non cancellable by both the parties for 24–60 months except in certain exceptional circumstances.
(iii) Future minimum lease payments under non-cancellable agreementsNot later than one year 1,551.35 491.12Later than one year and not later than five years 838.53 325.02Later than five years NIL NIL
9. Disclosure in respect of operating lease (as Lessor):` in Lakhs
Year Ended March 31, 2011
Year ended March 31, 2010
(a) Operating LeasesDisclosures in respect of cancellable agreements for office given on lease(i) Lease receipt recognized in the Profit and Loss Account 144.00 144.00(ii) Significant leasing arrangements- The Company has taken refundable interest free security
deposits under the agreements.The lease agreements are for a period of 60 months.
- These agreements are non cancelable by both the parties for 18 months except in certain exceptional circumstances.
(iii) Future minimum lease receivable under non-cancellable agreements
- Not later than one year NIL NIL- Later than one year and not later than five years NIL NIL- Later than five years NIL NILDisclosures in respect of cancellable agreements for Rig given on lease(i) Lease receipt recognized in the Profit and Loss Account 14,178.88 15,969.07(ii) Significant leasing arrangements- The lease agreements are for a period of 36 months.- These agreements are non cancelable by both the parties
except in certain exceptional circumstances.(iii) Future minimum lease receivable under non-cancellable
agreements- Not later than one year NIL 15,273.34- Later than one year and not later than five years- Later than five years NIL 14,436.45
General description of leasing arrangement: (i) Leased Assets: Office premises, Godown And Rig (ii) Future Lease rentals are determined on the basis of agreed terms.
Consolidated Schedules forming part of Annual Accounts

annual report
2010-11
127
Consolidated Financial StatementsSchedules
10. Disclosure in respect of finance lease (as Lessee):
` in LakhsTotal Minimum Lease Payments
outstandingAs at
March 31, 2011As at
March 31, 2010
Within 1 year 39.84 3.00Later than 1 year and not later than 5 years 120.38 4.49Later than 5 years Nil NilTOTAL 160.22 7.49Less: Interest 22.21 1.18Present Value of Minimum Lease Payments 138.01 6.32
11. Earning Per Share
Amount ` in LakhsYear Ended
March 31, 2011 Year Ended
March 31, 2010
Net Profit after Tax, Minority interest- Basic 4,684.75 5,323.91- Diluted 4,684.75 5,323.91Number of Shares used in computing Earning Per Share- Basic 237,893,991 235,946,403- Diluted 237,893,991 235,946,403Earning per share (equity shares of face value ` 1/-)- Basic (in `) 1.97 2.26- Diluted (in `) 1.97 2.26
12. During FY 2008-09, the company had opted for accounting the exchange differences arising on reporting of long term foreign currency monetary items in line with the notification of Ministry of Corporate Affairs (MCA) dated March 31, 2009, on Accounting Standard (AS)-11. In line with the above notification, gains/losses arising during the year from the effect of changes in foreign exchange rates on foreign currency loans relating to acquisition of depreciable capital assets, are adjusted to the cost of the fixed assets. The net deduction from fixed assets on account of the same is ` 385.53 Lakhs (previous year ` 11,685.99 Lakhs).
Consolidated Schedules forming part of Annual Accounts
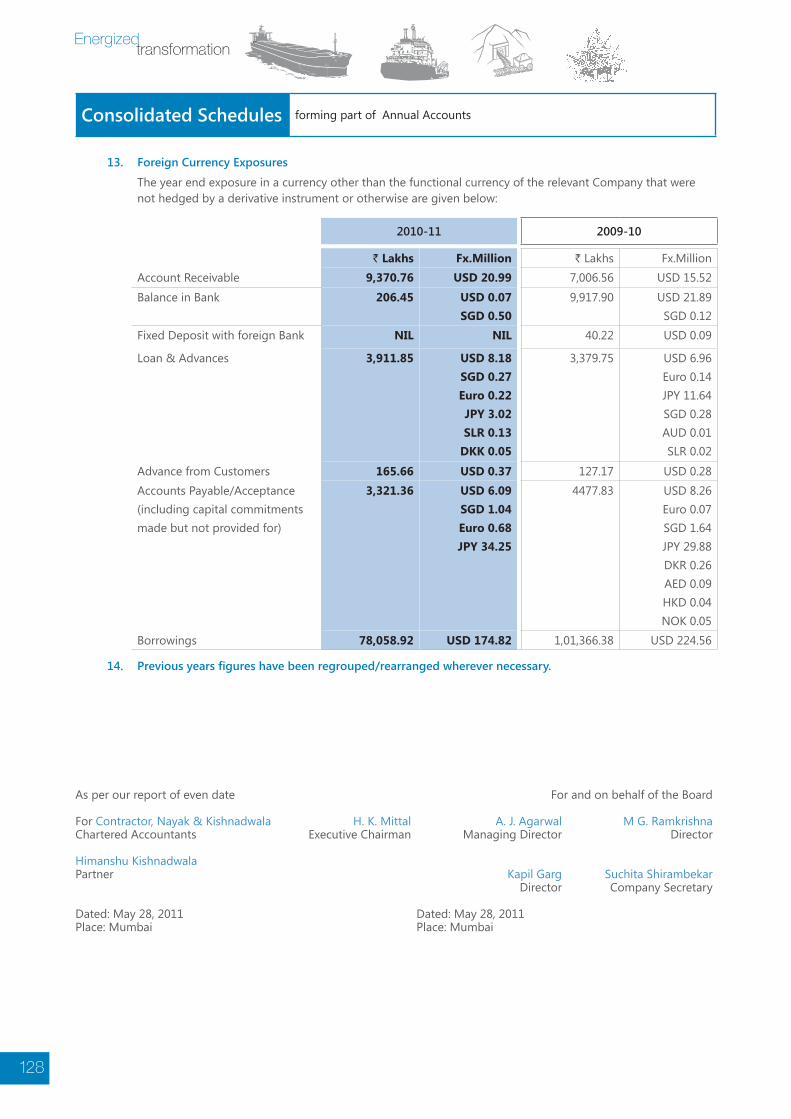
128
13. Foreign Currency Exposures
The year end exposure in a currency other than the functional currency of the relevant Company that were not hedged by a derivative instrument or otherwise are given below:
2010-11 2009-10
` Lakhs Fx.Million ` Lakhs Fx.MillionAccount Receivable 9,370.76 USD 20.99 7,006.56 USD 15.52
Balance in Bank 206.45 USD 0.07 SGD 0.50
9,917.90 USD 21.89 SGD 0.12
Fixed Deposit with foreign Bank NIL NIL 40.22 USD 0.09
Loan & Advances 3,911.85 USD 8.18 SGD 0.27 Euro 0.22 JPY 3.02 SLR 0.13
DKK 0.05
3,379.75 USD 6.96 Euro 0.14 JPY 11.64 SGD 0.28 AUD 0.01 SLR 0.02
Advance from Customers 165.66 USD 0.37 127.17 USD 0.28Accounts Payable/Acceptance (including capital commitments made but not provided for)
3,321.36 USD 6.09 SGD 1.04 Euro 0.68 JPY 34.25
4477.83 USD 8.26 Euro 0.07 SGD 1.64 JPY 29.88 DKR 0.26 AED 0.09 HKD 0.04 NOK 0.05
Borrowings 78,058.92 USD 174.82 1,01,366.38 USD 224.56
14. Previous years figures have been regrouped/rearranged wherever necessary.
As per our report of even date For and on behalf of the Board
For Contractor, Nayak & Kishnadwala H. K. Mittal A. J. Agarwal M G. RamkrishnaChartered Accountants Executive Chairman Managing Director Director
Himanshu Kishnadwala Partner Kapil Garg Suchita Shirambekar
Director Company Secretary
Dated: May 28, 2011 Dated: May 28, 2011Place: Mumbai Place: Mumbai
Consolidated Schedules forming part of Annual Accounts


Registered office
3rd Floor, Mittal Tower, B-wing, Nariman Point, Mumbai-400021, India.
Tel : 91-22-66373333 / 40373333 Fax : 91-22-66373344
Website: www.mercator.in
Email : [email protected]