Embed Size (px)
Citation preview

O R A C L E ® E S S B A S E S P R E A D S H E E T A D D - I N
R E L E A S E 1 1 . 1 . 1
U S E R ’ S G U I D E

Spreadsheet Add-in User’s Guide, 11.1.1
Copyright © 1991, 2008, Oracle and/or its affiliates. All rights reserved.
Authors: EPM Information Development Team
This software and related documentation are provided under a license agreement containing restrictions on use anddisclosure and are protected by intellectual property laws. Except as expressly permitted in your license agreement orallowed by law, you may not use, copy, reproduce, translate, broadcast, modify, license, transmit, distribute, exhibit,perform, publish or display any part, in any form, or by any means. Reverse engineering, disassembly, or decompilationof this software, unless required by law for interoperability, is prohibited.
The information contained herein is subject to change without notice and is not warranted to be error-free. If you findany errors, please report them to us in writing.
If this software or related documentation is delivered to the U.S. Government or anyone licensing it on behalf of the U.S.Government, the following notice is applicable: U.S. GOVERNMENT RIGHTS: Programs, software, databases, and relateddocumentation and technical data delivered to U.S. Government customers are "commercial computer software" or"commercial technical data" pursuant to the applicable Federal Acquisition Regulation and agency-specific supplementalregulations. As such, the use, duplication, disclosure, modification, and adaptation shall be subject to the restrictions andlicense terms set forth in the applicable Government contract, and, to the extent applicable by the terms of the Governmentcontract, the additional rights set forth in FAR 52.227-19, Commercial Computer Software License (December 2007).Oracle USA, Inc., 500 Oracle Parkway, Redwood City, CA 94065.
This software is developed for general use in a variety of information management applications. It is not developed orintended for use in any inherently dangerous applications, including applications which may create a risk of personalinjury. If you use this software in dangerous applications, then you shall be responsible to take all appropriate fail-safe,backup, redundancy and other measures to ensure the safe use of this software. Oracle Corporation and its affiliates disclaimany liability for any damages caused by use of this software in dangerous applications.
This software and documentation may provide access to or information on content, products and services from thirdparties. Oracle Corporation and its affiliates are not responsible for and expressly disclaim all warranties of any kind withrespect to third party content, products and services. Oracle Corporation and its affiliates will not be responsible for anyloss, costs, or damages incurred due to your access to or use of third party content, products or services.
Contents
Chapter 1. Introduction to Essbase . . . . . . . . . . . . . . . . . . . . . . . . . . . . . . . . . . . . . . . . . . . . . . . . . . . . . . 7
About Essbase . . . . . . . . . . . . . . . . . . . . . . . . . . . . . . . . . . . . . . . . . . . . . . . . . . . . . . . . . 7
Typical Users of Essbase . . . . . . . . . . . . . . . . . . . . . . . . . . . . . . . . . . . . . . . . . . . . . . . . . 8
Components of the Client-Server Environment . . . . . . . . . . . . . . . . . . . . . . . . . . . . . . . . 8
Essbase Server . . . . . . . . . . . . . . . . . . . . . . . . . . . . . . . . . . . . . . . . . . . . . . . . . . . . . . 8
Spreadsheet Add-in . . . . . . . . . . . . . . . . . . . . . . . . . . . . . . . . . . . . . . . . . . . . . . . . . . 9
The Network . . . . . . . . . . . . . . . . . . . . . . . . . . . . . . . . . . . . . . . . . . . . . . . . . . . . . . 9
Essbase Application Products . . . . . . . . . . . . . . . . . . . . . . . . . . . . . . . . . . . . . . . . . . . . . . 9
Spreadsheet Toolkit . . . . . . . . . . . . . . . . . . . . . . . . . . . . . . . . . . . . . . . . . . . . . . . . . 9
Essbase Partitioning Option . . . . . . . . . . . . . . . . . . . . . . . . . . . . . . . . . . . . . . . . . . . . 9
Essbase Structured Query Language Interface . . . . . . . . . . . . . . . . . . . . . . . . . . . . . . . 9
Essbase Application Programming Interface . . . . . . . . . . . . . . . . . . . . . . . . . . . . . . . 10
Essbase Currency Conversion . . . . . . . . . . . . . . . . . . . . . . . . . . . . . . . . . . . . . . . . . 10
Integration Services . . . . . . . . . . . . . . . . . . . . . . . . . . . . . . . . . . . . . . . . . . . . . . . . . 10
Developer Products . . . . . . . . . . . . . . . . . . . . . . . . . . . . . . . . . . . . . . . . . . . . . . . . . 10
Data Mining . . . . . . . . . . . . . . . . . . . . . . . . . . . . . . . . . . . . . . . . . . . . . . . . . . . . . . 10
The Multidimensional Database . . . . . . . . . . . . . . . . . . . . . . . . . . . . . . . . . . . . . . . . . . 11
Database Outlines . . . . . . . . . . . . . . . . . . . . . . . . . . . . . . . . . . . . . . . . . . . . . . . . . . . . . 12
Dimensions . . . . . . . . . . . . . . . . . . . . . . . . . . . . . . . . . . . . . . . . . . . . . . . . . . . . . . 14
Members . . . . . . . . . . . . . . . . . . . . . . . . . . . . . . . . . . . . . . . . . . . . . . . . . . . . . . . . 14
Attributes . . . . . . . . . . . . . . . . . . . . . . . . . . . . . . . . . . . . . . . . . . . . . . . . . . . . . . . . 15
Formulas . . . . . . . . . . . . . . . . . . . . . . . . . . . . . . . . . . . . . . . . . . . . . . . . . . . . . . . . 15
Aliases . . . . . . . . . . . . . . . . . . . . . . . . . . . . . . . . . . . . . . . . . . . . . . . . . . . . . . . . . . 15
Consolidations . . . . . . . . . . . . . . . . . . . . . . . . . . . . . . . . . . . . . . . . . . . . . . . . . . . . 15
Chapter 2. Basic Tutorial . . . . . . . . . . . . . . . . . . . . . . . . . . . . . . . . . . . . . . . . . . . . . . . . . . . . . . . . . . . . 17
About the Basic Tutorial . . . . . . . . . . . . . . . . . . . . . . . . . . . . . . . . . . . . . . . . . . . . . . . . 17
Getting Acquainted with Spreadsheet Add-in . . . . . . . . . . . . . . . . . . . . . . . . . . . . . . . . . 17
Registering Spreadsheet Add-in . . . . . . . . . . . . . . . . . . . . . . . . . . . . . . . . . . . . . . . . 18
Loading Spreadsheet Add-in . . . . . . . . . . . . . . . . . . . . . . . . . . . . . . . . . . . . . . . . . . 18
Starting Spreadsheet Add-in . . . . . . . . . . . . . . . . . . . . . . . . . . . . . . . . . . . . . . . . . . 19
Installing the Essbase Toolbar for Excel . . . . . . . . . . . . . . . . . . . . . . . . . . . . . . . . . . 19
Contents iii
Using the Essbase Toolbar . . . . . . . . . . . . . . . . . . . . . . . . . . . . . . . . . . . . . . . . . . . . 20
Accessing Online Help . . . . . . . . . . . . . . . . . . . . . . . . . . . . . . . . . . . . . . . . . . . . . . 21
Enabling Mouse Actions . . . . . . . . . . . . . . . . . . . . . . . . . . . . . . . . . . . . . . . . . . . . . 22
Tutorial Prerequisites . . . . . . . . . . . . . . . . . . . . . . . . . . . . . . . . . . . . . . . . . . . . . . . . . . 24
Enabling Compatibility with Smart View . . . . . . . . . . . . . . . . . . . . . . . . . . . . . . . . . 24
Setting Essbase Options . . . . . . . . . . . . . . . . . . . . . . . . . . . . . . . . . . . . . . . . . . . . . . 24
Following Guidelines During the Tutorial . . . . . . . . . . . . . . . . . . . . . . . . . . . . . . . . . 28
Reviewing the Sample Basic Database . . . . . . . . . . . . . . . . . . . . . . . . . . . . . . . . . . . . 29
Retrieving Data . . . . . . . . . . . . . . . . . . . . . . . . . . . . . . . . . . . . . . . . . . . . . . . . . . . . . . . 29
Connecting to a Database . . . . . . . . . . . . . . . . . . . . . . . . . . . . . . . . . . . . . . . . . . . . 30
Changing a Password (Optional) . . . . . . . . . . . . . . . . . . . . . . . . . . . . . . . . . . . . . . . 32
Retrieving Data from a Database . . . . . . . . . . . . . . . . . . . . . . . . . . . . . . . . . . . . . . . 32
Canceling a Data Retrieval Request . . . . . . . . . . . . . . . . . . . . . . . . . . . . . . . . . . . . . 34
Restoring the Previous Database View . . . . . . . . . . . . . . . . . . . . . . . . . . . . . . . . . . . 34
Drilling Down to More Detail . . . . . . . . . . . . . . . . . . . . . . . . . . . . . . . . . . . . . . . . . 35
Drilling Up to Less Detail . . . . . . . . . . . . . . . . . . . . . . . . . . . . . . . . . . . . . . . . . . . . 38
Customizing Drill-Down and Drill-Up Behavior . . . . . . . . . . . . . . . . . . . . . . . . . . . . 39
Pivoting, Retaining, and Suppressing Data . . . . . . . . . . . . . . . . . . . . . . . . . . . . . . . . . . . 42
Pivoting Rows and Columns . . . . . . . . . . . . . . . . . . . . . . . . . . . . . . . . . . . . . . . . . . 42
Retaining a Data Subset . . . . . . . . . . . . . . . . . . . . . . . . . . . . . . . . . . . . . . . . . . . . . . 46
Removing a Data Subset . . . . . . . . . . . . . . . . . . . . . . . . . . . . . . . . . . . . . . . . . . . . . 48
Navigating Through the Worksheet Without Retrieving Data . . . . . . . . . . . . . . . . . . 49
Suppressing Missing Values, Zero Values, and Underscore Characters . . . . . . . . . . . . 53
Formatting the Worksheet . . . . . . . . . . . . . . . . . . . . . . . . . . . . . . . . . . . . . . . . . . . . . . . 55
Formatting Text and Cells . . . . . . . . . . . . . . . . . . . . . . . . . . . . . . . . . . . . . . . . . . . . 56
Displaying Aliases for Member Names . . . . . . . . . . . . . . . . . . . . . . . . . . . . . . . . . . . 63
Displaying Both Member Names and Aliases . . . . . . . . . . . . . . . . . . . . . . . . . . . . . . 64
Repeating Member Labels . . . . . . . . . . . . . . . . . . . . . . . . . . . . . . . . . . . . . . . . . . . . 65
Working with Duplicate Member Names . . . . . . . . . . . . . . . . . . . . . . . . . . . . . . . . . 67
Creating Queries Using Query Designer . . . . . . . . . . . . . . . . . . . . . . . . . . . . . . . . . . . . . 69
About Creating and Changing Queries . . . . . . . . . . . . . . . . . . . . . . . . . . . . . . . . . . . 70
Creating Queries . . . . . . . . . . . . . . . . . . . . . . . . . . . . . . . . . . . . . . . . . . . . . . . . . . . 71
Saving Queries . . . . . . . . . . . . . . . . . . . . . . . . . . . . . . . . . . . . . . . . . . . . . . . . . . . . 76
Applying Queries . . . . . . . . . . . . . . . . . . . . . . . . . . . . . . . . . . . . . . . . . . . . . . . . . . 78
Deleting Queries . . . . . . . . . . . . . . . . . . . . . . . . . . . . . . . . . . . . . . . . . . . . . . . . . . . 79
Viewing Messages and Confirmations . . . . . . . . . . . . . . . . . . . . . . . . . . . . . . . . . . . 79
Accessing Help . . . . . . . . . . . . . . . . . . . . . . . . . . . . . . . . . . . . . . . . . . . . . . . . . . . . 80
Connecting to Multiple Databases from Query Designer . . . . . . . . . . . . . . . . . . . . . . 80
Applying Worksheet Options to Query Designer Results . . . . . . . . . . . . . . . . . . . . . . 81
iv Contents
Selecting Members . . . . . . . . . . . . . . . . . . . . . . . . . . . . . . . . . . . . . . . . . . . . . . . . . . . . 82
Saving and Disconnecting . . . . . . . . . . . . . . . . . . . . . . . . . . . . . . . . . . . . . . . . . . . . . . . 89
Saving a Worksheet . . . . . . . . . . . . . . . . . . . . . . . . . . . . . . . . . . . . . . . . . . . . . . . . . 90
Disconnecting from Essbase . . . . . . . . . . . . . . . . . . . . . . . . . . . . . . . . . . . . . . . . . . 90
Logging Off . . . . . . . . . . . . . . . . . . . . . . . . . . . . . . . . . . . . . . . . . . . . . . . . . . . . . . 91
On to Advanced Tasks . . . . . . . . . . . . . . . . . . . . . . . . . . . . . . . . . . . . . . . . . . . . . . . . . . 91
Chapter 3. Advanced Tutorial . . . . . . . . . . . . . . . . . . . . . . . . . . . . . . . . . . . . . . . . . . . . . . . . . . . . . . . . . . 93
About the Advanced Tutorial . . . . . . . . . . . . . . . . . . . . . . . . . . . . . . . . . . . . . . . . . . . . . 93
Connecting to a Database . . . . . . . . . . . . . . . . . . . . . . . . . . . . . . . . . . . . . . . . . . . . 93
Setting Essbase Options . . . . . . . . . . . . . . . . . . . . . . . . . . . . . . . . . . . . . . . . . . . . . . 95
Performing Advanced Retrieval Tasks . . . . . . . . . . . . . . . . . . . . . . . . . . . . . . . . . . . . . . 99
Filtering Data . . . . . . . . . . . . . . . . . . . . . . . . . . . . . . . . . . . . . . . . . . . . . . . . . . . . 100
Sorting Data . . . . . . . . . . . . . . . . . . . . . . . . . . . . . . . . . . . . . . . . . . . . . . . . . . . . . 104
Retrieving Data into Asymmetric Reports . . . . . . . . . . . . . . . . . . . . . . . . . . . . . . . . 107
Drilling Down to a Sample of Members (Optional) . . . . . . . . . . . . . . . . . . . . . . . . . 109
Working with Formatted Worksheets . . . . . . . . . . . . . . . . . . . . . . . . . . . . . . . . . . . 111
Preserving Formulas When Retrieving Data . . . . . . . . . . . . . . . . . . . . . . . . . . . . . . 116
Retrieving a Range of Data . . . . . . . . . . . . . . . . . . . . . . . . . . . . . . . . . . . . . . . . . . 119
Retrieving Data by Using a Function . . . . . . . . . . . . . . . . . . . . . . . . . . . . . . . . . . . 122
Retrieving Dynamic Calculation Members . . . . . . . . . . . . . . . . . . . . . . . . . . . . . . . 125
Specifying the Latest Time Period for Dynamic Time Series . . . . . . . . . . . . . . . . . . . 128
Using Free-Form Reporting to Retrieve Data . . . . . . . . . . . . . . . . . . . . . . . . . . . . . 131
Retrieving Data Using Visual Explorer . . . . . . . . . . . . . . . . . . . . . . . . . . . . . . . . . . 140
Using Linked Reporting Objects . . . . . . . . . . . . . . . . . . . . . . . . . . . . . . . . . . . . . . . . . 144
Linking a File to a Data Cell . . . . . . . . . . . . . . . . . . . . . . . . . . . . . . . . . . . . . . . . . . 145
Linking a Cell Note to a Data Cell . . . . . . . . . . . . . . . . . . . . . . . . . . . . . . . . . . . . . 148
Linking a URL to a Data Cell . . . . . . . . . . . . . . . . . . . . . . . . . . . . . . . . . . . . . . . . . 149
Accessing and Editing Linked Reporting Objects . . . . . . . . . . . . . . . . . . . . . . . . . . . 151
Connecting to Multiple Databases (Optional) . . . . . . . . . . . . . . . . . . . . . . . . . . . . . . . . 156
Ways to View Active Database Connections . . . . . . . . . . . . . . . . . . . . . . . . . . . . . . . . . 157
Access Methods for Linked Partitions . . . . . . . . . . . . . . . . . . . . . . . . . . . . . . . . . . . . . . 158
Updating Data on Essbase Server . . . . . . . . . . . . . . . . . . . . . . . . . . . . . . . . . . . . . . . . . 159
Database Calculation . . . . . . . . . . . . . . . . . . . . . . . . . . . . . . . . . . . . . . . . . . . . . . . . . . 162
Creating Multiple Worksheets from Data . . . . . . . . . . . . . . . . . . . . . . . . . . . . . . . . . . . 163
Working with Currency Conversions . . . . . . . . . . . . . . . . . . . . . . . . . . . . . . . . . . . . . . 167
Retrieving Currency Conversion Data . . . . . . . . . . . . . . . . . . . . . . . . . . . . . . . . . . 167
Connecting to the Sample Currency Databases . . . . . . . . . . . . . . . . . . . . . . . . . . . . 168
Performing Ad Hoc Currency Reporting . . . . . . . . . . . . . . . . . . . . . . . . . . . . . . . . 170
Contents v
Chapter 4. Drill-Through Tutorial . . . . . . . . . . . . . . . . . . . . . . . . . . . . . . . . . . . . . . . . . . . . . . . . . . . . . . 173
About the Drill-Through Tutorial . . . . . . . . . . . . . . . . . . . . . . . . . . . . . . . . . . . . . . . . 173
Understanding Drill-Through . . . . . . . . . . . . . . . . . . . . . . . . . . . . . . . . . . . . . . . . . . . 173
About the Drill-Through Wizard . . . . . . . . . . . . . . . . . . . . . . . . . . . . . . . . . . . . . . . . . 175
Before You Start . . . . . . . . . . . . . . . . . . . . . . . . . . . . . . . . . . . . . . . . . . . . . . . . . . . . . 176
Setting Essbase Options . . . . . . . . . . . . . . . . . . . . . . . . . . . . . . . . . . . . . . . . . . . . . 177
About the Samples Used in This Tutorial . . . . . . . . . . . . . . . . . . . . . . . . . . . . . . . . 182
Accessing Drill-Through Reports from the Spreadsheet . . . . . . . . . . . . . . . . . . . . . . . . . 183
Selecting Drill-Through Reports to View or Customize . . . . . . . . . . . . . . . . . . . . . . . . . 189
Selecting and Ordering Columns . . . . . . . . . . . . . . . . . . . . . . . . . . . . . . . . . . . . . . . . . 194
Ordering Data . . . . . . . . . . . . . . . . . . . . . . . . . . . . . . . . . . . . . . . . . . . . . . . . . . . . . . 196
Filtering Data . . . . . . . . . . . . . . . . . . . . . . . . . . . . . . . . . . . . . . . . . . . . . . . . . . . . . . . 198
Disconnecting from Essbase . . . . . . . . . . . . . . . . . . . . . . . . . . . . . . . . . . . . . . . . . . . . 204
Glossary . . . . . . . . . . . . . . . . . . . . . . . . . . . . . . . . . . . . . . . . . . . . . . . . . . . . . . . . . . . 205
Index . . . . . . . . . . . . . . . . . . . . . . . . . . . . . . . . . . . . . . . . . . . . . . . . . . . . . . . . . . . . . 229
vi Contents
1Introduction to Essbase
In This Chapter
About Essbase ... . . . . . . . . . . . . . . . . . . . . . . . . . . . . . . . . . . . . . . . . . . . . . . . . . . . . . . . . . . . . . . . . . . . . . . . . . . . . . . . . . . . . . . . . . . . . . . . . . . . . . . . . . . . . . . . . . . . 7
Typical Users of Essbase ... . . . . . . . . . . . . . . . . . . . . . . . . . . . . . . . . . . . . . . . . . . . . . . . . . . . . . . . . . . . . . . . . . . . . . . . . . . . . . . . . . . . . . . . . . . . . . . . . . . . . . . . . 8
Components of the Client-Server Environment.. . . . . . . . . . . . . . . . . . . . . . . . . . . . . . . . . . . . . . . . . . . . . . . . . . . . . . . . . . . . . . . . . . . . . . . . . . . . . . . . . . 8
Essbase Application Products .. . . . . . . . . . . . . . . . . . . . . . . . . . . . . . . . . . . . . . . . . . . . . . . . . . . . . . . . . . . . . . . . . . . . . . . . . . . . . . . . . . . . . . . . . . . . . . . . . . . . 9
The Multidimensional Database ... . . . . . . . . . . . . . . . . . . . . . . . . . . . . . . . . . . . . . . . . . . . . . . . . . . . . . . . . . . . . . . . . . . . . . . . . . . . . . . . . . . . . . . . . . . . . . . .11
Database Outlines ... . . . . . . . . . . . . . . . . . . . . . . . . . . . . . . . . . . . . . . . . . . . . . . . . . . . . . . . . . . . . . . . . . . . . . . . . . . . . . . . . . . . . . . . . . . . . . . . . . . . . . . . . . . . . . .12
About EssbaseOracle Essbase is multidimensional database software that is optimized for planning, analysis,and management-reporting applications. Essbase uniquely blends an innovative technical designwith an open, client-server architecture. The product enables you to extend decision supportsystems beyond ad hoc queries and reports on historical performance to dynamic, operationalsystems that combine historical analysis and future planning.
By consolidating and staging historical and projected data for detailed analysis, you gainperspectives about your business that enable you to take appropriate actions.
Essbase provides both power and flexibility. Thus, it can be used for a broad range of onlineanalytical processing (OLAP) applications, including those in this list:
● Budgeting
● Forecasting and seasonal planning
● Financial consolidations and reporting
● Customer and product profitability analysis
● Price, volume, and mix analysis
● Executive information systems
Essbase enables you and others in the organization to share, access, update, and analyzeenterprise data from any perspective and at any level of detail without learning new tools, querylanguages, or programming skills.
About Essbase 7
Typical Users of EssbaseEssbase can be used in many different applications. Financial analysts have found the productto be invaluable in budget analysis, currency conversion, and consolidation. Cost accountantsapply its powerful capabilities to evaluate allocation and elimination scenarios. Productmanagers and analysts use it to plan and analyze multiple product lines and distributionchannels. You can also use the product as a repository database for spreadsheet data. Anyonewho uses a spreadsheet is a potential user of Essbase.
Because Essbase is applicable to such a broad variety of environments, individuals using it at anorganization may fill one or more roles in implementing and running applications. This guiderefers to specific roles by three titles. A role may be performed, however, by one person or byseveral people working collaboratively.
● System administrator— Typically has experience in networking, installing softwarepackages, and administering system functions. In addition to installing the Essbase software,the Essbase system administrator may also set up Essbase user accounts, set up the securitysystem, and maintain the Essbase Server.
● Application designer—Sets up the Essbase database, creates the database outline, anddevelops calculation and report scripts. The responsibilities of the Essbase systemadministrator and the application designer may overlap in some areas. The applicationdesigner has probably developed spreadsheet or database applications and understands theoperational problems and the tools being employed to solve them.
● User—Interacts with Essbase databases through spreadsheets, using Microsoft Office Excel(Excel). Users are typically analysts and managers who use spreadsheet programs as theirprimary tool for viewing and analyzing data.
Components of the Client-Server EnvironmentClient-server computing refers to the architecture in which individual computers are connectedto a powerful server by means of a local area network (LAN). The computer acts as a client byrequesting data from the server. The server processes the request and returns the desired resultto the client.
Essbase is built as a client-server system. System performance and multiuser capabilities aregreatly enhanced in the Essbase client-server environment.
Essbase ServerEssbase Server is a multidimensional database that supports analysis of an unlimited number ofdata dimensions and an unlimited number of members within these dimensions, developedusing a true client-server architecture, All data, the database outline, the calculations, and thedata security controls reside on the Essbase Server.
8 Introduction to Essbase
Spreadsheet Add-inOracle Essbase Spreadsheet Add-in is a software program that merges seamlessly with Excel.After Essbase is installed, a special menu is added to the spreadsheet application. The menuprovides enhanced commands such as Connect, Pivot, Drill-down, and Calculate. Users canaccess and analyze data on Essbase Server by using simple mouse clicks and drag-and-dropoperations. Spreadsheet Add-in enables multiple users to access and to update data on EssbaseServer simultaneously.
The NetworkEssbase runs on computer-based local area networks (LANs) that support the TCP/IP protocol.
Note:
Supported network environments and technical requirements are discussed in detail in theOracle Hyperion Enterprise Performance Management System Installation Start Here.
Essbase Application ProductsSeveral optional products, designed to extend and enhance the scope of OLAP applications, canbe implemented using Essbase.
Spreadsheet ToolkitOracle's Hyperion® Essbase® Spreadsheet Toolkit includes over 20 macro and Visual Basic forApplications (VBA) functions that enable you to build customized Excel applications. Theapplications incorporate Essbase commands, such as EssCascade, EssConnect, andEssDisconnect, that provide all the functionality of their corresponding Essbase menucommands. See Oracle Essbase Spreadsheet Add-in Online Help.
Essbase Partitioning OptionEssbase Partitioning option enables you to define areas of data that are shared or linked betweendata models. Partitioning can affect the performance and scalability of Essbase applications.Partitioning provides more effective response to organizational demands, reduced calculationtime, increased reliability and availability, and incorporation of detail and dimensionality. Formore information on partitions, see “Access Methods for Linked Partitions” on page 158.
Essbase Structured Query Language InterfaceSQL Interface enables access to structured query language (SQL) relational databases by makingEssbase Server operate as an open database connectivity client. Using SQL Interface, data can
Essbase Application Products 9
be moved easily from these diverse corporate data sources into Essbase Server for user accessand analysis. For more information, see the Oracle Essbase SQL Interface Guide.
Essbase Application Programming InterfaceEssbase Application Programming Interface (API) enables application developers to createcustom applications quickly by using standard tools while taking advantage of the robust datastorage, retrieval, and manipulation capabilities of Essbase. API supports Visual Basic and C.For more information on application programming, see the Oracle Essbase API Reference.
Essbase Currency ConversionEssbase Currency Conversion translates, analyzes, and reports on foreign financial data. Anyexchange rate scenario can be modeled, and you can even perform ad hoc currency conversionsof data, directly from the spreadsheet. The Currency Conversion product is compliant withFinancial Accounting Standards Board 52 (FASB52). For more information on conversions, see“Working with Currency Conversions” on page 167.
Integration ServicesOracle Essbase Integration Services works with Essbase and Excel. This product is a suite of toolsand data integration services that serve as a bridge between relational, flat file, and SAP BW datasources and Essbase Server. Integration Server drill-through is one of the tools of IntegrationServices. Using Integration Server drill-through, you can view and customize spreadsheet reportsthat display data retrieved from relational databases. For more information on the drill-throughtool, see Chapter 4, “Drill-Through Tutorial.”
Developer ProductsEssbase developer products enable the rapid creation, management and deployment of tailoredenterprise analytic applications—with or without programming knowledge.
The products (for example, Application Builder, and Oracle's Hyperion® Application Builderfor .NET) provide a comprehensive set of application programming interfaces, drag and dropcomponents and services.
Data MiningData Mining reveals hidden relationships and patterns in your data, enabling you to make betterbusiness decisions. Using Data Mining you can plug in various data mining algorithms, buildmodels, and then apply them to existing Essbase applications and databases.
10 Introduction to Essbase
The Multidimensional DatabaseThe Essbase multidimensional database stores and organizes data. It is optimized to handleapplications that contain large amounts of numeric data and that are consolidation-intensiveor computation-intensive. In addition, the database organizes data in a way that reflects howthe user wants to view the data.
Definition of Multidimensional
A dimension is a perspective or view of a specific dataset. A different view of the same data isan alternate dimension. A system that supports simultaneous, alternate views of datasets ismultidimensional. Dimensions are typically categories such as time, accounts, product lines,markets, budgets, and so on. Each dimension contains additional categories that have variousrelationships one to another.
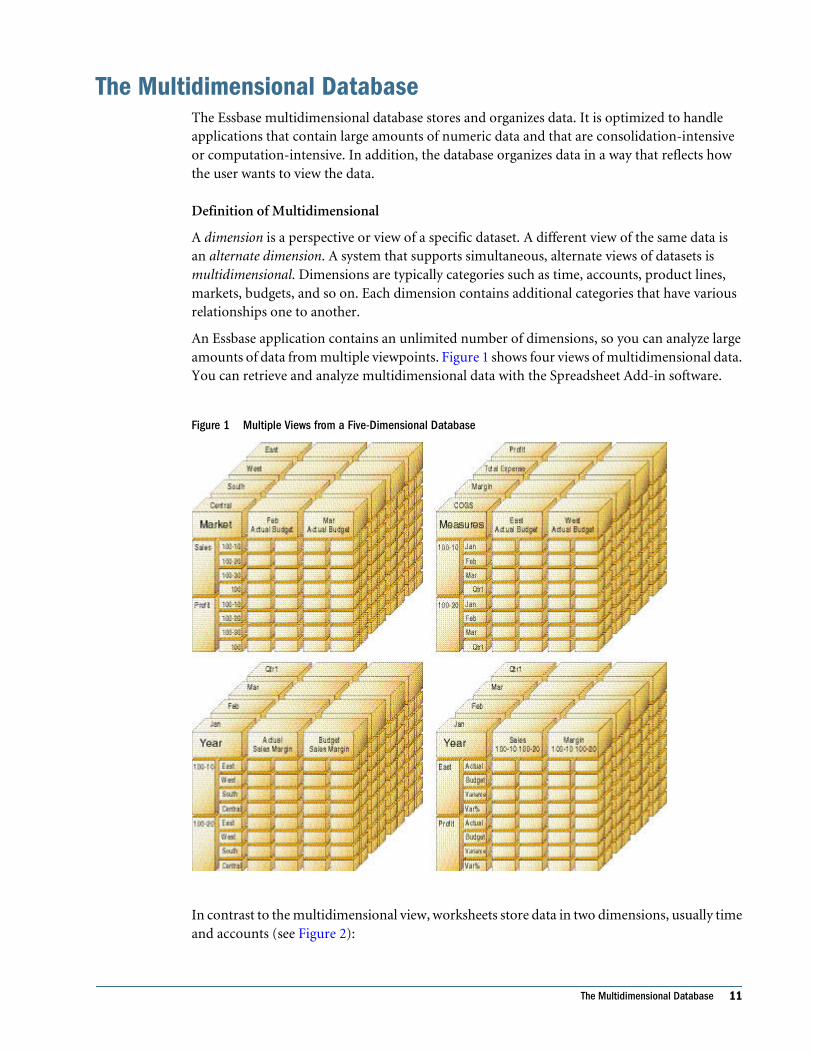
An Essbase application contains an unlimited number of dimensions, so you can analyze largeamounts of data from multiple viewpoints. Figure 1 shows four views of multidimensional data.You can retrieve and analyze multidimensional data with the Spreadsheet Add-in software.
Figure 1 Multiple Views from a Five-Dimensional Database
In contrast to the multidimensional view, worksheets store data in two dimensions, usually timeand accounts (see Figure 2):
The Multidimensional Database 11
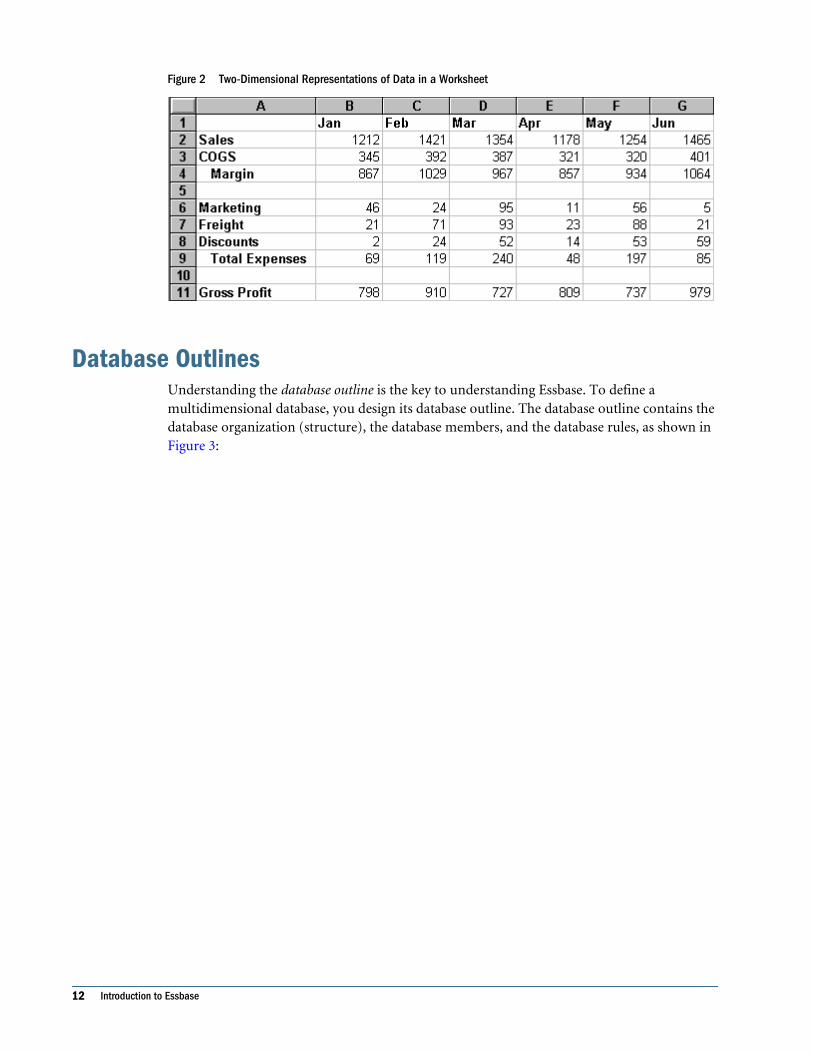
Figure 2 Two-Dimensional Representations of Data in a Worksheet
Database OutlinesUnderstanding the database outline is the key to understanding Essbase. To define amultidimensional database, you design its database outline. The database outline contains thedatabase organization (structure), the database members, and the database rules, as shown inFigure 3:
12 Introduction to Essbase
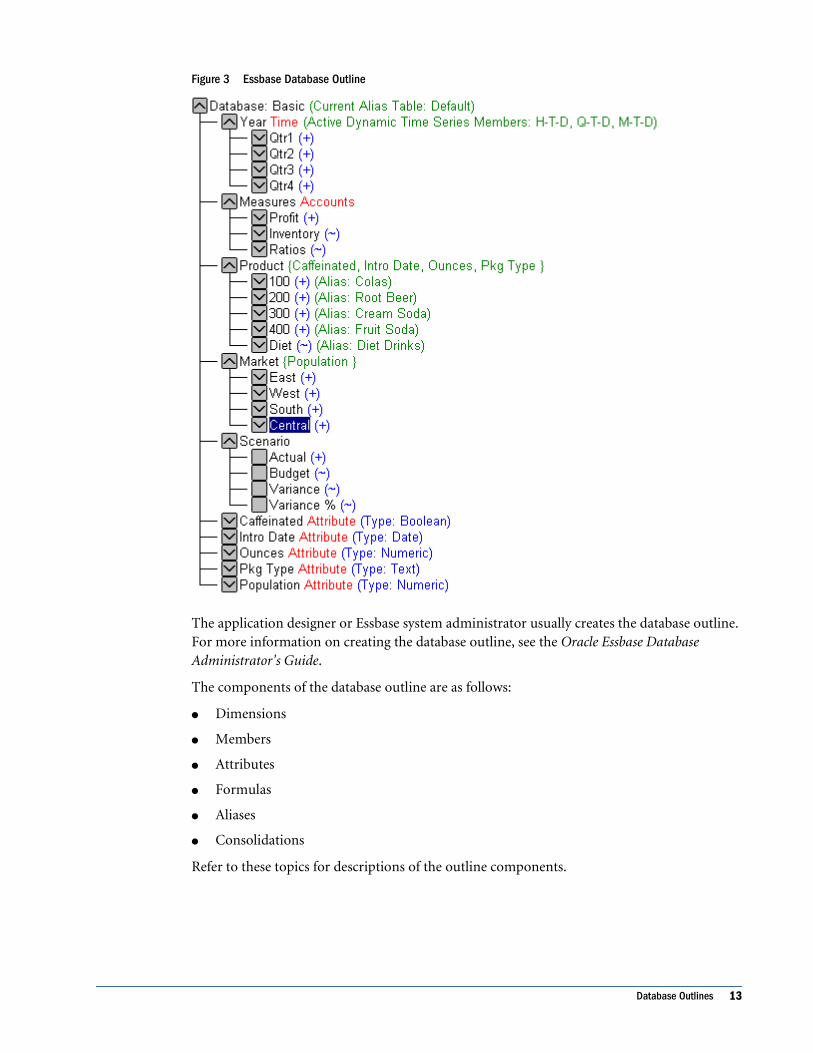
Figure 3 Essbase Database Outline
The application designer or Essbase system administrator usually creates the database outline.For more information on creating the database outline, see the Oracle Essbase DatabaseAdministrator's Guide.
The components of the database outline are as follows:
● Dimensions
● Members
● Attributes
● Formulas
● Aliases
● Consolidations
Refer to these topics for descriptions of the outline components.
Database Outlines 13
DimensionsDimensions are the most basic categorical definitions of data within the database outline. Youneed at least two dimensions to make any meaningful reference to data; for example, a timedimension and an accounts dimension. Other dimensions may categorize products, markets,and scenarios. Using dimensional organization, you can define any consolidation structure orany slice of data that is relevant to the application. Essbase supports an unlimited number ofdimensions.
MembersMembers are the names of the elements within a dimension. A dimension can contain anunlimited number of members. The calculation, reporting, and dimension-building features inEssbase use these terms to describe members.
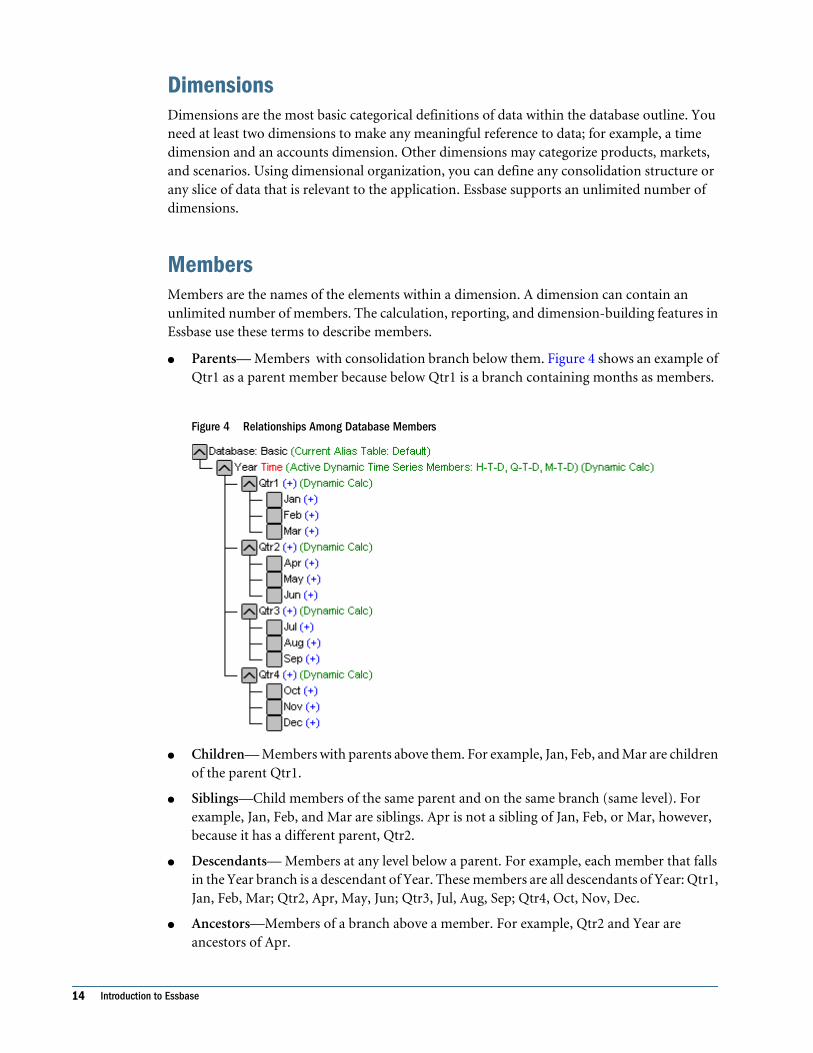
● Parents— Members with consolidation branch below them. Figure 4 shows an example ofQtr1 as a parent member because below Qtr1 is a branch containing months as members.
Figure 4 Relationships Among Database Members
● Children— Members with parents above them. For example, Jan, Feb, and Mar are childrenof the parent Qtr1.
● Siblings—Child members of the same parent and on the same branch (same level). Forexample, Jan, Feb, and Mar are siblings. Apr is not a sibling of Jan, Feb, or Mar, however,because it has a different parent, Qtr2.
● Descendants— Members at any level below a parent. For example, each member that fallsin the Year branch is a descendant of Year. These members are all descendants of Year: Qtr1,Jan, Feb, Mar; Qtr2, Apr, May, Jun; Qtr3, Jul, Aug, Sep; Qtr4, Oct, Nov, Dec.
● Ancestors—Members of a branch above a member. For example, Qtr2 and Year areancestors of Apr.
14 Introduction to Essbase
● Generations. Branch numbers of members. Generations count from the root of the tree(generation 1, which is the dimension name) toward the leaf node.
● Levels.Branch numbers of members. Levels count from the leaf node (level 0) toward theroot (the dimension name).
AttributesAttributes describe characteristics of data, such as the size and color of products. Throughattributes, you can group and analyze members of dimensions based on their characteristics.Attribute dimensions must be associated with base dimensions. For more information, see theOracle Essbase Database Administrator's Guide.
FormulasEach database member can be associated with one or more formulas in the database outline. Forexample, the Variance members of the Scenario dimension (see Figure 3 on page 13), containformulas. Formulas can be simple or complex. For more information on formulas, see the OracleEssbase Database Administrator's Guide.
AliasesEssbase supports alternative names, or aliases, for database members. Aliases are useful whenvarious labels are used for the same member in various worksheets. One worksheet, for example,may refer to Cost_of_Goods_Sold as COGS. Aliases also can be used for reporting in alternativelanguages or for more formal output name sets, such as account numbers.
ConsolidationsConsolidations in Essbase applications are defined by member branches. The database outlinedetermines consolidation paths. The determination is based on the location of members withina dimension. Indentation of one member below another indicates a consolidation relationship.Indenting members is important for the drill-down capabilities in Spreadsheet Add-in. As younavigate through data, you can drill down through levels of consolidations. The databaseoutline is the roadmap that determines the levels of data navigation.
Database Outlines 15

16 Introduction to Essbase
2Basic Tutorial
In This Chapter
About the Basic Tutorial . . . . . . . . . . . . . . . . . . . . . . . . . . . . . . . . . . . . . . . . . . . . . . . . . . . . . . . . . . . . . . . . . . . . . . . . . . . . . . . . . . . . . . . . . . . . . . . . . . . . . . . . . . .17
Getting Acquainted with Spreadsheet Add-in .. . . . . . . . . . . . . . . . . . . . . . . . . . . . . . . . . . . . . . . . . . . . . . . . . . . . . . . . . . . . . . . . . . . . . . . . . . . . . . . . . .17
Tutorial Prerequisites .. . . . . . . . . . . . . . . . . . . . . . . . . . . . . . . . . . . . . . . . . . . . . . . . . . . . . . . . . . . . . . . . . . . . . . . . . . . . . . . . . . . . . . . . . . . . . . . . . . . . . . . . . . . . .24
Retrieving Data ... . . . . . . . . . . . . . . . . . . . . . . . . . . . . . . . . . . . . . . . . . . . . . . . . . . . . . . . . . . . . . . . . . . . . . . . . . . . . . . . . . . . . . . . . . . . . . . . . . . . . . . . . . . . . . . . . . .29
Pivoting, Retaining, and Suppressing Data... . . . . . . . . . . . . . . . . . . . . . . . . . . . . . . . . . . . . . . . . . . . . . . . . . . . . . . . . . . . . . . . . . . . . . . . . . . . . . . . . . . .42
Formatting the Worksheet .. . . . . . . . . . . . . . . . . . . . . . . . . . . . . . . . . . . . . . . . . . . . . . . . . . . . . . . . . . . . . . . . . . . . . . . . . . . . . . . . . . . . . . . . . . . . . . . . . . . . . . . .55
Creating Queries Using Query Designer .. . . . . . . . . . . . . . . . . . . . . . . . . . . . . . . . . . . . . . . . . . . . . . . . . . . . . . . . . . . . . . . . . . . . . . . . . . . . . . . . . . . . . . . . .69
Selecting Members ... . . . . . . . . . . . . . . . . . . . . . . . . . . . . . . . . . . . . . . . . . . . . . . . . . . . . . . . . . . . . . . . . . . . . . . . . . . . . . . . . . . . . . . . . . . . . . . . . . . . . . . . . . . . . .82
Saving and Disconnecting ... . . . . . . . . . . . . . . . . . . . . . . . . . . . . . . . . . . . . . . . . . . . . . . . . . . . . . . . . . . . . . . . . . . . . . . . . . . . . . . . . . . . . . . . . . . . . . . . . . . . . .89
On to Advanced Tasks ... . . . . . . . . . . . . . . . . . . . . . . . . . . . . . . . . . . . . . . . . . . . . . . . . . . . . . . . . . . . . . . . . . . . . . . . . . . . . . . . . . . . . . . . . . . . . . . . . . . . . . . . . . .91
About the Basic TutorialWhen you add Spreadsheet Add-in to Excel, most spreadsheet operations remain unchanged;Spreadsheet Add-in adds an Essbase menu and toolbar, and mouse shortcuts with which youcan access Essbase applications and databases.
Basic tasks are described in this tutorial chapter. These are tasks that you probably use oftenwhen working with Essbase. Chapter 3 describes more advanced tasks.
Tasks must be completed in succession as each tutorial task builds upon the previous task.
The examples in this tutorial are based on the Sample Basic database that is included with theEssbase installation. Contact the Essbase system administrator for information about accessingthe Sample Basic database or about accessing other databases on Essbase Server.
Getting Acquainted with Spreadsheet Add-inThis following topics will help you to get acquainted with Spreadsheet Add-in:
● “Registering Spreadsheet Add-in” on page 18
● “Loading Spreadsheet Add-in” on page 18
● “Starting Spreadsheet Add-in” on page 19
● “Installing the Essbase Toolbar for Excel” on page 19
About the Basic Tutorial 17
● “Using the Essbase Toolbar” on page 20
● “Accessing Online Help” on page 21
● “Enabling Mouse Actions” on page 22
Registering Spreadsheet Add-inDuring installation, Spreadsheet Add-in is automatically registered with Excel and included inyour computer's registry entries.
You may unregister Spreadsheet Add-in from Excel. Unregistering clears the registry entries andremoves the Essbase menu from Excel; however, it leaves the Spreadsheet Add-in componentson your computer.
To put the Spreadsheet Add-in back into Excel, you can run the register program manually.
➤ To manually register Spreadsheet Add-in, select Start, then Programs, then Oracle EPMSystem, then Essbase, then Essbase Client, then Register Spreadsheet Add-in.
➤ To unregister Spreadsheet Add-in, select Start, then Programs, then Oracle EPM System, thenEssbase, then Essbase Client, then Unregister Spreadsheet Add-in.
Loading Spreadsheet Add-inIf you manually update your environment settings or if you removed Spreadsheet Add-in fromthe Excel environment, you must use the Excel add-in tool to load Spreadsheet Add-in in Excel.Loading Spreadsheet Add-in adds the Essbase menu to the Excel menu bar and points Excel tothe Spreadsheet Add-in file (essexcln.xll) in HYPERION_HOME/products/Essbase/EssbaseClient/bin.
➤ To load Spreadsheet Add-in in Excel:
1 In Excel, select Tools, then Add-Ins.
2 In Add-ins, click Browse.
The Browse dialog box is displayed.
3 Locate essexcln.xll and select it.
The file is in the HYPERION_HOME/products/Essbase/EssbaseClient/bin directorywhere you installed Spreadsheet Add-in.
4 Click OK twice to close the dialog boxes.
Loading Spreadsheet Add-in in Excel modifies the Windows Registry to point to where theSpreadsheet Add-in file is installed.
5 Start Spreadsheet Add-in.
If Excel does not contain an Essbase menu, see the Oracle Hyperion Enterprise PerformanceManagement System Installation and Configuration Troubleshooting Guide.
18 Basic Tutorial
Starting Spreadsheet Add-in
➤ To use Spreadsheet Add-inand begin an Essbase session:
1 Start Excel.
The Essbase menu should be displayed in the Excel menu bar. If it is not, you may need to usethe add-in tool to load Spreadsheet Add-in (see “Loading Spreadsheet Add-in” on page 18).
In Excel, the Essbase toolbar should be viewable. If you do not see the Essbase toolbar, see“Installing the Essbase Toolbar for Excel” on page 19 and “Using the Essbase Toolbar” on page20.
2 From the Excel menu bar, select Essbase to display the Essbase menu.
Installing the Essbase Toolbar for ExcelIn Excel, Spreadsheet Add-in provides a convenient toolbar that displays icons for accessingmost of the common Essbase commands without having to open the Essbase menu.
Prior to using the Essbase toolbar, you must install the toolbar by opening an Excel file that isprovided as part of the default Essbase installation. See “Using the Essbase Toolbar” on page20.
➤ To install the Essbase toolbar:
1 Start Excel.
2 Select File, then Open.
3 From HYPERION_HOME/products/Essbase/EssbaseClient/client/sample, openesstoolb.xls.
A blank worksheet opens.
Depending on how software is installed on your computer, the file may not be available or maybe located in a different directory. If you cannot locate the file, contact the Essbase systemadministrator.
Note:
Upon using Excel, two dialog boxes may be displayed warning that the esstoolb.xls file maycontain macros. If so, click the Enable Macros button on the first dialog box, and click OK onthe second dialog box. The macros must be enabled for the Essbase toolbar to work.
4 Select File, then Close, to close the esstoolb.xls file.
You do not need to modify or save the file.
You do not need to install the toolbar again unless you delete the Essbase toolbar from the ExcelToolbars dialog box.
Getting Acquainted with Spreadsheet Add-in 19
Note:
If you have toolbars turned off in Excel, you do not see the Essbase toolbar immediately. Youmust first enable toolbars. See “Using the Essbase Toolbar” on page 20.
Using the Essbase ToolbarSpreadsheet Add-in features a convenient toolbar that displays icons for accessing most of thecommon Essbase commands without having to open the Essbase menu. You can view adescription of an icon on the toolbar by moving your cursor over the icon.
Note:
Before you can view the Essbase toolbar, you must install it. See “Installing the Essbase Toolbarfor Excel” on page 19.
Table 1 lists the icons on the toolbar.
➤ To view the Essbase toolbar, from the Excel menu bar, select View, then Toolbars, thenEssbase.
A check box must be displayed next to Essbase in the menu.
Note:
If you select the Essbase option and click Delete, you must reinstall the toolbar. See “Installingthe Essbase Toolbar for Excel” on page 19 for instructions.
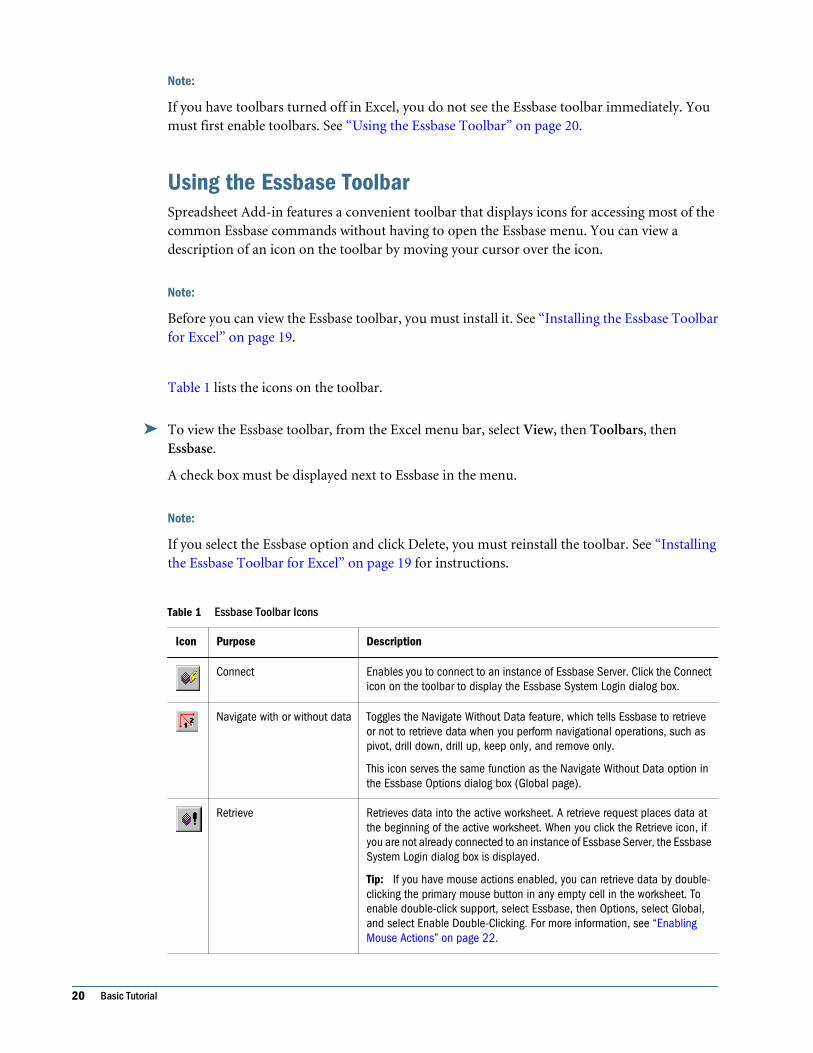
Table 1 Essbase Toolbar Icons
Icon Purpose Description
Connect Enables you to connect to an instance of Essbase Server. Click the Connecticon on the toolbar to display the Essbase System Login dialog box.
Navigate with or without data Toggles the Navigate Without Data feature, which tells Essbase to retrieveor not to retrieve data when you perform navigational operations, such aspivot, drill down, drill up, keep only, and remove only.
This icon serves the same function as the Navigate Without Data option inthe Essbase Options dialog box (Global page).
Retrieve Retrieves data into the active worksheet. A retrieve request places data atthe beginning of the active worksheet. When you click the Retrieve icon, ifyou are not already connected to an instance of Essbase Server, the EssbaseSystem Login dialog box is displayed.
Tip: If you have mouse actions enabled, you can retrieve data by double-clicking the primary mouse button in any empty cell in the worksheet. Toenable double-click support, select Essbase, then Options, select Global,and select Enable Double-Clicking. For more information, see “EnablingMouse Actions” on page 22.
20 Basic Tutorial
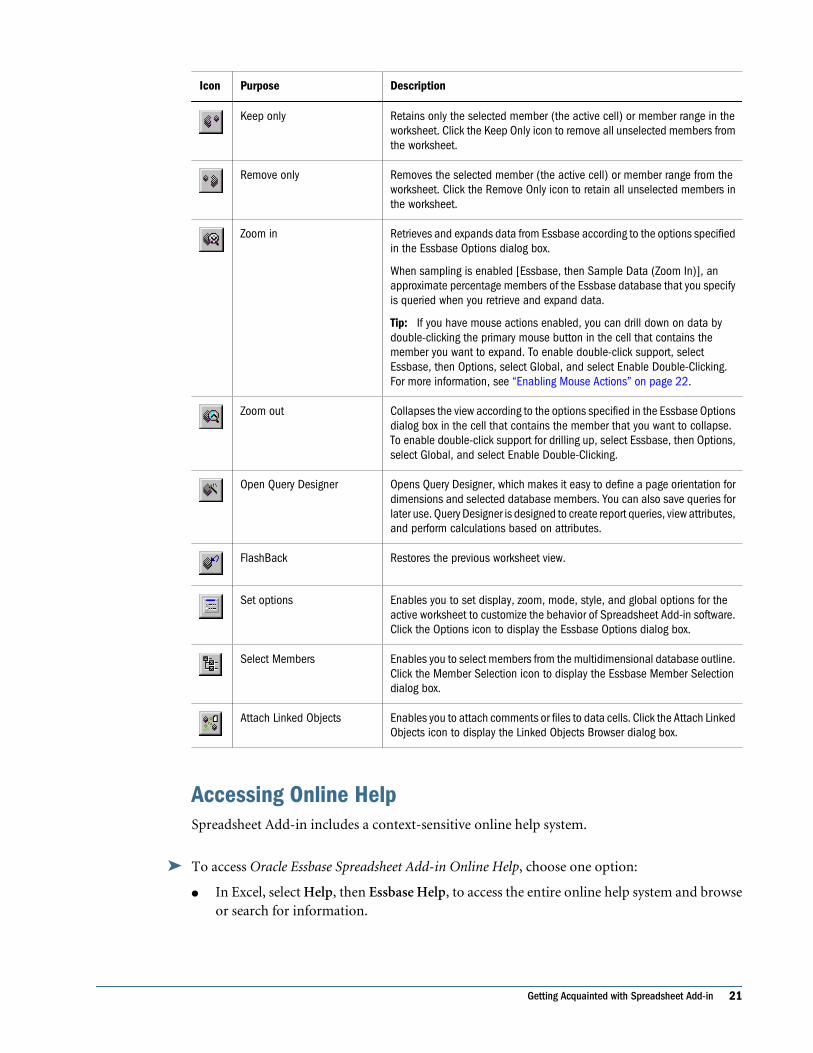
Icon Purpose Description
Keep only Retains only the selected member (the active cell) or member range in theworksheet. Click the Keep Only icon to remove all unselected members fromthe worksheet.
Remove only Removes the selected member (the active cell) or member range from theworksheet. Click the Remove Only icon to retain all unselected members inthe worksheet.
Zoom in Retrieves and expands data from Essbase according to the options specifiedin the Essbase Options dialog box.
When sampling is enabled [Essbase, then Sample Data (Zoom In)], anapproximate percentage members of the Essbase database that you specifyis queried when you retrieve and expand data.
Tip: If you have mouse actions enabled, you can drill down on data bydouble-clicking the primary mouse button in the cell that contains themember you want to expand. To enable double-click support, selectEssbase, then Options, select Global, and select Enable Double-Clicking.For more information, see “Enabling Mouse Actions” on page 22.
Zoom out Collapses the view according to the options specified in the Essbase Optionsdialog box in the cell that contains the member that you want to collapse.To enable double-click support for drilling up, select Essbase, then Options,select Global, and select Enable Double-Clicking.
Open Query Designer Opens Query Designer, which makes it easy to define a page orientation fordimensions and selected database members. You can also save queries forlater use. Query Designer is designed to create report queries, view attributes,and perform calculations based on attributes.
FlashBack Restores the previous worksheet view.
Set options Enables you to set display, zoom, mode, style, and global options for theactive worksheet to customize the behavior of Spreadsheet Add-in software.Click the Options icon to display the Essbase Options dialog box.
Select Members Enables you to select members from the multidimensional database outline.Click the Member Selection icon to display the Essbase Member Selectiondialog box.
Attach Linked Objects Enables you to attach comments or files to data cells. Click the Attach LinkedObjects icon to display the Linked Objects Browser dialog box.
Accessing Online HelpSpreadsheet Add-in includes a context-sensitive online help system.
➤ To access Oracle Essbase Spreadsheet Add-in Online Help, choose one option:
● In Excel, select Help, then Essbase Help, to access the entire online help system and browseor search for information.
Getting Acquainted with Spreadsheet Add-in 21
Browse or search through the system to view general information on Spreadsheet Add-in,Essbase command descriptions, procedural information for completing tasks, SpreadsheetToolkit macros, and Visual Basic for Applications (VBA) function descriptions.
● In each Spreadsheet Add-in dialog box, click Help to access information specific to theparticular dialog box.
The Help buttons enable you to find the information that you need without having to searchthe entire help system.
Note:
Oracle Essbase Spreadsheet Add-in Online Help provides a comprehensive section on Spreadsheet Toolkit, which enables you to customize and automate your use of Essbase byusing macros and VBA functions.
● In Query Designer, click in the navigation pane to access Query Designer online helptopics.
Enabling Mouse ActionsThese terms are used throughout this guide to describe mouse operations:
● Primary mouse button and secondary mouse button describe the buttons on a two- or three-button mouse.
Usually, right-handed users configure the left mouse button as the primary button and theright mouse button as the secondary mouse button. The primary mouse button is the onethat you use to start Windows applications, the secondary mouse button is used for auxiliaryoperations. Click refers to use of the primary mouse button. The term right-click refers touse of the secondary mouse button.
● Select chooses the object that is under the cursor when you press and release the primarymouse button.
Select a worksheet cell, for example, by moving the cursor to the cell and pressing andreleasing the primary mouse button.
● Click (that is, both click and right-click) describes a quick press-and-release action on acommand object.
Click a button, for example, to execute a command.
● Double-click describes two quick press-and-release actions that are executed in rapidsuccession.
Double-click an application icon, for example, to start a Windows application.
● Drag describes a press, hold, and move action.
Place the cursor on an object, press a mouse button, hold the mouse button down as youmove the object, and release the mouse button when you reach your goal. For example, youcan highlight a range of cells in a worksheet by dragging the cursor over the cells.
22 Basic Tutorial
Note:
Essbase uses a drag operation called a pivot. A pivot requires use of the secondary mousebutton. To execute a pivot, you must press and hold the secondary, rather than the primary,mouse button while dragging the selection.
Essbase offers enhanced mouse actions in Excel. You can use the mouse to perform any of thesetasks:
● Retrieve data
● Drill down and drill up on database members
● Pivot (move or transpose) data rows and columns
● Access linked reporting objects
● Access linked partitions
➤ To enable double-clicking to retrieve, drill down, and drill up on Essbase data:
1 Select Essbase, then Options, and select Global.
2 Select Enable Double-Clicking.
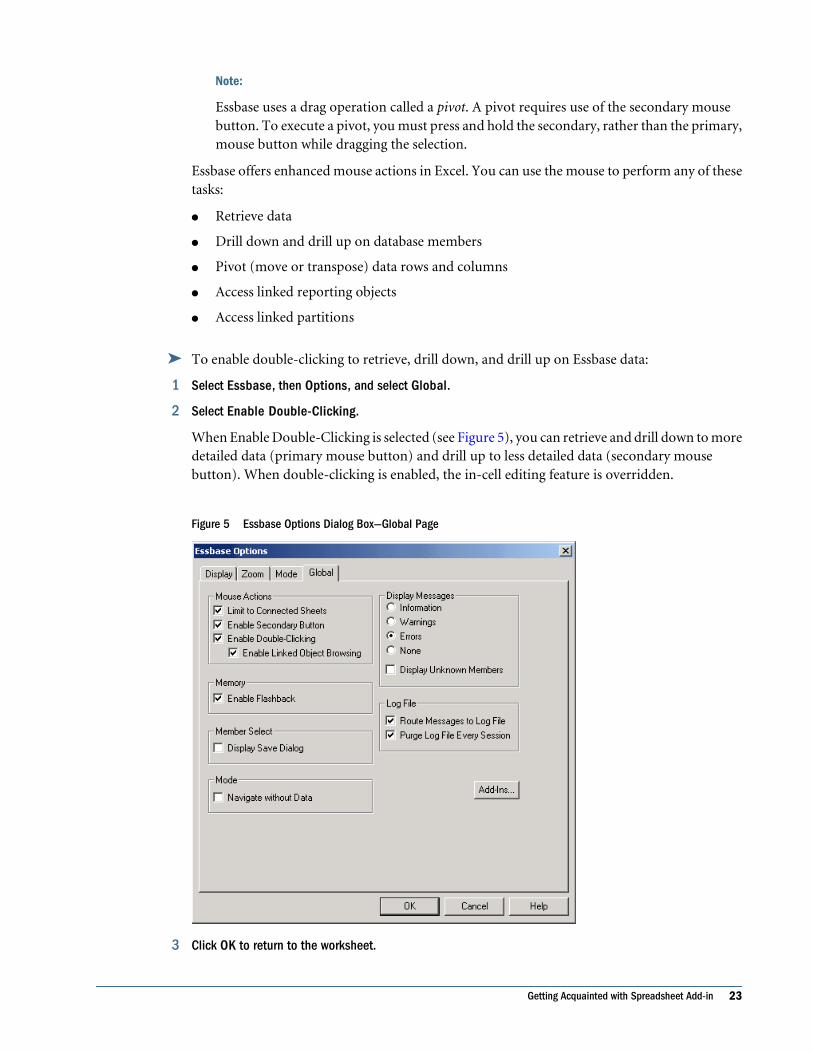
When Enable Double-Clicking is selected (see Figure 5), you can retrieve and drill down to moredetailed data (primary mouse button) and drill up to less detailed data (secondary mousebutton). When double-clicking is enabled, the in-cell editing feature is overridden.
Figure 5 Essbase Options Dialog Box—Global Page
3 Click OK to return to the worksheet.
Getting Acquainted with Spreadsheet Add-in 23
For information about setting the primary mouse button to display the Linked Objects Browserdialog box when you double-click a data cell, see Oracle Essbase Spreadsheet Add-in OnlineHelp.
Tutorial PrerequisitesBefore you begin the basic tutorial, read these important topics:
● “Enabling Compatibility with Smart View” on page 24
● “Setting Essbase Options” on page 24
● “Following Guidelines During the Tutorial” on page 28
● “Reviewing the Sample Basic Database” on page 29
Enabling Compatibility with Smart ViewIf Oracle Hyperion Smart View for Office, Fusion Edition is installed on the same computer asSpreadsheet Add-in, complete this procedure to ensure that Spreadsheet Add-in functionsproperly alongside Smart View.
➤ To enable compatibility between Spreadsheet Add-in and Smart View:
1 If you have not already done so, start Excel.
2 Select Essbase, then Options, and select Global.
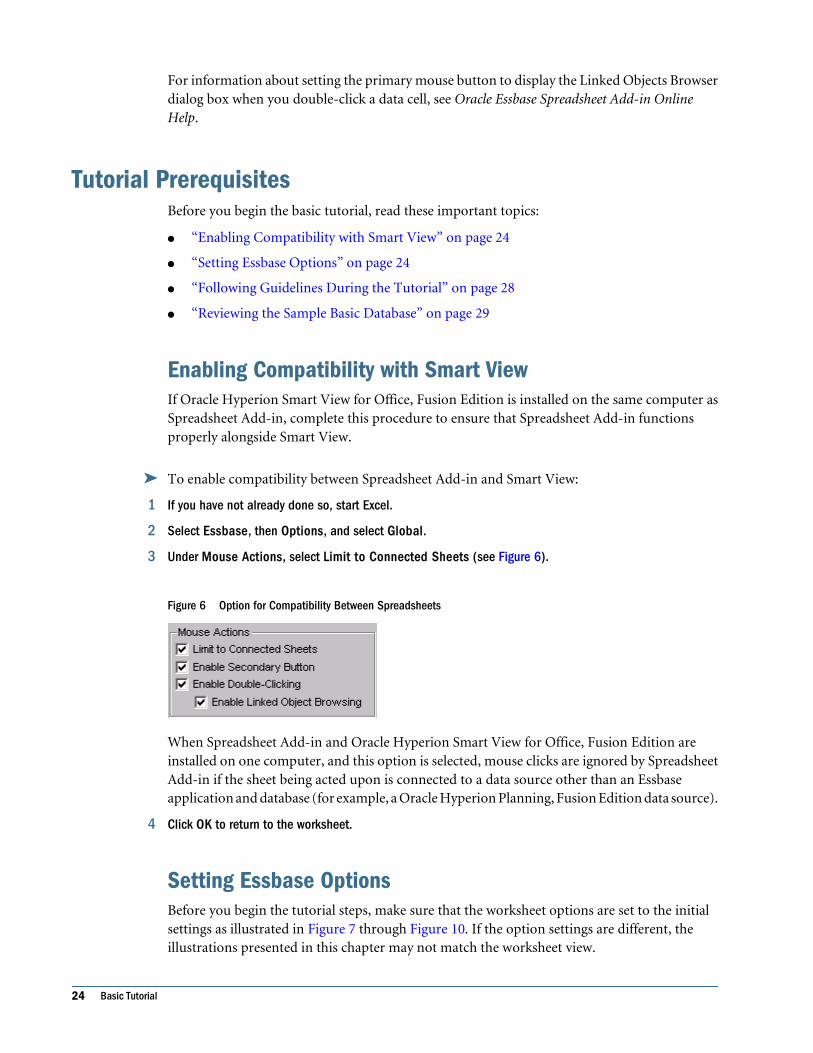
3 Under Mouse Actions, select Limit to Connected Sheets (see Figure 6).
Figure 6 Option for Compatibility Between Spreadsheets
When Spreadsheet Add-in and Oracle Hyperion Smart View for Office, Fusion Edition areinstalled on one computer, and this option is selected, mouse clicks are ignored by SpreadsheetAdd-in if the sheet being acted upon is connected to a data source other than an Essbaseapplication and database (for example, a Oracle Hyperion Planning, Fusion Edition data source).
4 Click OK to return to the worksheet.
Setting Essbase OptionsBefore you begin the tutorial steps, make sure that the worksheet options are set to the initialsettings as illustrated in Figure 7 through Figure 10. If the option settings are different, theillustrations presented in this chapter may not match the worksheet view.
24 Basic Tutorial
Note:
For information about each option in the Essbase Options dialog box, see Oracle EssbaseSpreadsheet Add-in Online Help.
➤ To set worksheet options:
1 Select Essbase, then Options.
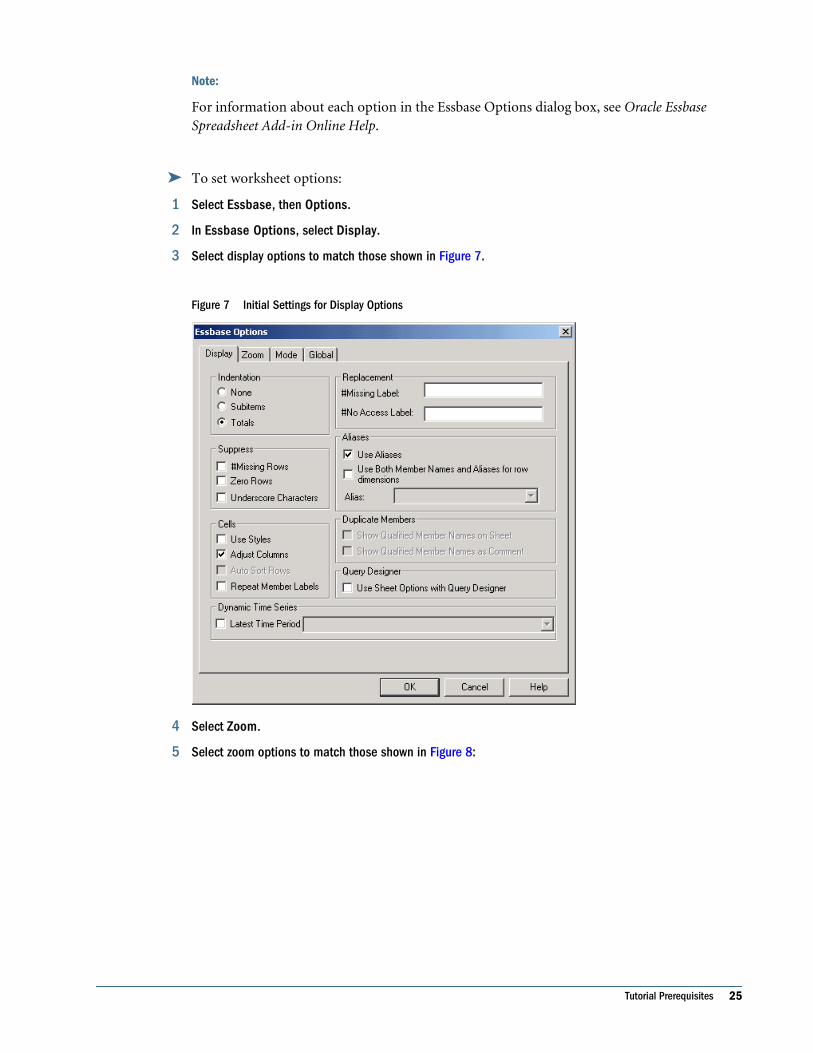
2 In Essbase Options, select Display.
3 Select display options to match those shown in Figure 7.
Figure 7 Initial Settings for Display Options
4 Select Zoom.
5 Select zoom options to match those shown in Figure 8:
Tutorial Prerequisites 25
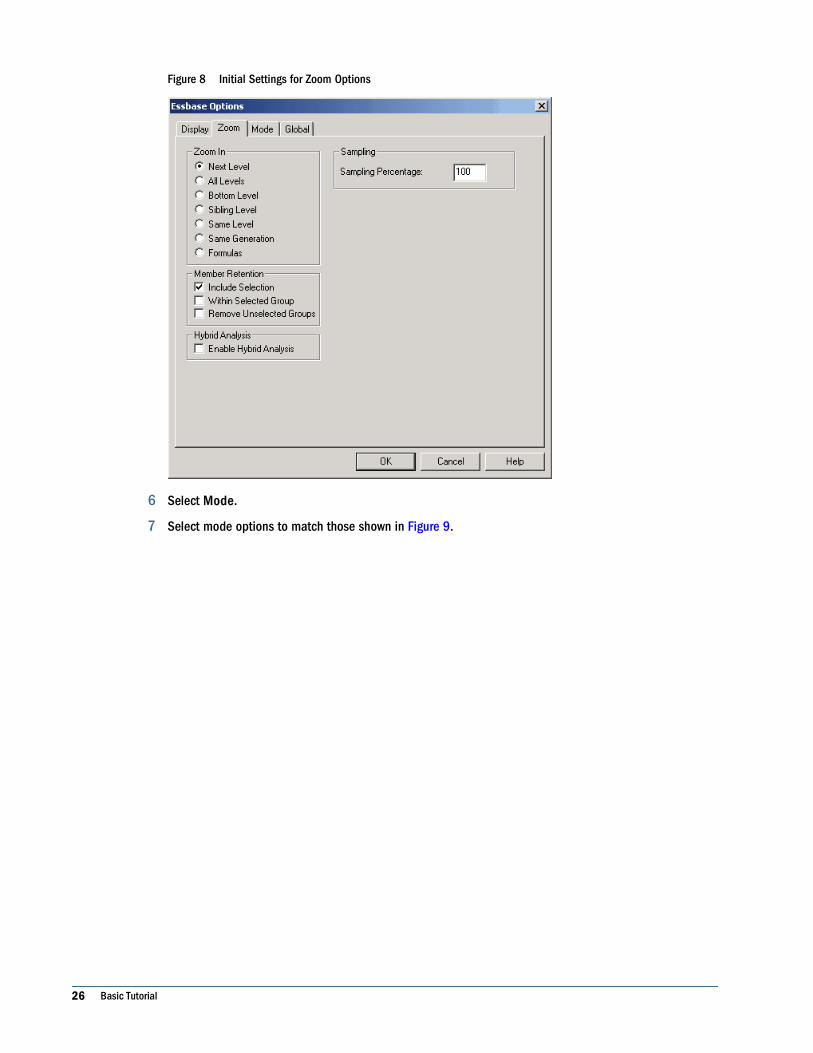
Figure 8 Initial Settings for Zoom Options
6 Select Mode.
7 Select mode options to match those shown in Figure 9.
26 Basic Tutorial
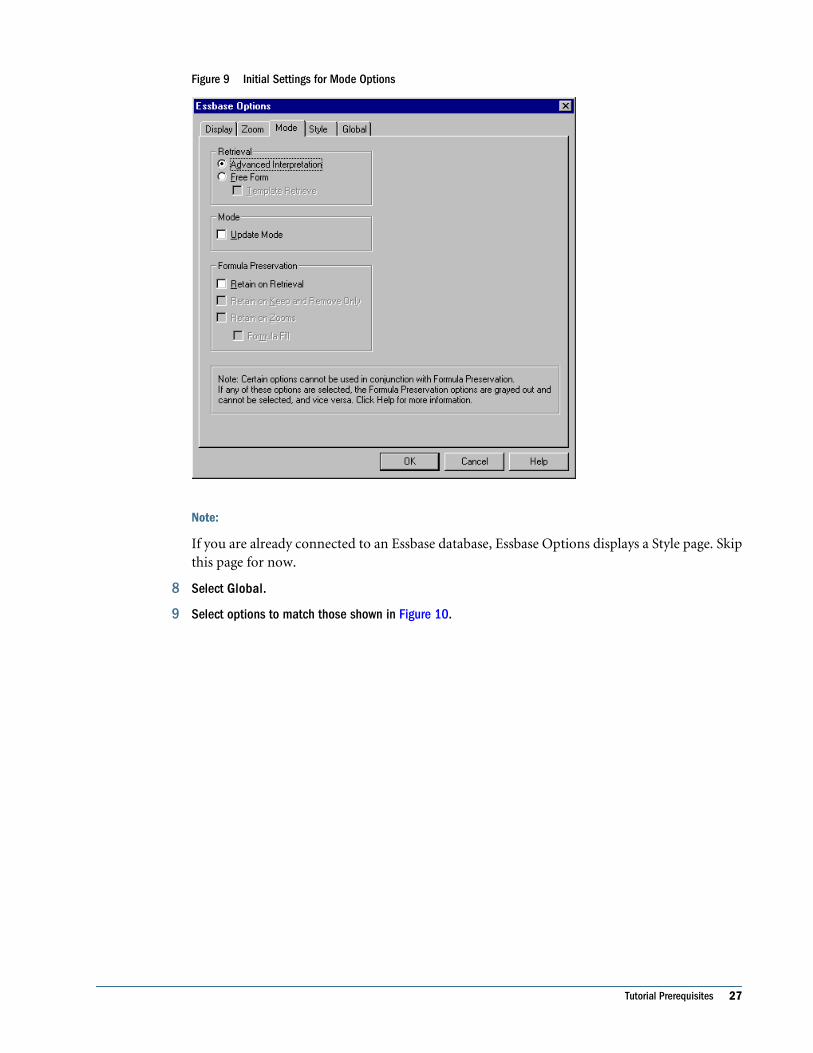
Figure 9 Initial Settings for Mode Options
Note:
If you are already connected to an Essbase database, Essbase Options displays a Style page. Skipthis page for now.
8 Select Global.
9 Select options to match those shown in Figure 10.
Tutorial Prerequisites 27
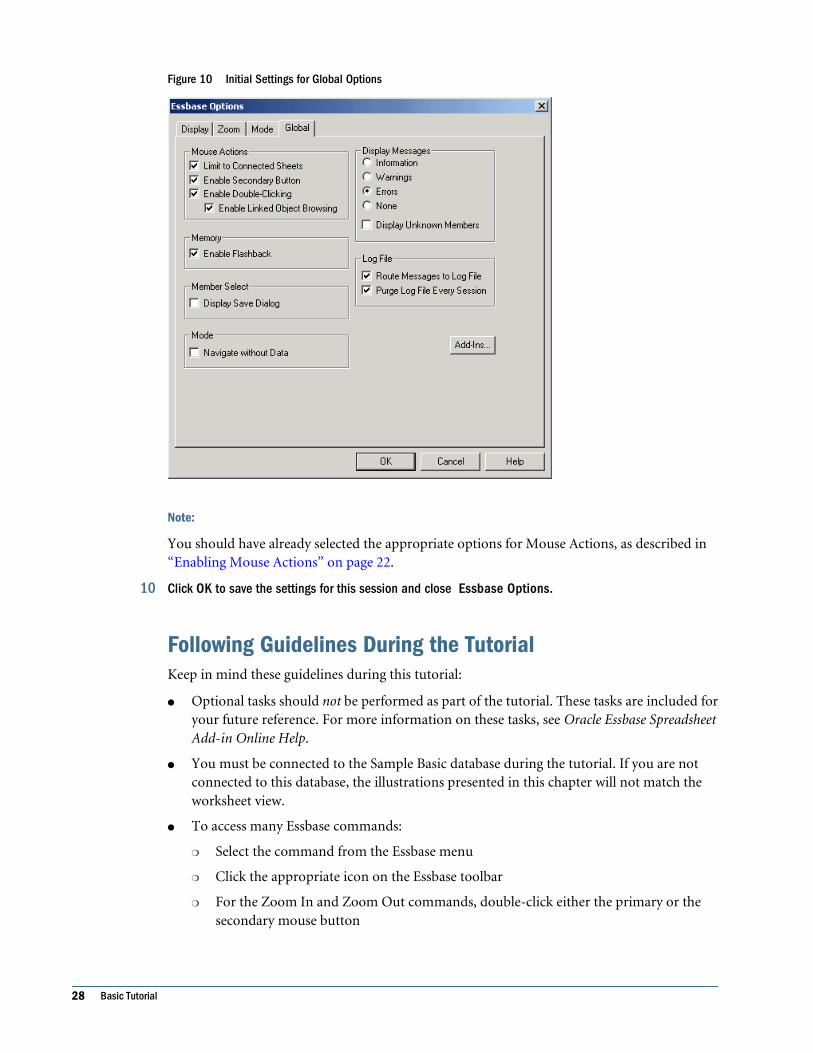
Figure 10 Initial Settings for Global Options
Note:
You should have already selected the appropriate options for Mouse Actions, as described in“Enabling Mouse Actions” on page 22.
10 Click OK to save the settings for this session and close Essbase Options.
Following Guidelines During the TutorialKeep in mind these guidelines during this tutorial:
● Optional tasks should not be performed as part of the tutorial. These tasks are included foryour future reference. For more information on these tasks, see Oracle Essbase SpreadsheetAdd-in Online Help.
● You must be connected to the Sample Basic database during the tutorial. If you are notconnected to this database, the illustrations presented in this chapter will not match theworksheet view.
● To access many Essbase commands:
❍ Select the command from the Essbase menu
❍ Click the appropriate icon on the Essbase toolbar
❍ For the Zoom In and Zoom Out commands, double-click either the primary or thesecondary mouse button
28 Basic Tutorial
● Set the options in the Essbase Options dialog box as described in “Setting Essbase Options”on page 24. If the option settings are different, the illustrations presented in this chaptermay not match the worksheet view.
● After you change a worksheet option in the Essbase Options dialog box, you must performa retrieval or a drill-down operation to have the new setting take effect.
● Be sure to follow each step in the tutorial. Each task builds upon the previous task. Do notskip the final steps at the end of sections, because these steps are often necessary to prepareyou for the next tutorial task.
● If you make a mistake during the tutorial, you can select Essbase, then FlashBack, to returnto the previous worksheet view.
● The values in the Sample Basic database that represent ratios or percentages are calculatedto a very high level of precision (for example, 55.26162826). You can apply a cell format tocontrol the number of decimal places that are displayed in data values. For details on applyingcell formats, see the Excel documentation.
● Numeric values shown in the illustrations used throughout this tutorial may not match thevalues stored in your database. The values shown in these illustrations reflect a freshly loadeddatabase.
● Some worksheet columns have been adjusted for clarity in the illustrations. You do not needto change the width of columns in the worksheet to follow the tutorial steps. The AdjustColumns option in the Display page of the Essbase Options dialog box adjusts columns foryou.
Reviewing the Sample Basic DatabaseThe Sample Basic database used in this tutorial is based on a hypothetical company in thebeverage industry. The major products of the company are various kinds of sodas. Theseproducts are sold in U.S. markets, which are categorized by state and region. Financial data forthe company is collected monthly and is summarized by quarter and by year. The company usesEssbase to calculate financial and accounting data, such as sales, cost of goods sold, and payroll.The company tracks both actual and budget data, as well as the variance and percent variancebetween the two.
Retrieving DataNow that you are more familiar with the Essbase environment, you can connect to an instanceof Essbase Server and start using Essbase and Spreadsheet Add-in. This section guides youthrough a typical Essbase session where you connect to a database and retrieve data in variousways.
This topic outlines these basic retrieval tasks:
● “Connecting to a Database” on page 30
● “Changing a Password (Optional)” on page 32
● “Retrieving Data from a Database” on page 32
Retrieving Data 29
● “Canceling a Data Retrieval Request” on page 34
● “Restoring the Previous Database View” on page 34
● “Drilling Down to More Detail” on page 35
● “Drilling Up to Less Detail” on page 38
● “Customizing Drill-Down and Drill-Up Behavior” on page 39
Make sure that you followed the steps in “Setting Essbase Options” on page 24. If the settings inthe Essbase Options dialog box are different from the settings previously illustrated, theworksheet view will differ from the illustrations shown in this chapter.
Remember that you can perform common data retrieval tasks in any of these ways:
● Select commands from the Essbase menu on the Excel menu bar
● Double-click the primary or the secondary mouse button in the appropriate cell (forRetrieve, Zoom In, and Zoom Out commands)
● In Excel, click the appropriate icons on the Essbase toolbar
Connecting to a DatabaseTo access Essbase data, you must first connect to a database on an instance of Essbase Server.This tutorial assumes that you have the appropriate privileges to connect to a server, anapplication, and a database.
To complete the steps that follow, you need to know the name of the server to which you wantto connect, your user name, and your password. If you do not have this information, contactthe Essbase system administrator.
Note:
Essbase does not support multiple instances of Excel.
➤ To connect to an Essbase Server, application, and database:
1 Select Essbase, then Connect.
The Essbase System Login dialog box is displayed (see Figure 11).
30 Basic Tutorial
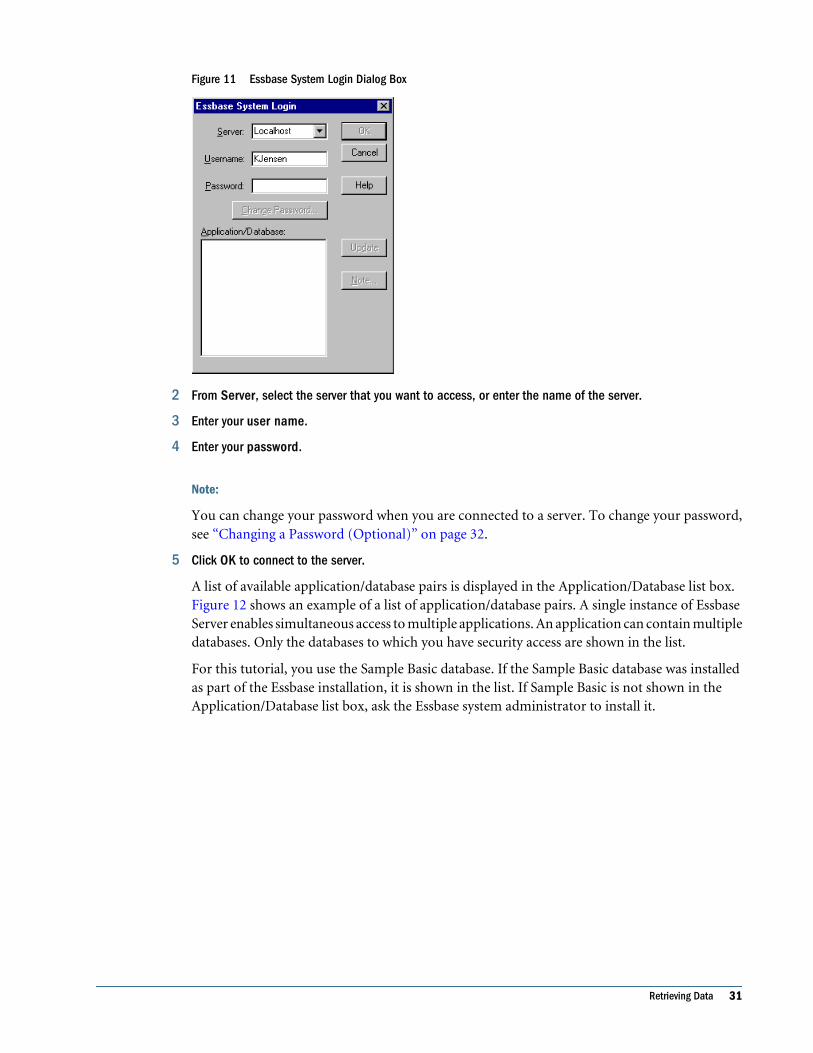
Figure 11 Essbase System Login Dialog Box
2 From Server, select the server that you want to access, or enter the name of the server.
3 Enter your user name.
4 Enter your password.
Note:
You can change your password when you are connected to a server. To change your password,see “Changing a Password (Optional)” on page 32.
5 Click OK to connect to the server.
A list of available application/database pairs is displayed in the Application/Database list box.Figure 12 shows an example of a list of application/database pairs. A single instance of EssbaseServer enables simultaneous access to multiple applications. An application can contain multipledatabases. Only the databases to which you have security access are shown in the list.
For this tutorial, you use the Sample Basic database. If the Sample Basic database was installedas part of the Essbase installation, it is shown in the list. If Sample Basic is not shown in theApplication/Database list box, ask the Essbase system administrator to install it.
Retrieving Data 31
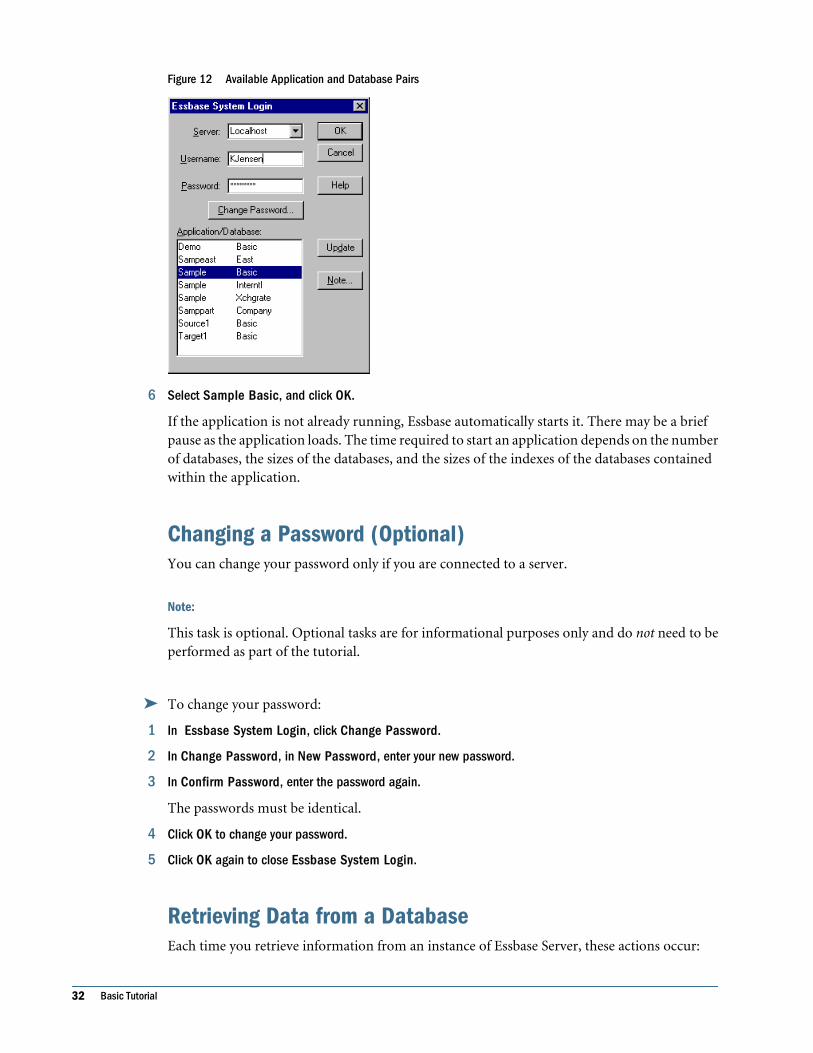
Figure 12 Available Application and Database Pairs
6 Select Sample Basic, and click OK.
If the application is not already running, Essbase automatically starts it. There may be a briefpause as the application loads. The time required to start an application depends on the numberof databases, the sizes of the databases, and the sizes of the indexes of the databases containedwithin the application.
Changing a Password (Optional)You can change your password only if you are connected to a server.
Note:
This task is optional. Optional tasks are for informational purposes only and do not need to beperformed as part of the tutorial.
➤ To change your password:
1 In Essbase System Login, click Change Password.
2 In Change Password, in New Password, enter your new password.
3 In Confirm Password, enter the password again.
The passwords must be identical.
4 Click OK to change your password.
5 Click OK again to close Essbase System Login.
Retrieving Data from a DatabaseEach time you retrieve information from an instance of Essbase Server, these actions occur:
32 Basic Tutorial
● Spreadsheet Add-in requests data from the server.
● The server processes the request and prepares the data.
● The server transmits the data to Spreadsheet Add-in.
● The spreadsheet application receives the data from Essbase and organizes it in a worksheet.
To help you monitor these operations, Essbase uses three custom cursors, as described inTable 2.
Table 2 Essbase Custom Cursor
Cursor When Displayed
Spreadsheet Add-in requests information from Essbase Server.
The server is processing the request.
The server returns the data.
Note:
Small retrieval actions display the cursors very quickly; you may not notice changes in thedirection of the arrow when retrieving small amounts of data.
➤ To retrieve data into an empty worksheet:
1 Select File, then New, or click to open a new worksheet.
Note:
You should be connected to the Sample Basic database. If you are not connected, follow the stepsin “Connecting to a Database” on page 30.
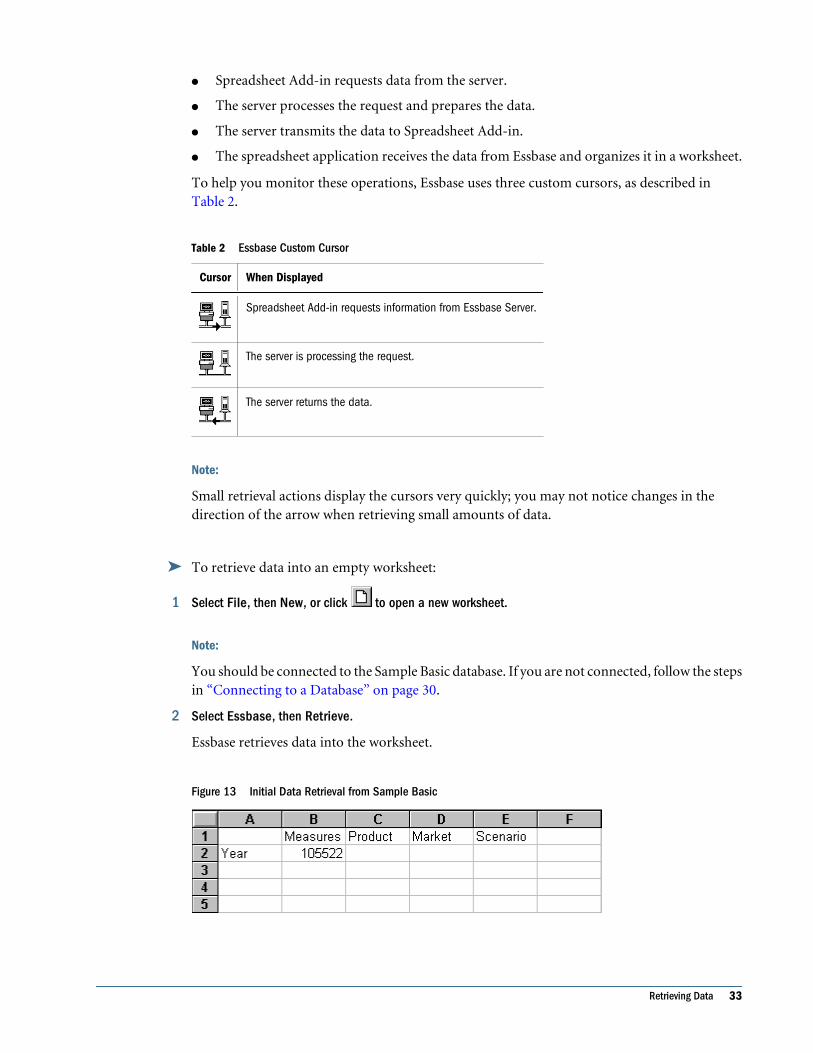
2 Select Essbase, then Retrieve.
Essbase retrieves data into the worksheet.
Figure 13 Initial Data Retrieval from Sample Basic
Retrieving Data 33
Because you selected the Enable Double-Clicking option in the Essbase Options dialog box(Global page) in step 9 on page 27, you can double-click in an empty cell to retrieve data. Youcan also click the Retrieve icon on the Essbase toolbar.
When you retrieve data into an empty worksheet, Essbase returns data from the top levels ofeach database dimension. The top level is used as a starting point to navigate, or drill down, intolevels of detailed data. In the Sample Basic database, these five dimensions are retrieved:Measures, Product, Market, Scenario, and Year.
Tip:
You can retrieve data by double-clicking in a data cell, selecting Essbase, then Retrieve, or byclicking the Retrieve icon on the Essbase toolbar.
Canceling a Data Retrieval RequestOccasionally, you may want to cancel a retrieval request. For instance, you may want to stop arequest if a retrieval is taking longer than expected or if you mistakenly double-click.
Because Essbase returns data so quickly to the worksheet, you may not be able to cancel a retrievalbefore the retrieval is complete. The cancel feature is most useful when you need to stop a largeretrieval request.
➤ To cancel data retrievals, press Esc during a retrieval action.
Note:
You can cancel a retrieval only while Essbase is processing in Spreadsheet Add-in. You cannotcancel a retrieval when Essbase is processing from Essbase Server.
Restoring the Previous Database ViewThe FlashBack command restores the previous database view. A database view is what you seein the worksheet after a retrieval or navigation operation. FlashBack is similar to the Edit menuUndo command, which reverses the last action, with this difference. If you modify memberinformation between retrieves and then perform a FlashBack, Essbase still flashes back to thespreadsheet data as it was prior to the last retrieve, in spite of any changes you may have madeto members between retrieves. The FlashBack command uses the memory of your computer tostore the current view before processing an Essbase retrieval request. You can use FlashBack toundo only the most recent operation. FlashBack cannot undo multiple operations.
Throughout this tutorial, you should follow all steps in the order that they are presented. If youmake a mistake or find yourself out of step with the tutorial, you can use the FlashBack commandfrom the Essbase menu or toolbar to undo the last command and return to the previous databaseview.
34 Basic Tutorial
➤ To start the tutorial over from the beginning:
1 Select the entire worksheet, and select Edit, then Clear, then All
2 Press Enter or click OK to empty the worksheet and start again
Note:
You can disable FlashBack during normal operations to conserve memory on your localcomputer. Do not disable FlashBack for this tutorial.
➤ To disable Flashback (optional):
1 Select Essbase, then Options, and select Global.
2 Clear Enable FlashBack.
Note:
Optional tasks are for informational purposes only and do not need to be performed as part ofthe tutorial.
Drilling Down to More DetailYou can drill down to various levels of multidimensional data in the worksheet. For example, ifyou want to view data for a specific quarter or month rather than an aggregate data value for thewhole year, you can drill down on the Year dimension to see more detailed data.
➤ To drill-down on members, select one option:
● Select the member, and select Essbase, then Zoom In.
● Select the member, and double-click the primary mouse button.
● Select the member, and click Zoom In on the Essbase toolbar.
➤ To drill down to lower levels of the Year dimension:
1 On Year in cell A2, double-click the primary mouse button.
The drill-down action retrieves data for the level below (the children of) Year: Qtr1, Qtr2, Qtr3,and Qtr4 (see Figure 14).
Retrieving Data 35
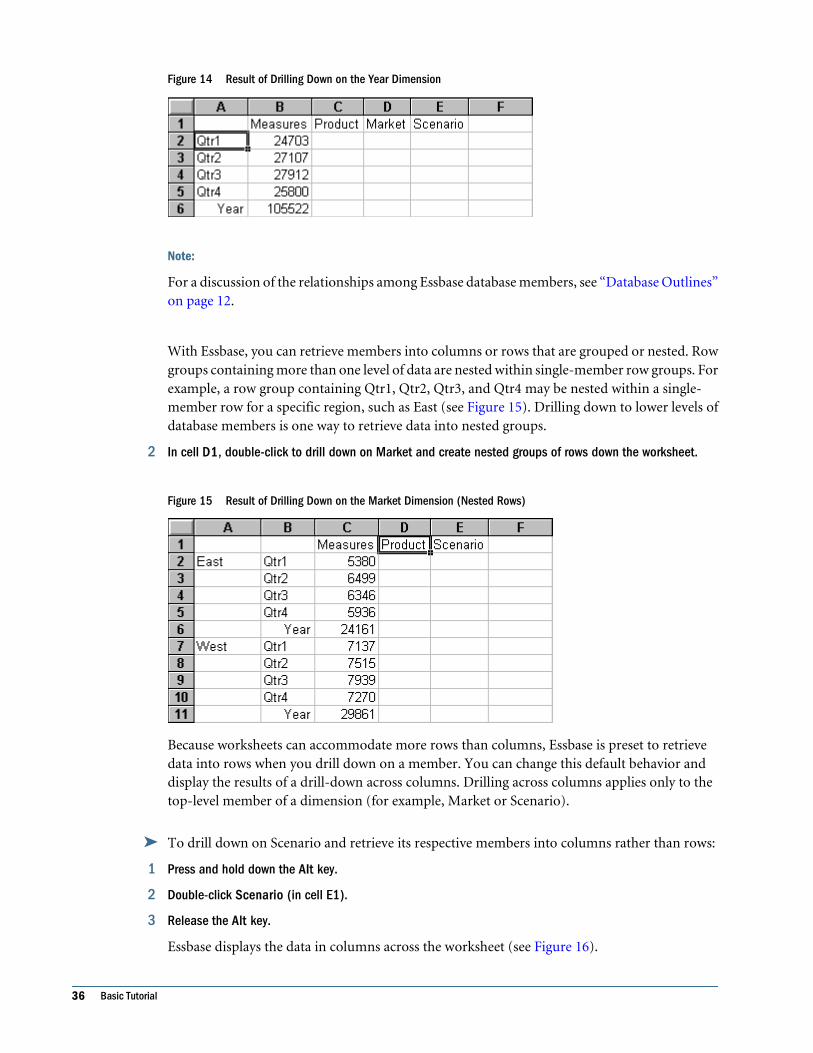
Figure 14 Result of Drilling Down on the Year Dimension
Note:
For a discussion of the relationships among Essbase database members, see “Database Outlines”on page 12.
With Essbase, you can retrieve members into columns or rows that are grouped or nested. Rowgroups containing more than one level of data are nested within single-member row groups. Forexample, a row group containing Qtr1, Qtr2, Qtr3, and Qtr4 may be nested within a single-member row for a specific region, such as East (see Figure 15). Drilling down to lower levels ofdatabase members is one way to retrieve data into nested groups.
2 In cell D1, double-click to drill down on Market and create nested groups of rows down the worksheet.
Figure 15 Result of Drilling Down on the Market Dimension (Nested Rows)
Because worksheets can accommodate more rows than columns, Essbase is preset to retrievedata into rows when you drill down on a member. You can change this default behavior anddisplay the results of a drill-down across columns. Drilling across columns applies only to thetop-level member of a dimension (for example, Market or Scenario).
➤ To drill down on Scenario and retrieve its respective members into columns rather than rows:
1 Press and hold down the Alt key.
2 Double-click Scenario (in cell E1).
3 Release the Alt key.
Essbase displays the data in columns across the worksheet (see Figure 16).
36 Basic Tutorial
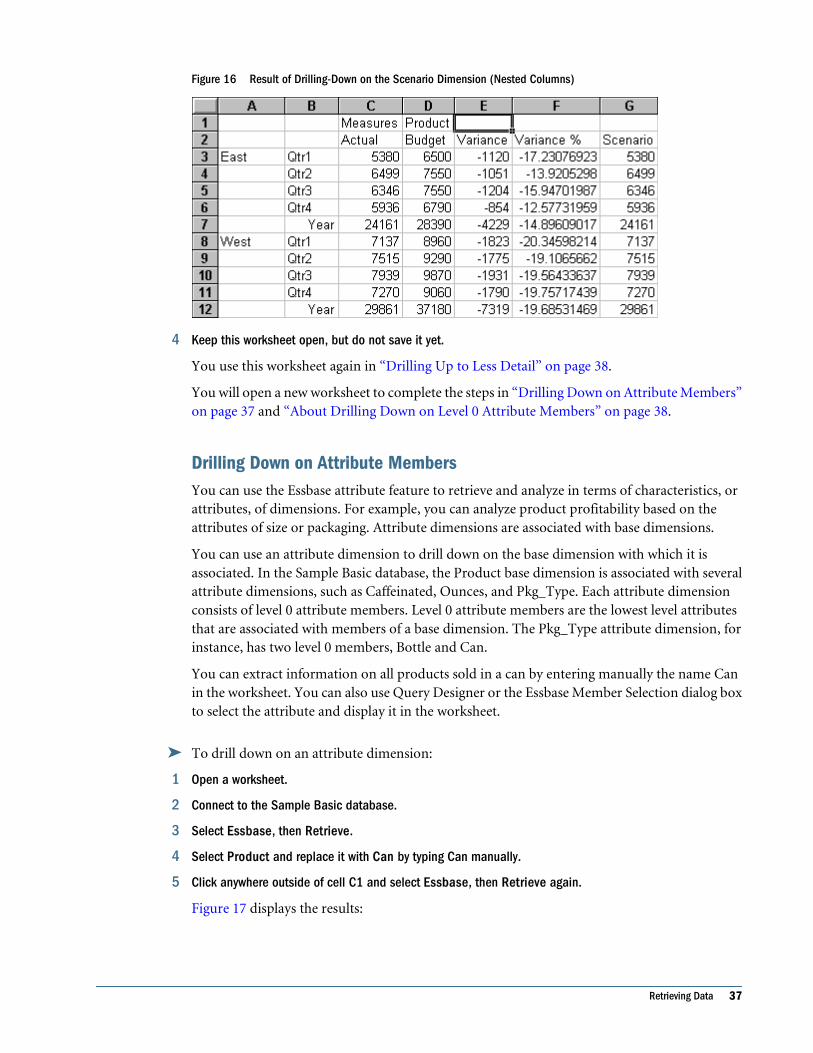
Figure 16 Result of Drilling-Down on the Scenario Dimension (Nested Columns)
4 Keep this worksheet open, but do not save it yet.
You use this worksheet again in “Drilling Up to Less Detail” on page 38.
You will open a new worksheet to complete the steps in “Drilling Down on Attribute Members”on page 37 and “About Drilling Down on Level 0 Attribute Members” on page 38.
Drilling Down on Attribute MembersYou can use the Essbase attribute feature to retrieve and analyze in terms of characteristics, orattributes, of dimensions. For example, you can analyze product profitability based on theattributes of size or packaging. Attribute dimensions are associated with base dimensions.
You can use an attribute dimension to drill down on the base dimension with which it isassociated. In the Sample Basic database, the Product base dimension is associated with severalattribute dimensions, such as Caffeinated, Ounces, and Pkg_Type. Each attribute dimensionconsists of level 0 attribute members. Level 0 attribute members are the lowest level attributesthat are associated with members of a base dimension. The Pkg_Type attribute dimension, forinstance, has two level 0 members, Bottle and Can.
You can extract information on all products sold in a can by entering manually the name Canin the worksheet. You can also use Query Designer or the Essbase Member Selection dialog boxto select the attribute and display it in the worksheet.
➤ To drill down on an attribute dimension:
1 Open a worksheet.
2 Connect to the Sample Basic database.
3 Select Essbase, then Retrieve.
4 Select Product and replace it with Can by typing Can manually.
5 Click anywhere outside of cell C1 and select Essbase, then Retrieve again.
Figure 17 displays the results:
Retrieving Data 37
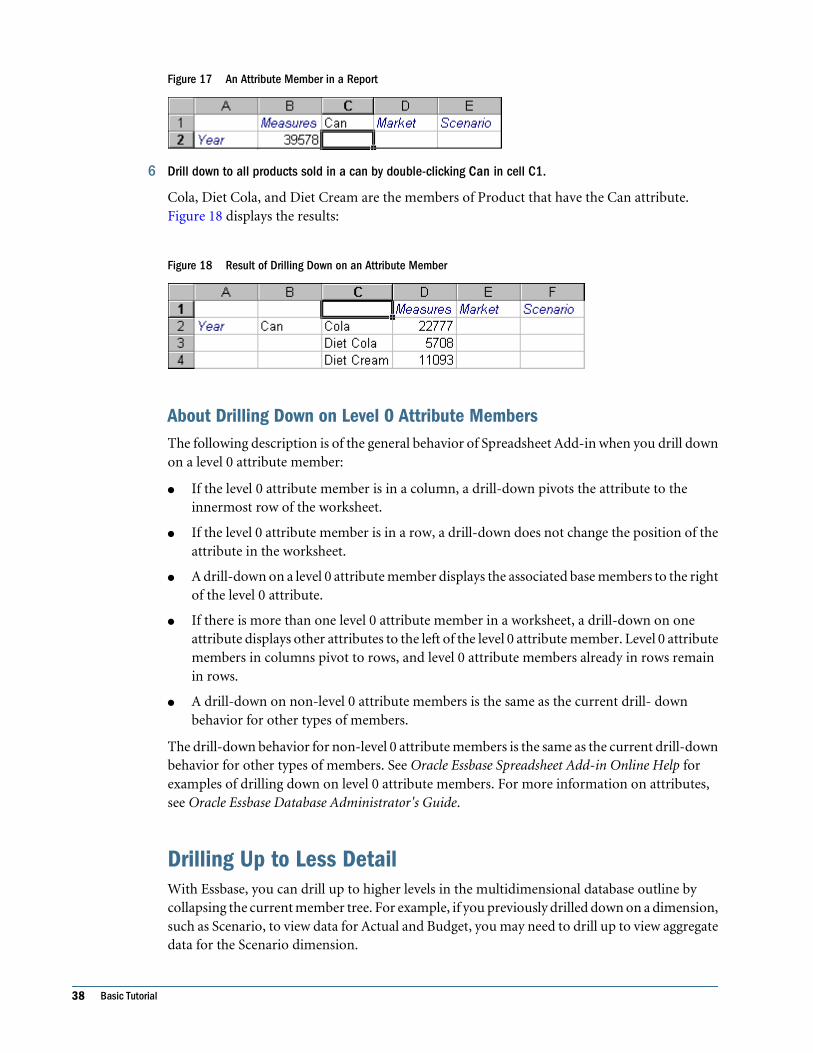
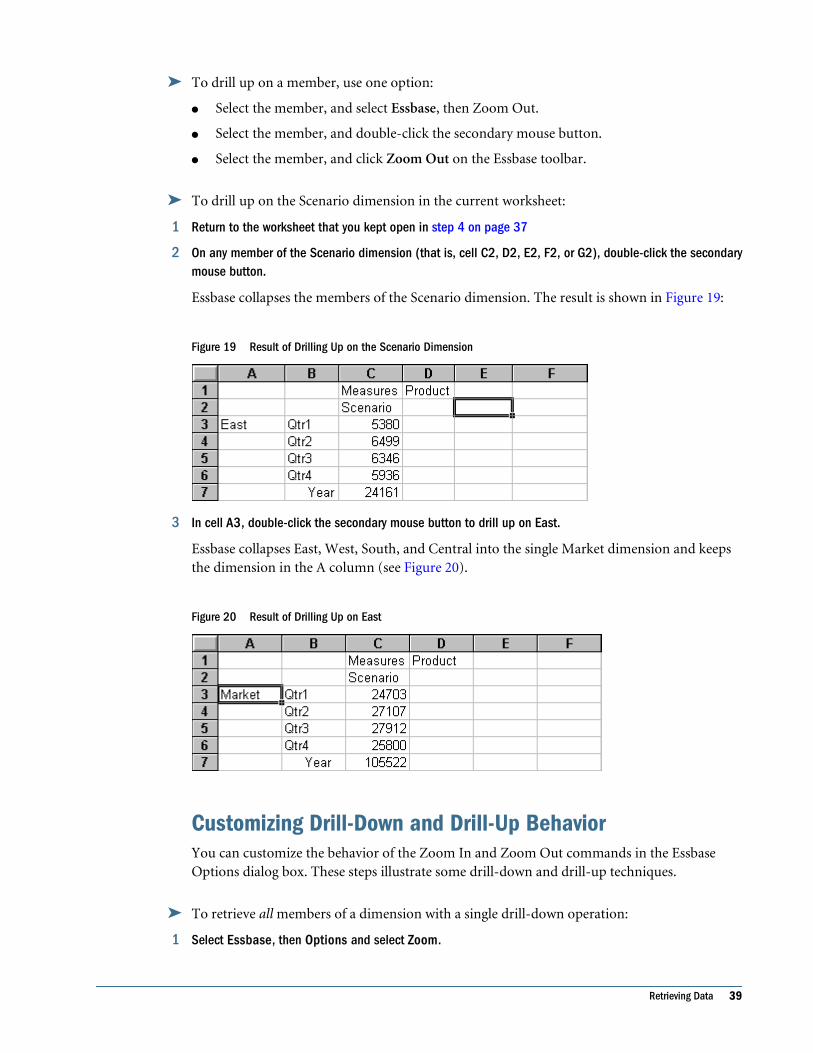
Figure 17 An Attribute Member in a Report
6 Drill down to all products sold in a can by double-clicking Can in cell C1.
Cola, Diet Cola, and Diet Cream are the members of Product that have the Can attribute.Figure 18 displays the results:
Figure 18 Result of Drilling Down on an Attribute Member
About Drilling Down on Level 0 Attribute MembersThe following description is of the general behavior of Spreadsheet Add-in when you drill downon a level 0 attribute member:
● If the level 0 attribute member is in a column, a drill-down pivots the attribute to theinnermost row of the worksheet.
● If the level 0 attribute member is in a row, a drill-down does not change the position of theattribute in the worksheet.
● A drill-down on a level 0 attribute member displays the associated base members to the rightof the level 0 attribute.
● If there is more than one level 0 attribute member in a worksheet, a drill-down on oneattribute displays other attributes to the left of the level 0 attribute member. Level 0 attributemembers in columns pivot to rows, and level 0 attribute members already in rows remainin rows.
● A drill-down on non-level 0 attribute members is the same as the current drill- downbehavior for other types of members.
The drill-down behavior for non-level 0 attribute members is the same as the current drill-downbehavior for other types of members. See Oracle Essbase Spreadsheet Add-in Online Help forexamples of drilling down on level 0 attribute members. For more information on attributes,see Oracle Essbase Database Administrator's Guide.
Drilling Up to Less DetailWith Essbase, you can drill up to higher levels in the multidimensional database outline bycollapsing the current member tree. For example, if you previously drilled down on a dimension,such as Scenario, to view data for Actual and Budget, you may need to drill up to view aggregatedata for the Scenario dimension.
38 Basic Tutorial
➤ To drill up on a member, use one option:
● Select the member, and select Essbase, then Zoom Out.
● Select the member, and double-click the secondary mouse button.
● Select the member, and click Zoom Out on the Essbase toolbar.
➤ To drill up on the Scenario dimension in the current worksheet:
1 Return to the worksheet that you kept open in step 4 on page 37
2 On any member of the Scenario dimension (that is, cell C2, D2, E2, F2, or G2), double-click the secondarymouse button.
Essbase collapses the members of the Scenario dimension. The result is shown in Figure 19:
Figure 19 Result of Drilling Up on the Scenario Dimension
3 In cell A3, double-click the secondary mouse button to drill up on East.
Essbase collapses East, West, South, and Central into the single Market dimension and keepsthe dimension in the A column (see Figure 20).
Figure 20 Result of Drilling Up on East
Customizing Drill-Down and Drill-Up BehaviorYou can customize the behavior of the Zoom In and Zoom Out commands in the EssbaseOptions dialog box. These steps illustrate some drill-down and drill-up techniques.
➤ To retrieve all members of a dimension with a single drill-down operation:
1 Select Essbase, then Options and select Zoom.
Retrieving Data 39
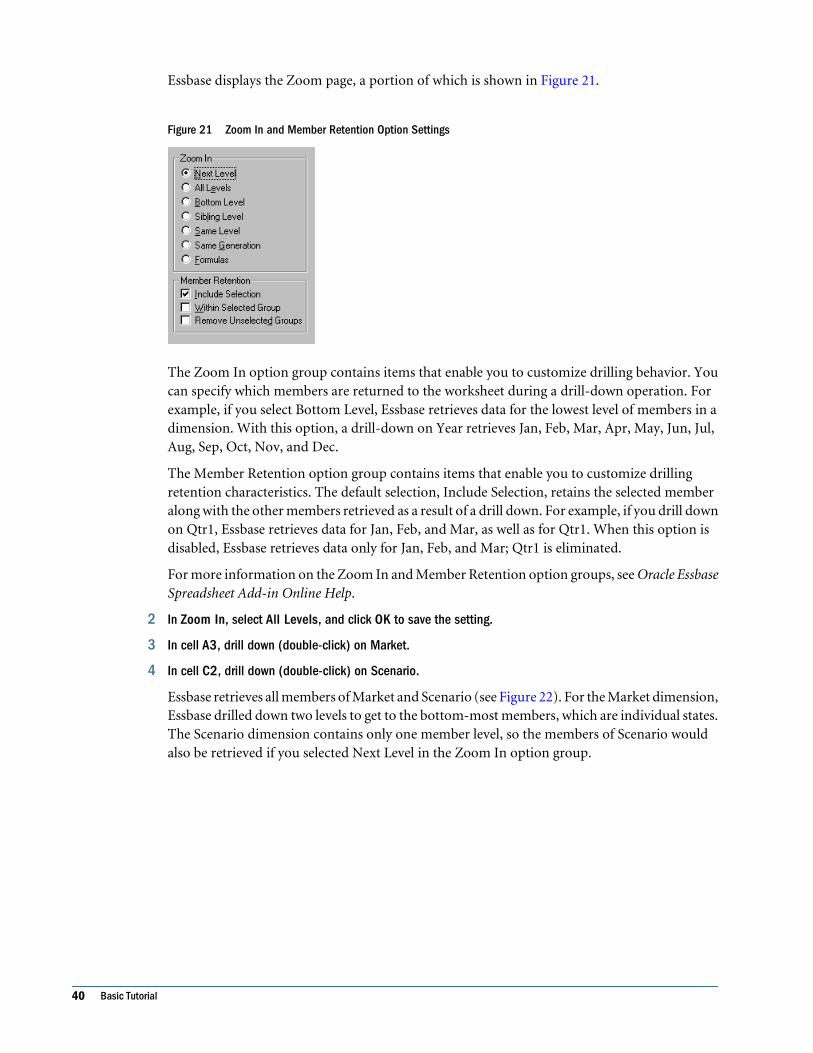
Essbase displays the Zoom page, a portion of which is shown in Figure 21.
Figure 21 Zoom In and Member Retention Option Settings
The Zoom In option group contains items that enable you to customize drilling behavior. Youcan specify which members are returned to the worksheet during a drill-down operation. Forexample, if you select Bottom Level, Essbase retrieves data for the lowest level of members in adimension. With this option, a drill-down on Year retrieves Jan, Feb, Mar, Apr, May, Jun, Jul,Aug, Sep, Oct, Nov, and Dec.
The Member Retention option group contains items that enable you to customize drillingretention characteristics. The default selection, Include Selection, retains the selected memberalong with the other members retrieved as a result of a drill down. For example, if you drill downon Qtr1, Essbase retrieves data for Jan, Feb, and Mar, as well as for Qtr1. When this option isdisabled, Essbase retrieves data only for Jan, Feb, and Mar; Qtr1 is eliminated.
For more information on the Zoom In and Member Retention option groups, see Oracle EssbaseSpreadsheet Add-in Online Help.
2 In Zoom In, select All Levels, and click OK to save the setting.
3 In cell A3, drill down (double-click) on Market.
4 In cell C2, drill down (double-click) on Scenario.
Essbase retrieves all members of Market and Scenario (see Figure 22). For the Market dimension,Essbase drilled down two levels to get to the bottom-most members, which are individual states.The Scenario dimension contains only one member level, so the members of Scenario wouldalso be retrieved if you selected Next Level in the Zoom In option group.
40 Basic Tutorial
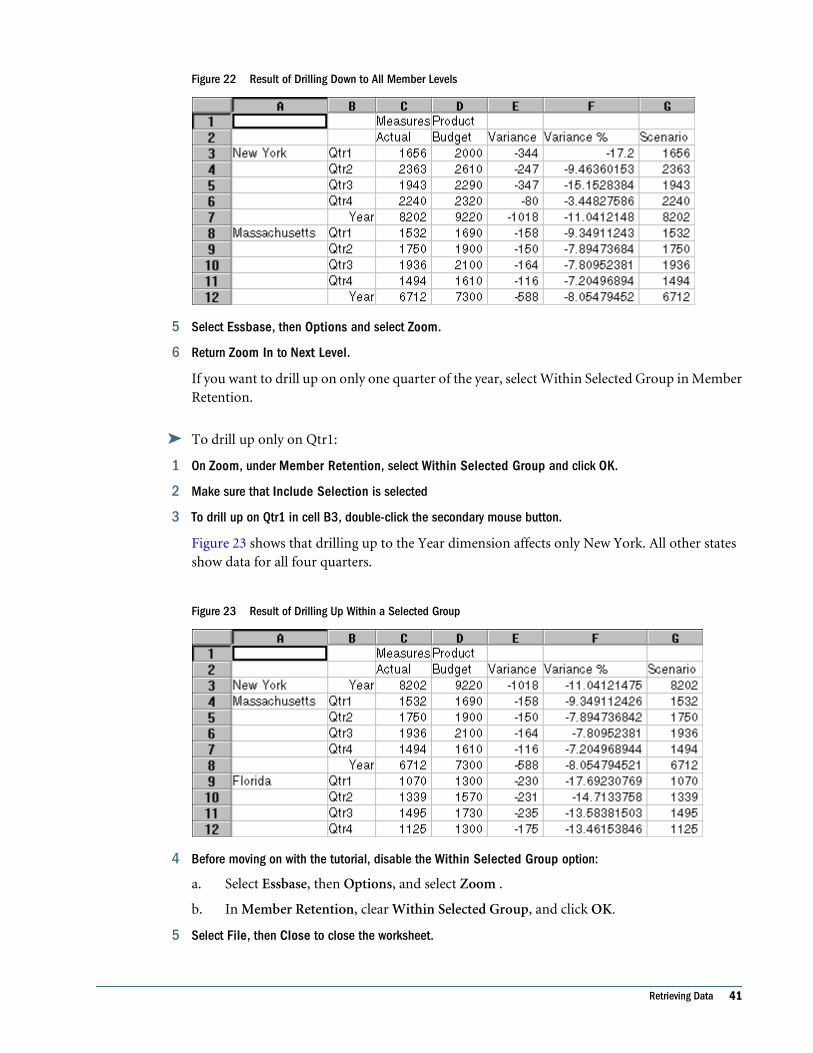
Figure 22 Result of Drilling Down to All Member Levels
5 Select Essbase, then Options and select Zoom.
6 Return Zoom In to Next Level.
If you want to drill up on only one quarter of the year, select Within Selected Group in MemberRetention.
➤ To drill up only on Qtr1:
1 On Zoom, under Member Retention, select Within Selected Group and click OK.
2 Make sure that Include Selection is selected
3 To drill up on Qtr1 in cell B3, double-click the secondary mouse button.
Figure 23 shows that drilling up to the Year dimension affects only New York. All other statesshow data for all four quarters.
Figure 23 Result of Drilling Up Within a Selected Group
4 Before moving on with the tutorial, disable the Within Selected Group option:
a. Select Essbase, then Options, and select Zoom .
b. In Member Retention, clear Within Selected Group, and click OK.
5 Select File, then Close to close the worksheet.
Retrieving Data 41
You do not need to save the worksheet.
Pivoting, Retaining, and Suppressing DataAfter you retrieve data into the worksheet, you may want to manipulate the data in various ways.For example, you may want to move rows and columns to different positions in the worksheet,or you may want to tell Essbase to suppress or to retain specific data during data retrievals.
To help you manipulate worksheet data, this section steps you through these procedures:
● “Pivoting Rows and Columns” on page 42
● “Retaining a Data Subset” on page 46
● “Removing a Data Subset” on page 48
● “Navigating Through the Worksheet Without Retrieving Data” on page 49
● “Suppressing Missing Values, Zero Values, and Underscore Characters” on page 53
Pivoting Rows and ColumnsWith the Pivot command, you can change the orientation of worksheet data. Use the Pivotcommand to perform any of these tasks:
● Move a row group to a column group
● Move a column group to a row group
● Change the order of row groups
● Change the order of column groups
➤ To execute the Pivot command, use one method:
● Select the member cell that you want to pivot, and select Essbase, then Pivot.
This method applies only to moving a row group to a column group or a column group toa row group.
● Click in the center of the member cell that you want to pivot, press and hold down thesecondary mouse button, and drag the group to the desired location.
This method applies to swapping row and column groups and to changing the order withingroups.
➤ To pivot Year data from a row group to a column group:
1 Select File, then New or click to open a new worksheet.
Note:
You should already be connected to the Sample Basic database. If you are not connected, followthe steps in “Connecting to a Database” on page 30.
42 Basic Tutorial
2 Select Essbase, then Retrieve.
3 Drill down (double-click) on Measures and Product (in cells B1 and C1, respectively).
4 Press and hold down the Alt key, and, in cell E1, drill down (double-click) on Scenario.
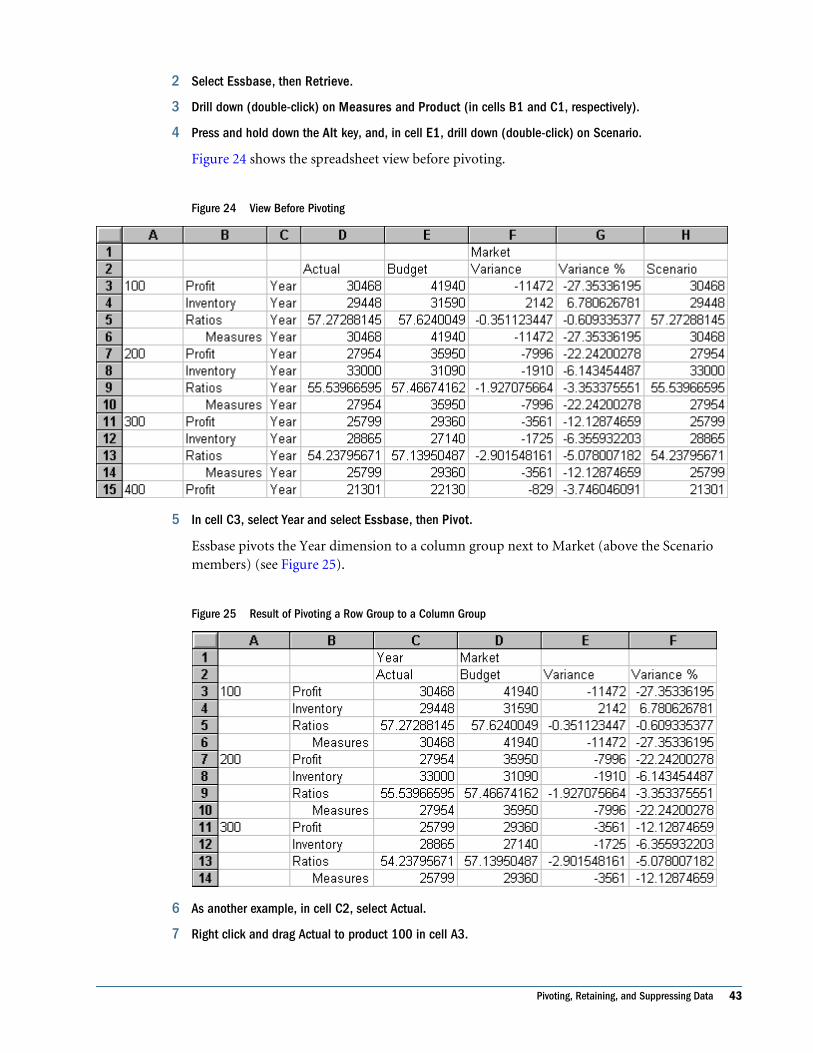
Figure 24 shows the spreadsheet view before pivoting.
Figure 24 View Before Pivoting
5 In cell C3, select Year and select Essbase, then Pivot.
Essbase pivots the Year dimension to a column group next to Market (above the Scenariomembers) (see Figure 25).
Figure 25 Result of Pivoting a Row Group to a Column Group
6 As another example, in cell C2, select Actual.
7 Right click and drag Actual to product 100 in cell A3.
Pivoting, Retaining, and Suppressing Data 43
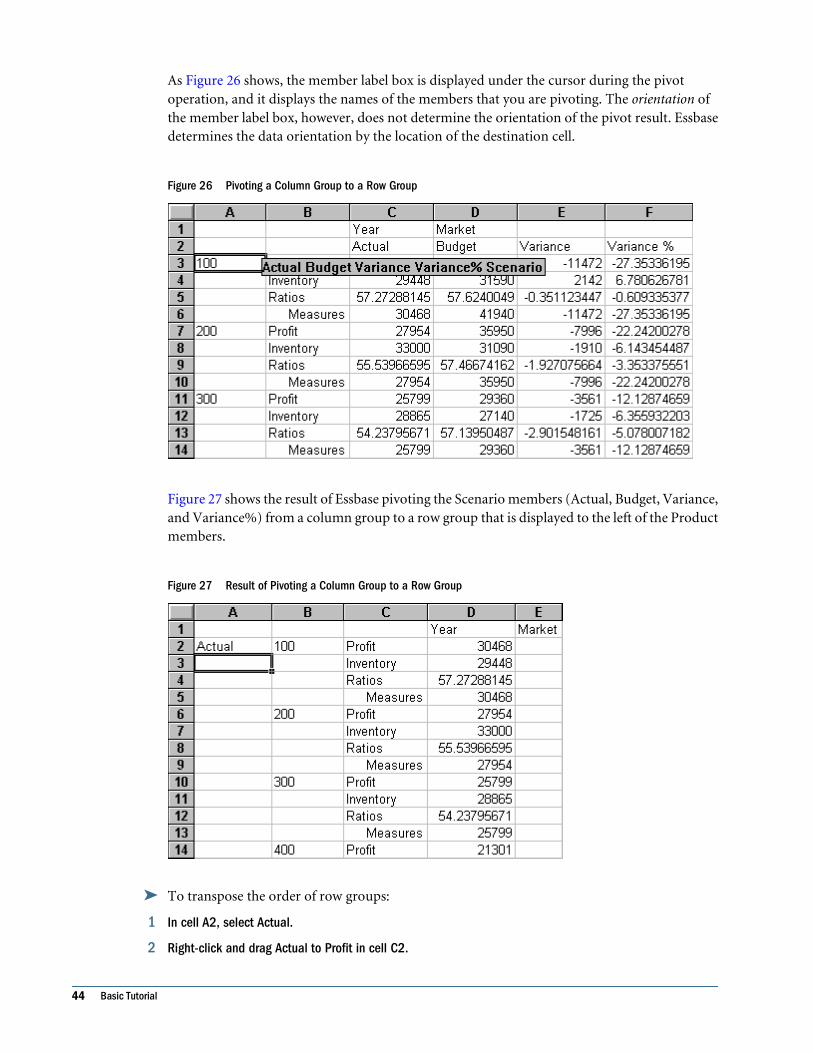
As Figure 26 shows, the member label box is displayed under the cursor during the pivotoperation, and it displays the names of the members that you are pivoting. The orientation ofthe member label box, however, does not determine the orientation of the pivot result. Essbasedetermines the data orientation by the location of the destination cell.
Figure 26 Pivoting a Column Group to a Row Group
Figure 27 shows the result of Essbase pivoting the Scenario members (Actual, Budget, Variance,and Variance%) from a column group to a row group that is displayed to the left of the Productmembers.
Figure 27 Result of Pivoting a Column Group to a Row Group
➤ To transpose the order of row groups:
1 In cell A2, select Actual.
2 Right-click and drag Actual to Profit in cell C2.
44 Basic Tutorial
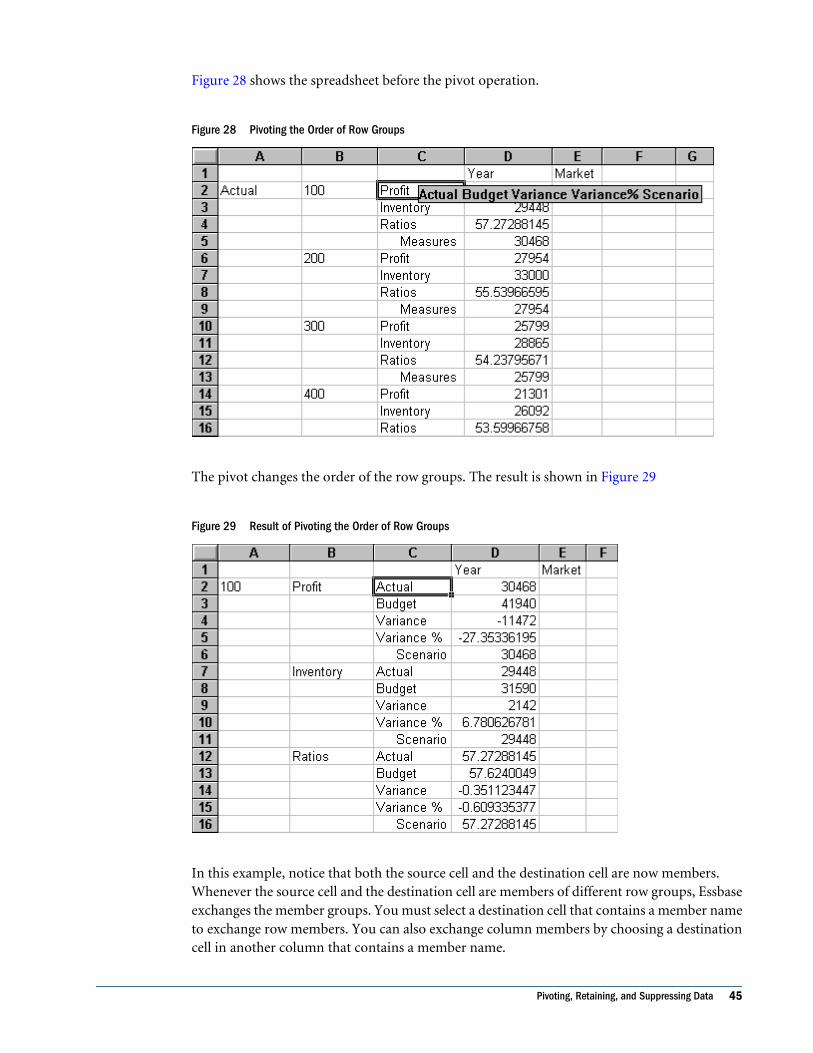
Figure 28 shows the spreadsheet before the pivot operation.
Figure 28 Pivoting the Order of Row Groups
The pivot changes the order of the row groups. The result is shown in Figure 29
Figure 29 Result of Pivoting the Order of Row Groups
In this example, notice that both the source cell and the destination cell are now members.Whenever the source cell and the destination cell are members of different row groups, Essbaseexchanges the member groups. You must select a destination cell that contains a member nameto exchange row members. You can also exchange column members by choosing a destinationcell in another column that contains a member name.
Pivoting, Retaining, and Suppressing Data 45
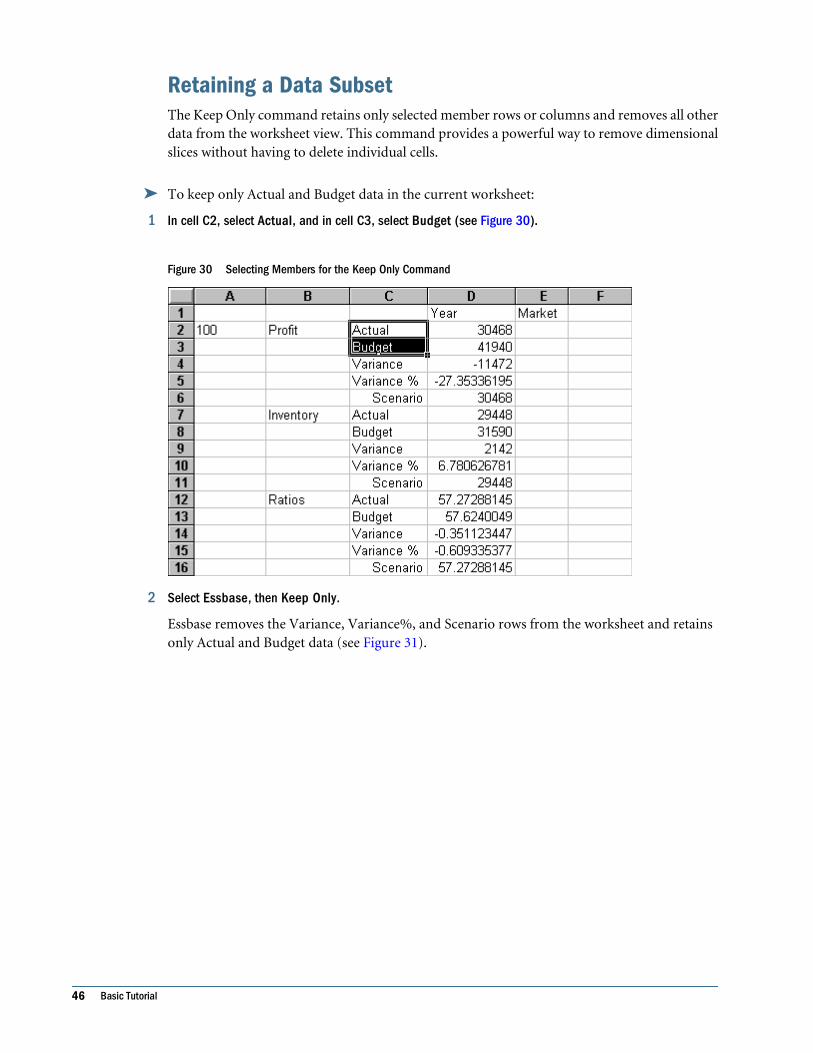
Retaining a Data SubsetThe Keep Only command retains only selected member rows or columns and removes all otherdata from the worksheet view. This command provides a powerful way to remove dimensionalslices without having to delete individual cells.
➤ To keep only Actual and Budget data in the current worksheet:
1 In cell C2, select Actual, and in cell C3, select Budget (see Figure 30).
Figure 30 Selecting Members for the Keep Only Command
2 Select Essbase, then Keep Only.
Essbase removes the Variance, Variance%, and Scenario rows from the worksheet and retainsonly Actual and Budget data (see Figure 31).
46 Basic Tutorial
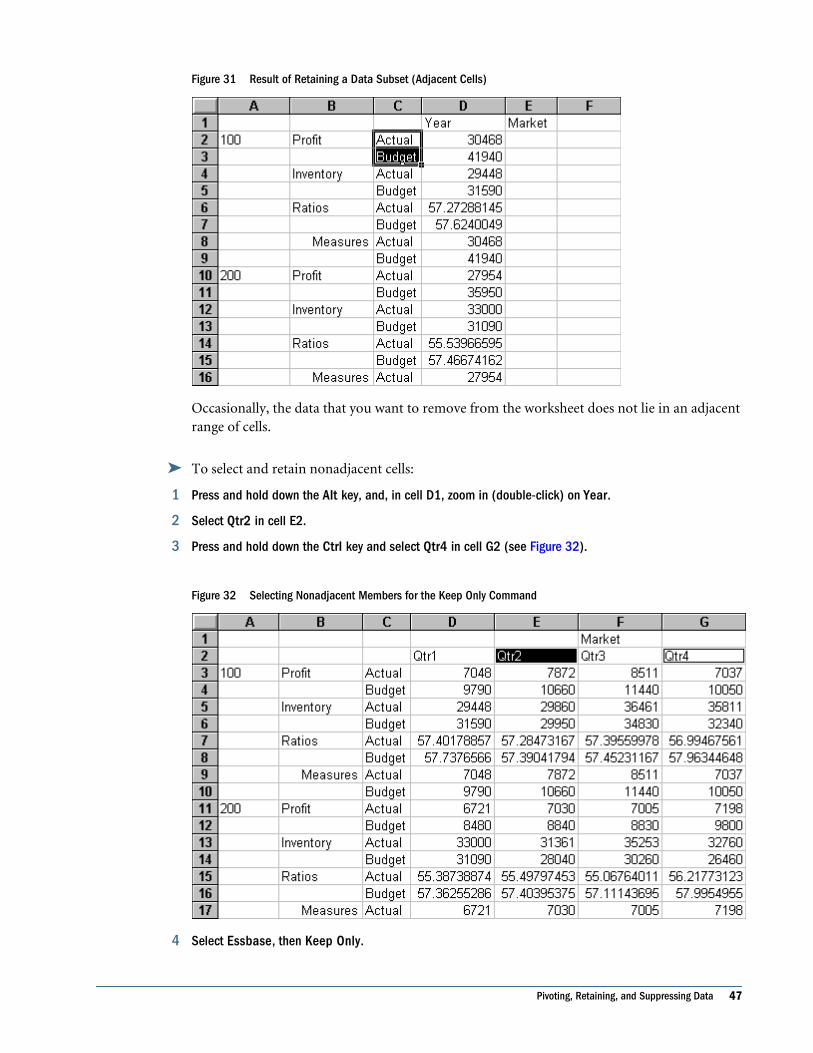
Figure 31 Result of Retaining a Data Subset (Adjacent Cells)
Occasionally, the data that you want to remove from the worksheet does not lie in an adjacentrange of cells.
➤ To select and retain nonadjacent cells:
1 Press and hold down the Alt key, and, in cell D1, zoom in (double-click) on Year.
2 Select Qtr2 in cell E2.
3 Press and hold down the Ctrl key and select Qtr4 in cell G2 (see Figure 32).
Figure 32 Selecting Nonadjacent Members for the Keep Only Command
4 Select Essbase, then Keep Only.
Pivoting, Retaining, and Suppressing Data 47
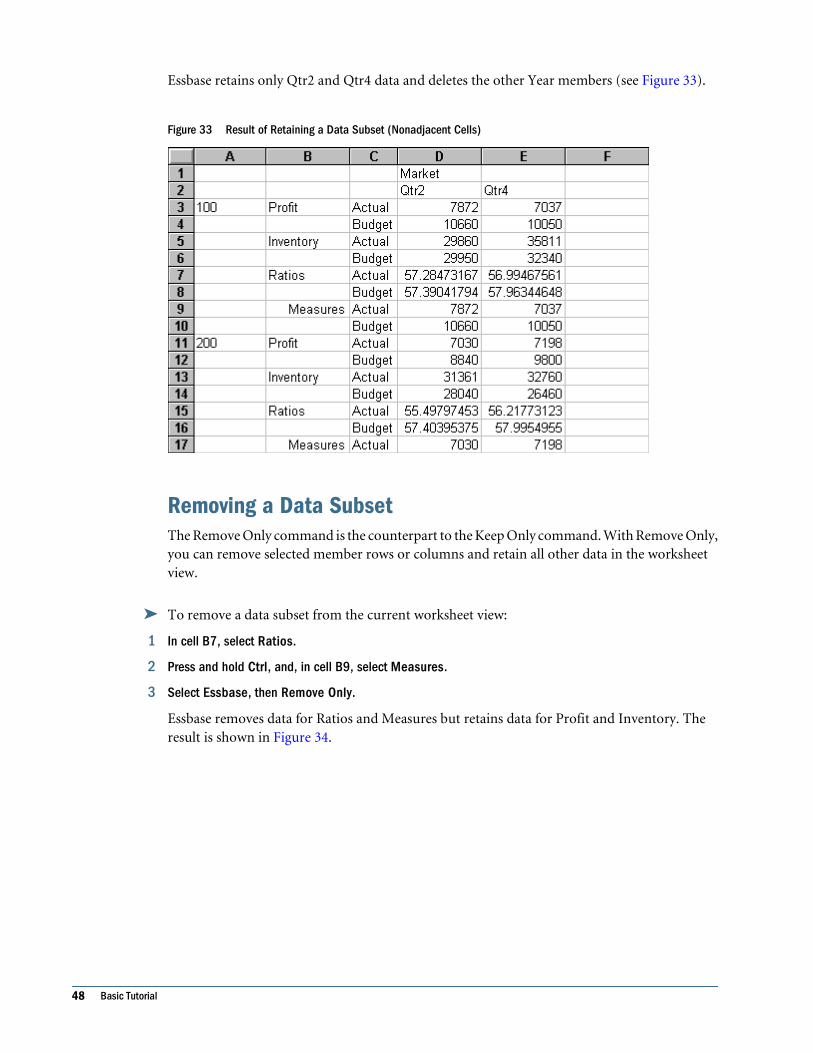
Essbase retains only Qtr2 and Qtr4 data and deletes the other Year members (see Figure 33).
Figure 33 Result of Retaining a Data Subset (Nonadjacent Cells)
Removing a Data SubsetThe Remove Only command is the counterpart to the Keep Only command. With Remove Only,you can remove selected member rows or columns and retain all other data in the worksheetview.
➤ To remove a data subset from the current worksheet view:
1 In cell B7, select Ratios.
2 Press and hold Ctrl, and, in cell B9, select Measures.
3 Select Essbase, then Remove Only.
Essbase removes data for Ratios and Measures but retains data for Profit and Inventory. Theresult is shown in Figure 34.
48 Basic Tutorial
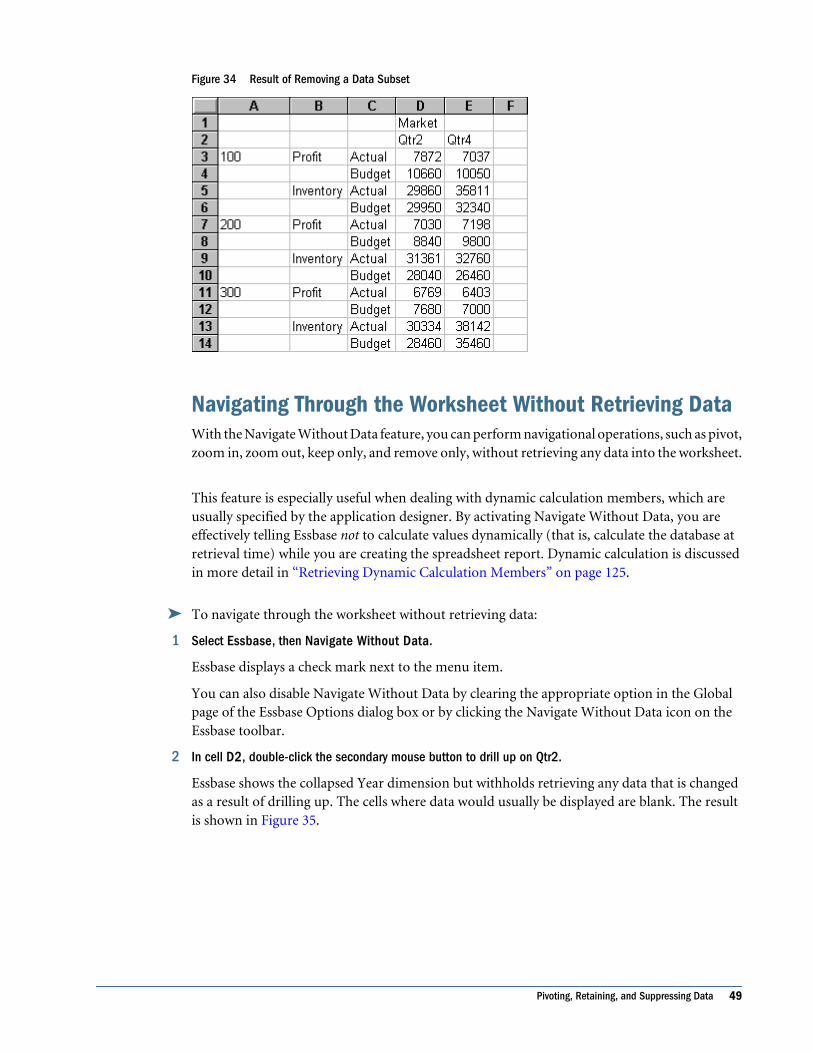
Figure 34 Result of Removing a Data Subset
Navigating Through the Worksheet Without Retrieving DataWith the Navigate Without Data feature, you can perform navigational operations, such as pivot,zoom in, zoom out, keep only, and remove only, without retrieving any data into the worksheet.
This feature is especially useful when dealing with dynamic calculation members, which areusually specified by the application designer. By activating Navigate Without Data, you areeffectively telling Essbase not to calculate values dynamically (that is, calculate the database atretrieval time) while you are creating the spreadsheet report. Dynamic calculation is discussedin more detail in “Retrieving Dynamic Calculation Members” on page 125.
➤ To navigate through the worksheet without retrieving data:
1 Select Essbase, then Navigate Without Data.
Essbase displays a check mark next to the menu item.
You can also disable Navigate Without Data by clearing the appropriate option in the Globalpage of the Essbase Options dialog box or by clicking the Navigate Without Data icon on theEssbase toolbar.
2 In cell D2, double-click the secondary mouse button to drill up on Qtr2.
Essbase shows the collapsed Year dimension but withholds retrieving any data that is changedas a result of drilling up. The cells where data would usually be displayed are blank. The resultis shown in Figure 35.
Pivoting, Retaining, and Suppressing Data 49
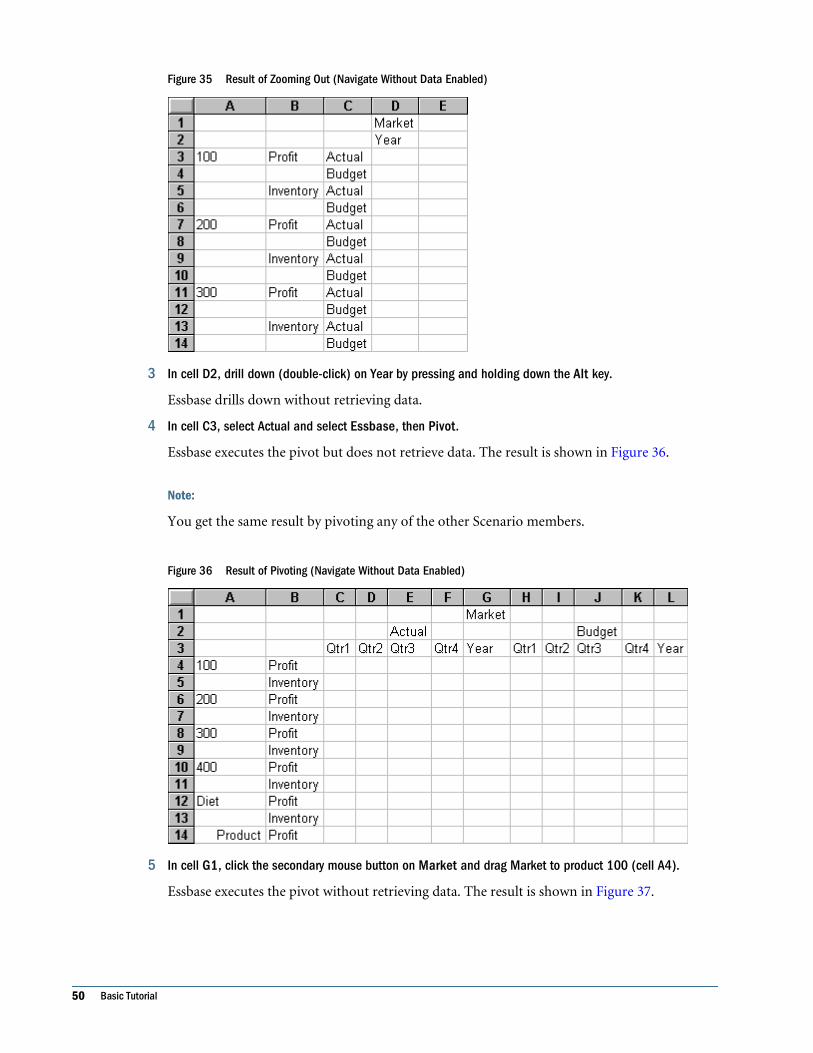
Figure 35 Result of Zooming Out (Navigate Without Data Enabled)
3 In cell D2, drill down (double-click) on Year by pressing and holding down the Alt key.
Essbase drills down without retrieving data.
4 In cell C3, select Actual and select Essbase, then Pivot.
Essbase executes the pivot but does not retrieve data. The result is shown in Figure 36.
Note:
You get the same result by pivoting any of the other Scenario members.
Figure 36 Result of Pivoting (Navigate Without Data Enabled)
5 In cell G1, click the secondary mouse button on Market and drag Market to product 100 (cell A4).
Essbase executes the pivot without retrieving data. The result is shown in Figure 37.
50 Basic Tutorial
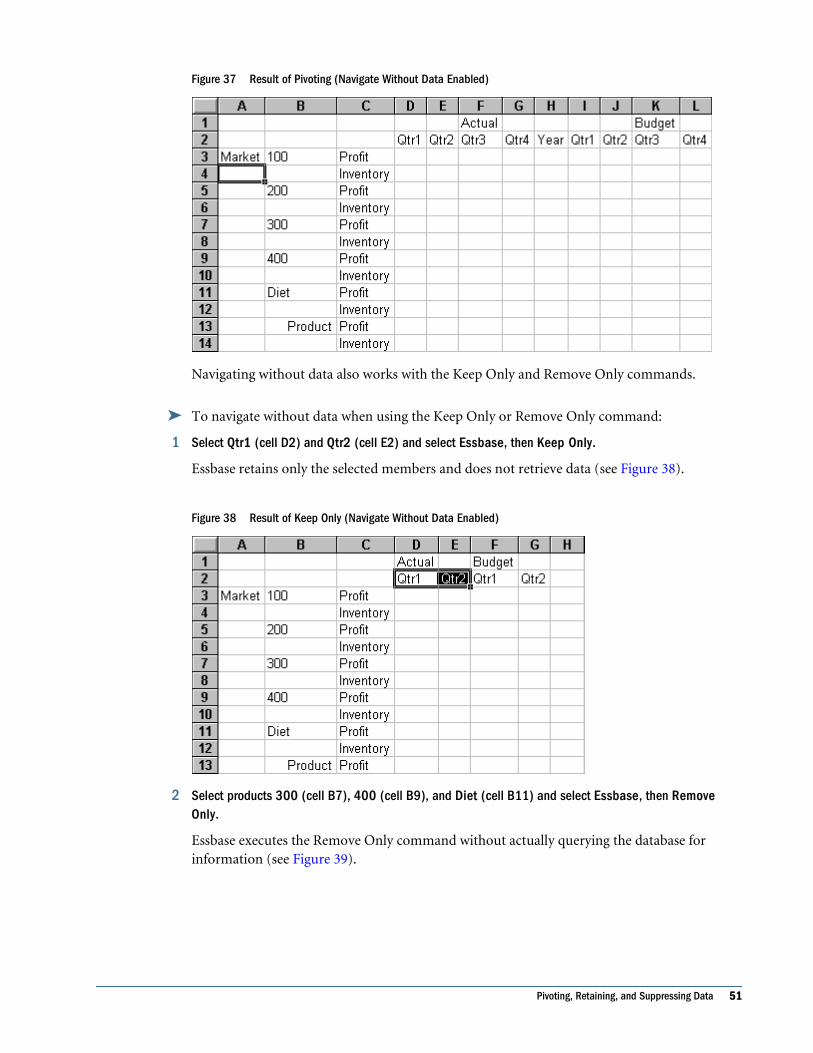
Figure 37 Result of Pivoting (Navigate Without Data Enabled)
Navigating without data also works with the Keep Only and Remove Only commands.
➤ To navigate without data when using the Keep Only or Remove Only command:
1 Select Qtr1 (cell D2) and Qtr2 (cell E2) and select Essbase, then Keep Only.
Essbase retains only the selected members and does not retrieve data (see Figure 38).
Figure 38 Result of Keep Only (Navigate Without Data Enabled)
2 Select products 300 (cell B7), 400 (cell B9), and Diet (cell B11) and select Essbase, then RemoveOnly.
Essbase executes the Remove Only command without actually querying the database forinformation (see Figure 39).
Pivoting, Retaining, and Suppressing Data 51
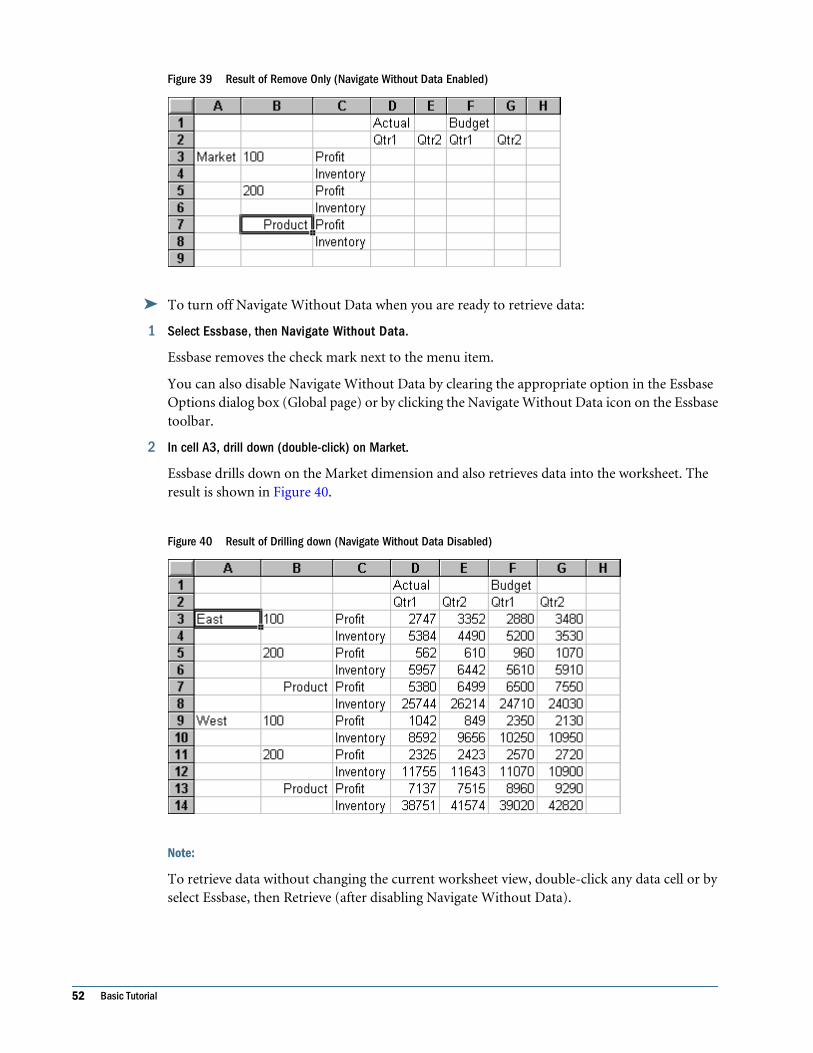
Figure 39 Result of Remove Only (Navigate Without Data Enabled)
➤ To turn off Navigate Without Data when you are ready to retrieve data:
1 Select Essbase, then Navigate Without Data.
Essbase removes the check mark next to the menu item.
You can also disable Navigate Without Data by clearing the appropriate option in the EssbaseOptions dialog box (Global page) or by clicking the Navigate Without Data icon on the Essbasetoolbar.
2 In cell A3, drill down (double-click) on Market.
Essbase drills down on the Market dimension and also retrieves data into the worksheet. Theresult is shown in Figure 40.
Figure 40 Result of Drilling down (Navigate Without Data Disabled)
Note:
To retrieve data without changing the current worksheet view, double-click any data cell or byselect Essbase, then Retrieve (after disabling Navigate Without Data).
52 Basic Tutorial
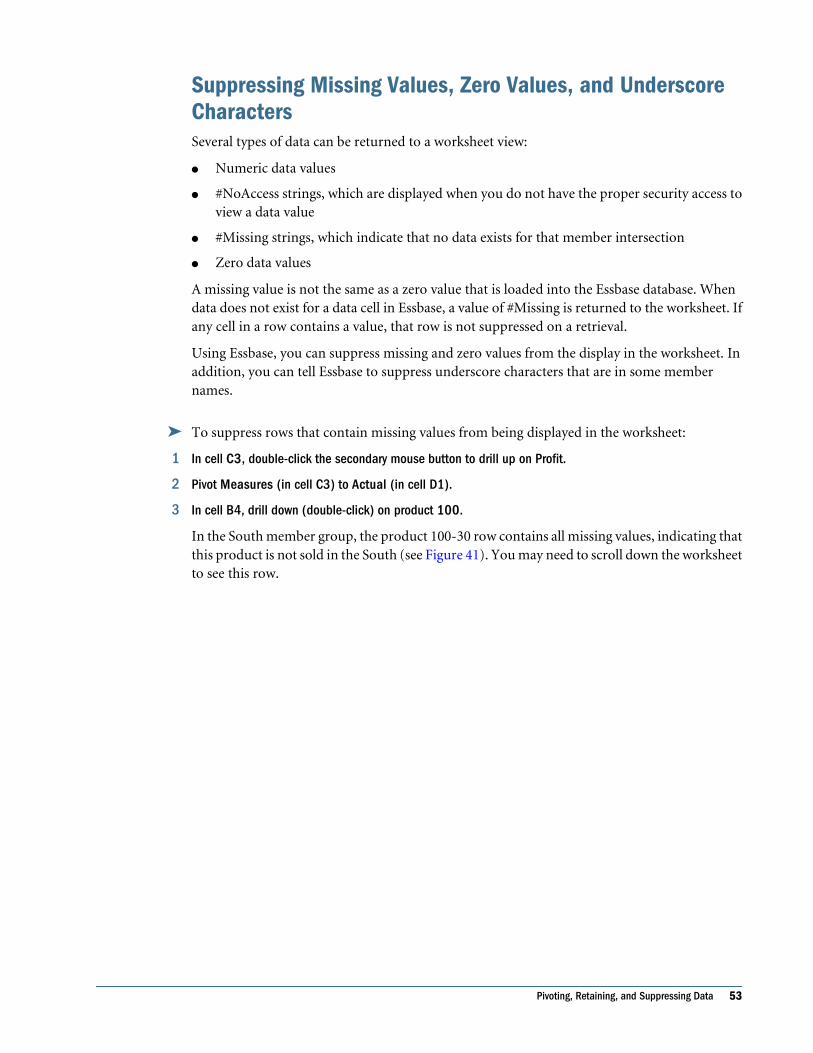
Suppressing Missing Values, Zero Values, and UnderscoreCharactersSeveral types of data can be returned to a worksheet view:
● Numeric data values
● #NoAccess strings, which are displayed when you do not have the proper security access toview a data value
● #Missing strings, which indicate that no data exists for that member intersection
● Zero data values
A missing value is not the same as a zero value that is loaded into the Essbase database. Whendata does not exist for a data cell in Essbase, a value of #Missing is returned to the worksheet. Ifany cell in a row contains a value, that row is not suppressed on a retrieval.
Using Essbase, you can suppress missing and zero values from the display in the worksheet. Inaddition, you can tell Essbase to suppress underscore characters that are in some membernames.
➤ To suppress rows that contain missing values from being displayed in the worksheet:
1 In cell C3, double-click the secondary mouse button to drill up on Profit.
2 Pivot Measures (in cell C3) to Actual (in cell D1).
3 In cell B4, drill down (double-click) on product 100.
In the South member group, the product 100-30 row contains all missing values, indicating thatthis product is not sold in the South (see Figure 41). You may need to scroll down the worksheetto see this row.
Pivoting, Retaining, and Suppressing Data 53
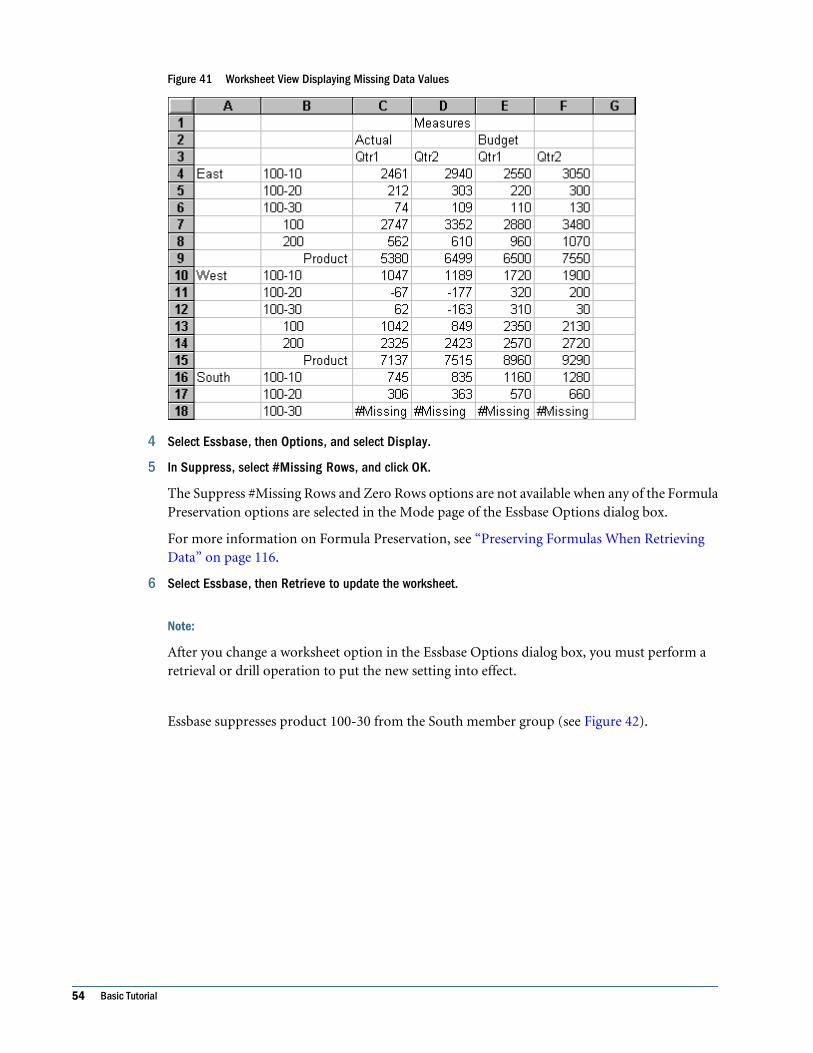
Figure 41 Worksheet View Displaying Missing Data Values
4 Select Essbase, then Options, and select Display.
5 In Suppress, select #Missing Rows, and click OK.
The Suppress #Missing Rows and Zero Rows options are not available when any of the FormulaPreservation options are selected in the Mode page of the Essbase Options dialog box.
For more information on Formula Preservation, see “Preserving Formulas When RetrievingData” on page 116.
6 Select Essbase, then Retrieve to update the worksheet.
Note:
After you change a worksheet option in the Essbase Options dialog box, you must perform aretrieval or drill operation to put the new setting into effect.
Essbase suppresses product 100-30 from the South member group (see Figure 42).
54 Basic Tutorial
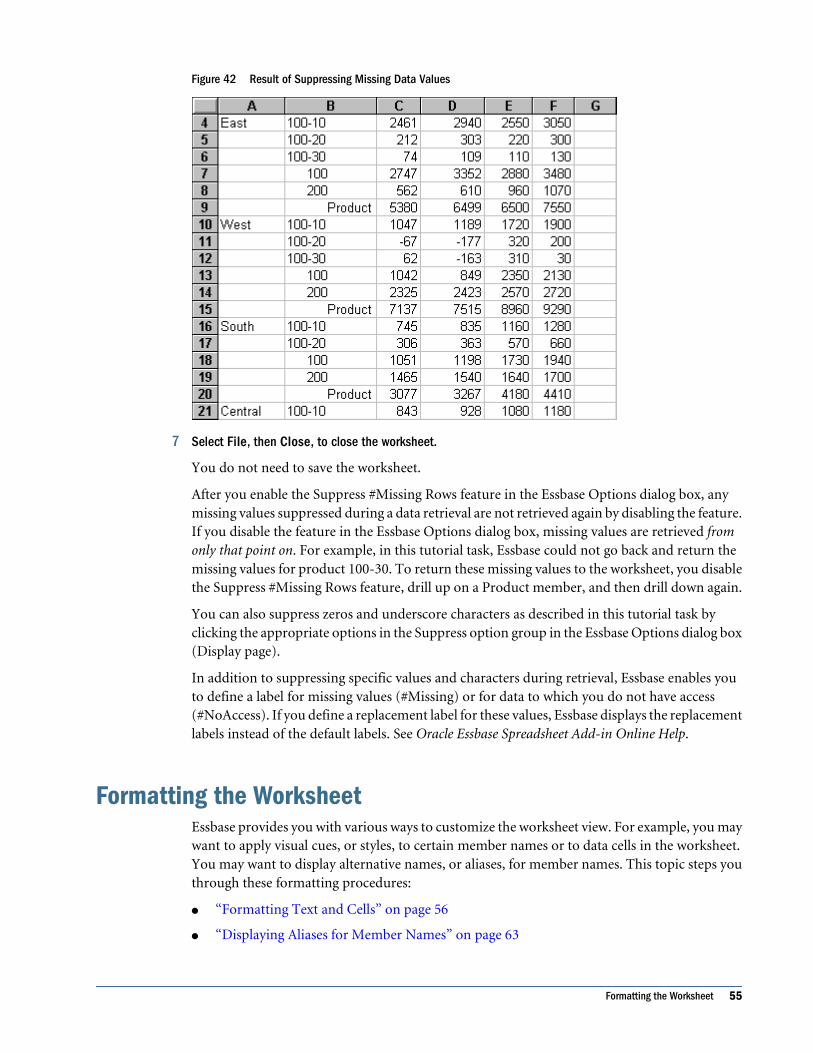
Figure 42 Result of Suppressing Missing Data Values
7 Select File, then Close, to close the worksheet.
You do not need to save the worksheet.
After you enable the Suppress #Missing Rows feature in the Essbase Options dialog box, anymissing values suppressed during a data retrieval are not retrieved again by disabling the feature.If you disable the feature in the Essbase Options dialog box, missing values are retrieved fromonly that point on. For example, in this tutorial task, Essbase could not go back and return themissing values for product 100-30. To return these missing values to the worksheet, you disablethe Suppress #Missing Rows feature, drill up on a Product member, and then drill down again.
You can also suppress zeros and underscore characters as described in this tutorial task byclicking the appropriate options in the Suppress option group in the Essbase Options dialog box(Display page).
In addition to suppressing specific values and characters during retrieval, Essbase enables youto define a label for missing values (#Missing) or for data to which you do not have access(#NoAccess). If you define a replacement label for these values, Essbase displays the replacementlabels instead of the default labels. See Oracle Essbase Spreadsheet Add-in Online Help.
Formatting the WorksheetEssbase provides you with various ways to customize the worksheet view. For example, you maywant to apply visual cues, or styles, to certain member names or to data cells in the worksheet.You may want to display alternative names, or aliases, for member names. This topic steps youthrough these formatting procedures:
● “Formatting Text and Cells” on page 56
● “Displaying Aliases for Member Names” on page 63
Formatting the Worksheet 55
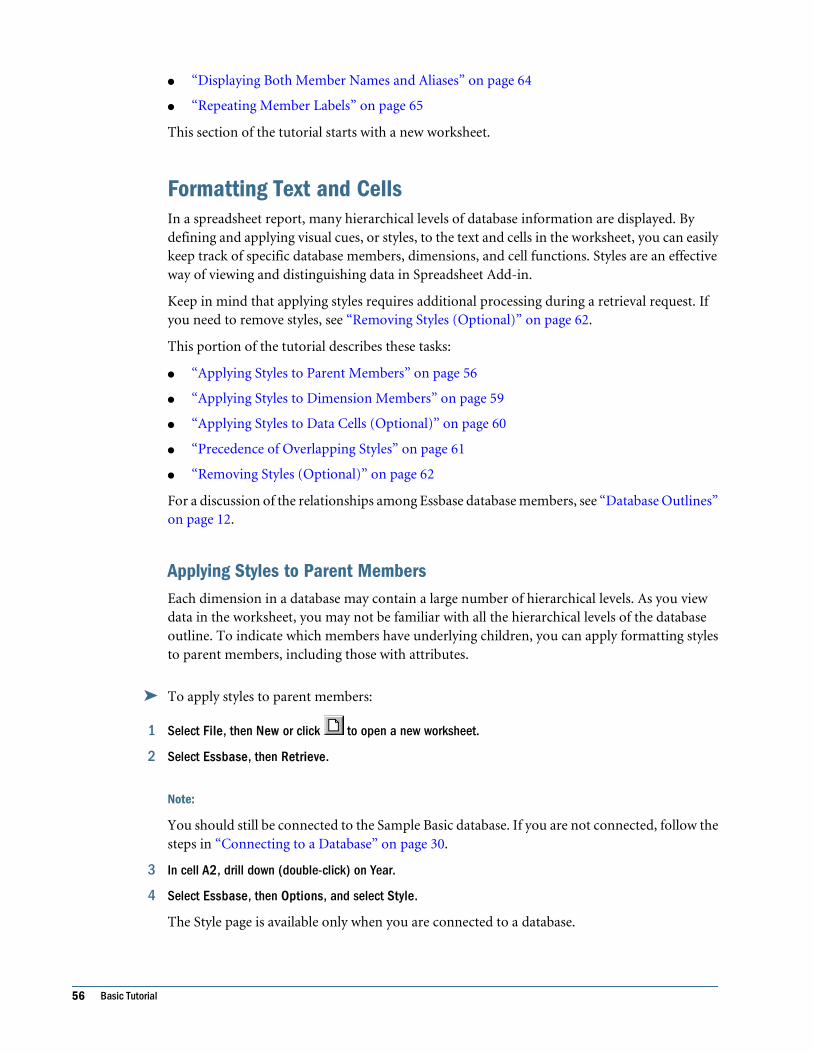
● “Displaying Both Member Names and Aliases” on page 64
● “Repeating Member Labels” on page 65
This section of the tutorial starts with a new worksheet.
Formatting Text and CellsIn a spreadsheet report, many hierarchical levels of database information are displayed. Bydefining and applying visual cues, or styles, to the text and cells in the worksheet, you can easilykeep track of specific database members, dimensions, and cell functions. Styles are an effectiveway of viewing and distinguishing data in Spreadsheet Add-in.
Keep in mind that applying styles requires additional processing during a retrieval request. Ifyou need to remove styles, see “Removing Styles (Optional)” on page 62.
This portion of the tutorial describes these tasks:
● “Applying Styles to Parent Members” on page 56
● “Applying Styles to Dimension Members” on page 59
● “Applying Styles to Data Cells (Optional)” on page 60
● “Precedence of Overlapping Styles” on page 61
● “Removing Styles (Optional)” on page 62
For a discussion of the relationships among Essbase database members, see “Database Outlines”on page 12.
Applying Styles to Parent MembersEach dimension in a database may contain a large number of hierarchical levels. As you viewdata in the worksheet, you may not be familiar with all the hierarchical levels of the databaseoutline. To indicate which members have underlying children, you can apply formatting stylesto parent members, including those with attributes.
➤ To apply styles to parent members:
1 Select File, then New or click to open a new worksheet.
2 Select Essbase, then Retrieve.
Note:
You should still be connected to the Sample Basic database. If you are not connected, follow thesteps in “Connecting to a Database” on page 30.
3 In cell A2, drill down (double-click) on Year.
4 Select Essbase, then Options, and select Style.
The Style page is available only when you are connected to a database.
56 Basic Tutorial
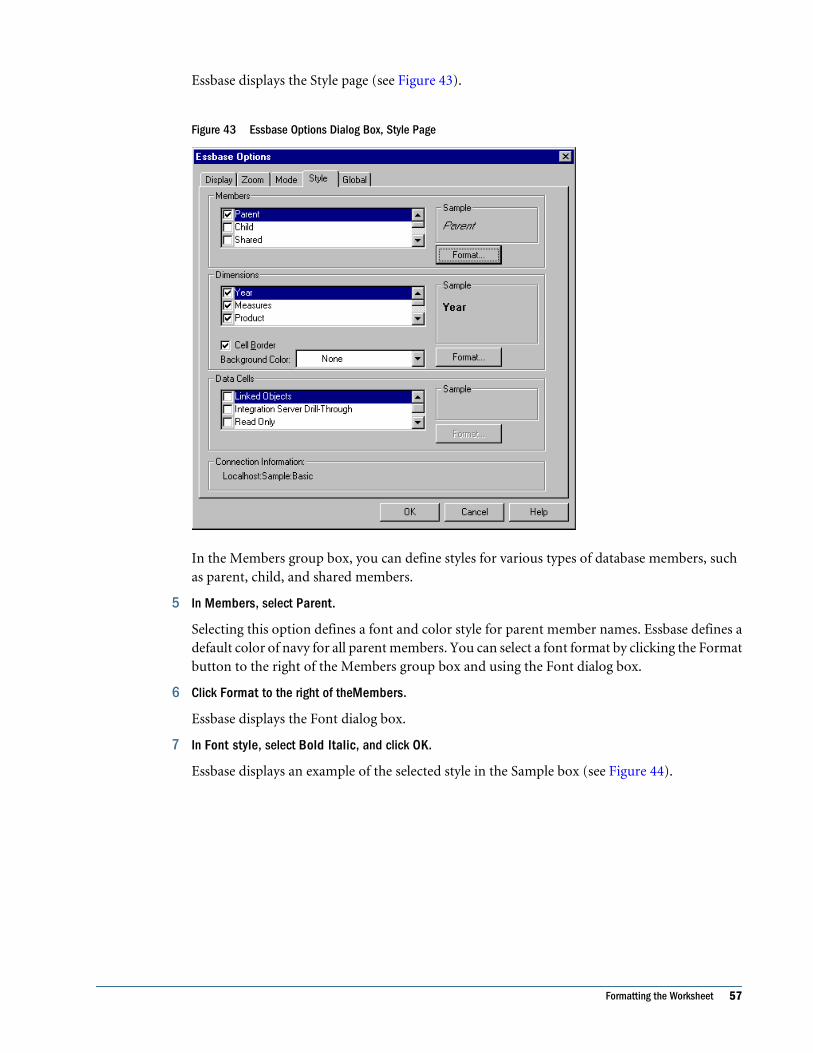
Essbase displays the Style page (see Figure 43).
Figure 43 Essbase Options Dialog Box, Style Page
In the Members group box, you can define styles for various types of database members, suchas parent, child, and shared members.
5 In Members, select Parent.
Selecting this option defines a font and color style for parent member names. Essbase defines adefault color of navy for all parent members. You can select a font format by clicking the Formatbutton to the right of the Members group box and using the Font dialog box.
6 Click Format to the right of theMembers.
Essbase displays the Font dialog box.
7 In Font style, select Bold Italic, and click OK.
Essbase displays an example of the selected style in the Sample box (see Figure 44).
Formatting the Worksheet 57
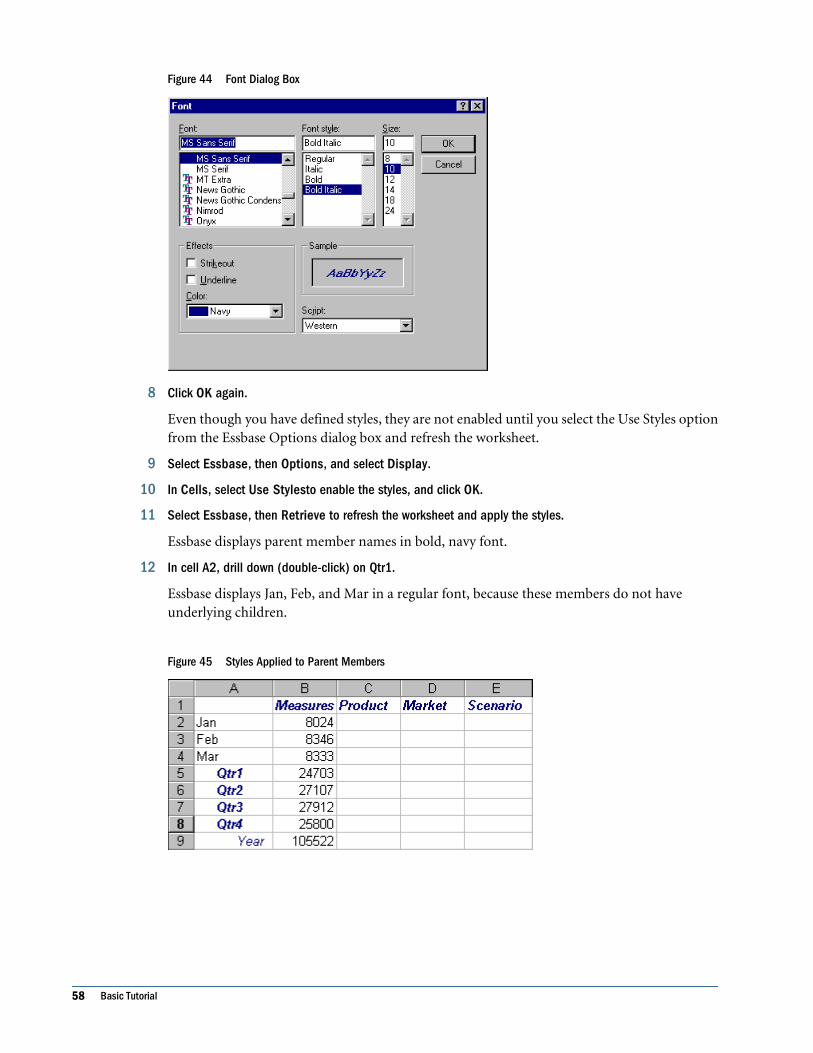
Figure 44 Font Dialog Box
8 Click OK again.
Even though you have defined styles, they are not enabled until you select the Use Styles optionfrom the Essbase Options dialog box and refresh the worksheet.
9 Select Essbase, then Options, and select Display.
10 In Cells, select Use Stylesto enable the styles, and click OK.
11 Select Essbase, then Retrieve to refresh the worksheet and apply the styles.
Essbase displays parent member names in bold, navy font.
12 In cell A2, drill down (double-click) on Qtr1.
Essbase displays Jan, Feb, and Mar in a regular font, because these members do not haveunderlying children.
Figure 45 Styles Applied to Parent Members
58 Basic Tutorial
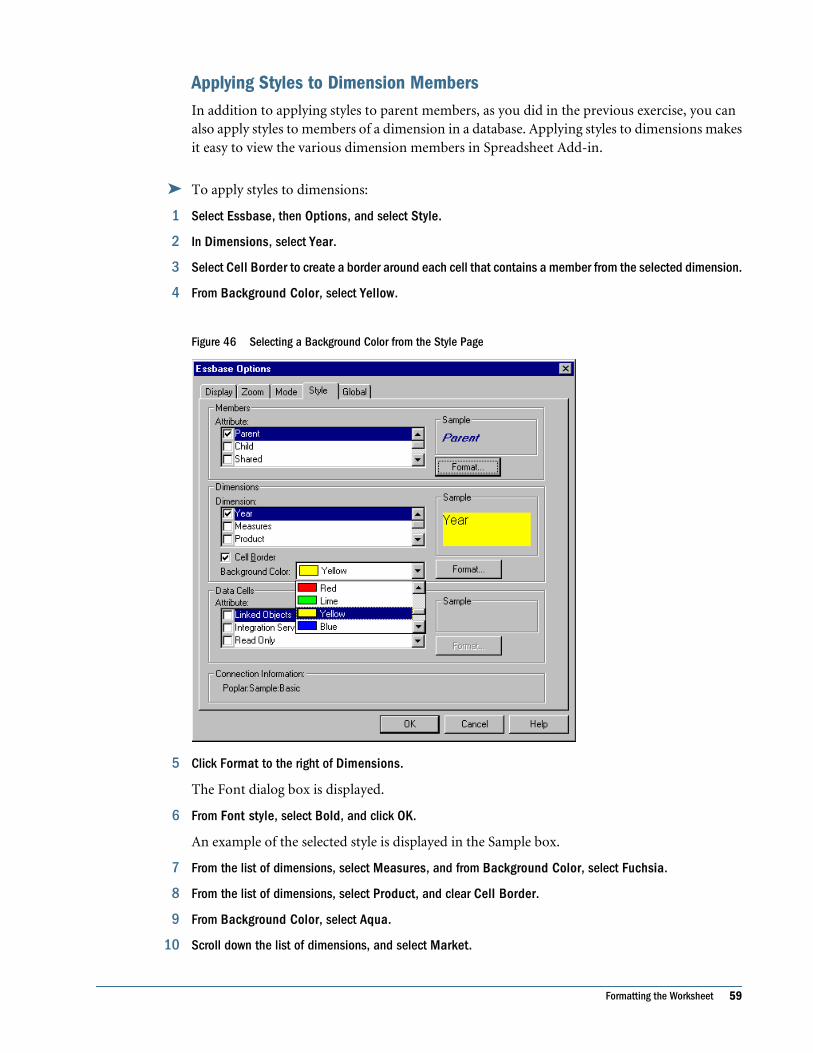
Applying Styles to Dimension MembersIn addition to applying styles to parent members, as you did in the previous exercise, you canalso apply styles to members of a dimension in a database. Applying styles to dimensions makesit easy to view the various dimension members in Spreadsheet Add-in.
➤ To apply styles to dimensions:
1 Select Essbase, then Options, and select Style.
2 In Dimensions, select Year.
3 Select Cell Border to create a border around each cell that contains a member from the selected dimension.
4 From Background Color, select Yellow.
Figure 46 Selecting a Background Color from the Style Page
5 Click Format to the right of Dimensions.
The Font dialog box is displayed.
6 From Font style, select Bold, and click OK.
An example of the selected style is displayed in the Sample box.
7 From the list of dimensions, select Measures, and from Background Color, select Fuchsia.
8 From the list of dimensions, select Product, and clear Cell Border.
9 From Background Color, select Aqua.
10 Scroll down the list of dimensions, and select Market.
Formatting the Worksheet 59
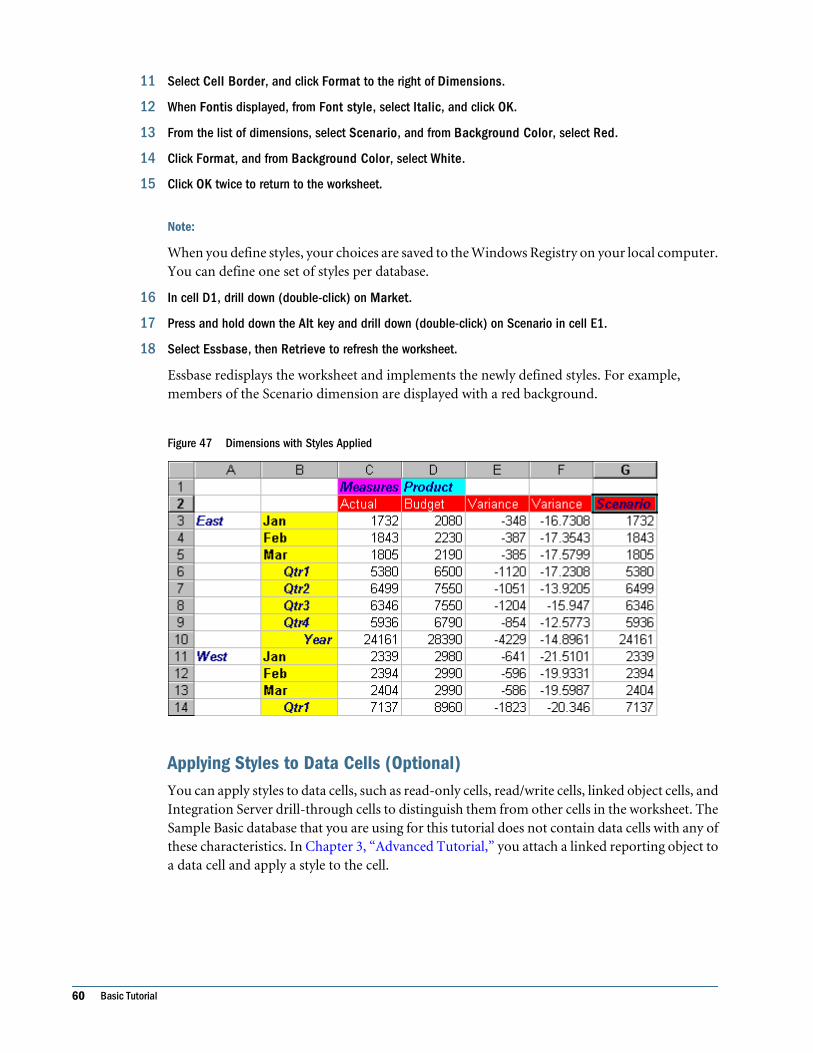
11 Select Cell Border, and click Format to the right of Dimensions.
12 When Fontis displayed, from Font style, select Italic, and click OK.
13 From the list of dimensions, select Scenario, and from Background Color, select Red.
14 Click Format, and from Background Color, select White.
15 Click OK twice to return to the worksheet.
Note:
When you define styles, your choices are saved to the Windows Registry on your local computer.You can define one set of styles per database.
16 In cell D1, drill down (double-click) on Market.
17 Press and hold down the Alt key and drill down (double-click) on Scenario in cell E1.
18 Select Essbase, then Retrieve to refresh the worksheet.
Essbase redisplays the worksheet and implements the newly defined styles. For example,members of the Scenario dimension are displayed with a red background.
Figure 47 Dimensions with Styles Applied
Applying Styles to Data Cells (Optional)You can apply styles to data cells, such as read-only cells, read/write cells, linked object cells, andIntegration Server drill-through cells to distinguish them from other cells in the worksheet. TheSample Basic database that you are using for this tutorial does not contain data cells with any ofthese characteristics. In Chapter 3, “Advanced Tutorial,” you attach a linked reporting object toa data cell and apply a style to the cell.
60 Basic Tutorial
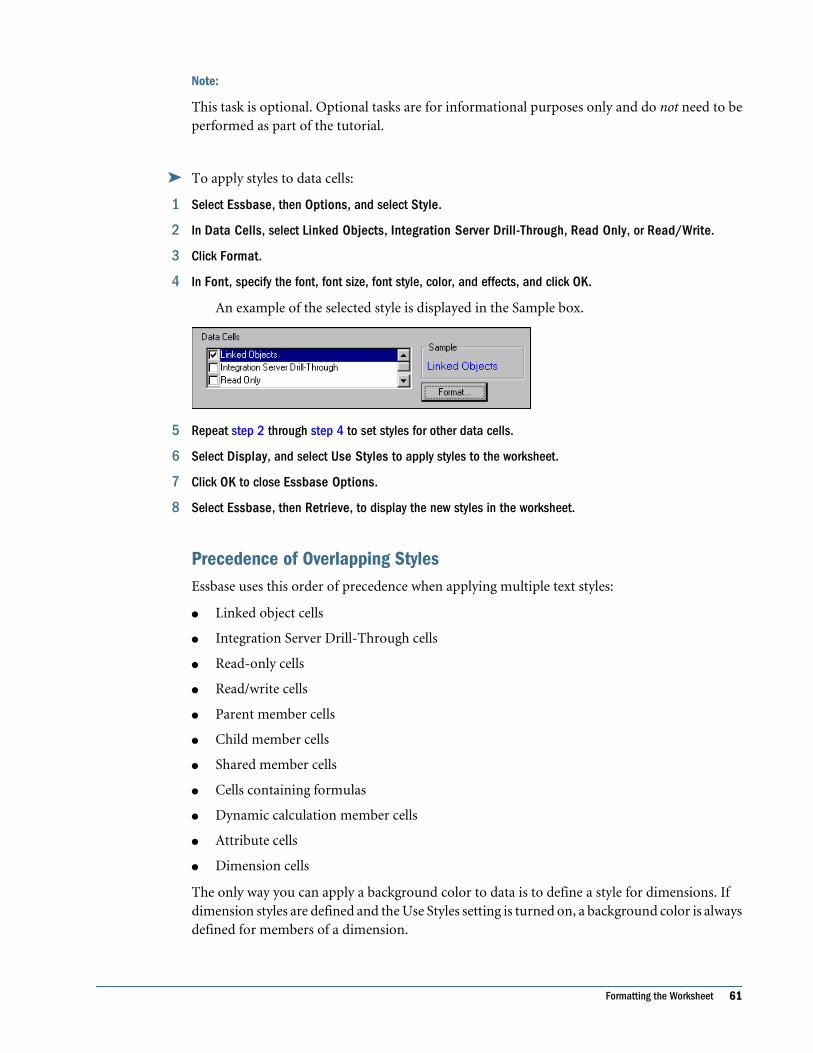
Note:
This task is optional. Optional tasks are for informational purposes only and do not need to beperformed as part of the tutorial.
➤ To apply styles to data cells:
1 Select Essbase, then Options, and select Style.
2 In Data Cells, select Linked Objects, Integration Server Drill-Through, Read Only, or Read/Write.
3 Click Format.
4 In Font, specify the font, font size, font style, color, and effects, and click OK.
An example of the selected style is displayed in the Sample box.
5 Repeat step 2 through step 4 to set styles for other data cells.
6 Select Display, and select Use Styles to apply styles to the worksheet.
7 Click OK to close Essbase Options.
8 Select Essbase, then Retrieve, to display the new styles in the worksheet.
Precedence of Overlapping StylesEssbase uses this order of precedence when applying multiple text styles:
● Linked object cells
● Integration Server Drill-Through cells
● Read-only cells
● Read/write cells
● Parent member cells
● Child member cells
● Shared member cells
● Cells containing formulas
● Dynamic calculation member cells
● Attribute cells
● Dimension cells
The only way you can apply a background color to data is to define a style for dimensions. Ifdimension styles are defined and the Use Styles setting is turned on, a background color is alwaysdefined for members of a dimension.
Formatting the Worksheet 61
The text styles that you can apply to members, dimensions, and data cells are hierarchical anddetermine which characteristics are applied. Member styles are at the top of the hierarchy. Thus,member styles are always applied if styles are turned on. Notice that in Figure 47 on page 60, theQtr1 label in cell B6 is in bold italic navy font, and has a yellow background. The navy font comesfrom the style defined for parent members, and the yellow background comes from the styledefined for Year.
If you want to see a child member style, make sure that the parent member style is turned off.If you want to see a shared member style, make sure that both parent and child member stylesare turned off.
Removing Styles (Optional)Styles can be very helpful tools for keeping track of data in Spreadsheet Add-in. Applying styles,however, involves additional processing time during a retrieval request. This additionalprocessing has a slight impact on the speed of Essbase retrievals.
If you do not want to apply styles to the worksheet view, you can clear them. You can also turnoff styles so that they are not displayed when you refresh the view (by selecting Essbase, thenRetrieve, for example). So that the worksheet matches the illustrations presented in these tasks,do not remove styles if you are going through the tutorial.
If styles are applied to the worksheet and you execute the FlashBack command, these styles aretemporarily removed from the current view. The styles are reapplied whenever you initiate aretrieval.
Note:
These tasks are optional. Optional tasks are for informational purposes only and do not need tobe performed as part of the tutorial.
➤ To remove all styles from a worksheet:
1 Select all cells in the worksheet.
2 From the Excel menu bar, select Edit, then Clear, then Formats.
➤ To turn off styles:
1 Select Essbase, then Options, and select Display.
2 In Cells, clear Use Styles, and click OK.
Note:
If you turn styles off without clearing them from the worksheet, the styles remain in the currentworksheet view when you refresh the view. The styles remain to avoid removing any styles thatyou may apply to individual cells using native worksheet formatting options.
62 Basic Tutorial
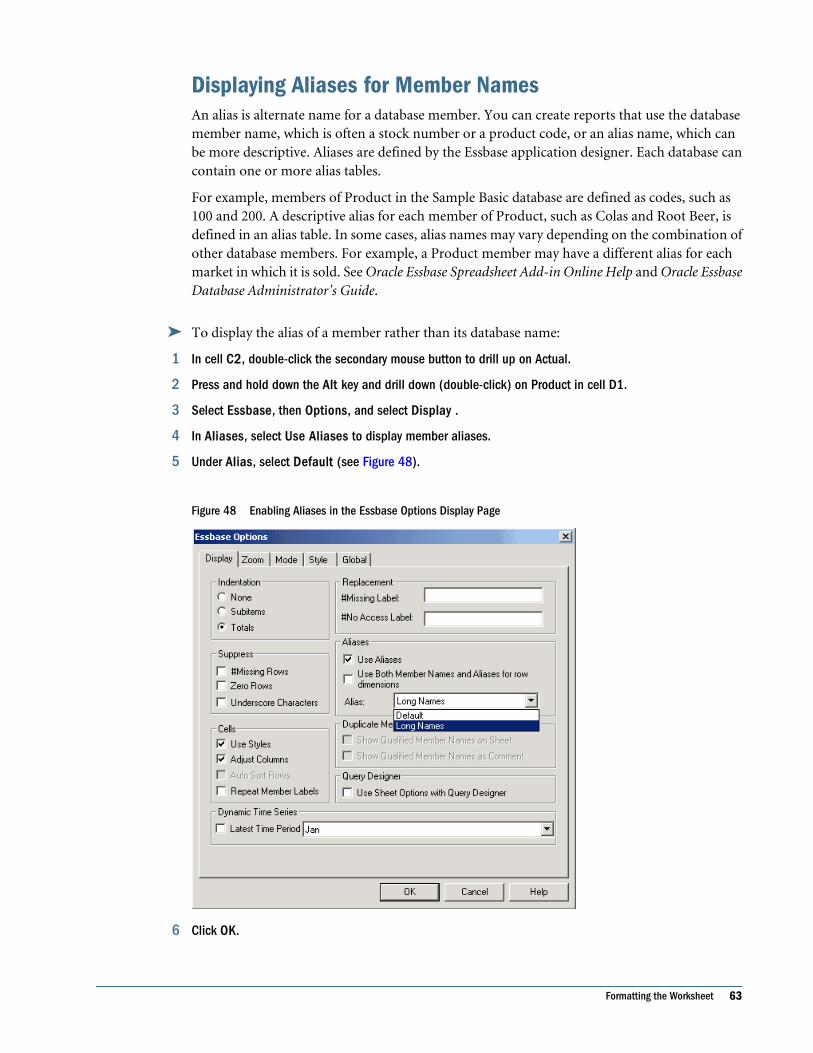
Displaying Aliases for Member NamesAn alias is alternate name for a database member. You can create reports that use the databasemember name, which is often a stock number or a product code, or an alias name, which canbe more descriptive. Aliases are defined by the Essbase application designer. Each database cancontain one or more alias tables.
For example, members of Product in the Sample Basic database are defined as codes, such as100 and 200. A descriptive alias for each member of Product, such as Colas and Root Beer, isdefined in an alias table. In some cases, alias names may vary depending on the combination ofother database members. For example, a Product member may have a different alias for eachmarket in which it is sold. See Oracle Essbase Spreadsheet Add-in Online Help and Oracle EssbaseDatabase Administrator's Guide.
➤ To display the alias of a member rather than its database name:
1 In cell C2, double-click the secondary mouse button to drill up on Actual.
2 Press and hold down the Alt key and drill down (double-click) on Product in cell D1.
3 Select Essbase, then Options, and select Display .
4 In Aliases, select Use Aliases to display member aliases.
5 Under Alias, select Default (see Figure 48).
Figure 48 Enabling Aliases in the Essbase Options Display Page
6 Click OK.
Formatting the Worksheet 63
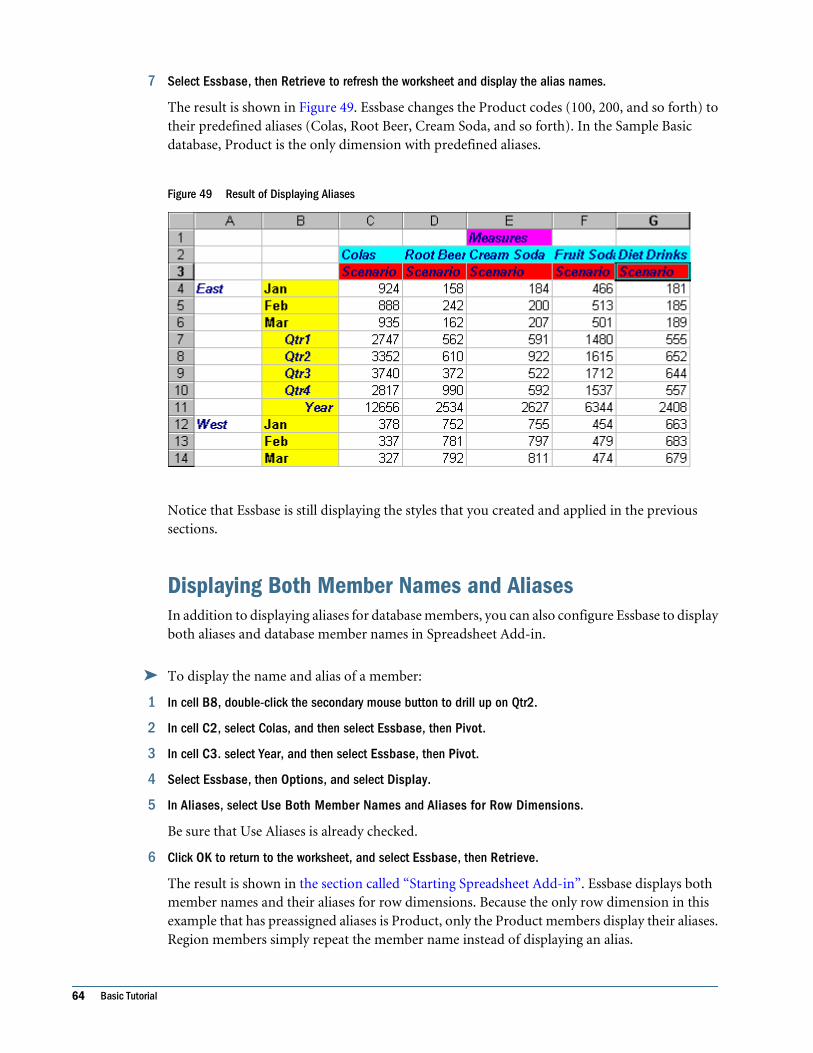
7 Select Essbase, then Retrieve to refresh the worksheet and display the alias names.
The result is shown in Figure 49. Essbase changes the Product codes (100, 200, and so forth) totheir predefined aliases (Colas, Root Beer, Cream Soda, and so forth). In the Sample Basicdatabase, Product is the only dimension with predefined aliases.
Figure 49 Result of Displaying Aliases
Notice that Essbase is still displaying the styles that you created and applied in the previoussections.
Displaying Both Member Names and AliasesIn addition to displaying aliases for database members, you can also configure Essbase to displayboth aliases and database member names in Spreadsheet Add-in.
➤ To display the name and alias of a member:
1 In cell B8, double-click the secondary mouse button to drill up on Qtr2.
2 In cell C2, select Colas, and then select Essbase, then Pivot.
3 In cell C3. select Year, and then select Essbase, then Pivot.
4 Select Essbase, then Options, and select Display.
5 In Aliases, select Use Both Member Names and Aliases for Row Dimensions.
Be sure that Use Aliases is already checked.
6 Click OK to return to the worksheet, and select Essbase, then Retrieve.
The result is shown in the section called “Starting Spreadsheet Add-in”. Essbase displays bothmember names and their aliases for row dimensions. Because the only row dimension in thisexample that has preassigned aliases is Product, only the Product members display their aliases.Region members simply repeat the member name instead of displaying an alias.
64 Basic Tutorial
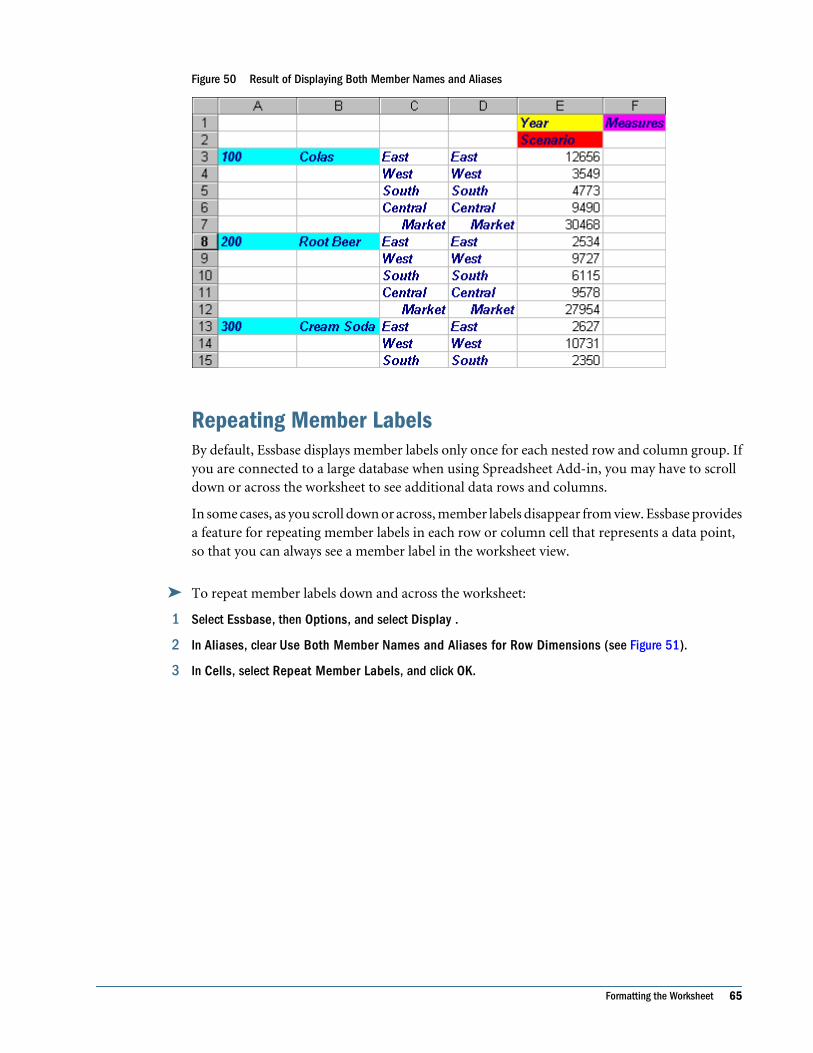
Figure 50 Result of Displaying Both Member Names and Aliases
Repeating Member LabelsBy default, Essbase displays member labels only once for each nested row and column group. Ifyou are connected to a large database when using Spreadsheet Add-in, you may have to scrolldown or across the worksheet to see additional data rows and columns.
In some cases, as you scroll down or across, member labels disappear from view. Essbase providesa feature for repeating member labels in each row or column cell that represents a data point,so that you can always see a member label in the worksheet view.
➤ To repeat member labels down and across the worksheet:
1 Select Essbase, then Options, and select Display .
2 In Aliases, clear Use Both Member Names and Aliases for Row Dimensions (see Figure 51).
3 In Cells, select Repeat Member Labels, and click OK.
Formatting the Worksheet 65
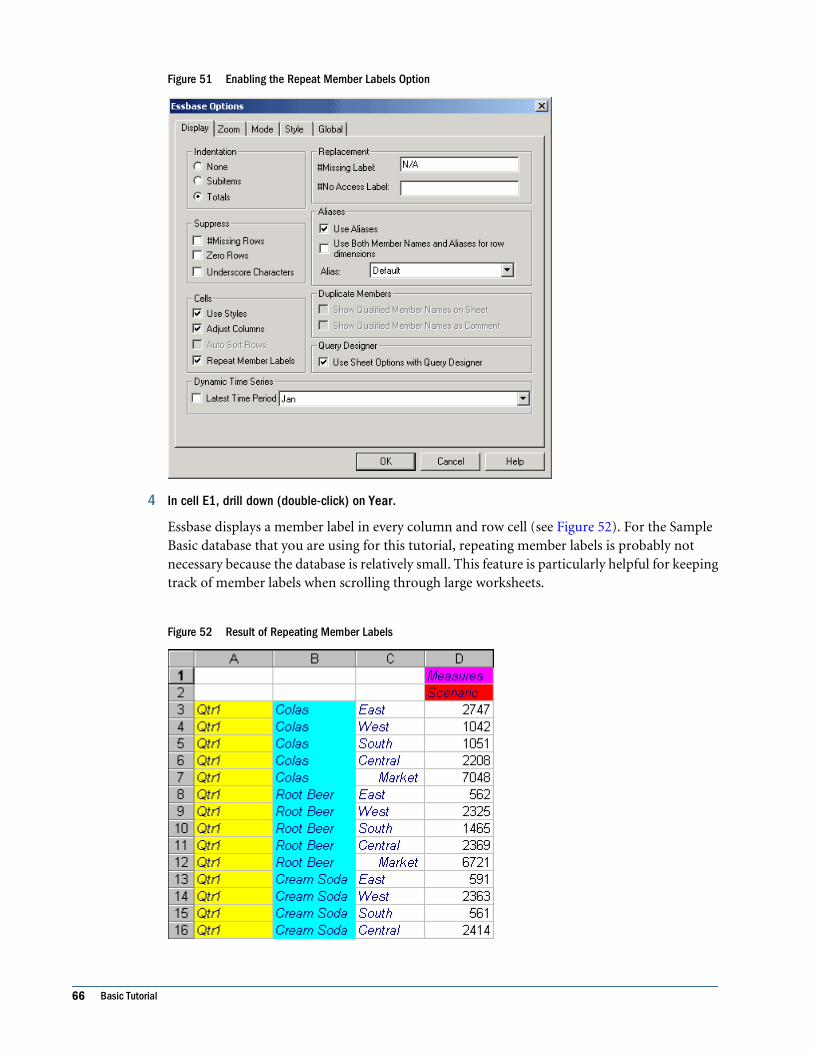
Figure 51 Enabling the Repeat Member Labels Option
4 In cell E1, drill down (double-click) on Year.
Essbase displays a member label in every column and row cell (see Figure 52). For the SampleBasic database that you are using for this tutorial, repeating member labels is probably notnecessary because the database is relatively small. This feature is particularly helpful for keepingtrack of member labels when scrolling through large worksheets.
Figure 52 Result of Repeating Member Labels
66 Basic Tutorial
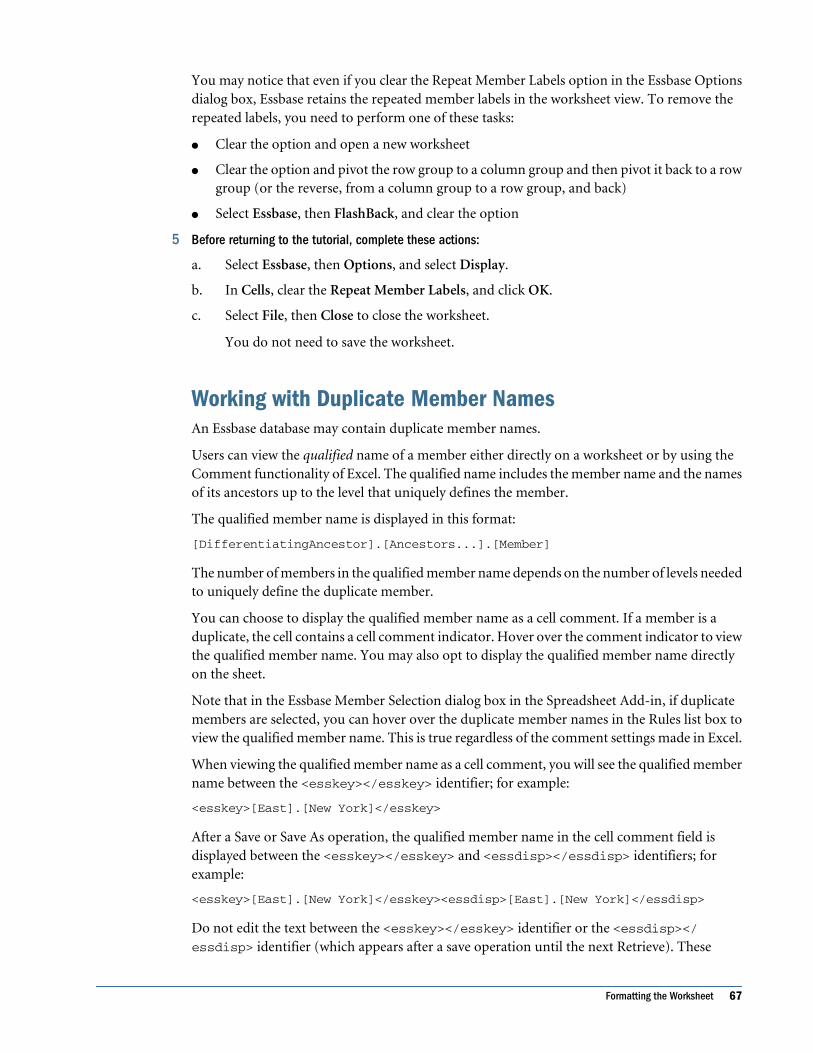
You may notice that even if you clear the Repeat Member Labels option in the Essbase Optionsdialog box, Essbase retains the repeated member labels in the worksheet view. To remove therepeated labels, you need to perform one of these tasks:
● Clear the option and open a new worksheet
● Clear the option and pivot the row group to a column group and then pivot it back to a rowgroup (or the reverse, from a column group to a row group, and back)
● Select Essbase, then FlashBack, and clear the option
5 Before returning to the tutorial, complete these actions:
a. Select Essbase, then Options, and select Display.
b. In Cells, clear the Repeat Member Labels, and click OK.
c. Select File, then Close to close the worksheet.
You do not need to save the worksheet.
Working with Duplicate Member NamesAn Essbase database may contain duplicate member names.
Users can view the qualified name of a member either directly on a worksheet or by using theComment functionality of Excel. The qualified name includes the member name and the namesof its ancestors up to the level that uniquely defines the member.
The qualified member name is displayed in this format:
[DifferentiatingAncestor].[Ancestors...].[Member]
The number of members in the qualified member name depends on the number of levels neededto uniquely define the duplicate member.
You can choose to display the qualified member name as a cell comment. If a member is aduplicate, the cell contains a cell comment indicator. Hover over the comment indicator to viewthe qualified member name. You may also opt to display the qualified member name directlyon the sheet.
Note that in the Essbase Member Selection dialog box in the Spreadsheet Add-in, if duplicatemembers are selected, you can hover over the duplicate member names in the Rules list box toview the qualified member name. This is true regardless of the comment settings made in Excel.
When viewing the qualified member name as a cell comment, you will see the qualified membername between the <esskey></esskey> identifier; for example:
<esskey>[East].[New York]</esskey>
After a Save or Save As operation, the qualified member name in the cell comment field isdisplayed between the <esskey></esskey> and <essdisp></essdisp> identifiers; forexample:
<esskey>[East].[New York]</esskey><essdisp>[East].[New York]</essdisp>
Do not edit the text between the <esskey></esskey> identifier or the <essdisp></essdisp> identifier (which appears after a save operation until the next Retrieve). These
Formatting the Worksheet 67
identifiers appear in the comment field regardless of the Qualified Member Name display settingsyou make. Changing the text between the identifiers may invalidate the worksheet.
Note that you can enter comments before or after the identifiers and that these comments areretained by Essbase with each retrieval.
An Example Scenario
For this example, the member name “Albany” appears under both the New York and Californiamembers in a Market dimension as well as in a Customer dimension. With duplicate membername support, Essbase can simply display “Albany” under New York and California in bothdimensions. Depending on the options you select, the qualified member name can be shown asan Excel comment,
For this example, only the “Show Qualified Member Names as Comments” option has beenselected in the Display page of the Essbase Options dialog box.
In the spreadsheet, using the example of the duplicate name “Albany,” if the user hovers overthe indicator for Albany, New York, in the Market dimension, the cell comment reads:
<esskey>[Market].[New York].[Albany]</esskey>
If the user hovers over the indicator for Albany, New York, in the Customer dimension, the cellcomment reads:
<esskey>[Customer].[New York].[Albany]</esskey>
Further, if the user hovers over the indicator for Albany, California, in the Customer dimension,the cell comment reads:
<esskey>[Customer].[California].[Albany]</esskey>
In a complex spreadsheet, the cell comment allows the user to easily pinpoint a membercombination.
In the above examples, if the “Show Qualified Member Names on Sheet” option is selected, forthe instances of Albany in the Customer and Market dimensions, the qualified member nameis displayed directly on the worksheet.
Note:
To show qualified member names as comments, you must enable the “Comment Indicator only”option in Excel.
➤ To display duplicate member names (optional):
1 Select Essbase, then Options.
2 In Display, select one or both of these options from Duplicate Members:
● Show Qualified Member Names on Sheet to view the qualified member name on the sheet.
● Show Qualified Member Names as Comments to view the qualified member name whenthe cursor is hovered over the comment indicator in a cell. When you use this option, ensurethat the Comment indicator only option of Excel is selected.
68 Basic Tutorial
3 Click OK to close the dialog box.
Note:
This task is optional. Optional tasks are for informational purposes only and do not need to beperformed as part of the tutorial.
Creating Queries Using Query DesignerSo far, you have discovered how to retrieve data and navigate through Spreadsheet Add-in inan ad hoc fashion. Essbase also provides a query designer so that you can define a database queryfor retrieving dimensions and database members into the worksheet.
Before Essbase actually retrieves data, Query Designer provides a series of panels so that you canrequest the data that you want to view in the worksheet. It is particularly helpful when you knowexactly which data you want to retrieve from the server. In addition, you can save a query anduse it again.
The Query Designer window consists of these panels:
● The navigation panel at the left of the window provides access to the various features inQuery Designer. You can display all the dimensions used in a particular query and accessthe various properties of each dimension member.
● The hint panel at the top right of the window provides a brief description of the feature thatis selected from the navigation panel.
● The properties panel at the bottom right of the window provides access to these functions:
❍ Layout—Design the layout of the spreadsheet report. To change the default layout, selecta dimension tile and drag it to one of the other dimension boxes. To access the memberselect panel and to define a member for a query, double-click a dimension tile.
❍ Member Select—Select members that you want to display in the rows of the spreadsheetreport. To select a member, right-click the member, and select Add to Selection Rules.You can also double-click a member to add it to the selection rules.
❍ Member Filter—Filter the member selection by attribute, generation name, level name,pattern string, or UDA.
❍ Data Filter—Retrieve rows of data. The retrieval is based on the ranking of the rowswithin certain columns. Use this panel to access the data restriction panel.
❍ Data Restriction—Filter data by comparing it to a fixed data value (including a negativevalue), a set of data values, or #Missing data values.
❍ Data Sort Sort rows in ascending or descending order. The sort is based on column datavalues.
❍ Messages and Confirmation—Turn on and turn off certain messages from QueryDesigner.
❍ Help—Access documentation about Query Designer.
Creating Queries Using Query Designer 69
See “About Creating and Changing Queries” on page 70 for an overview of Query Designer.The portions of the tutorial that follow step you through these query design procedures:
● “Creating Queries” on page 71
● “Saving Queries” on page 76
● “Applying Queries” on page 78
● “Deleting Queries” on page 79
● “Viewing Messages and Confirmations” on page 79
● “Accessing Help” on page 80
Note:
Excel query functionality is not supported in Spreadsheet Add-in. Use the Query Designerto define database queries.
About Creating and Changing QueriesTo access any of the Query Designer panels, select the appropriate feature listed in the navigationpanel.
As you create a query or make changes to an existing query, the changes are reflected in thenavigation panel. To view a dimension or a member of an open query, click on the specificdimension or member in the query outline that is displayed in the navigation panel. Selectedmembers are displayed in the member selection panel on the right.
You can also revise an existing query in the member selection panel. For example, you can deletea member or add a member to the query by selecting a member in the navigation panel andmaking the appropriate changes in the properties panel.
Note:
Files created using the obsolete Retrieval Wizard feature can be opened in Query Designer. If,however, a query contains more than two member filters per selection rule or more than twodata restrictions, the member filters may be out of order. To ensure correct results, rearrangethe member filters in the navigation panel, if necessary.
For complete information on Query Designer options, see Oracle Essbase Spreadsheet Add-inOnline Help.
Caution!
Manipulation of worksheets in VBA such as naming worksheets or moving worksheets may notwork when Query Designer is running.
70 Basic Tutorial
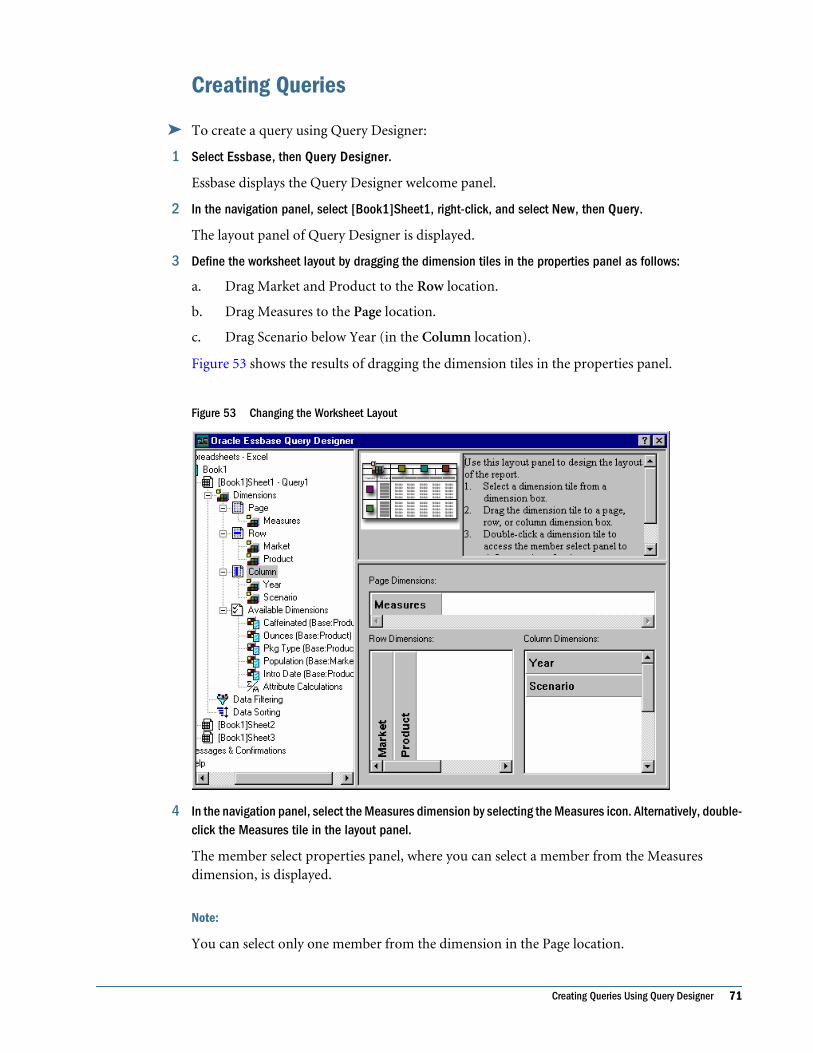
Creating Queries
➤ To create a query using Query Designer:
1 Select Essbase, then Query Designer.
Essbase displays the Query Designer welcome panel.
2 In the navigation panel, select [Book1]Sheet1, right-click, and select New, then Query.
The layout panel of Query Designer is displayed.
3 Define the worksheet layout by dragging the dimension tiles in the properties panel as follows:
a. Drag Market and Product to the Row location.
b. Drag Measures to the Page location.
c. Drag Scenario below Year (in the Column location).
Figure 53 shows the results of dragging the dimension tiles in the properties panel.
Figure 53 Changing the Worksheet Layout
4 In the navigation panel, select the Measures dimension by selecting the Measures icon. Alternatively, double-click the Measures tile in the layout panel.
The member select properties panel, where you can select a member from the Measuresdimension, is displayed.
Note:
You can select only one member from the dimension in the Page location.
Creating Queries Using Query Designer 71
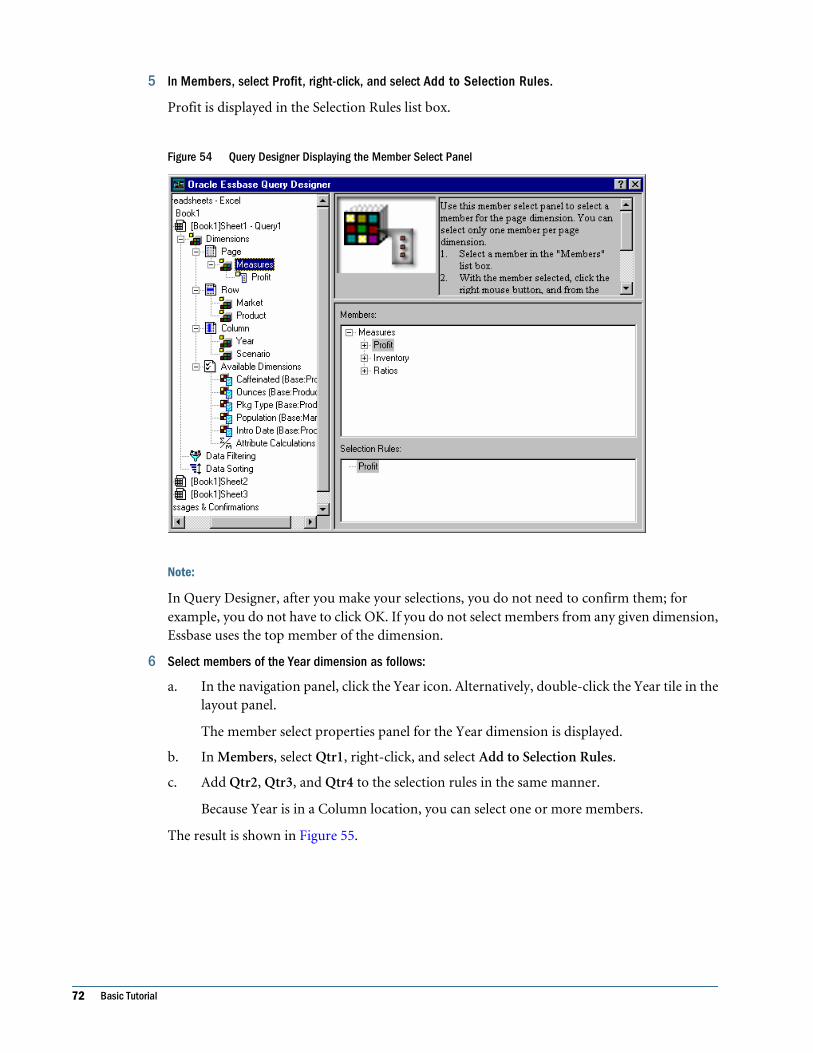
5 In Members, select Profit, right-click, and select Add to Selection Rules.
Profit is displayed in the Selection Rules list box.
Figure 54 Query Designer Displaying the Member Select Panel
Note:
In Query Designer, after you make your selections, you do not need to confirm them; forexample, you do not have to click OK. If you do not select members from any given dimension,Essbase uses the top member of the dimension.
6 Select members of the Year dimension as follows:
a. In the navigation panel, click the Year icon. Alternatively, double-click the Year tile in thelayout panel.
The member select properties panel for the Year dimension is displayed.
b. In Members, select Qtr1, right-click, and select Add to Selection Rules.
c. Add Qtr2, Qtr3, and Qtr4 to the selection rules in the same manner.
Because Year is in a Column location, you can select one or more members.
The result is shown in Figure 55.
72 Basic Tutorial
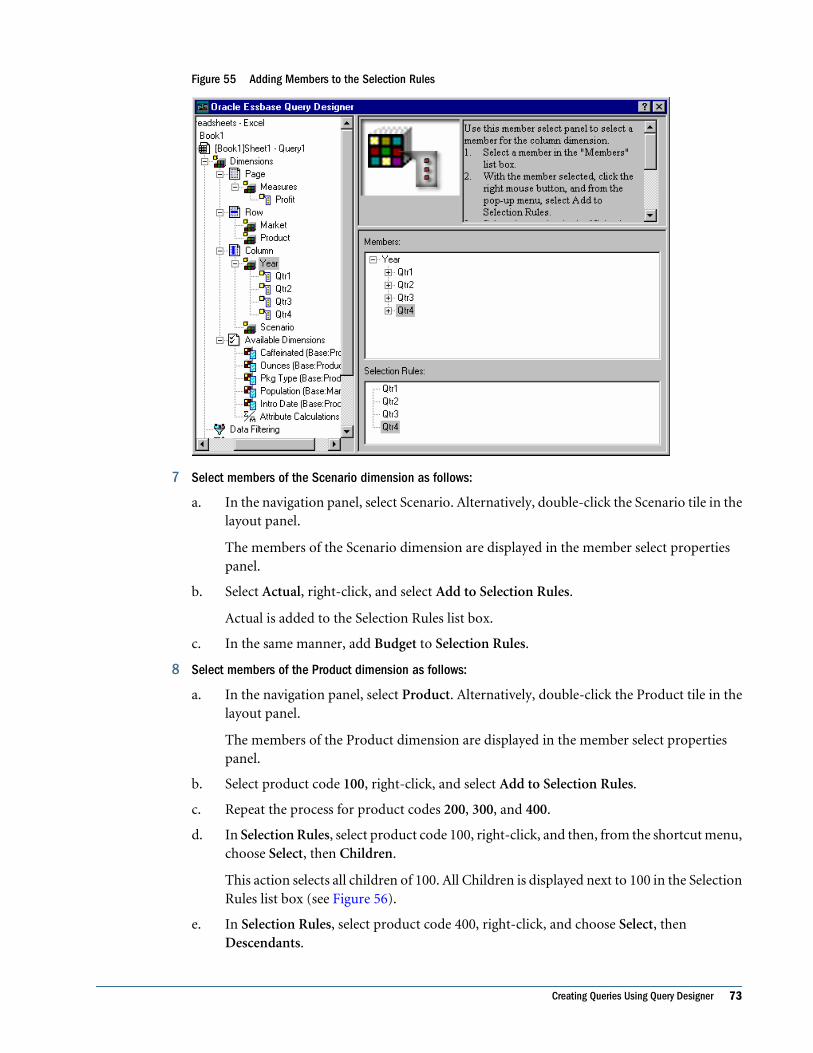
Figure 55 Adding Members to the Selection Rules
7 Select members of the Scenario dimension as follows:
a. In the navigation panel, select Scenario. Alternatively, double-click the Scenario tile in thelayout panel.
The members of the Scenario dimension are displayed in the member select propertiespanel.
b. Select Actual, right-click, and select Add to Selection Rules.
Actual is added to the Selection Rules list box.
c. In the same manner, add Budget to Selection Rules.
8 Select members of the Product dimension as follows:
a. In the navigation panel, select Product. Alternatively, double-click the Product tile in thelayout panel.
The members of the Product dimension are displayed in the member select propertiespanel.
b. Select product code 100, right-click, and select Add to Selection Rules.
c. Repeat the process for product codes 200, 300, and 400.
d. In Selection Rules, select product code 100, right-click, and then, from the shortcut menu,choose Select, then Children.
This action selects all children of 100. All Children is displayed next to 100 in the SelectionRules list box (see Figure 56).
e. In Selection Rules, select product code 400, right-click, and choose Select, thenDescendants.
Creating Queries Using Query Designer 73
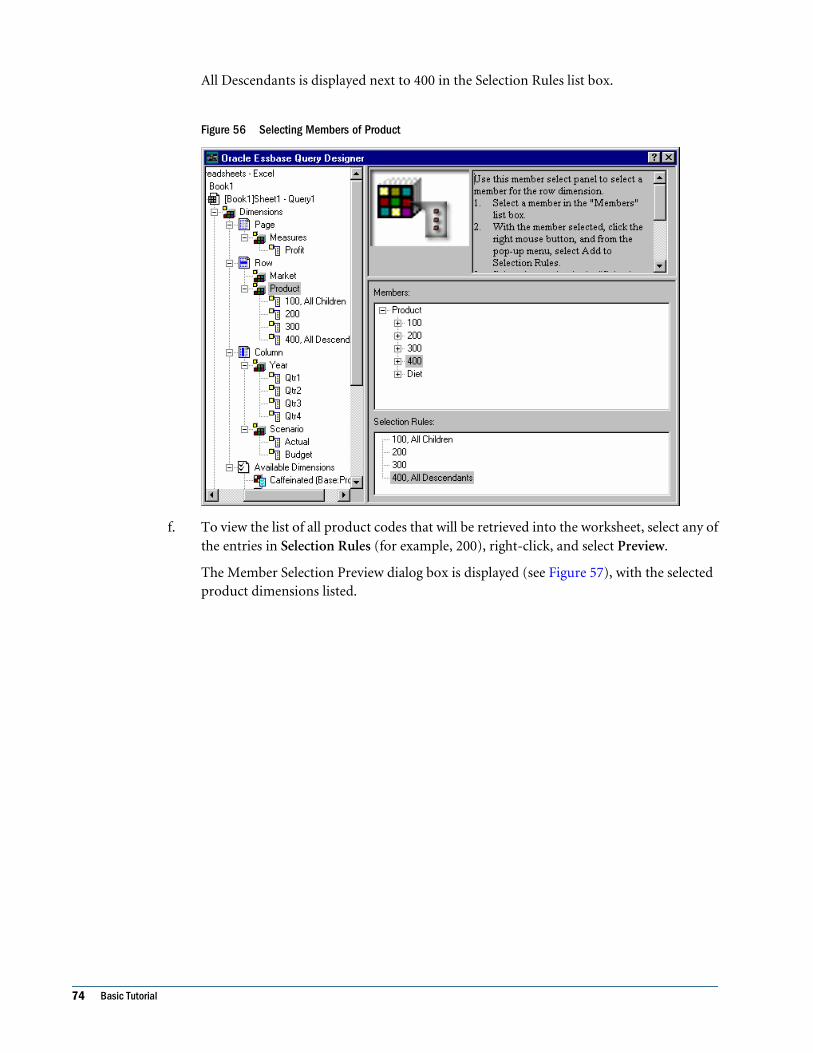
All Descendants is displayed next to 400 in the Selection Rules list box.
Figure 56 Selecting Members of Product
f. To view the list of all product codes that will be retrieved into the worksheet, select any ofthe entries in Selection Rules (for example, 200), right-click, and select Preview.
The Member Selection Preview dialog box is displayed (see Figure 57), with the selectedproduct dimensions listed.
74 Basic Tutorial
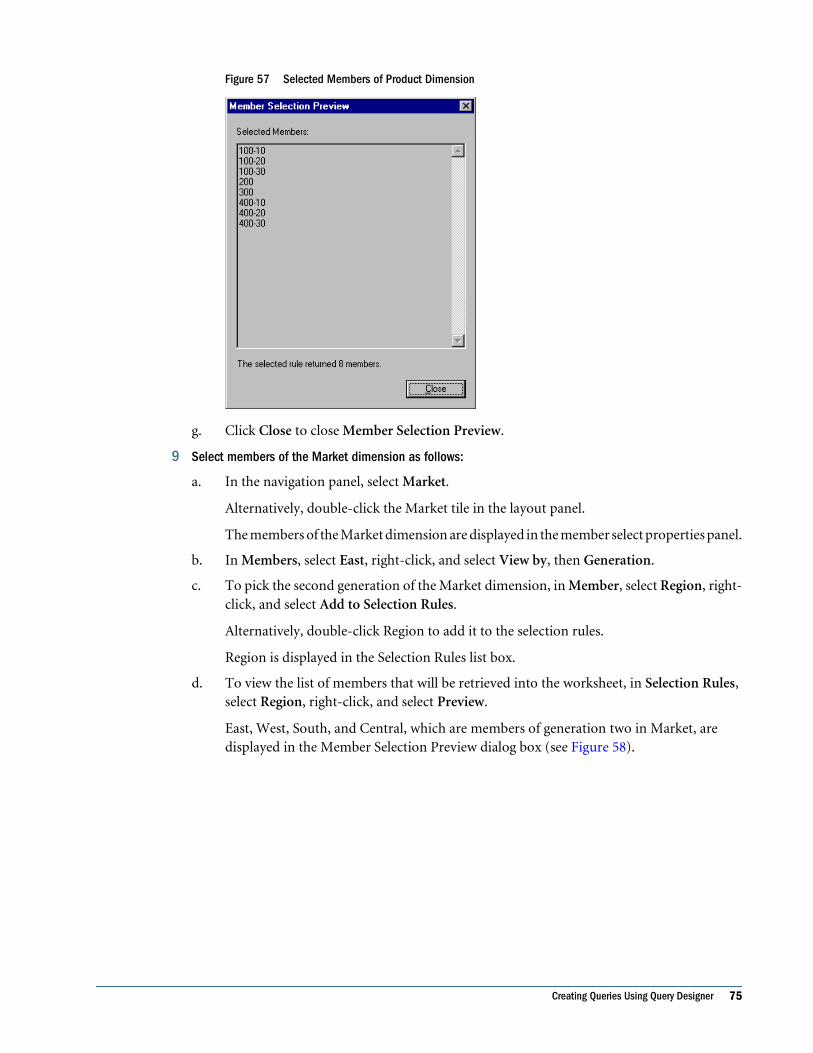
Figure 57 Selected Members of Product Dimension
g. Click Close to close Member Selection Preview.
9 Select members of the Market dimension as follows:
a. In the navigation panel, select Market.
Alternatively, double-click the Market tile in the layout panel.
The members of the Market dimension are displayed in the member select properties panel.
b. In Members, select East, right-click, and select View by, then Generation.
c. To pick the second generation of the Market dimension, in Member, select Region, right-click, and select Add to Selection Rules.
Alternatively, double-click Region to add it to the selection rules.
Region is displayed in the Selection Rules list box.
d. To view the list of members that will be retrieved into the worksheet, in Selection Rules,select Region, right-click, and select Preview.
East, West, South, and Central, which are members of generation two in Market, aredisplayed in the Member Selection Preview dialog box (see Figure 58).
Creating Queries Using Query Designer 75
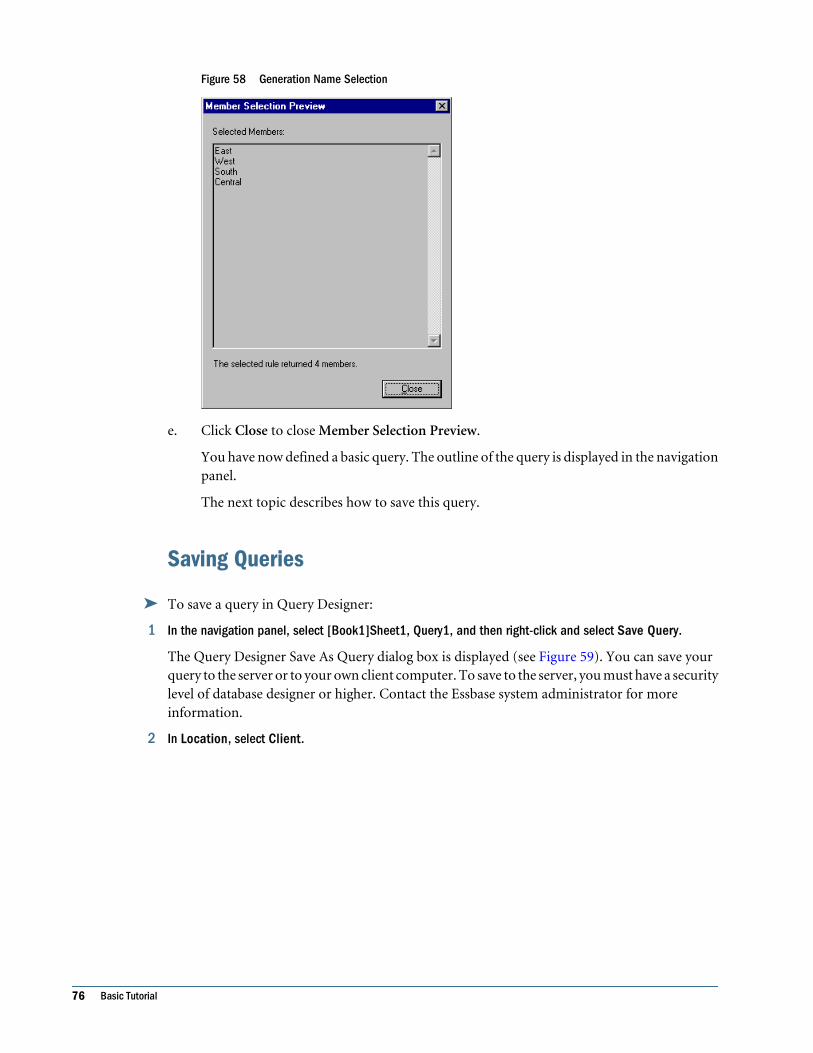
Figure 58 Generation Name Selection
e. Click Close to close Member Selection Preview.
You have now defined a basic query. The outline of the query is displayed in the navigationpanel.
The next topic describes how to save this query.
Saving Queries
➤ To save a query in Query Designer:
1 In the navigation panel, select [Book1]Sheet1, Query1, and then right-click and select Save Query.
The Query Designer Save As Query dialog box is displayed (see Figure 59). You can save yourquery to the server or to your own client computer. To save to the server, you must have a securitylevel of database designer or higher. Contact the Essbase system administrator for moreinformation.
2 In Location, select Client.
76 Basic Tutorial
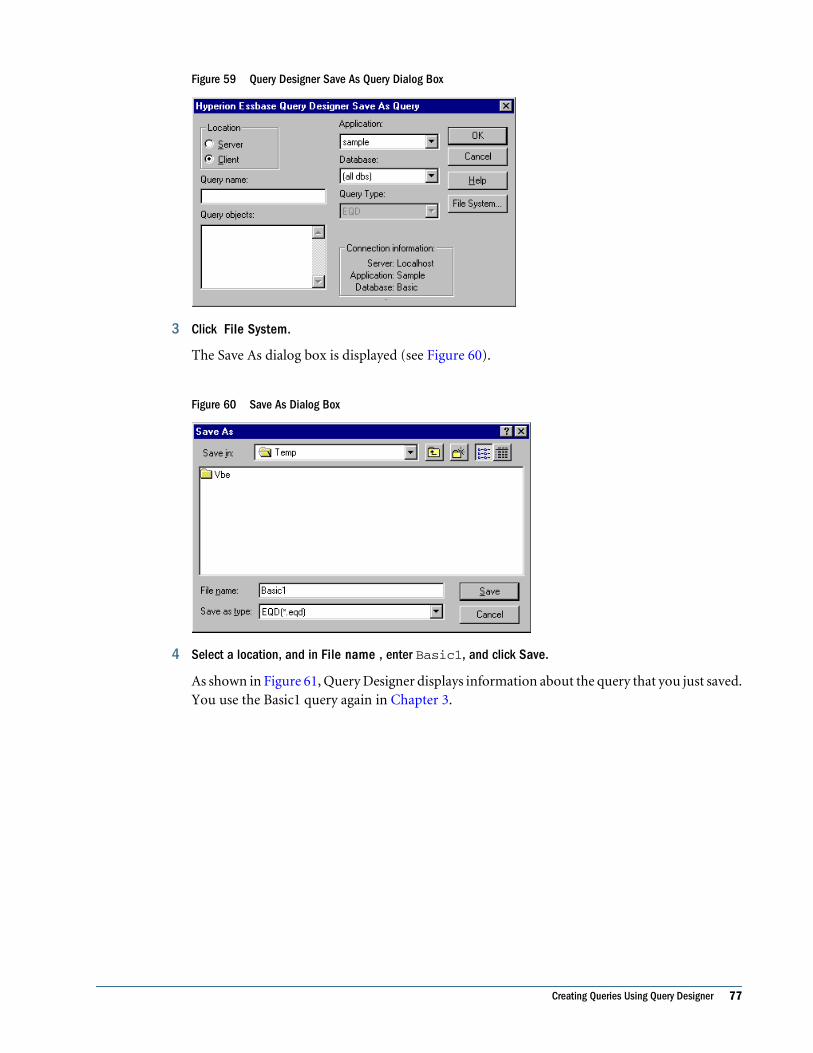
Figure 59 Query Designer Save As Query Dialog Box
3 Click File System.
The Save As dialog box is displayed (see Figure 60).
Figure 60 Save As Dialog Box
4 Select a location, and in File name , enter Basic1, and click Save.
As shown in Figure 61, Query Designer displays information about the query that you just saved.You use the Basic1 query again in Chapter 3.
Creating Queries Using Query Designer 77
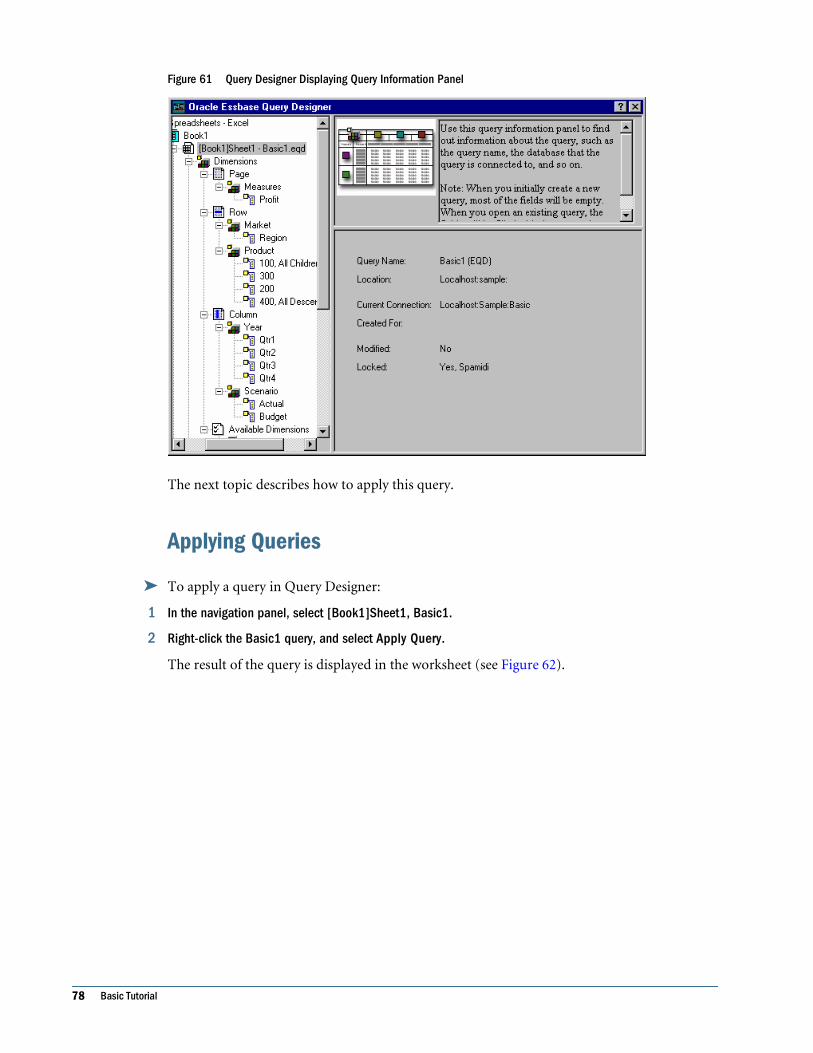
Figure 61 Query Designer Displaying Query Information Panel
The next topic describes how to apply this query.
Applying Queries
➤ To apply a query in Query Designer:
1 In the navigation panel, select [Book1]Sheet1, Basic1.
2 Right-click the Basic1 query, and select Apply Query.
The result of the query is displayed in the worksheet (see Figure 62).
78 Basic Tutorial
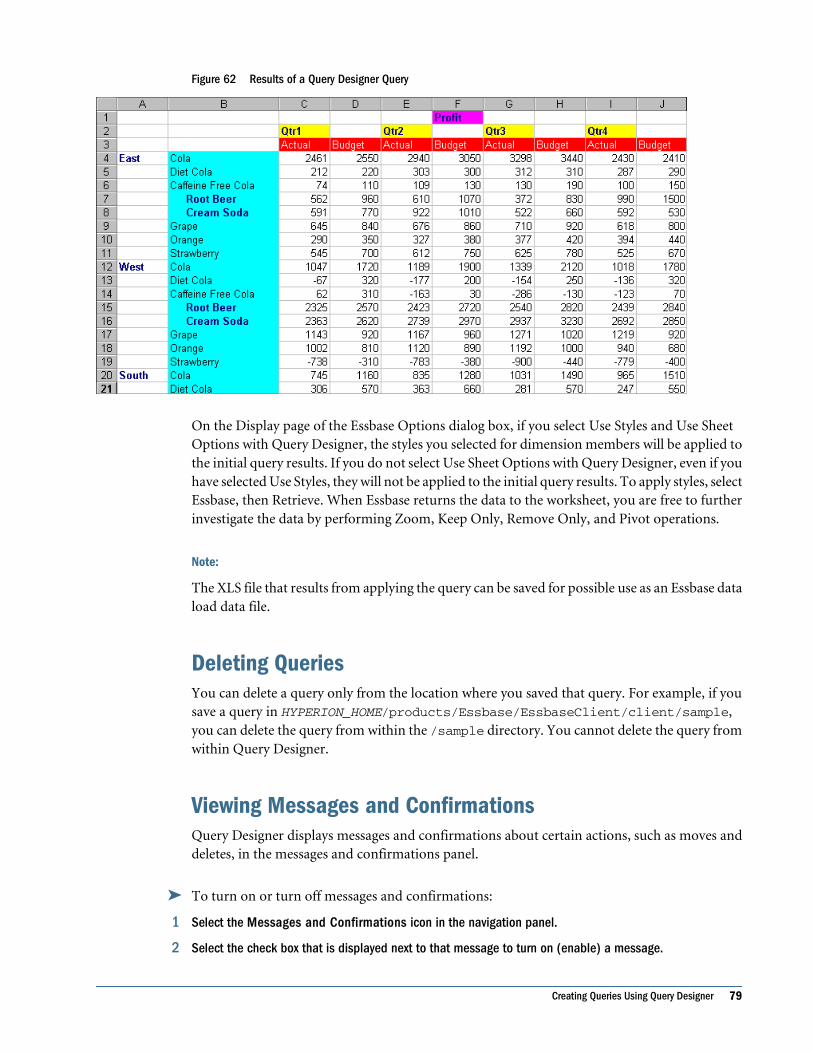
Figure 62 Results of a Query Designer Query
On the Display page of the Essbase Options dialog box, if you select Use Styles and Use SheetOptions with Query Designer, the styles you selected for dimension members will be applied tothe initial query results. If you do not select Use Sheet Options with Query Designer, even if youhave selected Use Styles, they will not be applied to the initial query results. To apply styles, selectEssbase, then Retrieve. When Essbase returns the data to the worksheet, you are free to furtherinvestigate the data by performing Zoom, Keep Only, Remove Only, and Pivot operations.
Note:
The XLS file that results from applying the query can be saved for possible use as an Essbase dataload data file.
Deleting QueriesYou can delete a query only from the location where you saved that query. For example, if yousave a query in HYPERION_HOME/products/Essbase/EssbaseClient/client/sample,you can delete the query from within the /sample directory. You cannot delete the query fromwithin Query Designer.
Viewing Messages and ConfirmationsQuery Designer displays messages and confirmations about certain actions, such as moves anddeletes, in the messages and confirmations panel.
➤ To turn on or turn off messages and confirmations:
1 Select the Messages and Confirmations icon in the navigation panel.
2 Select the check box that is displayed next to that message to turn on (enable) a message.
Creating Queries Using Query Designer 79
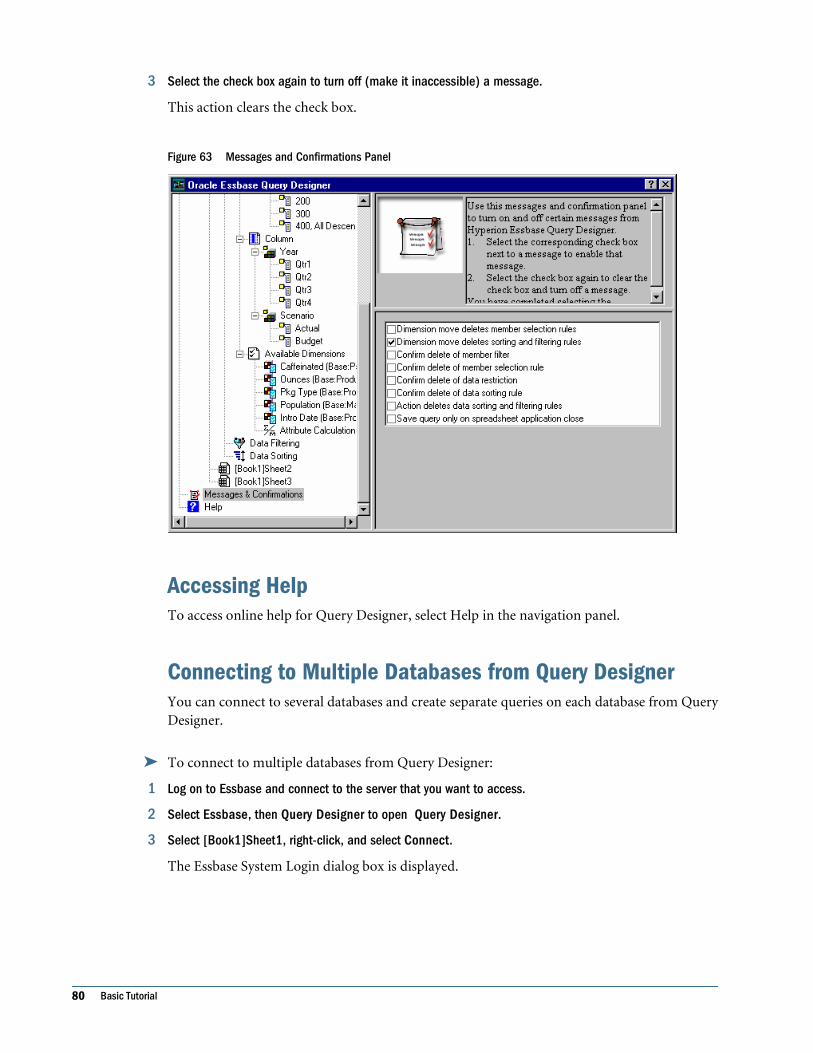
3 Select the check box again to turn off (make it inaccessible) a message.
This action clears the check box.
Figure 63 Messages and Confirmations Panel
Accessing HelpTo access online help for Query Designer, select Help in the navigation panel.
Connecting to Multiple Databases from Query DesignerYou can connect to several databases and create separate queries on each database from QueryDesigner.
➤ To connect to multiple databases from Query Designer:
1 Log on to Essbase and connect to the server that you want to access.
2 Select Essbase, then Query Designer to open Query Designer.
3 Select [Book1]Sheet1, right-click, and select Connect.
The Essbase System Login dialog box is displayed.
80 Basic Tutorial

Note:
The book may be a number other than 1. For example, it may be [Book5], if four worksheetsare already open.
4 Enter your password, and click OK.
5 Select Sample Basic, and click OK.
6 Select [Book1]Sheet2 (or Sheet3), right-click, and select Connect.
The Essbase System Login dialog box is displayed.
7 Enter your password, and click OK.
8 Select Samppart Company, and click OK.
Note:
You are restricted to one connection per worksheet. The connection information is displayedin the query information panel of the Query Designer only when you open an existing query orcreate a new query.
9 Select [Book1]Sheet1, right click, and select New, then Query to create a new query based on Sample Basic.
10 Select [Book1]Sheet2, right-click, and select New, then Query to create a new query based on SamppartCompany,
11 To open an existing query, right click, and select Open Query.
You are now ready to create queries or to open existing queries.
Applying Worksheet Options to Query Designer ResultsYou can apply any of the worksheet options that you previously set from the Essbase Optionsdialog box to the results of a query created in Query Designer.
➤ To enable Query Designer to use your previously set worksheet options:
1 Select Essbase, then Options.
2 In Essbase Options, select Display.
3 Select Use Sheet Options with Query Designer, and select OK.
4 Select Essbase, then Retrieve to refresh the worksheet.
Essbase displays the results of the query that you created in Query Designer and implementsyour previously set worksheet options. For example, in Figure 64, aliases, instead of the numericcodes, are now displayed for the Product dimension.
Creating Queries Using Query Designer 81
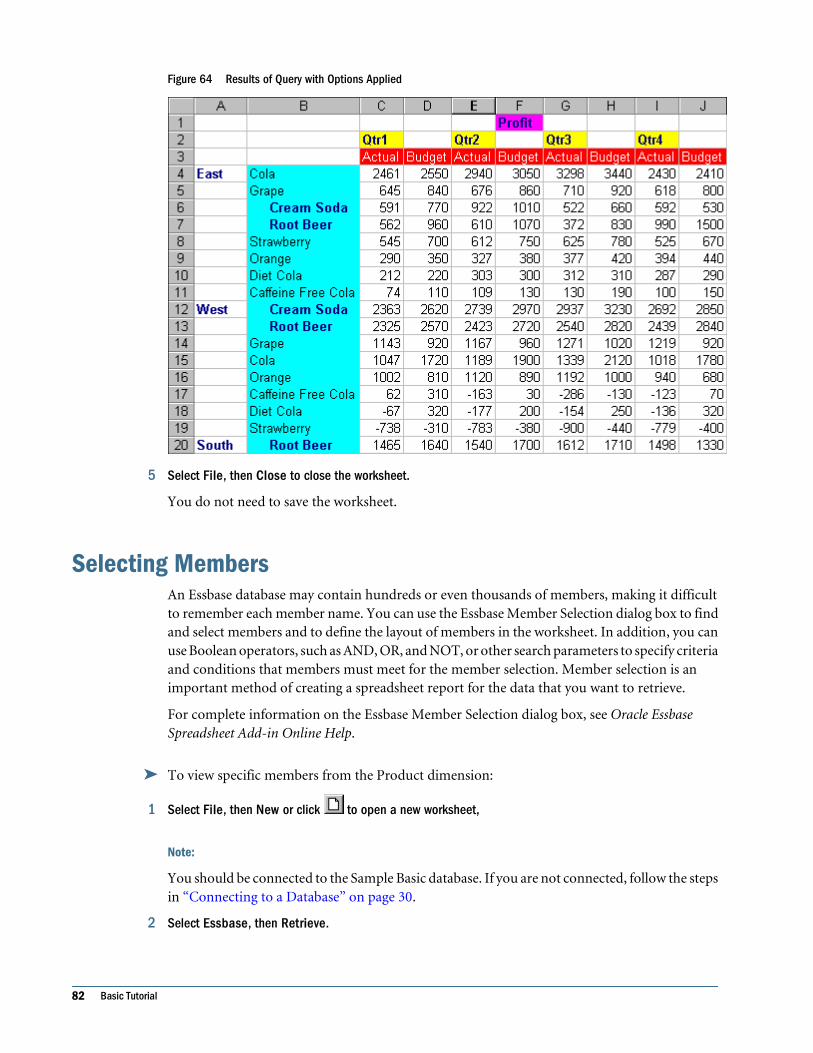
Figure 64 Results of Query with Options Applied
5 Select File, then Close to close the worksheet.
You do not need to save the worksheet.
Selecting MembersAn Essbase database may contain hundreds or even thousands of members, making it difficultto remember each member name. You can use the Essbase Member Selection dialog box to findand select members and to define the layout of members in the worksheet. In addition, you canuse Boolean operators, such as AND, OR, and NOT, or other search parameters to specify criteriaand conditions that members must meet for the member selection. Member selection is animportant method of creating a spreadsheet report for the data that you want to retrieve.
For complete information on the Essbase Member Selection dialog box, see Oracle EssbaseSpreadsheet Add-in Online Help.
➤ To view specific members from the Product dimension:
1 Select File, then New or click to open a new worksheet,
Note:
You should be connected to the Sample Basic database. If you are not connected, follow the stepsin “Connecting to a Database” on page 30.
2 Select Essbase, then Retrieve.
82 Basic Tutorial
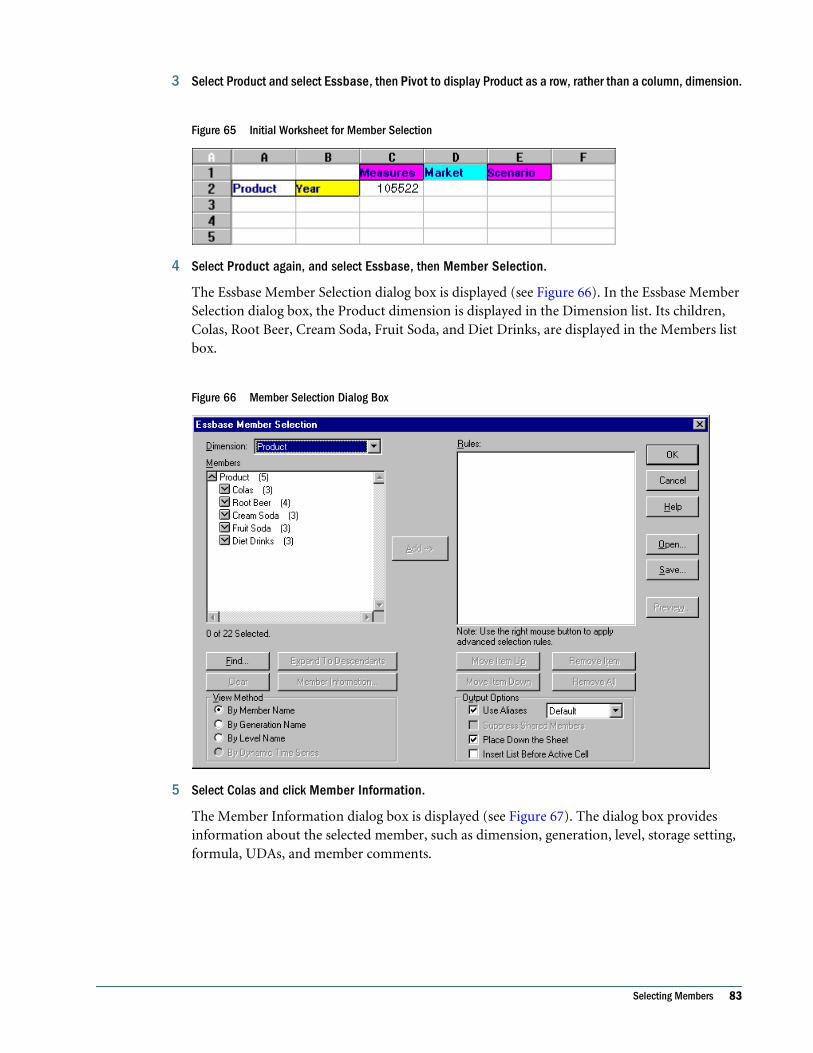
3 Select Product and select Essbase, then Pivot to display Product as a row, rather than a column, dimension.
Figure 65 Initial Worksheet for Member Selection
4 Select Product again, and select Essbase, then Member Selection.
The Essbase Member Selection dialog box is displayed (see Figure 66). In the Essbase MemberSelection dialog box, the Product dimension is displayed in the Dimension list. Its children,Colas, Root Beer, Cream Soda, Fruit Soda, and Diet Drinks, are displayed in the Members listbox.
Figure 66 Member Selection Dialog Box
5 Select Colas and click Member Information.
The Member Information dialog box is displayed (see Figure 67). The dialog box providesinformation about the selected member, such as dimension, generation, level, storage setting,formula, UDAs, and member comments.
Selecting Members 83
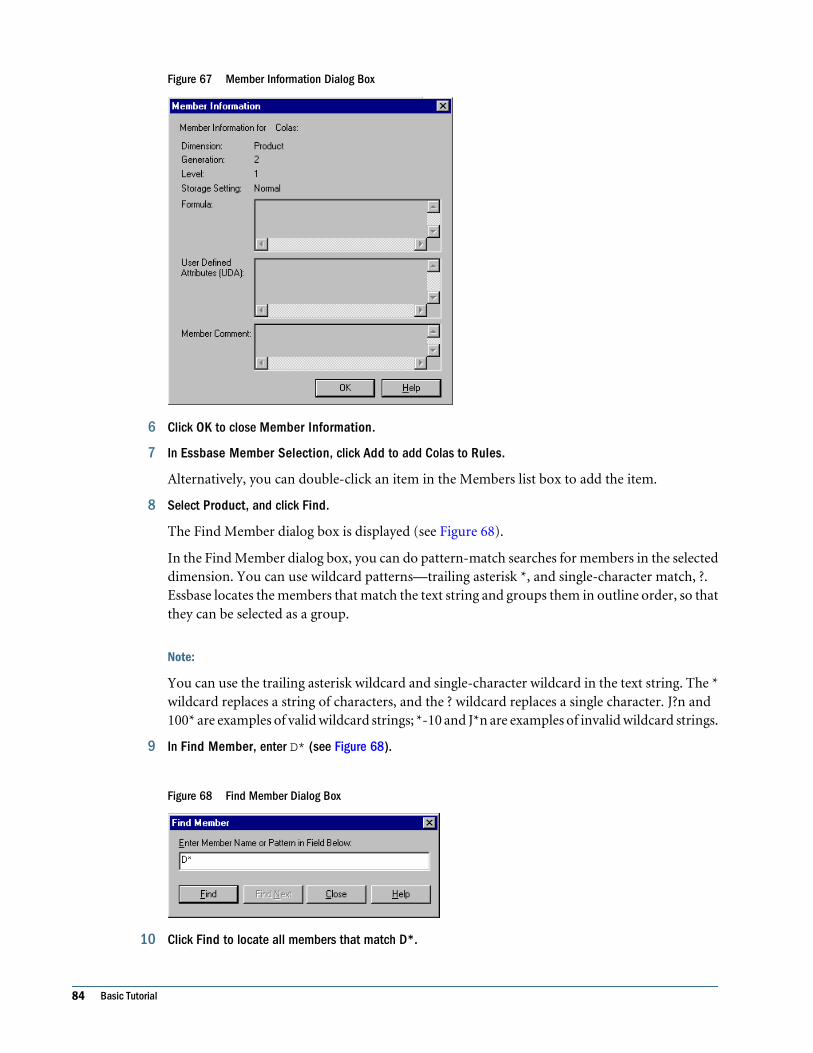
Figure 67 Member Information Dialog Box
6 Click OK to close Member Information.
7 In Essbase Member Selection, click Add to add Colas to Rules.
Alternatively, you can double-click an item in the Members list box to add the item.
8 Select Product, and click Find.
The Find Member dialog box is displayed (see Figure 68).
In the Find Member dialog box, you can do pattern-match searches for members in the selecteddimension. You can use wildcard patterns—trailing asterisk *, and single-character match, ?.Essbase locates the members that match the text string and groups them in outline order, so thatthey can be selected as a group.
Note:
You can use the trailing asterisk wildcard and single-character wildcard in the text string. The *wildcard replaces a string of characters, and the ? wildcard replaces a single character. J?n and100* are examples of valid wildcard strings; *-10 and J*n are examples of invalid wildcard strings.
9 In Find Member, enter D* (see Figure 68).
Figure 68 Find Member Dialog Box
10 Click Find to locate all members that match D*.
84 Basic Tutorial
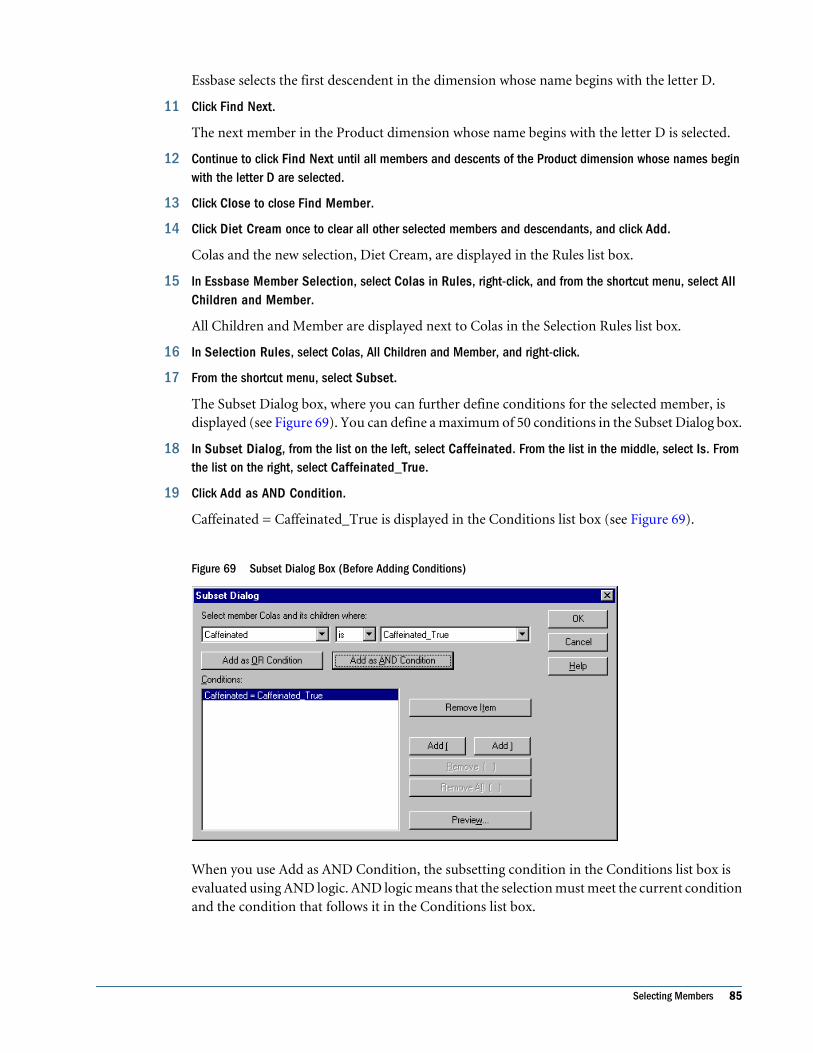
Essbase selects the first descendent in the dimension whose name begins with the letter D.
11 Click Find Next.
The next member in the Product dimension whose name begins with the letter D is selected.
12 Continue to click Find Next until all members and descents of the Product dimension whose names beginwith the letter D are selected.
13 Click Close to close Find Member.
14 Click Diet Cream once to clear all other selected members and descendants, and click Add.
Colas and the new selection, Diet Cream, are displayed in the Rules list box.
15 In Essbase Member Selection, select Colas in Rules, right-click, and from the shortcut menu, select AllChildren and Member.
All Children and Member are displayed next to Colas in the Selection Rules list box.
16 In Selection Rules, select Colas, All Children and Member, and right-click.
17 From the shortcut menu, select Subset.
The Subset Dialog box, where you can further define conditions for the selected member, isdisplayed (see Figure 69). You can define a maximum of 50 conditions in the Subset Dialog box.
18 In Subset Dialog, from the list on the left, select Caffeinated. From the list in the middle, select Is. Fromthe list on the right, select Caffeinated_True.
19 Click Add as AND Condition.
Caffeinated = Caffeinated_True is displayed in the Conditions list box (see Figure 69).
Figure 69 Subset Dialog Box (Before Adding Conditions)
When you use Add as AND Condition, the subsetting condition in the Conditions list box isevaluated using AND logic. AND logic means that the selection must meet the current conditionand the condition that follows it in the Conditions list box.
Selecting Members 85

20 From the list on the left, select Ounces. From the list in the middle, select the logical operator “=”. From thelist on the right, select Ounces_12.
21 Click Add as AND Condition.
Ounces = Ounces_12 is displayed in the Conditions box.
22 From the list on the left, select Ounces. From the list in the middle, select the logical operator “<=”. Fromthe list on the right, select Ounces_32.
23 Click Add as OR Condition.
Ounces <= Ounces_32 is displayed in the Conditions box.
When you use Add as OR Condition, the subsetting condition in the Conditions list box isevaluated using OR logic. OR logic means that the selection must meet the current conditionor the condition that follows it in the Conditions list box.
24 From the list on the left, select Pkg Type. From the list in the middle, select Is. From the list on the right,select Bottle.
25 Click Add as AND Condition.
Pkg Type = Bottle is displayed in the Conditions list box.
26 In Conditions, select Ounces <= Ounces_32, and click Add (.
27 Select Pkg Type = Bottle, and click Add ).
The Add ( and Add ) buttons add a left parenthesis and right parenthesis, respectively, to selecteditems. Use parentheses for grouping multiple subsetting conditions to determine the order ofpriority for analyzing the conditions.
Each item in the Conditions list box can have either the left or right parenthesis, but not both.In this example, Essbase first evaluates members that are less than or equal to 32 ounces and arepackaged in a bottle. Essbase then evaluates the results from this condition against members thatare 12 ounces.
Note:
Use the Remove ( ) button to remove an individual group of parentheses from a selected itemin the Conditions list box. Use the Remove All ( ) button to remove all parenthetical groupingsfrom the Conditions list box.
The Subset Dialog box is displayed (see Figure 70).
86 Basic Tutorial
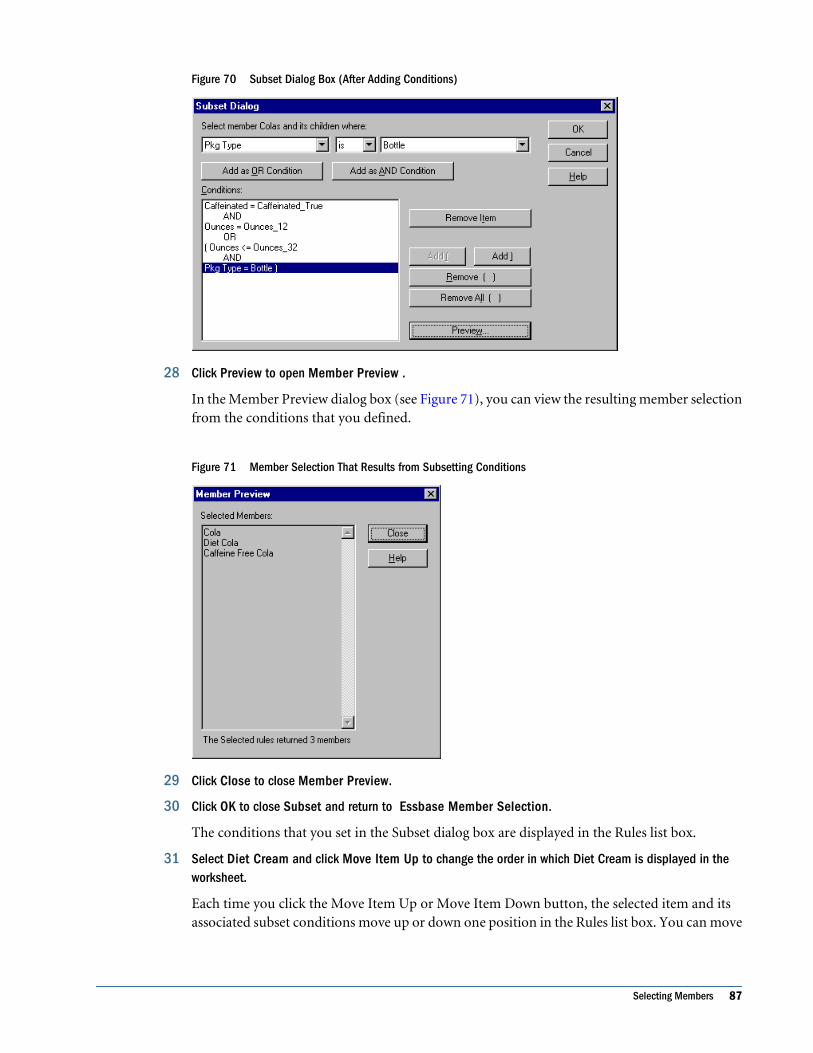
Figure 70 Subset Dialog Box (After Adding Conditions)
28 Click Preview to open Member Preview .
In the Member Preview dialog box (see Figure 71), you can view the resulting member selectionfrom the conditions that you defined.
Figure 71 Member Selection That Results from Subsetting Conditions
29 Click Close to close Member Preview.
30 Click OK to close Subset and return to Essbase Member Selection.
The conditions that you set in the Subset dialog box are displayed in the Rules list box.
31 Select Diet Cream and click Move Item Up to change the order in which Diet Cream is displayed in theworksheet.
Each time you click the Move Item Up or Move Item Down button, the selected item and itsassociated subset conditions move up or down one position in the Rules list box. You can move
Selecting Members 87
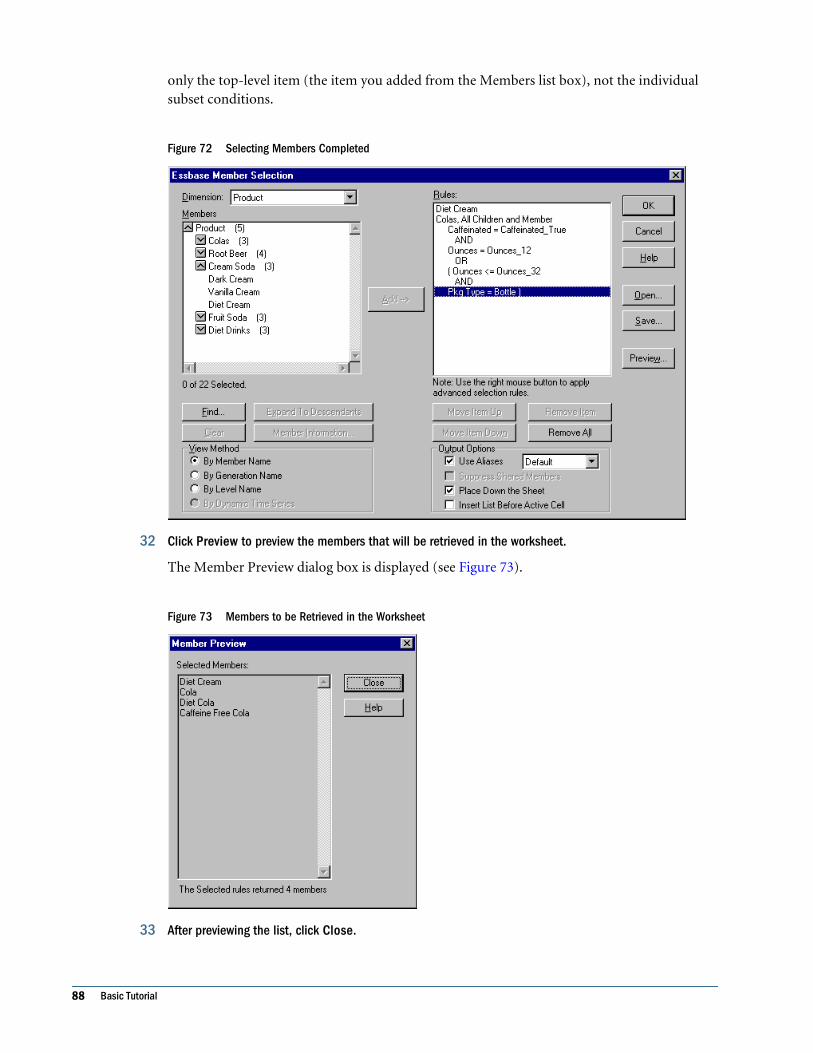
only the top-level item (the item you added from the Members list box), not the individualsubset conditions.
Figure 72 Selecting Members Completed
32 Click Preview to preview the members that will be retrieved in the worksheet.
The Member Preview dialog box is displayed (see Figure 73).
Figure 73 Members to be Retrieved in the Worksheet
33 After previewing the list, click Close.
88 Basic Tutorial
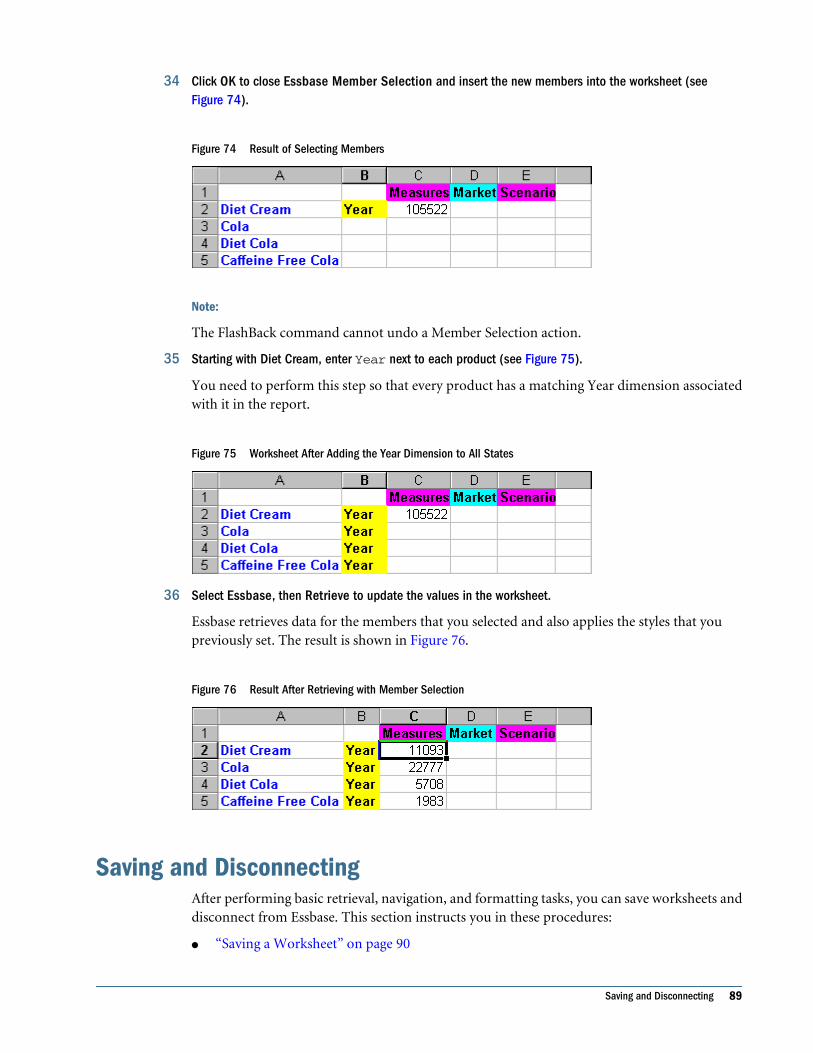
34 Click OK to close Essbase Member Selection and insert the new members into the worksheet (seeFigure 74).
Figure 74 Result of Selecting Members
Note:
The FlashBack command cannot undo a Member Selection action.
35 Starting with Diet Cream, enter Year next to each product (see Figure 75).
You need to perform this step so that every product has a matching Year dimension associatedwith it in the report.
Figure 75 Worksheet After Adding the Year Dimension to All States
36 Select Essbase, then Retrieve to update the values in the worksheet.
Essbase retrieves data for the members that you selected and also applies the styles that youpreviously set. The result is shown in Figure 76.
Figure 76 Result After Retrieving with Member Selection
Saving and DisconnectingAfter performing basic retrieval, navigation, and formatting tasks, you can save worksheets anddisconnect from Essbase. This section instructs you in these procedures:
● “Saving a Worksheet” on page 90
Saving and Disconnecting 89
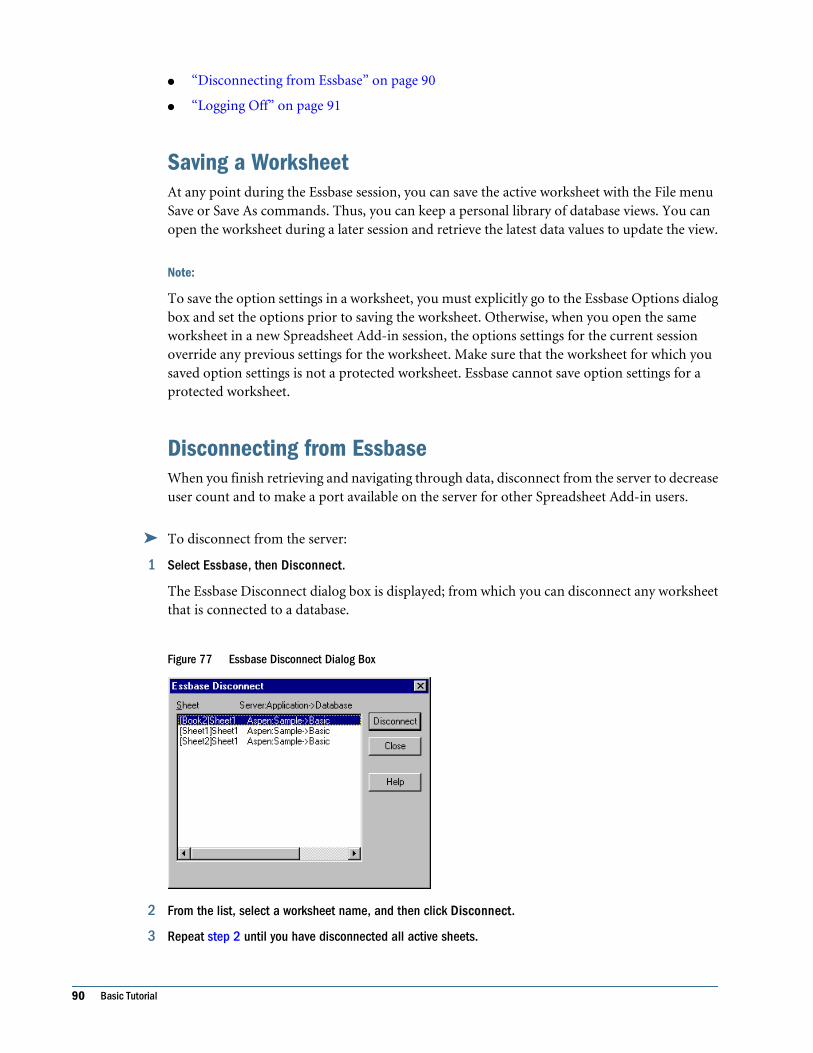
● “Disconnecting from Essbase” on page 90
● “Logging Off” on page 91
Saving a WorksheetAt any point during the Essbase session, you can save the active worksheet with the File menuSave or Save As commands. Thus, you can keep a personal library of database views. You canopen the worksheet during a later session and retrieve the latest data values to update the view.
Note:
To save the option settings in a worksheet, you must explicitly go to the Essbase Options dialogbox and set the options prior to saving the worksheet. Otherwise, when you open the sameworksheet in a new Spreadsheet Add-in session, the options settings for the current sessionoverride any previous settings for the worksheet. Make sure that the worksheet for which yousaved option settings is not a protected worksheet. Essbase cannot save option settings for aprotected worksheet.
Disconnecting from EssbaseWhen you finish retrieving and navigating through data, disconnect from the server to decreaseuser count and to make a port available on the server for other Spreadsheet Add-in users.
➤ To disconnect from the server:
1 Select Essbase, then Disconnect.
The Essbase Disconnect dialog box is displayed; from which you can disconnect any worksheetthat is connected to a database.
Figure 77 Essbase Disconnect Dialog Box
2 From the list, select a worksheet name, and then click Disconnect.
3 Repeat step 2 until you have disconnected all active sheets.
90 Basic Tutorial
4 Click Close to close Essbase Disconnect.
Note:
You can also disconnect from the server by closing the spreadsheet application. An abnormalshutdown of a Spreadsheet Add-in session, such as a power loss or system failure, does notdisconnect your server connection.
Logging OffEssbase provides two administrative features that control user connections:
● Forced Logout, where an administrator disconnects users at any point in time. This logoutusually occurs when maintenance operations are performed on databases.
● Auto Logout, where Essbase automatically disconnects users that are inactive for a timedinterval specified by an administrator.
On to Advanced TasksNow that you have completed the basic tutorial, you are ready to move on to more complextasks. In the next tutorial, you use the sample spreadsheet files to perform advanced tasks inSpreadsheet Add-in.
On to Advanced Tasks 91

92 Basic Tutorial
3Advanced Tutorial
In This Chapter
About the Advanced Tutorial . . . . . . . . . . . . . . . . . . . . . . . . . . . . . . . . . . . . . . . . . . . . . . . . . . . . . . . . . . . . . . . . . . . . . . . . . . . . . . . . . . . . . . . . . . . . . . . . . . . . . .93
Performing Advanced Retrieval Tasks ... . . . . . . . . . . . . . . . . . . . . . . . . . . . . . . . . . . . . . . . . . . . . . . . . . . . . . . . . . . . . . . . . . . . . . . . . . . . . . . . . . . . . . . . . .99
Using Linked Reporting Objects .. . . . . . . . . . . . . . . . . . . . . . . . . . . . . . . . . . . . . . . . . . . . . . . . . . . . . . . . . . . . . . . . . . . . . . . . . . . . . . . . . . . . . . . . . . . . . . . 144
Connecting to Multiple Databases (Optional) .. . . . . . . . . . . . . . . . . . . . . . . . . . . . . . . . . . . . . . . . . . . . . . . . . . . . . . . . . . . . . . . . . . . . . . . . . . . . . . . . 156
Ways to View Active Database Connections... . . . . . . . . . . . . . . . . . . . . . . . . . . . . . . . . . . . . . . . . . . . . . . . . . . . . . . . . . . . . . . . . . . . . . . . . . . . . . . . . 157
Access Methods for Linked Partitions ... . . . . . . . . . . . . . . . . . . . . . . . . . . . . . . . . . . . . . . . . . . . . . . . . . . . . . . . . . . . . . . . . . . . . . . . . . . . . . . . . . . . . . . . 158
Updating Data on Essbase Server.. . . . . . . . . . . . . . . . . . . . . . . . . . . . . . . . . . . . . . . . . . . . . . . . . . . . . . . . . . . . . . . . . . . . . . . . . . . . . . . . . . . . . . . . . . . . . 159
Database Calculation... . . . . . . . . . . . . . . . . . . . . . . . . . . . . . . . . . . . . . . . . . . . . . . . . . . . . . . . . . . . . . . . . . . . . . . . . . . . . . . . . . . . . . . . . . . . . . . . . . . . . . . . . . 162
Creating Multiple Worksheets from Data ... . . . . . . . . . . . . . . . . . . . . . . . . . . . . . . . . . . . . . . . . . . . . . . . . . . . . . . . . . . . . . . . . . . . . . . . . . . . . . . . . . . . 163
Working with Currency Conversions ... . . . . . . . . . . . . . . . . . . . . . . . . . . . . . . . . . . . . . . . . . . . . . . . . . . . . . . . . . . . . . . . . . . . . . . . . . . . . . . . . . . . . . . . . . 167
About the Advanced TutorialThe tutorial that you completed in Chapter 2 teaches basic data retrieval and navigation conceptsfor Spreadsheet Add-in. This chapter builds on your basic skills and expands your knowledgeof Essbase and Spreadsheet Add-in.
In this advanced tutorial, you use several sample spreadsheet files for Excel that were installedas part of the default Essbase installation. These files are stored in HYPERION_HOME/products/Essbase/EssbaseClient/client/sample. You also reconnect to the SampleBasic database.
Before you begin the advanced tutorial, complete the steps in the next two sections, “Connectingto a Database” on page 93 and “Setting Essbase Options” on page 95. In addition, be sure toread “Following Guidelines During the Tutorial” on page 28 and “Reviewing the Sample BasicDatabase” on page 29 for important information about what you should expect as you performthe tutorial steps.
Connecting to a DatabaseTo access Essbase data for the advanced tutorial, first connect to the Sample Basic database onthe server. This tutorial assumes that you have the appropriate privileges to connect to a server,an application, and a database.
About the Advanced Tutorial 93
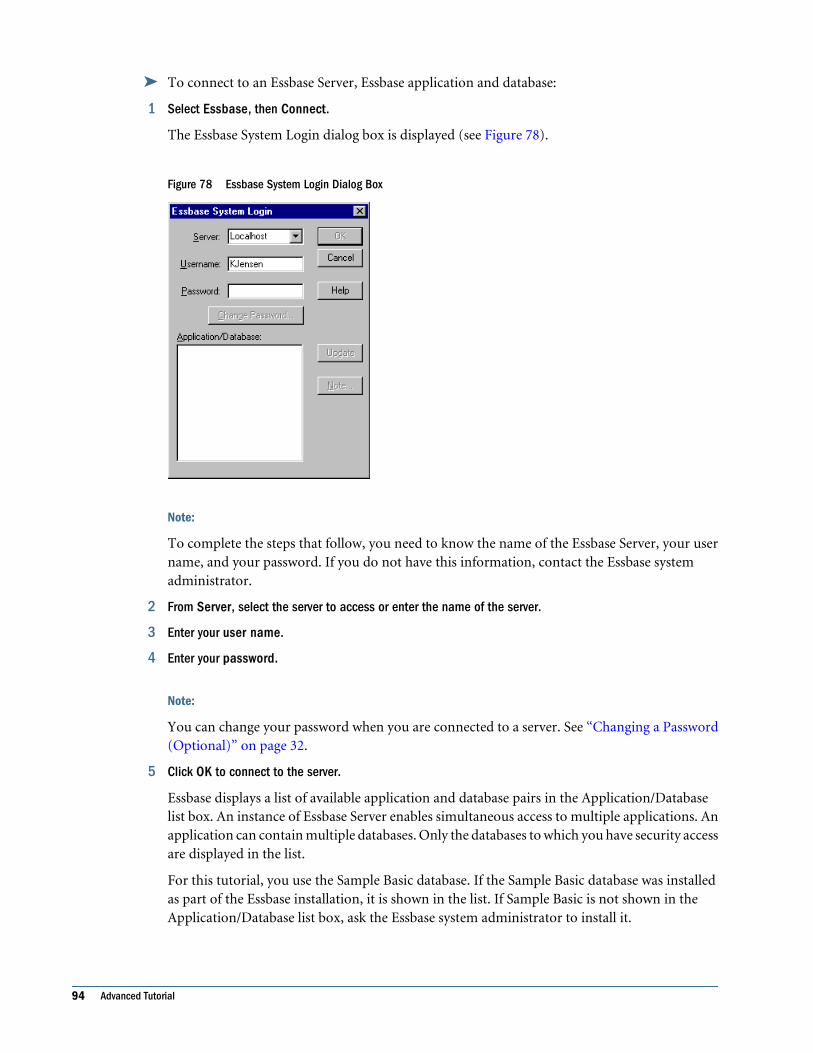
➤ To connect to an Essbase Server, Essbase application and database:
1 Select Essbase, then Connect.
The Essbase System Login dialog box is displayed (see Figure 78).
Figure 78 Essbase System Login Dialog Box
Note:
To complete the steps that follow, you need to know the name of the Essbase Server, your username, and your password. If you do not have this information, contact the Essbase systemadministrator.
2 From Server, select the server to access or enter the name of the server.
3 Enter your user name.
4 Enter your password.
Note:
You can change your password when you are connected to a server. See “Changing a Password(Optional)” on page 32.
5 Click OK to connect to the server.
Essbase displays a list of available application and database pairs in the Application/Databaselist box. An instance of Essbase Server enables simultaneous access to multiple applications. Anapplication can contain multiple databases. Only the databases to which you have security accessare displayed in the list.
For this tutorial, you use the Sample Basic database. If the Sample Basic database was installedas part of the Essbase installation, it is shown in the list. If Sample Basic is not shown in theApplication/Database list box, ask the Essbase system administrator to install it.
94 Advanced Tutorial
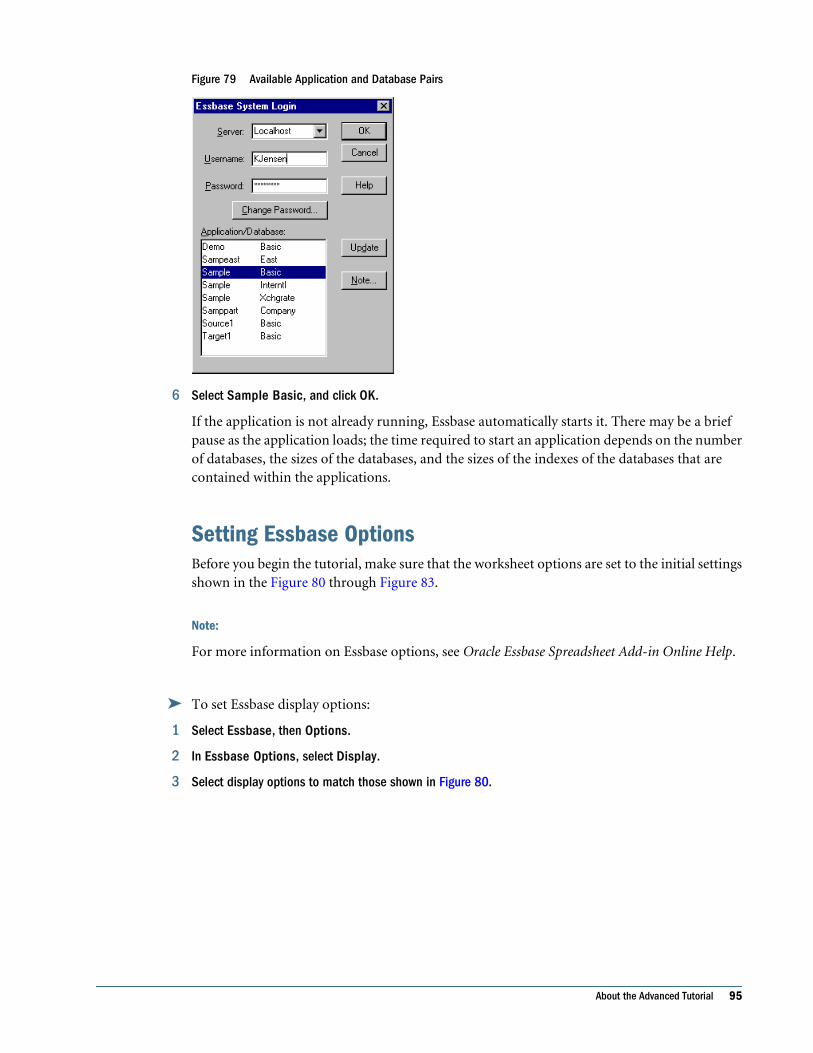
Figure 79 Available Application and Database Pairs
6 Select Sample Basic, and click OK.
If the application is not already running, Essbase automatically starts it. There may be a briefpause as the application loads; the time required to start an application depends on the numberof databases, the sizes of the databases, and the sizes of the indexes of the databases that arecontained within the applications.
Setting Essbase OptionsBefore you begin the tutorial, make sure that the worksheet options are set to the initial settingsshown in the Figure 80 through Figure 83.
Note:
For more information on Essbase options, see Oracle Essbase Spreadsheet Add-in Online Help.
➤ To set Essbase display options:
1 Select Essbase, then Options.
2 In Essbase Options, select Display.
3 Select display options to match those shown in Figure 80.
About the Advanced Tutorial 95
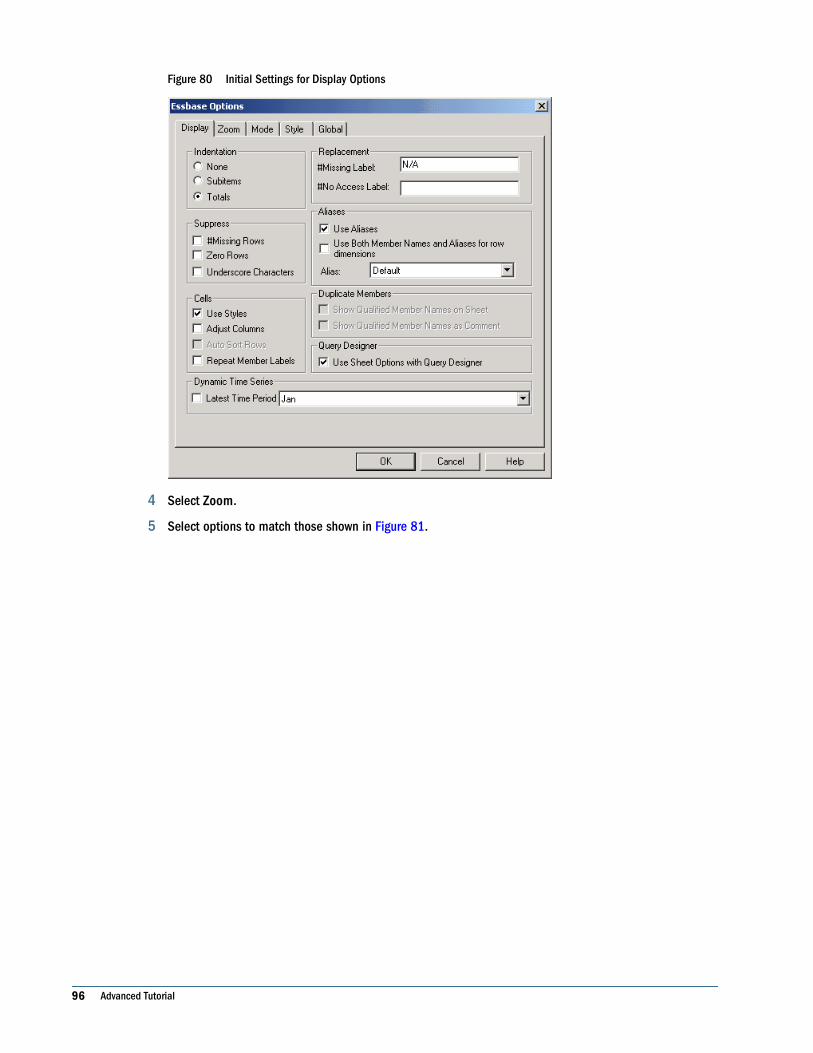
Figure 80 Initial Settings for Display Options
4 Select Zoom.
5 Select options to match those shown in Figure 81.
96 Advanced Tutorial
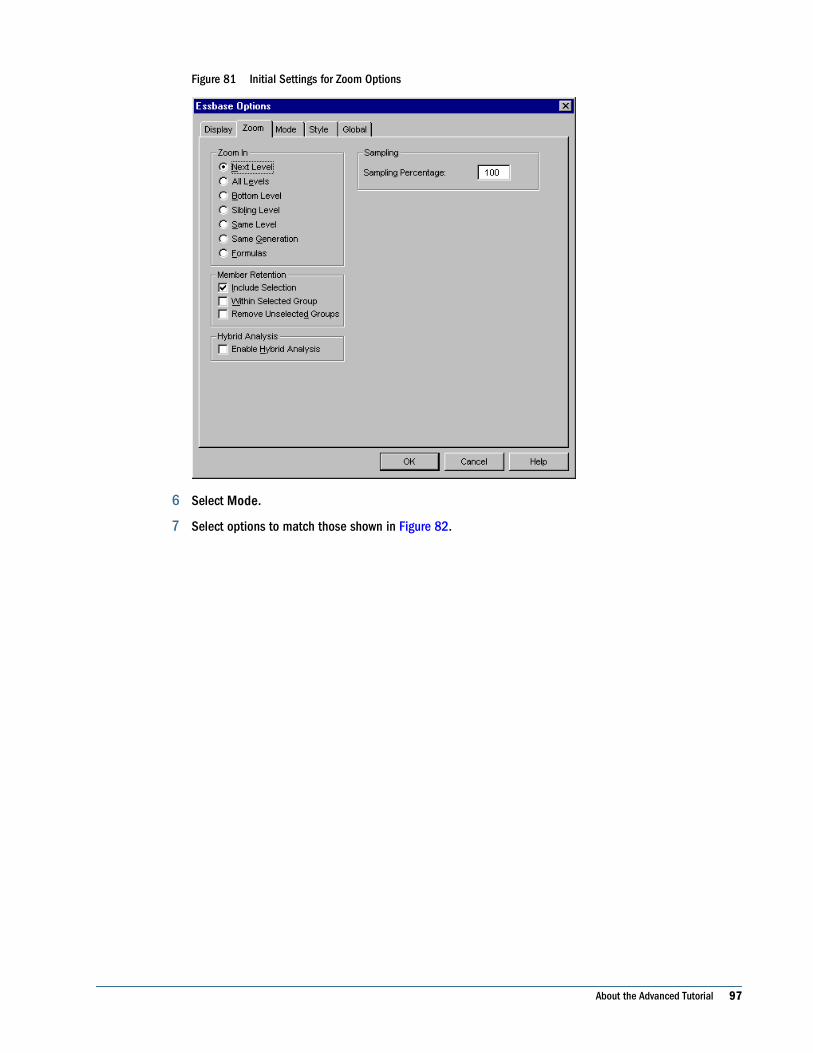
Figure 81 Initial Settings for Zoom Options
6 Select Mode.
7 Select options to match those shown in Figure 82.
About the Advanced Tutorial 97
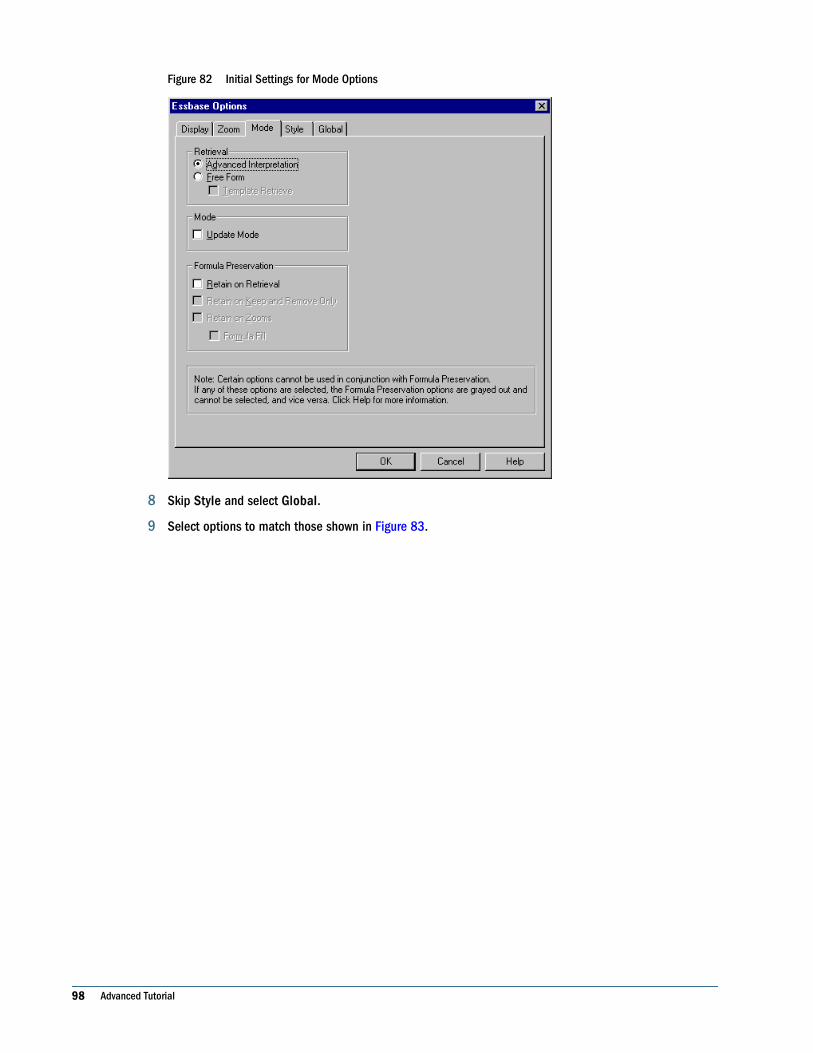
Figure 82 Initial Settings for Mode Options
8 Skip Style and select Global.
9 Select options to match those shown in Figure 83.
98 Advanced Tutorial
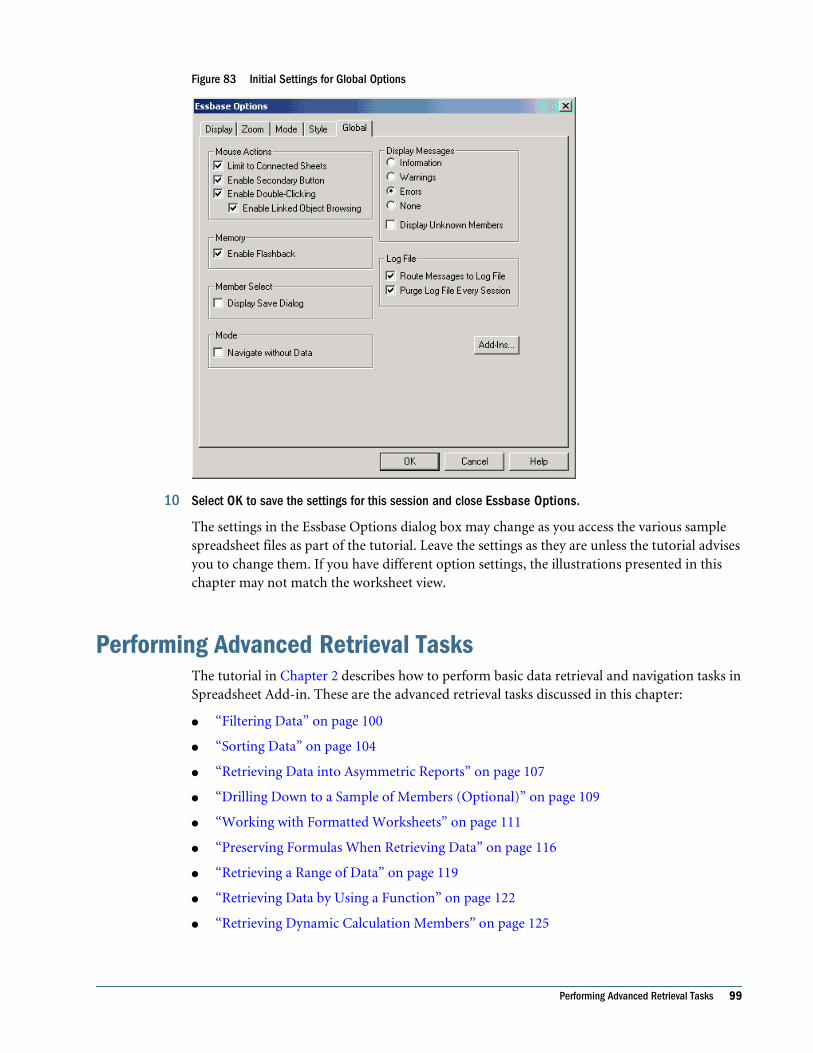
Figure 83 Initial Settings for Global Options
10 Select OK to save the settings for this session and close Essbase Options.
The settings in the Essbase Options dialog box may change as you access the various samplespreadsheet files as part of the tutorial. Leave the settings as they are unless the tutorial advisesyou to change them. If you have different option settings, the illustrations presented in thischapter may not match the worksheet view.
Performing Advanced Retrieval TasksThe tutorial in Chapter 2 describes how to perform basic data retrieval and navigation tasks inSpreadsheet Add-in. These are the advanced retrieval tasks discussed in this chapter:
● “Filtering Data” on page 100
● “Sorting Data” on page 104
● “Retrieving Data into Asymmetric Reports” on page 107
● “Drilling Down to a Sample of Members (Optional)” on page 109
● “Working with Formatted Worksheets” on page 111
● “Preserving Formulas When Retrieving Data” on page 116
● “Retrieving a Range of Data” on page 119
● “Retrieving Data by Using a Function” on page 122
● “Retrieving Dynamic Calculation Members” on page 125
Performing Advanced Retrieval Tasks 99
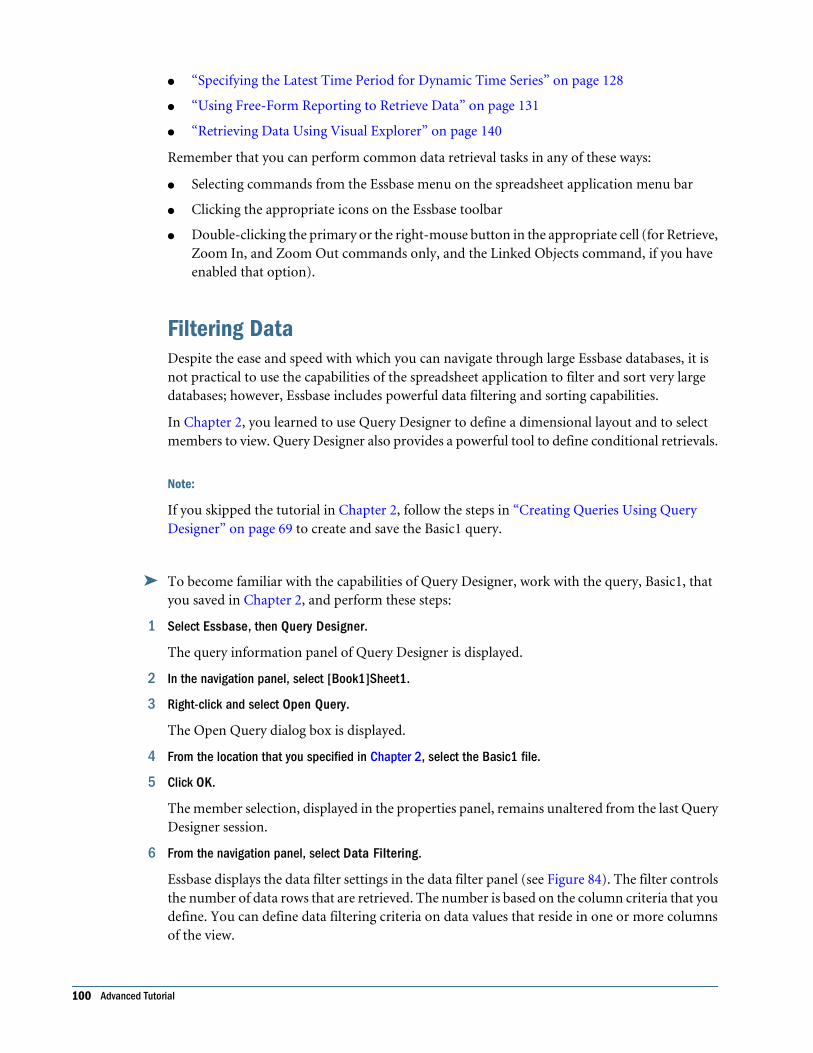
● “Specifying the Latest Time Period for Dynamic Time Series” on page 128
● “Using Free-Form Reporting to Retrieve Data” on page 131
● “Retrieving Data Using Visual Explorer” on page 140
Remember that you can perform common data retrieval tasks in any of these ways:
● Selecting commands from the Essbase menu on the spreadsheet application menu bar
● Clicking the appropriate icons on the Essbase toolbar
● Double-clicking the primary or the right-mouse button in the appropriate cell (for Retrieve,Zoom In, and Zoom Out commands only, and the Linked Objects command, if you haveenabled that option).
Filtering DataDespite the ease and speed with which you can navigate through large Essbase databases, it isnot practical to use the capabilities of the spreadsheet application to filter and sort very largedatabases; however, Essbase includes powerful data filtering and sorting capabilities.
In Chapter 2, you learned to use Query Designer to define a dimensional layout and to selectmembers to view. Query Designer also provides a powerful tool to define conditional retrievals.
Note:
If you skipped the tutorial in Chapter 2, follow the steps in “Creating Queries Using QueryDesigner” on page 69 to create and save the Basic1 query.
➤ To become familiar with the capabilities of Query Designer, work with the query, Basic1, thatyou saved in Chapter 2, and perform these steps:
1 Select Essbase, then Query Designer.
The query information panel of Query Designer is displayed.
2 In the navigation panel, select [Book1]Sheet1.
3 Right-click and select Open Query.
The Open Query dialog box is displayed.
4 From the location that you specified in Chapter 2, select the Basic1 file.
5 Click OK.
The member selection, displayed in the properties panel, remains unaltered from the last QueryDesigner session.
6 From the navigation panel, select Data Filtering.
Essbase displays the data filter settings in the data filter panel (see Figure 84). The filter controlsthe number of data rows that are retrieved. The number is based on the column criteria that youdefine. You can define data filtering criteria on data values that reside in one or more columnsof the view.
100 Advanced Tutorial
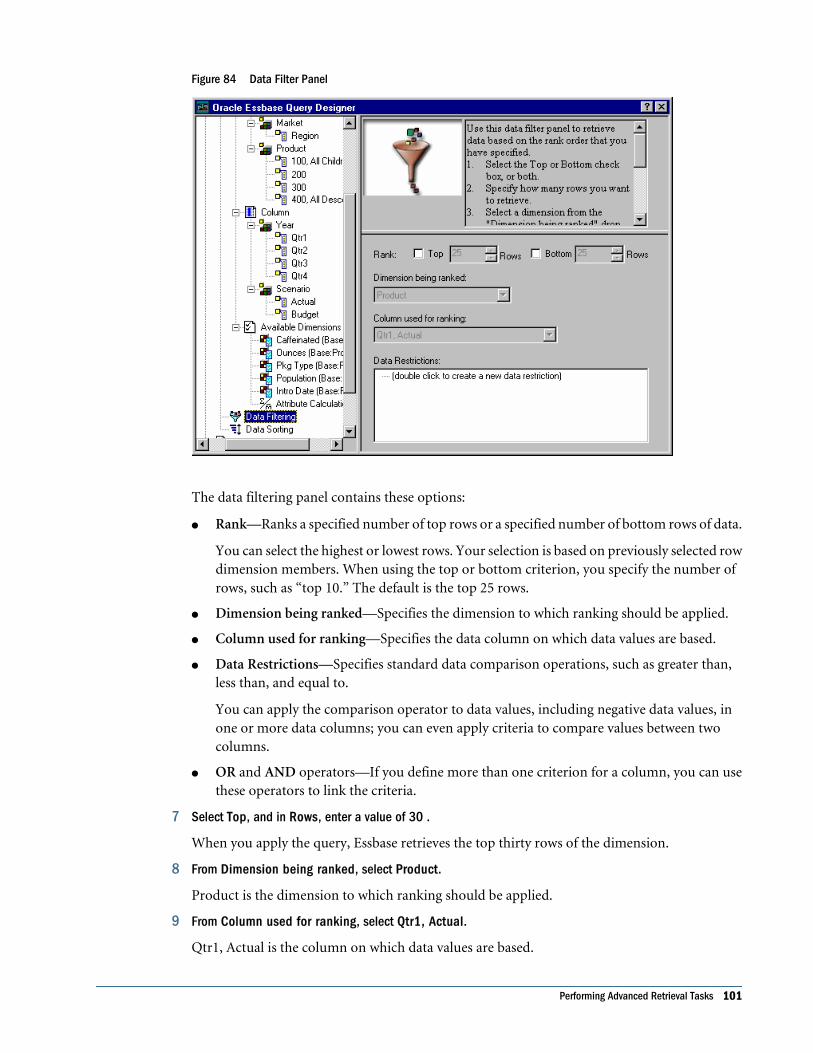
Figure 84 Data Filter Panel
The data filtering panel contains these options:
● Rank—Ranks a specified number of top rows or a specified number of bottom rows of data.
You can select the highest or lowest rows. Your selection is based on previously selected rowdimension members. When using the top or bottom criterion, you specify the number ofrows, such as “top 10.” The default is the top 25 rows.
● Dimension being ranked—Specifies the dimension to which ranking should be applied.
● Column used for ranking—Specifies the data column on which data values are based.
● Data Restrictions—Specifies standard data comparison operations, such as greater than,less than, and equal to.
You can apply the comparison operator to data values, including negative data values, inone or more data columns; you can even apply criteria to compare values between twocolumns.
● OR and AND operators—If you define more than one criterion for a column, you can usethese operators to link the criteria.
7 Select Top, and in Rows, enter a value of 30 .
When you apply the query, Essbase retrieves the top thirty rows of the dimension.
8 From Dimension being ranked, select Product.
Product is the dimension to which ranking should be applied.
9 From Column used for ranking, select Qtr1, Actual.
Qtr1, Actual is the column on which data values are based.
Performing Advanced Retrieval Tasks 101
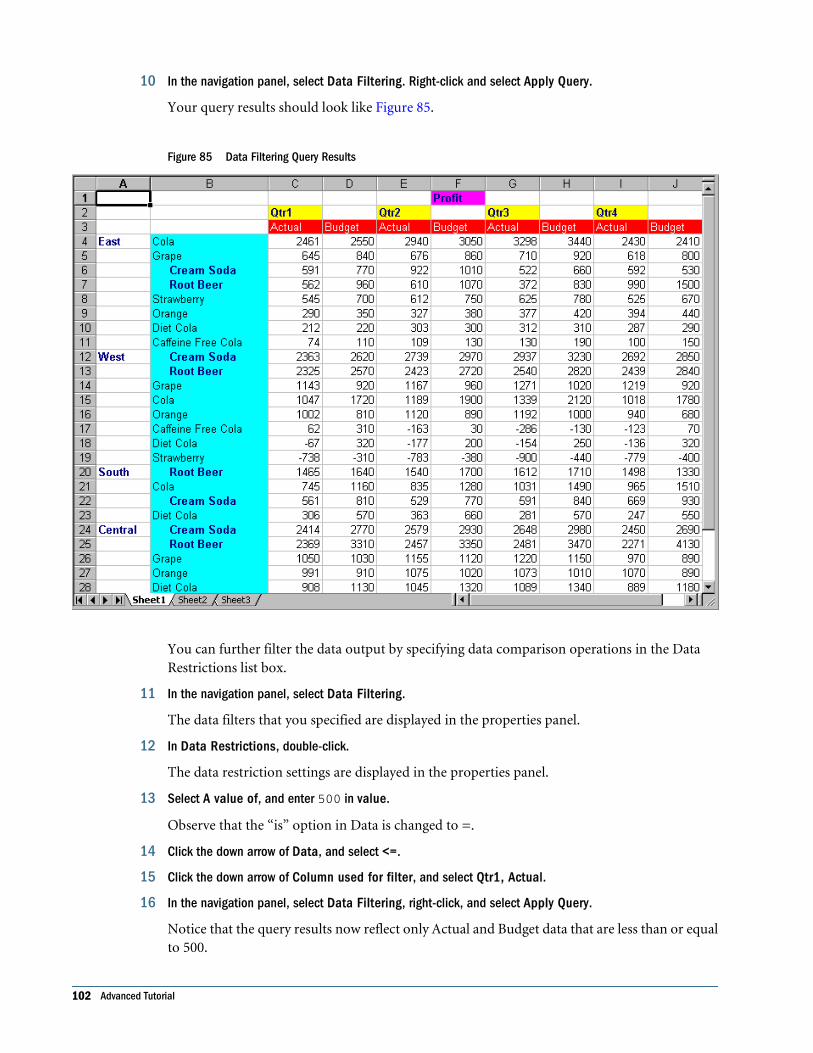
10 In the navigation panel, select Data Filtering. Right-click and select Apply Query.
Your query results should look like Figure 85.
Figure 85 Data Filtering Query Results
You can further filter the data output by specifying data comparison operations in the DataRestrictions list box.
11 In the navigation panel, select Data Filtering.
The data filters that you specified are displayed in the properties panel.
12 In Data Restrictions, double-click.
The data restriction settings are displayed in the properties panel.
13 Select A value of, and enter 500 in value.
Observe that the “is” option in Data is changed to =.
14 Click the down arrow of Data, and select <=.
15 Click the down arrow of Column used for filter, and select Qtr1, Actual.
16 In the navigation panel, select Data Filtering, right-click, and select Apply Query.
Notice that the query results now reflect only Actual and Budget data that are less than or equalto 500.
102 Advanced Tutorial
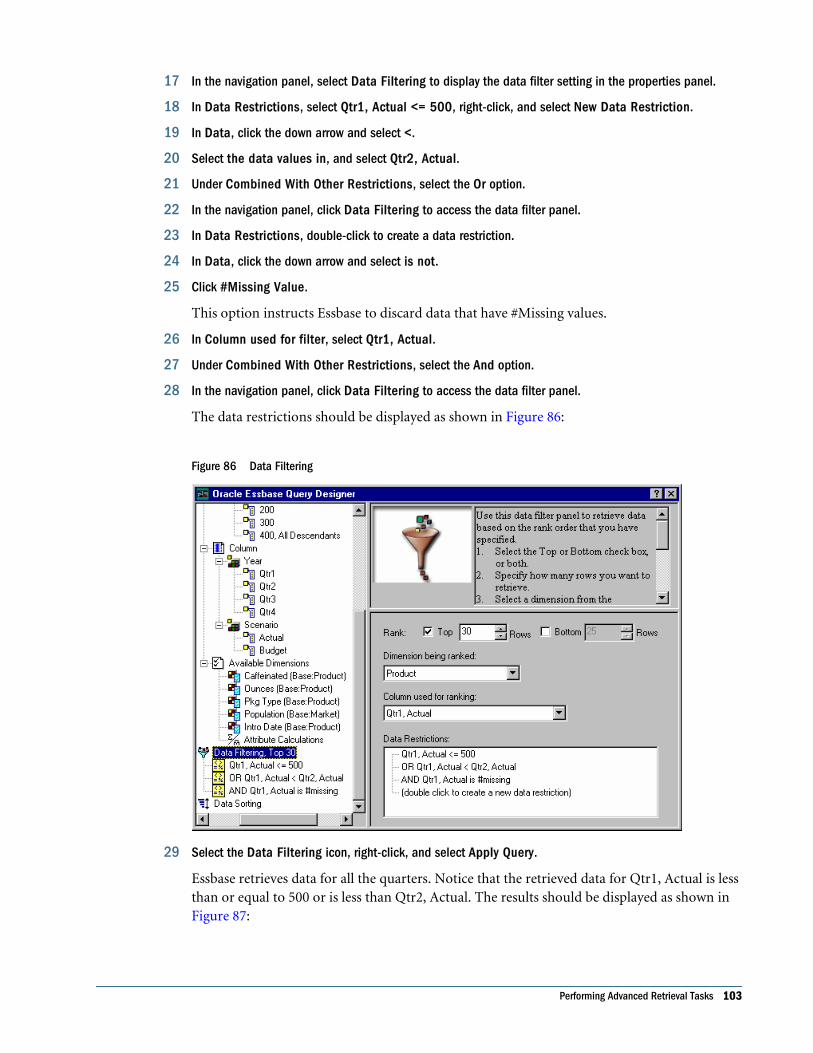
17 In the navigation panel, select Data Filtering to display the data filter setting in the properties panel.
18 In Data Restrictions, select Qtr1, Actual <= 500, right-click, and select New Data Restriction.
19 In Data, click the down arrow and select <.
20 Select the data values in, and select Qtr2, Actual.
21 Under Combined With Other Restrictions, select the Or option.
22 In the navigation panel, click Data Filtering to access the data filter panel.
23 In Data Restrictions, double-click to create a data restriction.
24 In Data, click the down arrow and select is not.
25 Click #Missing Value.
This option instructs Essbase to discard data that have #Missing values.
26 In Column used for filter, select Qtr1, Actual.
27 Under Combined With Other Restrictions, select the And option.
28 In the navigation panel, click Data Filtering to access the data filter panel.
The data restrictions should be displayed as shown in Figure 86:
Figure 86 Data Filtering
29 Select the Data Filtering icon, right-click, and select Apply Query.
Essbase retrieves data for all the quarters. Notice that the retrieved data for Qtr1, Actual is lessthan or equal to 500 or is less than Qtr2, Actual. The results should be displayed as shown inFigure 87:
Performing Advanced Retrieval Tasks 103
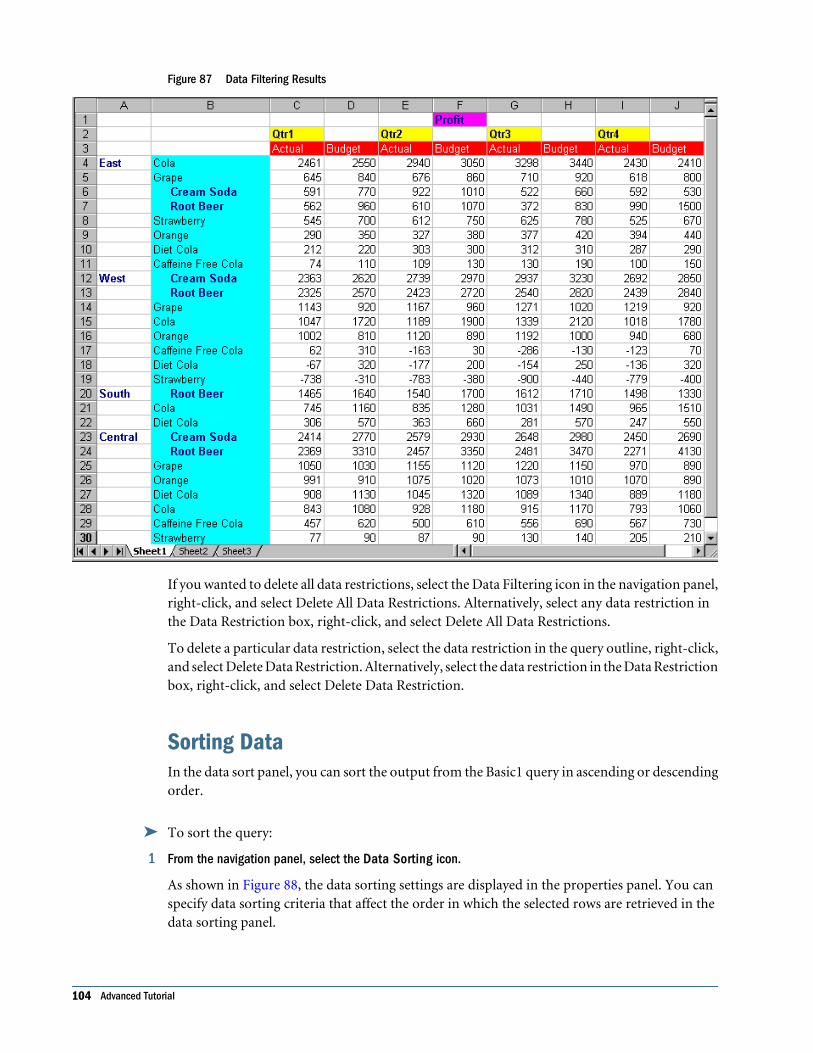
Figure 87 Data Filtering Results
If you wanted to delete all data restrictions, select the Data Filtering icon in the navigation panel,right-click, and select Delete All Data Restrictions. Alternatively, select any data restriction inthe Data Restriction box, right-click, and select Delete All Data Restrictions.
To delete a particular data restriction, select the data restriction in the query outline, right-click,and select Delete Data Restriction. Alternatively, select the data restriction in the Data Restrictionbox, right-click, and select Delete Data Restriction.
Sorting DataIn the data sort panel, you can sort the output from the Basic1 query in ascending or descendingorder.
➤ To sort the query:
1 From the navigation panel, select the Data Sorting icon.
As shown in Figure 88, the data sorting settings are displayed in the properties panel. You canspecify data sorting criteria that affect the order in which the selected rows are retrieved in thedata sorting panel.
104 Advanced Tutorial
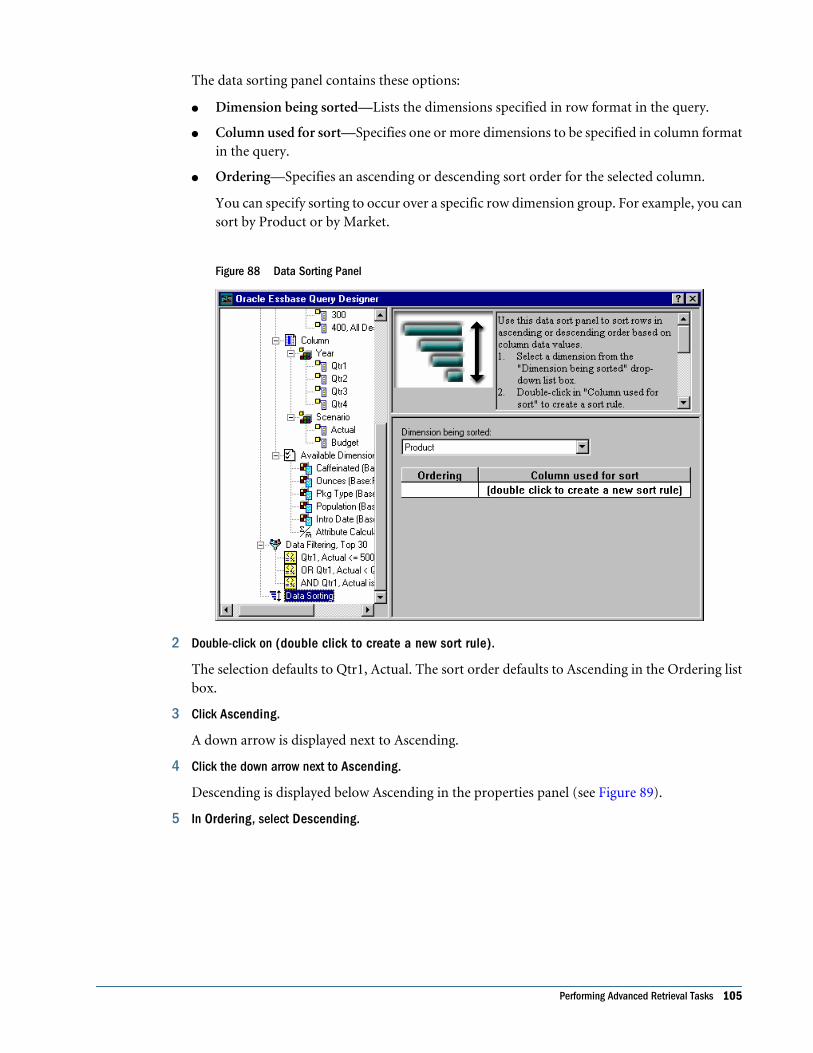
The data sorting panel contains these options:
● Dimension being sorted—Lists the dimensions specified in row format in the query.
● Column used for sort—Specifies one or more dimensions to be specified in column formatin the query.
● Ordering—Specifies an ascending or descending sort order for the selected column.
You can specify sorting to occur over a specific row dimension group. For example, you cansort by Product or by Market.
Figure 88 Data Sorting Panel
2 Double-click on (double click to create a new sort rule).
The selection defaults to Qtr1, Actual. The sort order defaults to Ascending in the Ordering listbox.
3 Click Ascending.
A down arrow is displayed next to Ascending.
4 Click the down arrow next to Ascending.
Descending is displayed below Ascending in the properties panel (see Figure 89).
5 In Ordering, select Descending.
Performing Advanced Retrieval Tasks 105
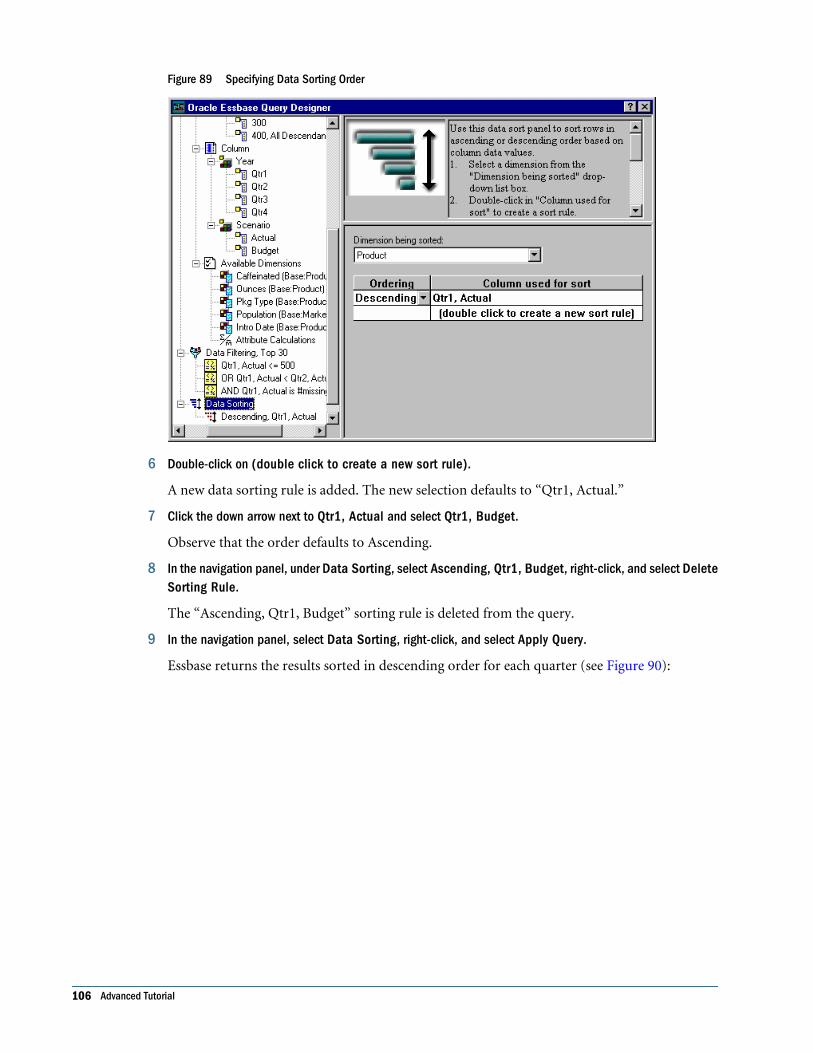
Figure 89 Specifying Data Sorting Order
6 Double-click on (double click to create a new sort rule).
A new data sorting rule is added. The new selection defaults to “Qtr1, Actual.”
7 Click the down arrow next to Qtr1, Actual and select Qtr1, Budget.
Observe that the order defaults to Ascending.
8 In the navigation panel, under Data Sorting, select Ascending, Qtr1, Budget, right-click, and select DeleteSorting Rule.
The “Ascending, Qtr1, Budget” sorting rule is deleted from the query.
9 In the navigation panel, select Data Sorting, right-click, and select Apply Query.
Essbase returns the results sorted in descending order for each quarter (see Figure 90):
106 Advanced Tutorial
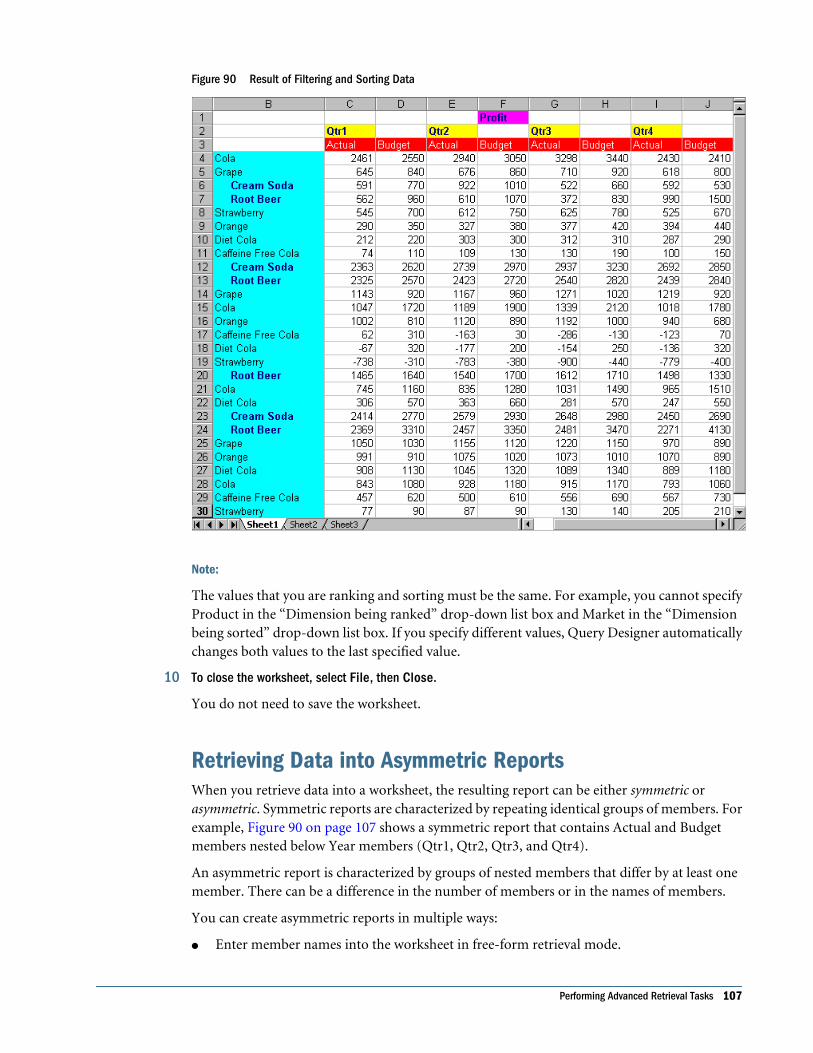
Figure 90 Result of Filtering and Sorting Data
Note:
The values that you are ranking and sorting must be the same. For example, you cannot specifyProduct in the “Dimension being ranked” drop-down list box and Market in the “Dimensionbeing sorted” drop-down list box. If you specify different values, Query Designer automaticallychanges both values to the last specified value.
10 To close the worksheet, select File, then Close.
You do not need to save the worksheet.
Retrieving Data into Asymmetric ReportsWhen you retrieve data into a worksheet, the resulting report can be either symmetric orasymmetric. Symmetric reports are characterized by repeating identical groups of members. Forexample, Figure 90 on page 107 shows a symmetric report that contains Actual and Budgetmembers nested below Year members (Qtr1, Qtr2, Qtr3, and Qtr4).
An asymmetric report is characterized by groups of nested members that differ by at least onemember. There can be a difference in the number of members or in the names of members.
You can create asymmetric reports in multiple ways:
● Enter member names into the worksheet in free-form retrieval mode.
Performing Advanced Retrieval Tasks 107
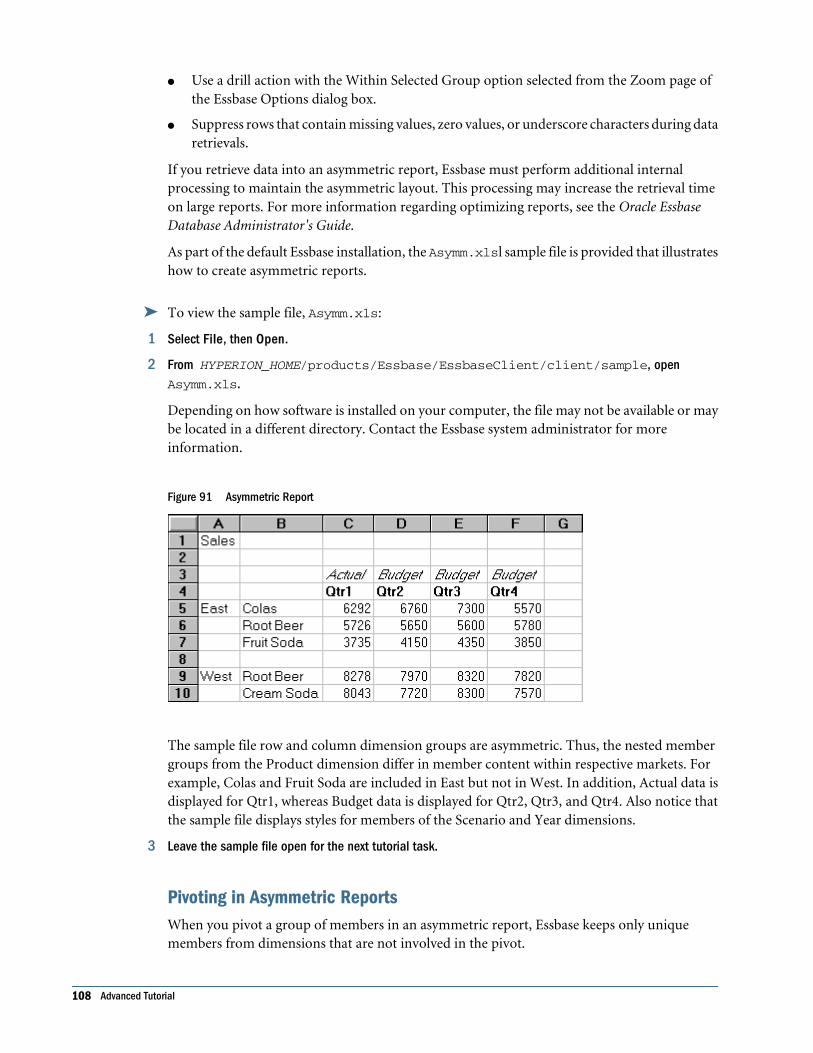
● Use a drill action with the Within Selected Group option selected from the Zoom page ofthe Essbase Options dialog box.
● Suppress rows that contain missing values, zero values, or underscore characters during dataretrievals.
If you retrieve data into an asymmetric report, Essbase must perform additional internalprocessing to maintain the asymmetric layout. This processing may increase the retrieval timeon large reports. For more information regarding optimizing reports, see the Oracle EssbaseDatabase Administrator's Guide.
As part of the default Essbase installation, the Asymm.xlsl sample file is provided that illustrateshow to create asymmetric reports.
➤ To view the sample file, Asymm.xls:
1 Select File, then Open.
2 From HYPERION_HOME/products/Essbase/EssbaseClient/client/sample, openAsymm.xls.
Depending on how software is installed on your computer, the file may not be available or maybe located in a different directory. Contact the Essbase system administrator for moreinformation.
Figure 91 Asymmetric Report
The sample file row and column dimension groups are asymmetric. Thus, the nested membergroups from the Product dimension differ in member content within respective markets. Forexample, Colas and Fruit Soda are included in East but not in West. In addition, Actual data isdisplayed for Qtr1, whereas Budget data is displayed for Qtr2, Qtr3, and Qtr4. Also notice thatthe sample file displays styles for members of the Scenario and Year dimensions.
3 Leave the sample file open for the next tutorial task.
Pivoting in Asymmetric ReportsWhen you pivot a group of members in an asymmetric report, Essbase keeps only uniquemembers from dimensions that are not involved in the pivot.
108 Advanced Tutorial
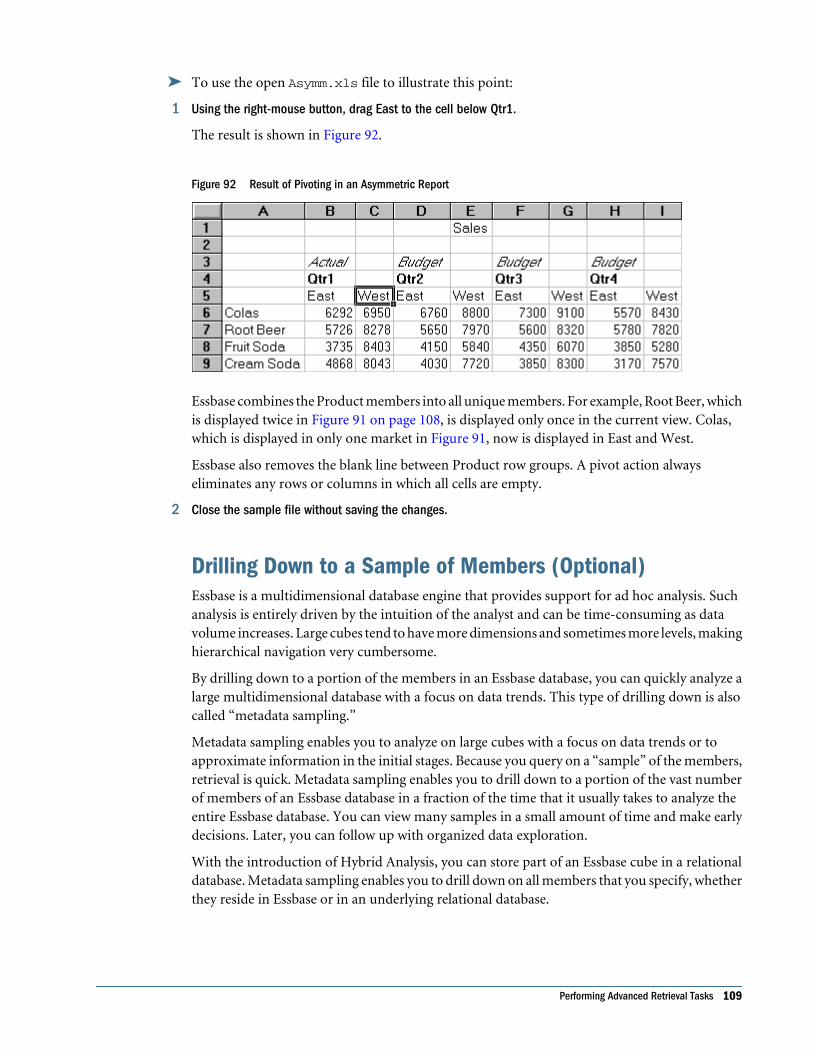
➤ To use the open Asymm.xls file to illustrate this point:
1 Using the right-mouse button, drag East to the cell below Qtr1.
The result is shown in Figure 92.
Figure 92 Result of Pivoting in an Asymmetric Report
Essbase combines the Product members into all unique members. For example, Root Beer, whichis displayed twice in Figure 91 on page 108, is displayed only once in the current view. Colas,which is displayed in only one market in Figure 91, now is displayed in East and West.
Essbase also removes the blank line between Product row groups. A pivot action alwayseliminates any rows or columns in which all cells are empty.
2 Close the sample file without saving the changes.
Drilling Down to a Sample of Members (Optional)Essbase is a multidimensional database engine that provides support for ad hoc analysis. Suchanalysis is entirely driven by the intuition of the analyst and can be time-consuming as datavolume increases. Large cubes tend to have more dimensions and sometimes more levels, makinghierarchical navigation very cumbersome.
By drilling down to a portion of the members in an Essbase database, you can quickly analyze alarge multidimensional database with a focus on data trends. This type of drilling down is alsocalled “metadata sampling.”
Metadata sampling enables you to analyze on large cubes with a focus on data trends or toapproximate information in the initial stages. Because you query on a “sample” of the members,retrieval is quick. Metadata sampling enables you to drill down to a portion of the vast numberof members of an Essbase database in a fraction of the time that it usually takes to analyze theentire Essbase database. You can view many samples in a small amount of time and make earlydecisions. Later, you can follow up with organized data exploration.
With the introduction of Hybrid Analysis, you can store part of an Essbase cube in a relationaldatabase. Metadata sampling enables you to drill down on all members that you specify, whetherthey reside in Essbase or in an underlying relational database.
Performing Advanced Retrieval Tasks 109
To drill down to a sample of members, you must to connect to a server, an application, and adatabase. Next, enable sampling in the Spreadsheet Add-in for Excel and set a percentage amountof data to query when drilling down to more detail (performing a Zoom In operation).
Note:
This task is optional. Optional tasks are for informational purposes only and do not need to beperformed as part of the tutorial.
➤ To drill down to a sample of members:
1 Select Essbase, then Sample Data (Zoom In) to enable sampling.
A check mark displayed next to the Sample Data (Zoom In) menu command indicates thatsampling is enabled.
2 Select Essbase, then Options.
3 In Essbase Options, select Zoom.
4 In Sampling Percentage, enter an integer between 1 and 100 to represent the approximate percentageamount of the Essbase cube to query during a Zoom In operation.
The default value is 100.
Note:
If Hybrid Analysis is enabled and in use, the sampling percentage also applies to queries on theunderlying relational database.
5 Click OK to save the sampling percentage integer that you entered and any other Zoom options that youhave set.
The Essbase Options dialog box is closed and you are returned to the spreadsheet.
6 In the spreadsheet, select the member on which you want to drill down.
7 Select Essbase, then Zoom In or double-click the primary mouse button.
For example, if you entered 50 in the Sampling Percentage text box, approximately 50 percentof the members from your Essbase database and, if applicable, from the specified columns ofthe relational database are queried when you select Zoom In.
Notes on Sampling
● When drilling down on Hybrid Analysis, these limitations apply:
❍ Sampling with the All Levels option is not supported with Hybrid Analysis members.
❍ Sampling with Same Level and Same Generation options are not supported.
● When sampling is enabled, a combination of the algorithms used by Essbase and thesampling percentage you set sometimes makes these scenarios possible:
❍ During a Zoom In operation, no members are retrieved. This can happen in some caseswhere a dimension is small.
110 Advanced Tutorial
❍ During a Zoom In operation, all members are retrieved. This can happen in some caseswhere the sampling percentage is very small.
Working with Formatted WorksheetsIn addition to providing flexible, ad hoc retrievals, Essbase supports retrieving data intoformatted worksheets. A worksheet can contain these formats:
● Spaces between rows and columns
● Cell values that contain text or data that is not defined in the database outline
● Member names in noncontiguous locations at the top of a worksheet
● Spreadsheet formulas (see also “Preserving Formulas When Retrieving Data” on page116)
● Visual cues (styles)
After you format and save a worksheet, you may want to retrieve and navigate through new datain the existing worksheet format. These topics provide information on working with formattedworksheets:
● “Observing the Rules for Working with Formatted Worksheets” on page 111
● “Retrieving Data into Formatted Worksheets” on page 112
● “Pivoting Data on Formatted Worksheets” on page 114
Observing the Rules for Working with Formatted WorksheetsObserve these rules when retrieving data into a formatted worksheet:
Rule 1
In the worksheet, no numeric cells can be located before the first Essbase data cell. For example,in Figure 93 on page 112, the first Essbase data cell is B6. Neither any cell in rows 1 through 5nor cell A6 can contain numeric values. Also, these cells cannot contain formulas that resolveto numeric values.
Rule 2
A cell that lies within a row or column of Essbase data cannot contain text or numeric values.For example, in Figure 93 on page 112, the cells in columns B, C, D, and F and rows 6 through9 and 11 through 14 cannot contain any nondata text or numbers, for such values may beoverwritten, or emptied, by the retrieved data. These cells can contain formulas, however, ifFormula Preservation options are used. For more information on Formula Preservation options,see “Preserving Formulas When Retrieving Data” on page 116.
Tip:
If you need to preserve text in a cell, define that text or value as a spreadsheet formula, and usethe Formula Preservation options.
Performing Advanced Retrieval Tasks 111
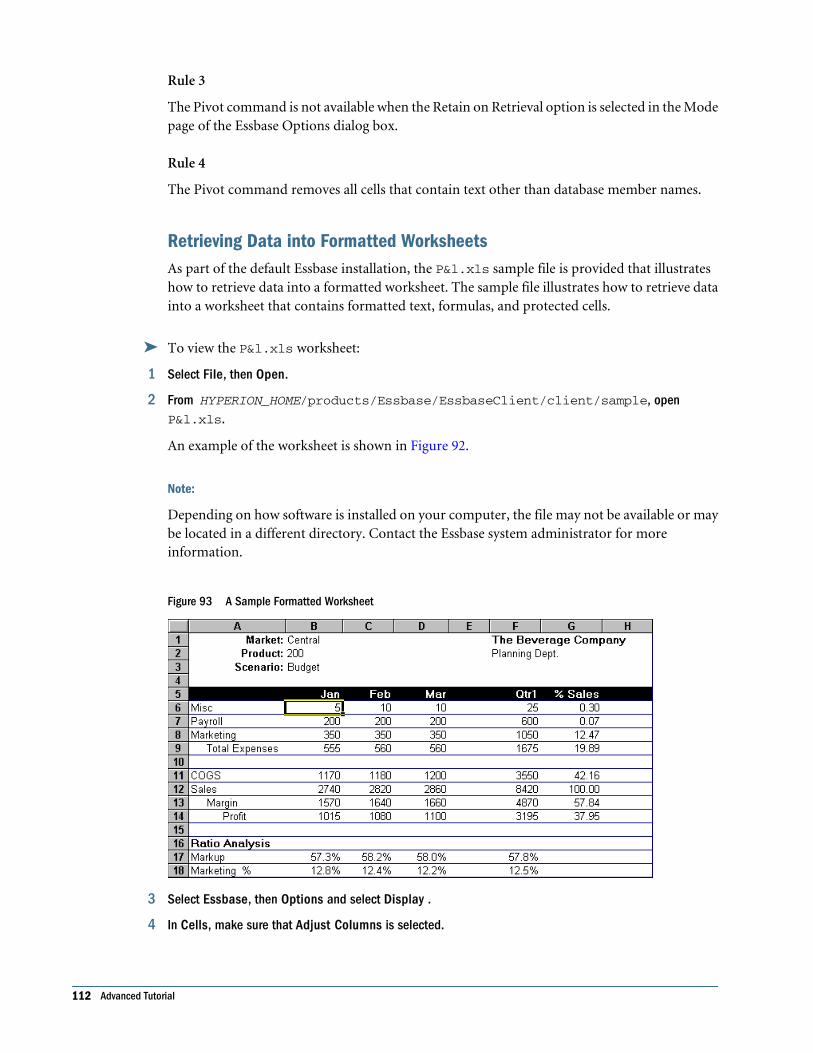
Rule 3
The Pivot command is not available when the Retain on Retrieval option is selected in the Modepage of the Essbase Options dialog box.
Rule 4
The Pivot command removes all cells that contain text other than database member names.
Retrieving Data into Formatted WorksheetsAs part of the default Essbase installation, the P&l.xls sample file is provided that illustrateshow to retrieve data into a formatted worksheet. The sample file illustrates how to retrieve datainto a worksheet that contains formatted text, formulas, and protected cells.
➤ To view the P&l.xls worksheet:
1 Select File, then Open.
2 From HYPERION_HOME/products/Essbase/EssbaseClient/client/sample, openP&l.xls.
An example of the worksheet is shown in Figure 92.
Note:
Depending on how software is installed on your computer, the file may not be available or maybe located in a different directory. Contact the Essbase system administrator for moreinformation.
Figure 93 A Sample Formatted Worksheet
3 Select Essbase, then Options and select Display .
4 In Cells, make sure that Adjust Columns is selected.
112 Advanced Tutorial
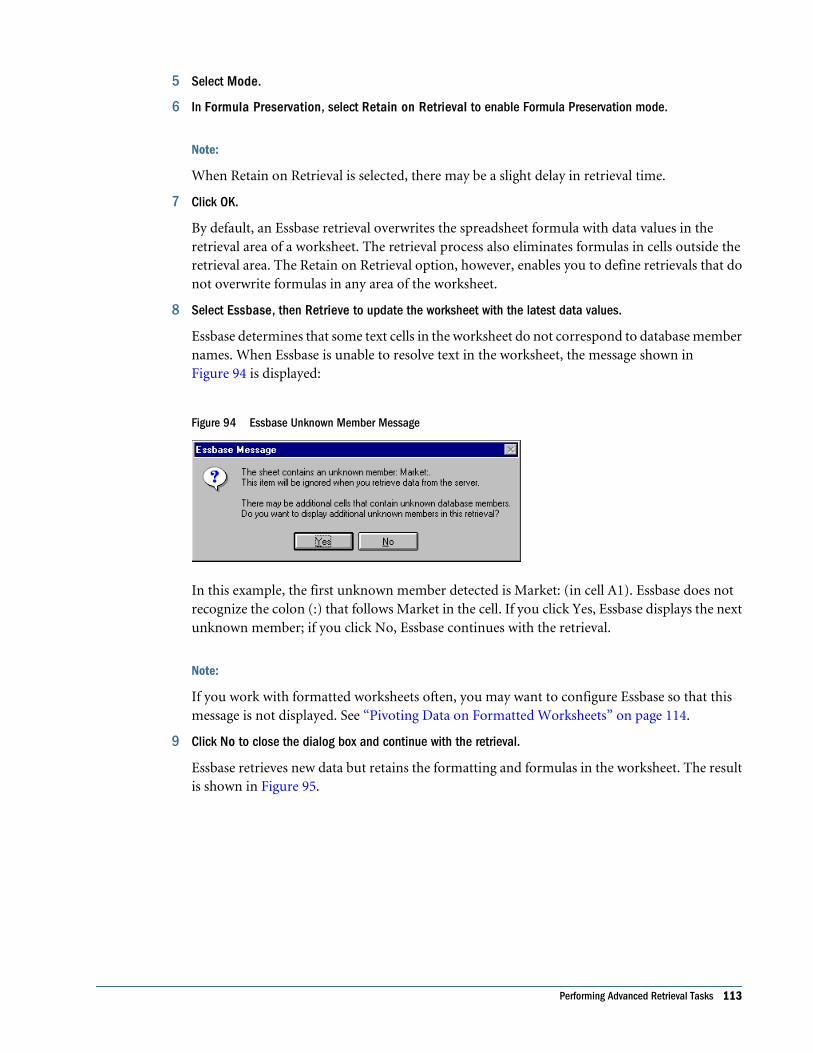
5 Select Mode.
6 In Formula Preservation, select Retain on Retrieval to enable Formula Preservation mode.
Note:
When Retain on Retrieval is selected, there may be a slight delay in retrieval time.
7 Click OK.
By default, an Essbase retrieval overwrites the spreadsheet formula with data values in theretrieval area of a worksheet. The retrieval process also eliminates formulas in cells outside theretrieval area. The Retain on Retrieval option, however, enables you to define retrievals that donot overwrite formulas in any area of the worksheet.
8 Select Essbase, then Retrieve to update the worksheet with the latest data values.
Essbase determines that some text cells in the worksheet do not correspond to database membernames. When Essbase is unable to resolve text in the worksheet, the message shown inFigure 94 is displayed:
Figure 94 Essbase Unknown Member Message
In this example, the first unknown member detected is Market: (in cell A1). Essbase does notrecognize the colon (:) that follows Market in the cell. If you click Yes, Essbase displays the nextunknown member; if you click No, Essbase continues with the retrieval.
Note:
If you work with formatted worksheets often, you may want to configure Essbase so that thismessage is not displayed. See “Pivoting Data on Formatted Worksheets” on page 114.
9 Click No to close the dialog box and continue with the retrieval.
Essbase retrieves new data but retains the formatting and formulas in the worksheet. The resultis shown in Figure 95.
Performing Advanced Retrieval Tasks 113
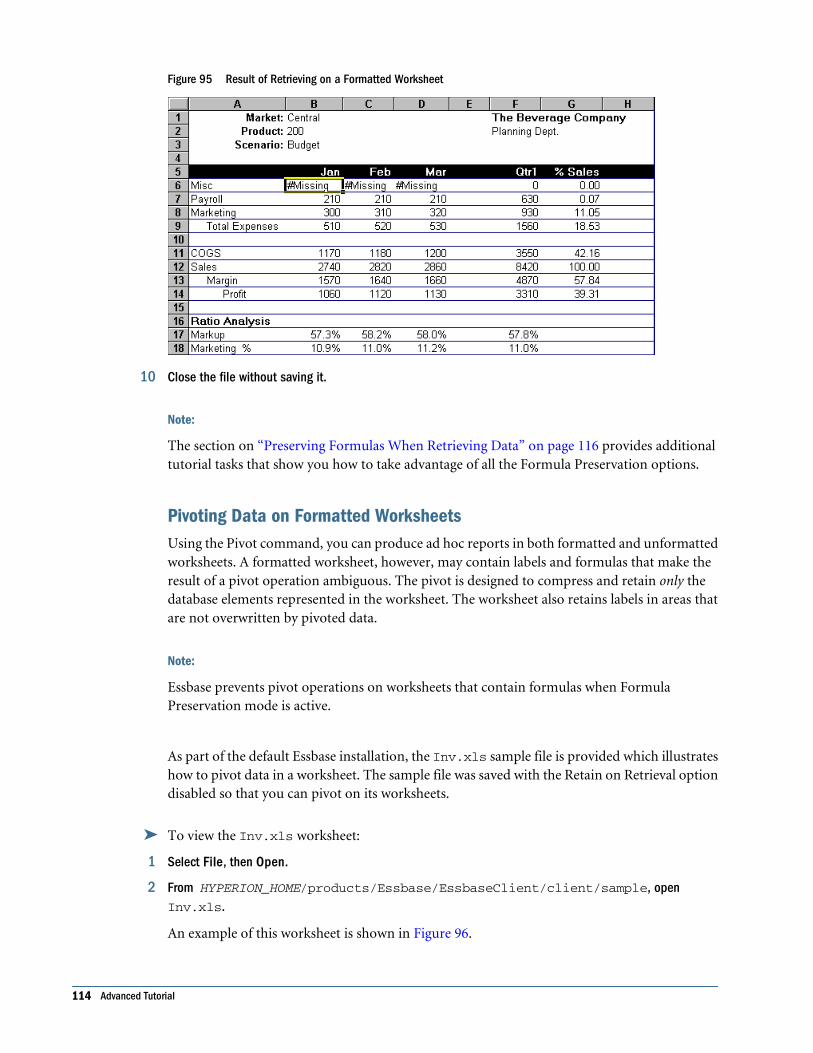
Figure 95 Result of Retrieving on a Formatted Worksheet
10 Close the file without saving it.
Note:
The section on “Preserving Formulas When Retrieving Data” on page 116 provides additionaltutorial tasks that show you how to take advantage of all the Formula Preservation options.
Pivoting Data on Formatted WorksheetsUsing the Pivot command, you can produce ad hoc reports in both formatted and unformattedworksheets. A formatted worksheet, however, may contain labels and formulas that make theresult of a pivot operation ambiguous. The pivot is designed to compress and retain only thedatabase elements represented in the worksheet. The worksheet also retains labels in areas thatare not overwritten by pivoted data.
Note:
Essbase prevents pivot operations on worksheets that contain formulas when FormulaPreservation mode is active.
As part of the default Essbase installation, the Inv.xls sample file is provided which illustrateshow to pivot data in a worksheet. The sample file was saved with the Retain on Retrieval optiondisabled so that you can pivot on its worksheets.
➤ To view the Inv.xls worksheet:
1 Select File, then Open.
2 From HYPERION_HOME/products/Essbase/EssbaseClient/client/sample, openInv.xls.
An example of this worksheet is shown in Figure 96.
114 Advanced Tutorial
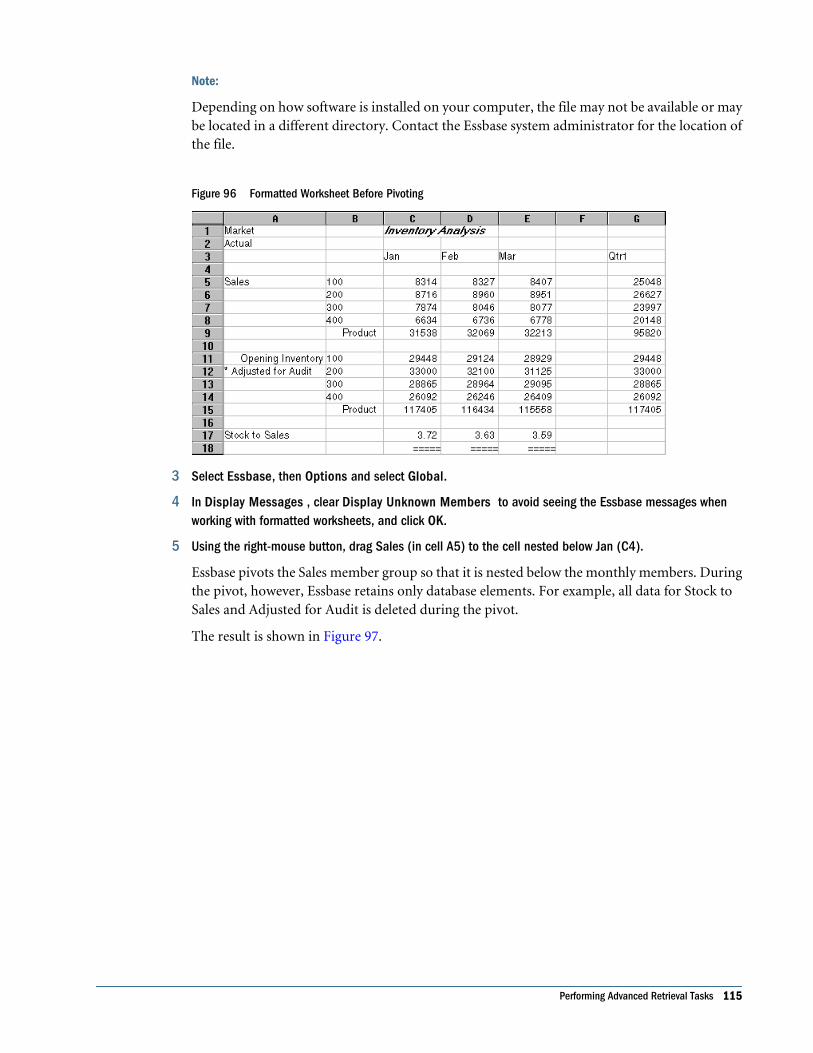
Note:
Depending on how software is installed on your computer, the file may not be available or maybe located in a different directory. Contact the Essbase system administrator for the location ofthe file.
Figure 96 Formatted Worksheet Before Pivoting
3 Select Essbase, then Options and select Global.
4 In Display Messages , clear Display Unknown Members to avoid seeing the Essbase messages whenworking with formatted worksheets, and click OK.
5 Using the right-mouse button, drag Sales (in cell A5) to the cell nested below Jan (C4).
Essbase pivots the Sales member group so that it is nested below the monthly members. Duringthe pivot, however, Essbase retains only database elements. For example, all data for Stock toSales and Adjusted for Audit is deleted during the pivot.
The result is shown in Figure 97.
Performing Advanced Retrieval Tasks 115
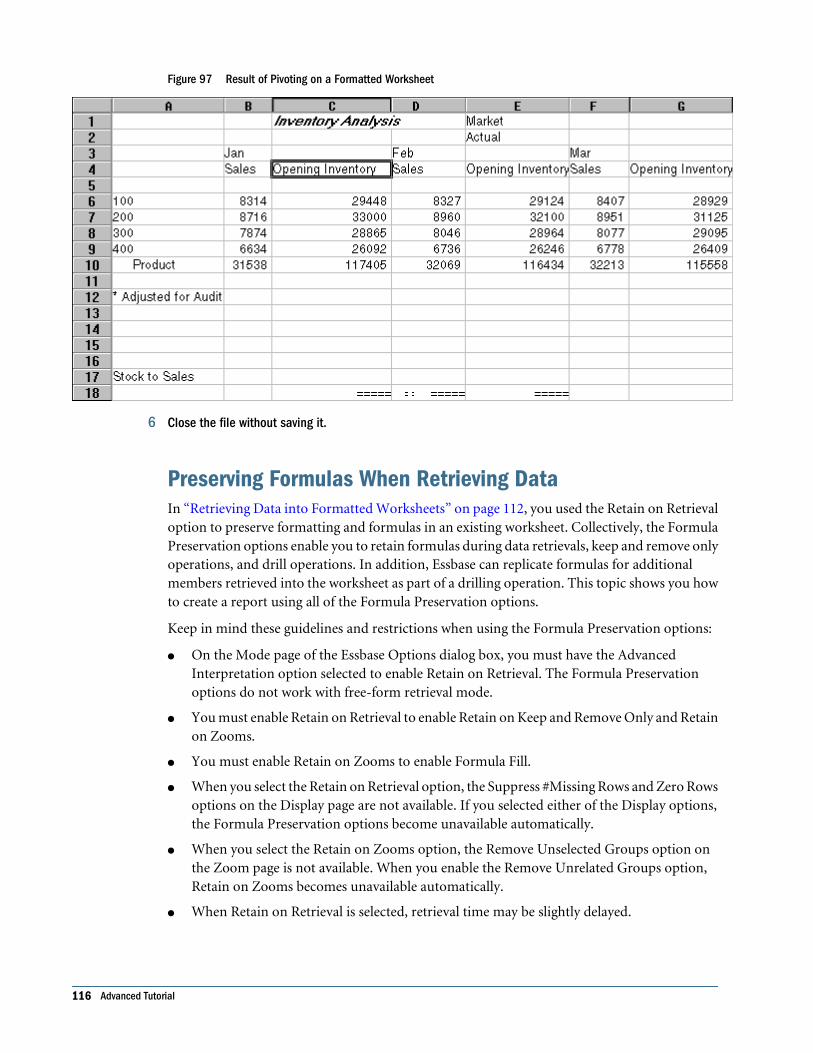
Figure 97 Result of Pivoting on a Formatted Worksheet
6 Close the file without saving it.
Preserving Formulas When Retrieving DataIn “Retrieving Data into Formatted Worksheets” on page 112, you used the Retain on Retrievaloption to preserve formatting and formulas in an existing worksheet. Collectively, the FormulaPreservation options enable you to retain formulas during data retrievals, keep and remove onlyoperations, and drill operations. In addition, Essbase can replicate formulas for additionalmembers retrieved into the worksheet as part of a drilling operation. This topic shows you howto create a report using all of the Formula Preservation options.
Keep in mind these guidelines and restrictions when using the Formula Preservation options:
● On the Mode page of the Essbase Options dialog box, you must have the AdvancedInterpretation option selected to enable Retain on Retrieval. The Formula Preservationoptions do not work with free-form retrieval mode.
● You must enable Retain on Retrieval to enable Retain on Keep and Remove Only and Retainon Zooms.
● You must enable Retain on Zooms to enable Formula Fill.
● When you select the Retain on Retrieval option, the Suppress #Missing Rows and Zero Rowsoptions on the Display page are not available. If you selected either of the Display options,the Formula Preservation options become unavailable automatically.
● When you select the Retain on Zooms option, the Remove Unselected Groups option onthe Zoom page is not available. When you enable the Remove Unrelated Groups option,Retain on Zooms becomes unavailable automatically.
● When Retain on Retrieval is selected, retrieval time may be slightly delayed.
116 Advanced Tutorial
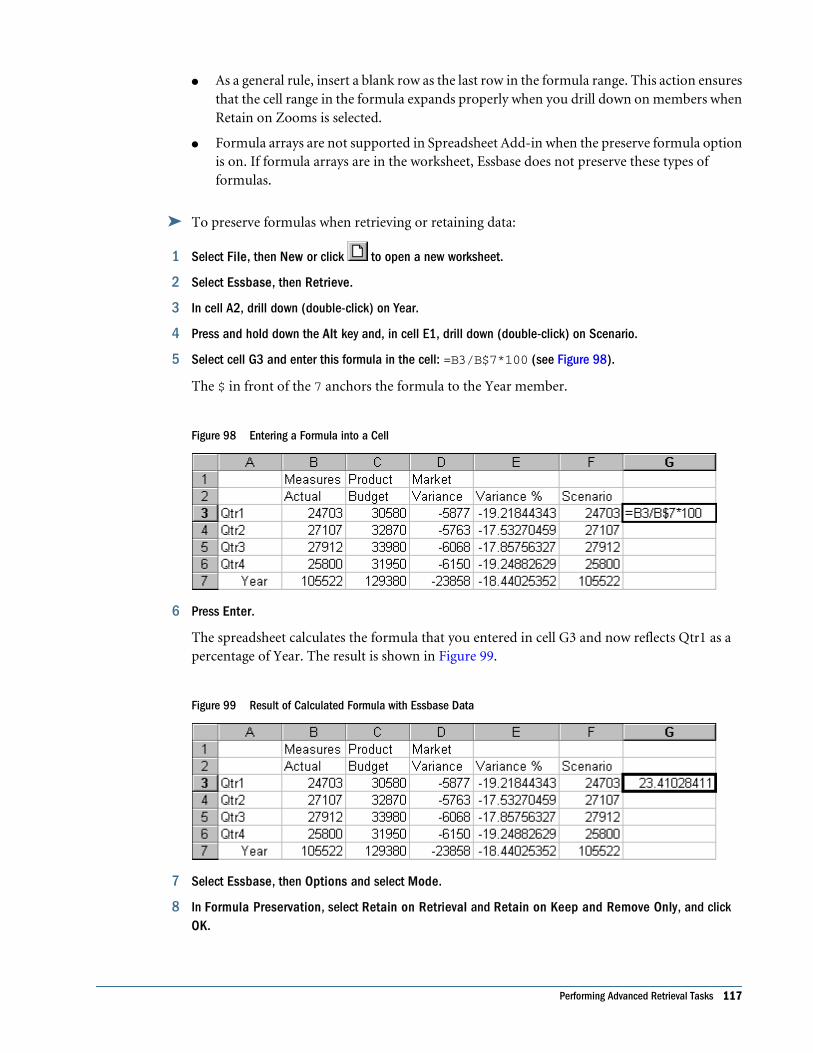
● As a general rule, insert a blank row as the last row in the formula range. This action ensuresthat the cell range in the formula expands properly when you drill down on members whenRetain on Zooms is selected.
● Formula arrays are not supported in Spreadsheet Add-in when the preserve formula optionis on. If formula arrays are in the worksheet, Essbase does not preserve these types offormulas.
➤ To preserve formulas when retrieving or retaining data:
1 Select File, then New or click to open a new worksheet.
2 Select Essbase, then Retrieve.
3 In cell A2, drill down (double-click) on Year.
4 Press and hold down the Alt key and, in cell E1, drill down (double-click) on Scenario.
5 Select cell G3 and enter this formula in the cell: =B3/B$7*100 (see Figure 98).
The $ in front of the 7 anchors the formula to the Year member.
Figure 98 Entering a Formula into a Cell
6 Press Enter.
The spreadsheet calculates the formula that you entered in cell G3 and now reflects Qtr1 as apercentage of Year. The result is shown in Figure 99.
Figure 99 Result of Calculated Formula with Essbase Data
7 Select Essbase, then Options and select Mode.
8 In Formula Preservation, select Retain on Retrieval and Retain on Keep and Remove Only, and clickOK.
Performing Advanced Retrieval Tasks 117
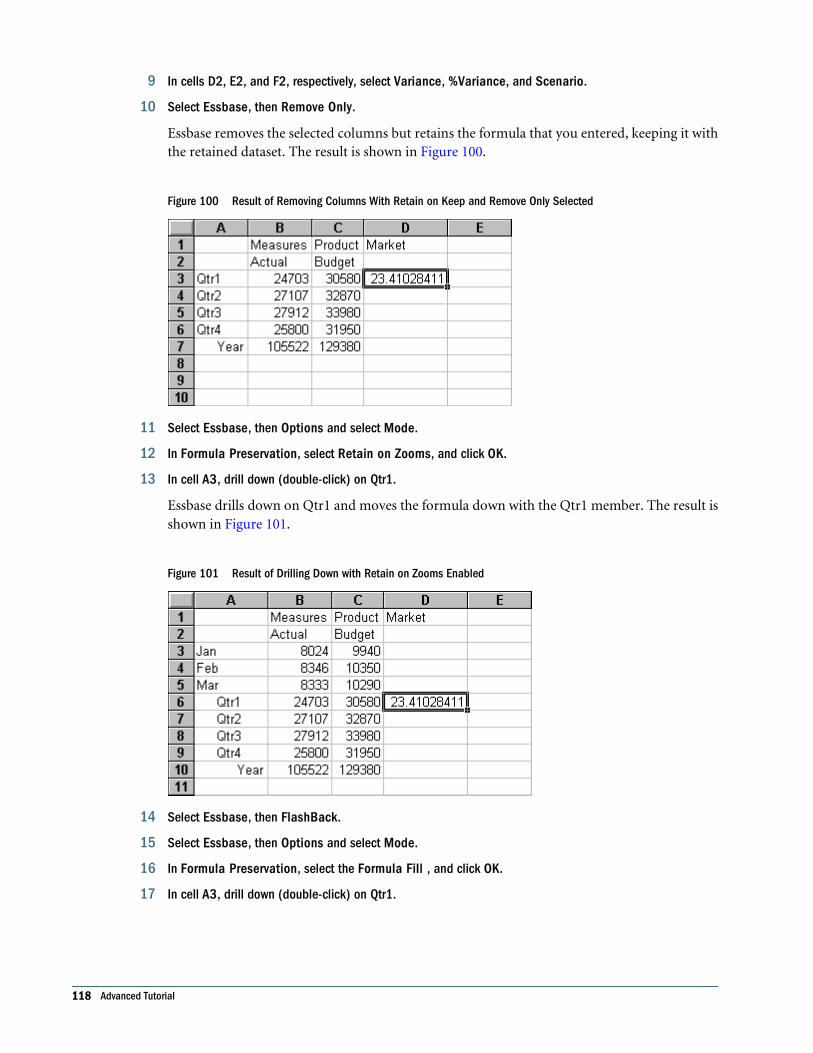
9 In cells D2, E2, and F2, respectively, select Variance, %Variance, and Scenario.
10 Select Essbase, then Remove Only.
Essbase removes the selected columns but retains the formula that you entered, keeping it withthe retained dataset. The result is shown in Figure 100.
Figure 100 Result of Removing Columns With Retain on Keep and Remove Only Selected
11 Select Essbase, then Options and select Mode.
12 In Formula Preservation, select Retain on Zooms, and click OK.
13 In cell A3, drill down (double-click) on Qtr1.
Essbase drills down on Qtr1 and moves the formula down with the Qtr1 member. The result isshown in Figure 101.
Figure 101 Result of Drilling Down with Retain on Zooms Enabled
14 Select Essbase, then FlashBack.
15 Select Essbase, then Options and select Mode.
16 In Formula Preservation, select the Formula Fill , and click OK.
17 In cell A3, drill down (double-click) on Qtr1.
118 Advanced Tutorial
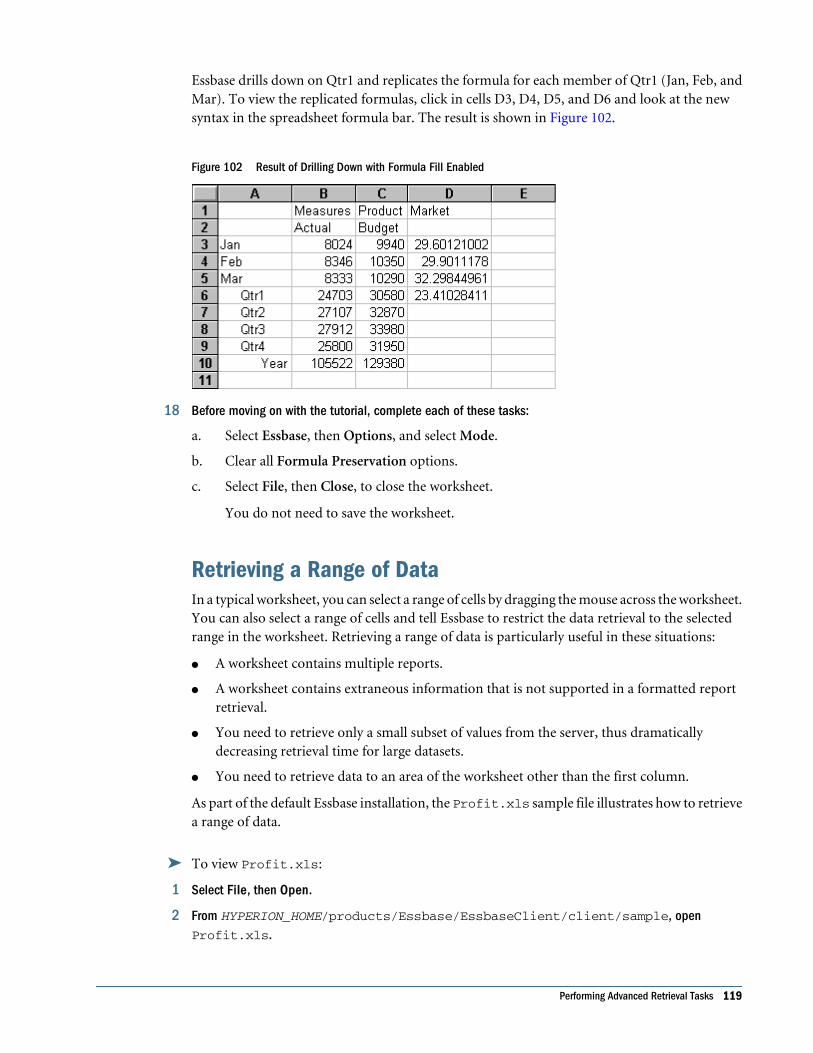
Essbase drills down on Qtr1 and replicates the formula for each member of Qtr1 (Jan, Feb, andMar). To view the replicated formulas, click in cells D3, D4, D5, and D6 and look at the newsyntax in the spreadsheet formula bar. The result is shown in Figure 102.
Figure 102 Result of Drilling Down with Formula Fill Enabled
18 Before moving on with the tutorial, complete each of these tasks:
a. Select Essbase, then Options, and select Mode.
b. Clear all Formula Preservation options.
c. Select File, then Close, to close the worksheet.
You do not need to save the worksheet.
Retrieving a Range of DataIn a typical worksheet, you can select a range of cells by dragging the mouse across the worksheet.You can also select a range of cells and tell Essbase to restrict the data retrieval to the selectedrange in the worksheet. Retrieving a range of data is particularly useful in these situations:
● A worksheet contains multiple reports.
● A worksheet contains extraneous information that is not supported in a formatted reportretrieval.
● You need to retrieve only a small subset of values from the server, thus dramaticallydecreasing retrieval time for large datasets.
● You need to retrieve data to an area of the worksheet other than the first column.
As part of the default Essbase installation, the Profit.xls sample file illustrates how to retrievea range of data.
➤ To view Profit.xls:
1 Select File, then Open.
2 From HYPERION_HOME/products/Essbase/EssbaseClient/client/sample, openProfit.xls.
Performing Advanced Retrieval Tasks 119
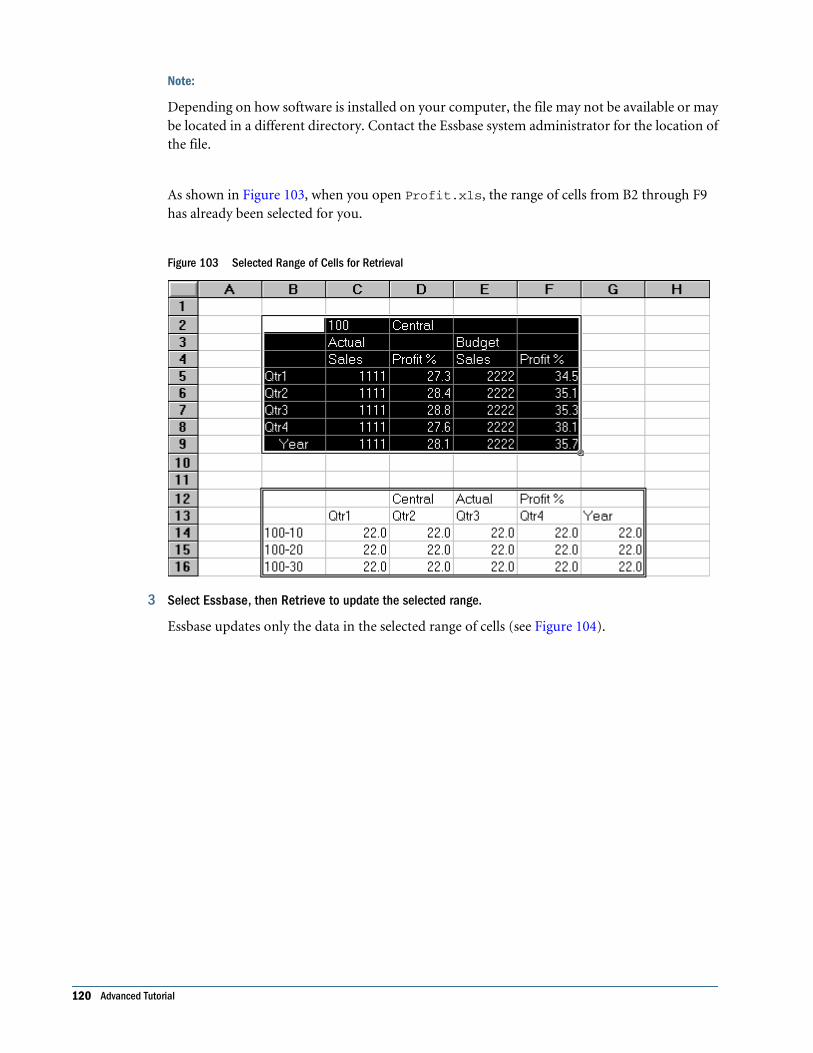
Note:
Depending on how software is installed on your computer, the file may not be available or maybe located in a different directory. Contact the Essbase system administrator for the location ofthe file.
As shown in Figure 103, when you open Profit.xls, the range of cells from B2 through F9has already been selected for you.
Figure 103 Selected Range of Cells for Retrieval
3 Select Essbase, then Retrieve to update the selected range.
Essbase updates only the data in the selected range of cells (see Figure 104).
120 Advanced Tutorial
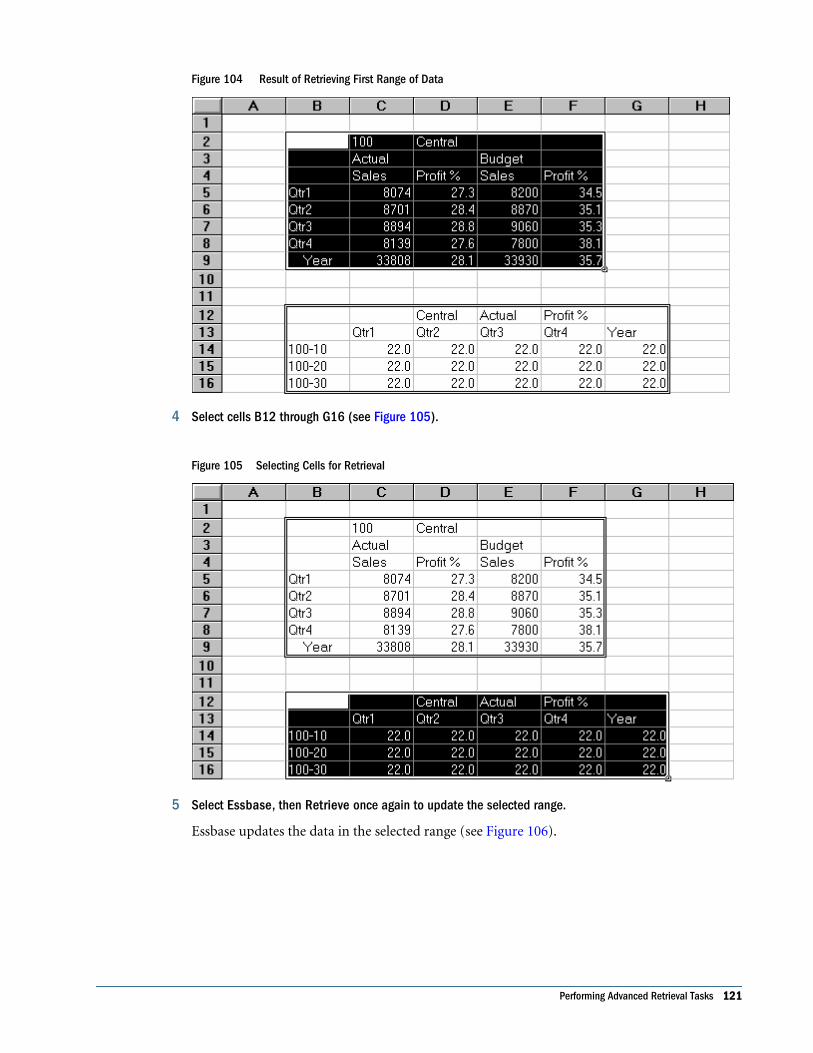
Figure 104 Result of Retrieving First Range of Data
4 Select cells B12 through G16 (see Figure 105).
Figure 105 Selecting Cells for Retrieval
5 Select Essbase, then Retrieve once again to update the selected range.
Essbase updates the data in the selected range (see Figure 106).
Performing Advanced Retrieval Tasks 121
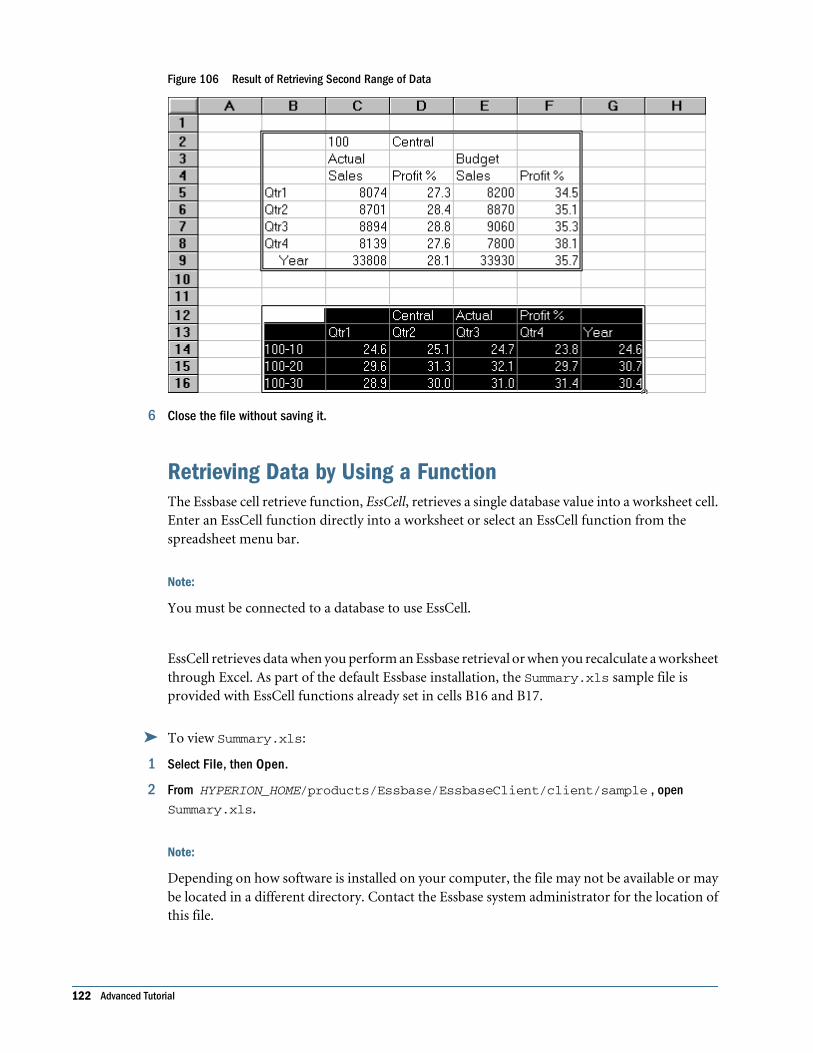
Figure 106 Result of Retrieving Second Range of Data
6 Close the file without saving it.
Retrieving Data by Using a FunctionThe Essbase cell retrieve function, EssCell, retrieves a single database value into a worksheet cell.Enter an EssCell function directly into a worksheet or select an EssCell function from thespreadsheet menu bar.
Note:
You must be connected to a database to use EssCell.
EssCell retrieves data when you perform an Essbase retrieval or when you recalculate a worksheetthrough Excel. As part of the default Essbase installation, the Summary.xls sample file isprovided with EssCell functions already set in cells B16 and B17.
➤ To view Summary.xls:
1 Select File, then Open.
2 From HYPERION_HOME/products/Essbase/EssbaseClient/client/sample , openSummary.xls.
Note:
Depending on how software is installed on your computer, the file may not be available or maybe located in a different directory. Contact the Essbase system administrator for the location ofthis file.
122 Advanced Tutorial
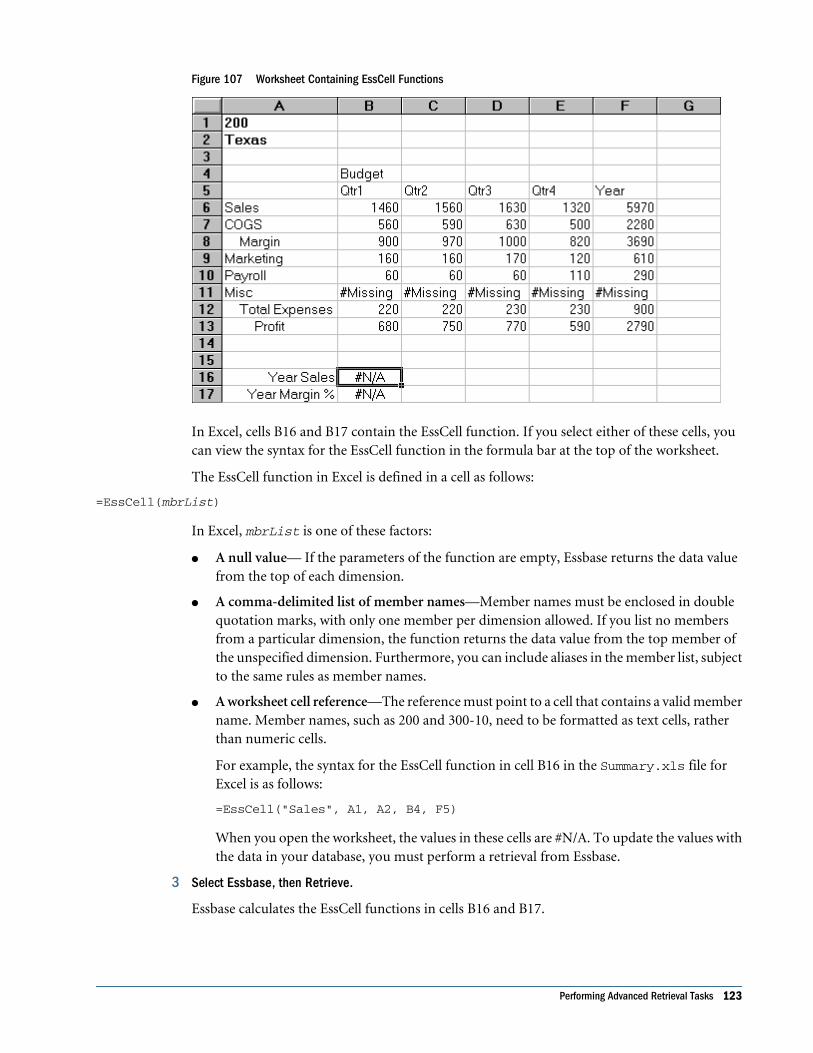
Figure 107 Worksheet Containing EssCell Functions
In Excel, cells B16 and B17 contain the EssCell function. If you select either of these cells, youcan view the syntax for the EssCell function in the formula bar at the top of the worksheet.
The EssCell function in Excel is defined in a cell as follows:
=EssCell(mbrList)
In Excel, mbrList is one of these factors:
● A null value— If the parameters of the function are empty, Essbase returns the data valuefrom the top of each dimension.
● A comma-delimited list of member names—Member names must be enclosed in doublequotation marks, with only one member per dimension allowed. If you list no membersfrom a particular dimension, the function returns the data value from the top member ofthe unspecified dimension. Furthermore, you can include aliases in the member list, subjectto the same rules as member names.
● A worksheet cell reference—The reference must point to a cell that contains a valid membername. Member names, such as 200 and 300-10, need to be formatted as text cells, ratherthan numeric cells.
For example, the syntax for the EssCell function in cell B16 in the Summary.xls file forExcel is as follows:
=EssCell("Sales", A1, A2, B4, F5)
When you open the worksheet, the values in these cells are #N/A. To update the values withthe data in your database, you must perform a retrieval from Essbase.
3 Select Essbase, then Retrieve.
Essbase calculates the EssCell functions in cells B16 and B17.
Performing Advanced Retrieval Tasks 123
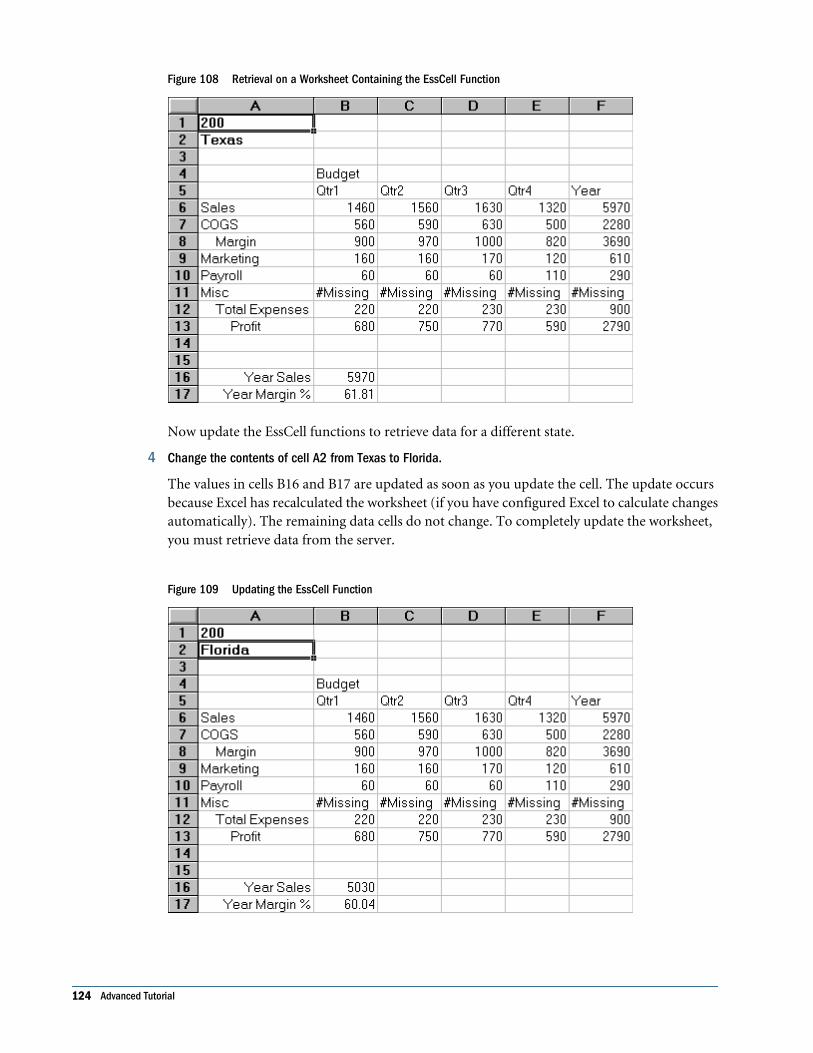
Figure 108 Retrieval on a Worksheet Containing the EssCell Function
Now update the EssCell functions to retrieve data for a different state.
4 Change the contents of cell A2 from Texas to Florida.
The values in cells B16 and B17 are updated as soon as you update the cell. The update occursbecause Excel has recalculated the worksheet (if you have configured Excel to calculate changesautomatically). The remaining data cells do not change. To completely update the worksheet,you must retrieve data from the server.
Figure 109 Updating the EssCell Function
124 Advanced Tutorial
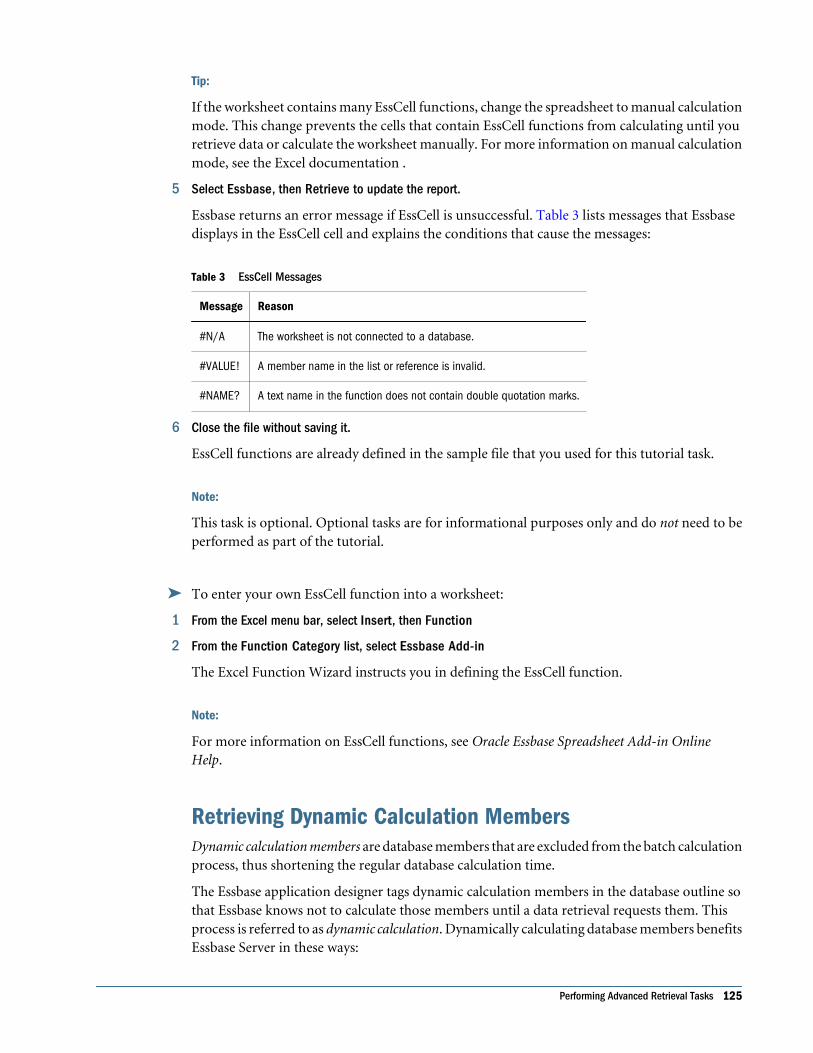
Tip:
If the worksheet contains many EssCell functions, change the spreadsheet to manual calculationmode. This change prevents the cells that contain EssCell functions from calculating until youretrieve data or calculate the worksheet manually. For more information on manual calculationmode, see the Excel documentation .
5 Select Essbase, then Retrieve to update the report.
Essbase returns an error message if EssCell is unsuccessful. Table 3 lists messages that Essbasedisplays in the EssCell cell and explains the conditions that cause the messages:
Table 3 EssCell Messages
Message Reason
#N/A The worksheet is not connected to a database.
#VALUE! A member name in the list or reference is invalid.
#NAME? A text name in the function does not contain double quotation marks.
6 Close the file without saving it.
EssCell functions are already defined in the sample file that you used for this tutorial task.
Note:
This task is optional. Optional tasks are for informational purposes only and do not need to beperformed as part of the tutorial.
➤ To enter your own EssCell function into a worksheet:
1 From the Excel menu bar, select Insert, then Function
2 From the Function Category list, select Essbase Add-in
The Excel Function Wizard instructs you in defining the EssCell function.
Note:
For more information on EssCell functions, see Oracle Essbase Spreadsheet Add-in OnlineHelp.
Retrieving Dynamic Calculation MembersDynamic calculation members are database members that are excluded from the batch calculationprocess, thus shortening the regular database calculation time.
The Essbase application designer tags dynamic calculation members in the database outline sothat Essbase knows not to calculate those members until a data retrieval requests them. Thisprocess is referred to as dynamic calculation. Dynamically calculating database members benefitsEssbase Server in these ways:
Performing Advanced Retrieval Tasks 125
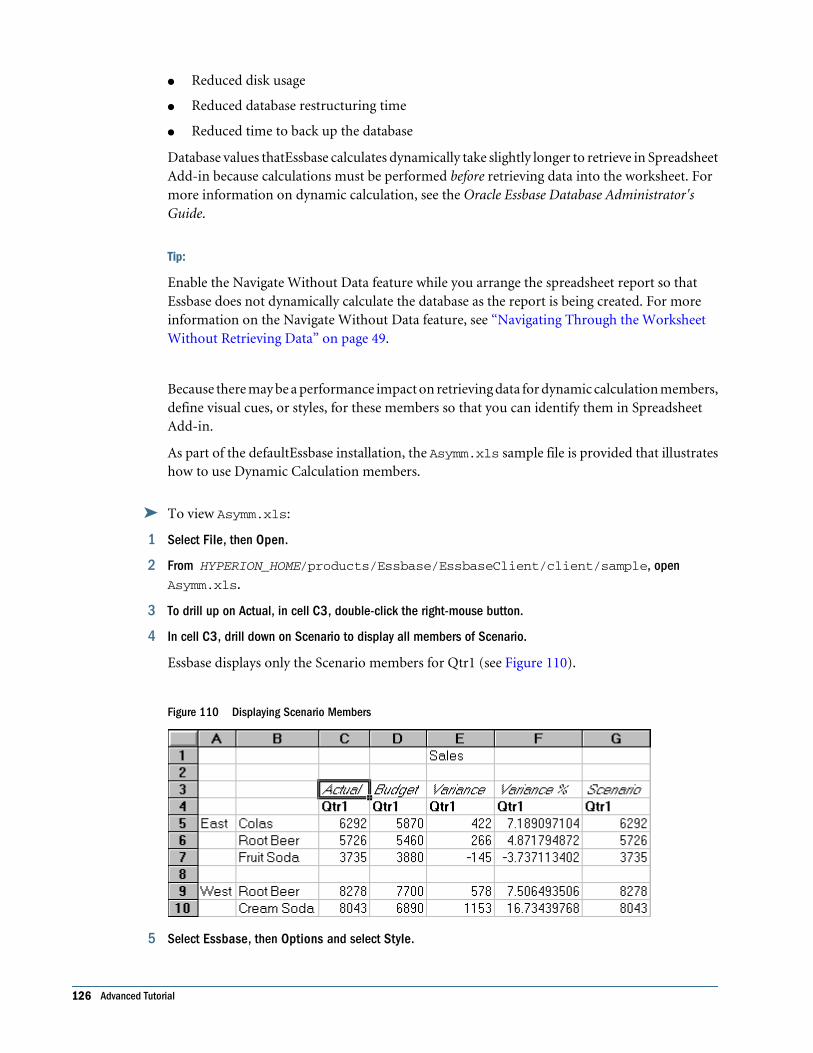
● Reduced disk usage
● Reduced database restructuring time
● Reduced time to back up the database
Database values thatEssbase calculates dynamically take slightly longer to retrieve in SpreadsheetAdd-in because calculations must be performed before retrieving data into the worksheet. Formore information on dynamic calculation, see the Oracle Essbase Database Administrator'sGuide.
Tip:
Enable the Navigate Without Data feature while you arrange the spreadsheet report so thatEssbase does not dynamically calculate the database as the report is being created. For moreinformation on the Navigate Without Data feature, see “Navigating Through the WorksheetWithout Retrieving Data” on page 49.
Because there may be a performance impact on retrieving data for dynamic calculation members,define visual cues, or styles, for these members so that you can identify them in SpreadsheetAdd-in.
As part of the defaultEssbase installation, the Asymm.xls sample file is provided that illustrateshow to use Dynamic Calculation members.
➤ To view Asymm.xls:
1 Select File, then Open.
2 From HYPERION_HOME/products/Essbase/EssbaseClient/client/sample, openAsymm.xls.
3 To drill up on Actual, in cell C3, double-click the right-mouse button.
4 In cell C3, drill down on Scenario to display all members of Scenario.
Essbase displays only the Scenario members for Qtr1 (see Figure 110).
Figure 110 Displaying Scenario Members
5 Select Essbase, then Options and select Style.
126 Advanced Tutorial
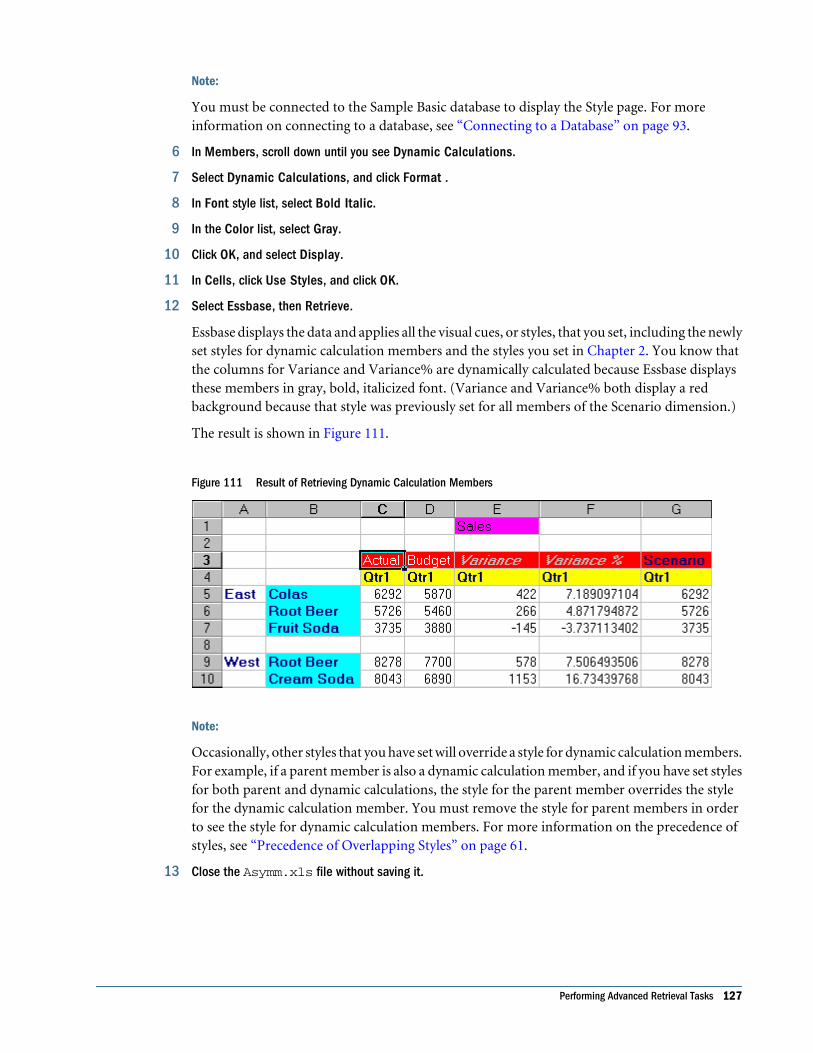
Note:
You must be connected to the Sample Basic database to display the Style page. For moreinformation on connecting to a database, see “Connecting to a Database” on page 93.
6 In Members, scroll down until you see Dynamic Calculations.
7 Select Dynamic Calculations, and click Format .
8 In Font style list, select Bold Italic.
9 In the Color list, select Gray.
10 Click OK, and select Display.
11 In Cells, click Use Styles, and click OK.
12 Select Essbase, then Retrieve.
Essbase displays the data and applies all the visual cues, or styles, that you set, including the newlyset styles for dynamic calculation members and the styles you set in Chapter 2. You know thatthe columns for Variance and Variance% are dynamically calculated because Essbase displaysthese members in gray, bold, italicized font. (Variance and Variance% both display a redbackground because that style was previously set for all members of the Scenario dimension.)
The result is shown in Figure 111.
Figure 111 Result of Retrieving Dynamic Calculation Members
Note:
Occasionally, other styles that you have set will override a style for dynamic calculation members.For example, if a parent member is also a dynamic calculation member, and if you have set stylesfor both parent and dynamic calculations, the style for the parent member overrides the stylefor the dynamic calculation member. You must remove the style for parent members in orderto see the style for dynamic calculation members. For more information on the precedence ofstyles, see “Precedence of Overlapping Styles” on page 61.
13 Close the Asymm.xls file without saving it.
Performing Advanced Retrieval Tasks 127
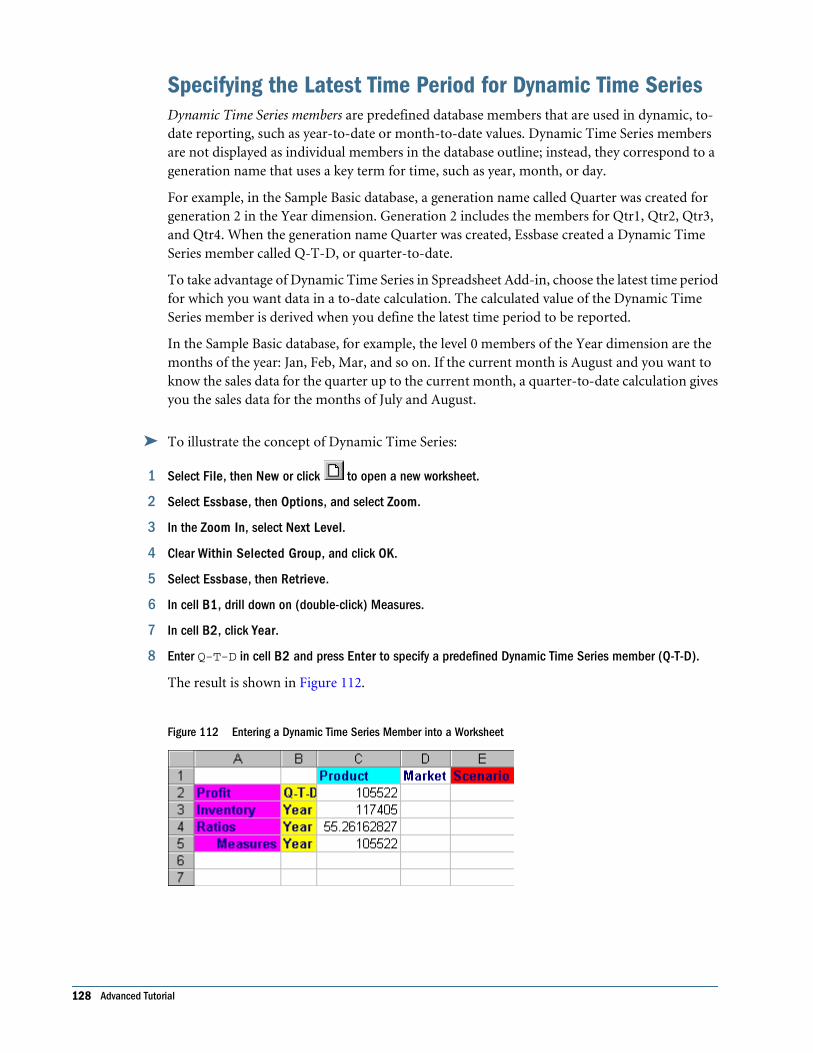
Specifying the Latest Time Period for Dynamic Time SeriesDynamic Time Series members are predefined database members that are used in dynamic, to-date reporting, such as year-to-date or month-to-date values. Dynamic Time Series membersare not displayed as individual members in the database outline; instead, they correspond to ageneration name that uses a key term for time, such as year, month, or day.
For example, in the Sample Basic database, a generation name called Quarter was created forgeneration 2 in the Year dimension. Generation 2 includes the members for Qtr1, Qtr2, Qtr3,and Qtr4. When the generation name Quarter was created, Essbase created a Dynamic TimeSeries member called Q-T-D, or quarter-to-date.
To take advantage of Dynamic Time Series in Spreadsheet Add-in, choose the latest time periodfor which you want data in a to-date calculation. The calculated value of the Dynamic TimeSeries member is derived when you define the latest time period to be reported.
In the Sample Basic database, for example, the level 0 members of the Year dimension are themonths of the year: Jan, Feb, Mar, and so on. If the current month is August and you want toknow the sales data for the quarter up to the current month, a quarter-to-date calculation givesyou the sales data for the months of July and August.
➤ To illustrate the concept of Dynamic Time Series:
1 Select File, then New or click to open a new worksheet.
2 Select Essbase, then Options, and select Zoom.
3 In the Zoom In, select Next Level.
4 Clear Within Selected Group, and click OK.
5 Select Essbase, then Retrieve.
6 In cell B1, drill down on (double-click) Measures.
7 In cell B2, click Year.
8 Enter Q-T-D in cell B2 and press Enter to specify a predefined Dynamic Time Series member (Q-T-D).
The result is shown in Figure 112.
Figure 112 Entering a Dynamic Time Series Member into a Worksheet
128 Advanced Tutorial
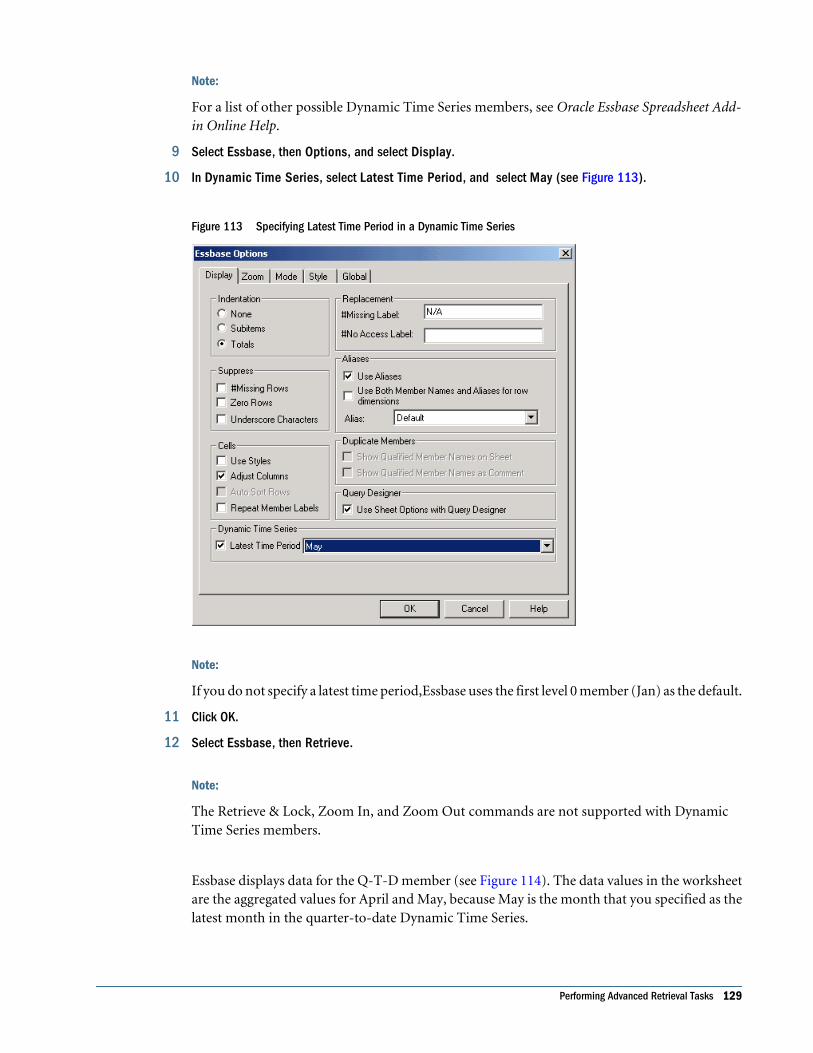
Note:
For a list of other possible Dynamic Time Series members, see Oracle Essbase Spreadsheet Add-in Online Help.
9 Select Essbase, then Options, and select Display.
10 In Dynamic Time Series, select Latest Time Period, and select May (see Figure 113).
Figure 113 Specifying Latest Time Period in a Dynamic Time Series
Note:
If you do not specify a latest time period,Essbase uses the first level 0 member (Jan) as the default.
11 Click OK.
12 Select Essbase, then Retrieve.
Note:
The Retrieve & Lock, Zoom In, and Zoom Out commands are not supported with DynamicTime Series members.
Essbase displays data for the Q-T-D member (see Figure 114). The data values in the worksheetare the aggregated values for April and May, because May is the month that you specified as thelatest month in the quarter-to-date Dynamic Time Series.
Performing Advanced Retrieval Tasks 129
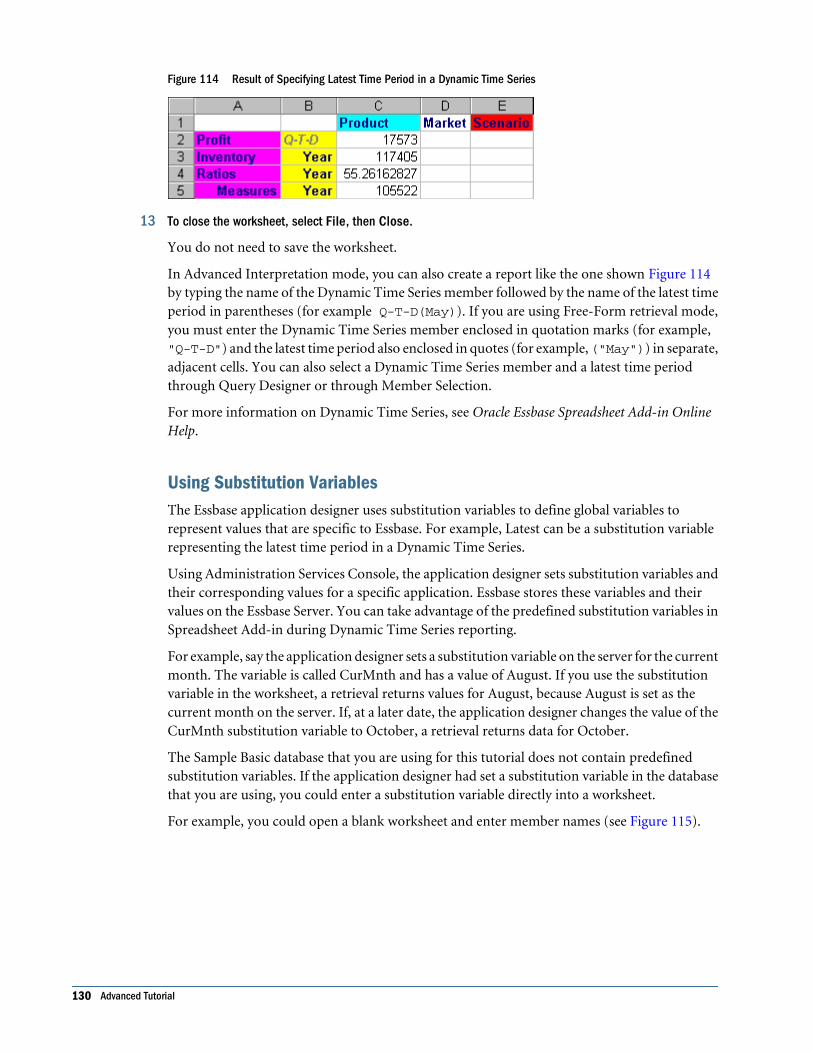
Figure 114 Result of Specifying Latest Time Period in a Dynamic Time Series
13 To close the worksheet, select File, then Close.
You do not need to save the worksheet.
In Advanced Interpretation mode, you can also create a report like the one shown Figure 114by typing the name of the Dynamic Time Series member followed by the name of the latest timeperiod in parentheses (for example Q-T-D(May)). If you are using Free-Form retrieval mode,you must enter the Dynamic Time Series member enclosed in quotation marks (for example,"Q-T-D") and the latest time period also enclosed in quotes (for example, ("May")) in separate,adjacent cells. You can also select a Dynamic Time Series member and a latest time periodthrough Query Designer or through Member Selection.
For more information on Dynamic Time Series, see Oracle Essbase Spreadsheet Add-in OnlineHelp.
Using Substitution VariablesThe Essbase application designer uses substitution variables to define global variables torepresent values that are specific to Essbase. For example, Latest can be a substitution variablerepresenting the latest time period in a Dynamic Time Series.
Using Administration Services Console, the application designer sets substitution variables andtheir corresponding values for a specific application. Essbase stores these variables and theirvalues on the Essbase Server. You can take advantage of the predefined substitution variables inSpreadsheet Add-in during Dynamic Time Series reporting.
For example, say the application designer sets a substitution variable on the server for the currentmonth. The variable is called CurMnth and has a value of August. If you use the substitutionvariable in the worksheet, a retrieval returns values for August, because August is set as thecurrent month on the server. If, at a later date, the application designer changes the value of theCurMnth substitution variable to October, a retrieval returns data for October.
The Sample Basic database that you are using for this tutorial does not contain predefinedsubstitution variables. If the application designer had set a substitution variable in the databasethat you are using, you could enter a substitution variable directly into a worksheet.
For example, you could open a blank worksheet and enter member names (see Figure 115).
130 Advanced Tutorial
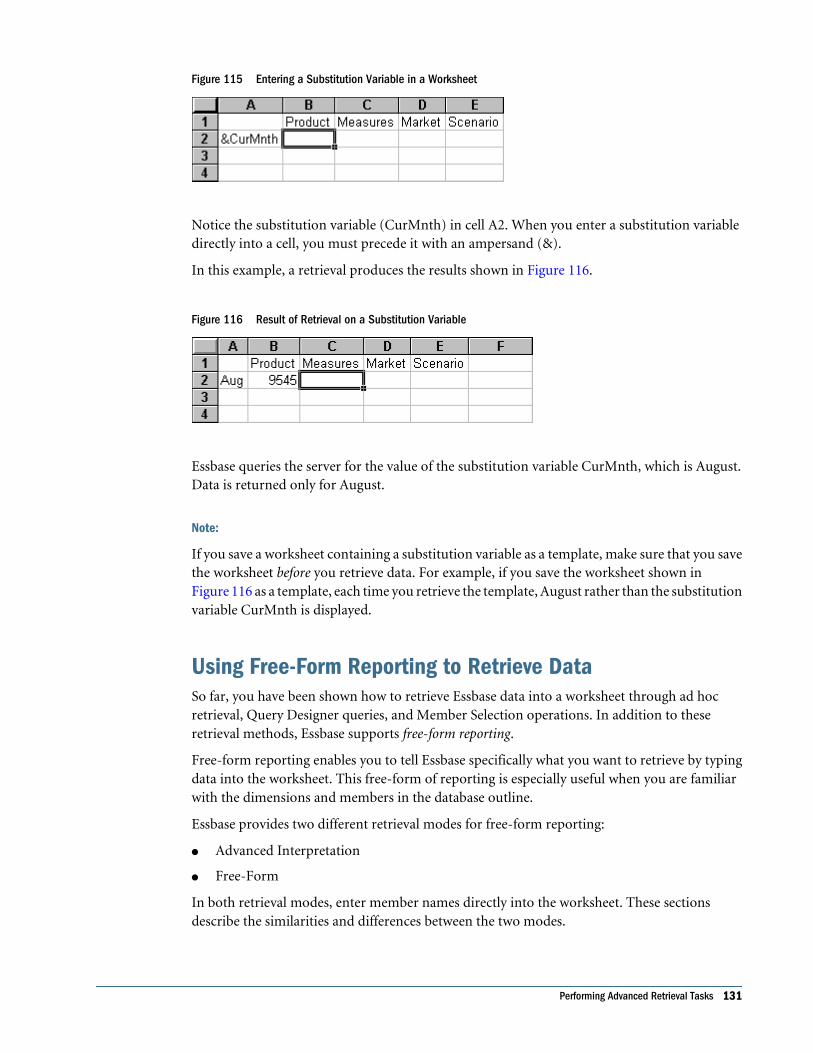
Figure 115 Entering a Substitution Variable in a Worksheet
Notice the substitution variable (CurMnth) in cell A2. When you enter a substitution variabledirectly into a cell, you must precede it with an ampersand (&).
In this example, a retrieval produces the results shown in Figure 116.
Figure 116 Result of Retrieval on a Substitution Variable
Essbase queries the server for the value of the substitution variable CurMnth, which is August.Data is returned only for August.
Note:
If you save a worksheet containing a substitution variable as a template, make sure that you savethe worksheet before you retrieve data. For example, if you save the worksheet shown inFigure 116 as a template, each time you retrieve the template, August rather than the substitutionvariable CurMnth is displayed.
Using Free-Form Reporting to Retrieve DataSo far, you have been shown how to retrieve Essbase data into a worksheet through ad hocretrieval, Query Designer queries, and Member Selection operations. In addition to theseretrieval methods, Essbase supports free-form reporting.
Free-form reporting enables you to tell Essbase specifically what you want to retrieve by typingdata into the worksheet. This free-form of reporting is especially useful when you are familiarwith the dimensions and members in the database outline.
Essbase provides two different retrieval modes for free-form reporting:
● Advanced Interpretation
● Free-Form
In both retrieval modes, enter member names directly into the worksheet. These sectionsdescribe the similarities and differences between the two modes.
Performing Advanced Retrieval Tasks 131
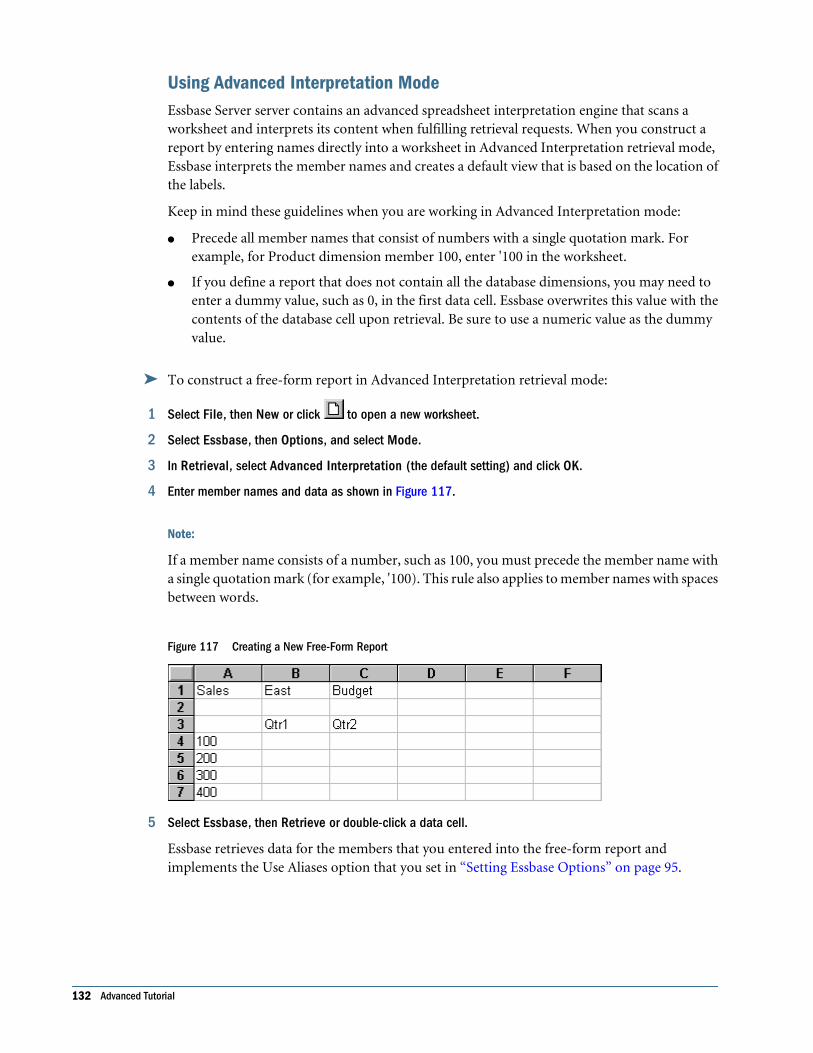
Using Advanced Interpretation ModeEssbase Server server contains an advanced spreadsheet interpretation engine that scans aworksheet and interprets its content when fulfilling retrieval requests. When you construct areport by entering names directly into a worksheet in Advanced Interpretation retrieval mode, Essbase interprets the member names and creates a default view that is based on the location ofthe labels.
Keep in mind these guidelines when you are working in Advanced Interpretation mode:
● Precede all member names that consist of numbers with a single quotation mark. Forexample, for Product dimension member 100, enter '100 in the worksheet.
● If you define a report that does not contain all the database dimensions, you may need toenter a dummy value, such as 0, in the first data cell. Essbase overwrites this value with thecontents of the database cell upon retrieval. Be sure to use a numeric value as the dummyvalue.
➤ To construct a free-form report in Advanced Interpretation retrieval mode:
1 Select File, then New or click to open a new worksheet.
2 Select Essbase, then Options, and select Mode.
3 In Retrieval, select Advanced Interpretation (the default setting) and click OK.
4 Enter member names and data as shown in Figure 117.
Note:
If a member name consists of a number, such as 100, you must precede the member name witha single quotation mark (for example, '100). This rule also applies to member names with spacesbetween words.
Figure 117 Creating a New Free-Form Report
5 Select Essbase, then Retrieve or double-click a data cell.
Essbase retrieves data for the members that you entered into the free-form report andimplements the Use Aliases option that you set in “Setting Essbase Options” on page 95.
132 Advanced Tutorial
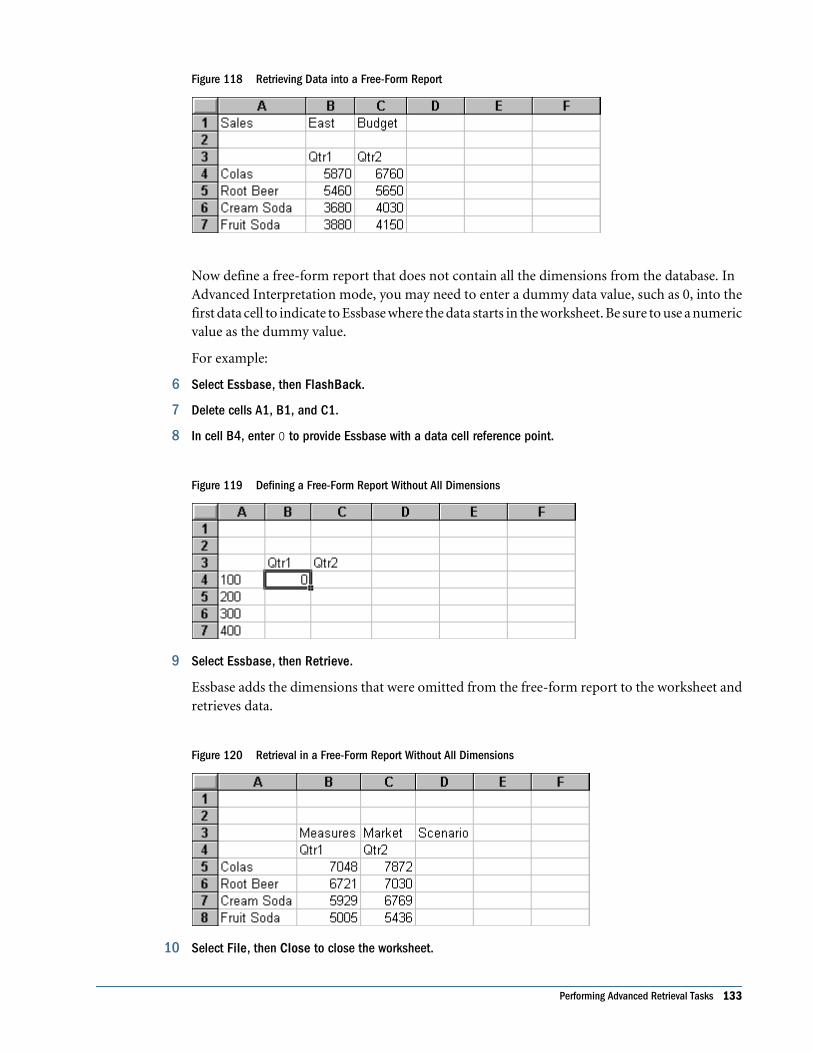
Figure 118 Retrieving Data into a Free-Form Report
Now define a free-form report that does not contain all the dimensions from the database. InAdvanced Interpretation mode, you may need to enter a dummy data value, such as 0, into thefirst data cell to indicate to Essbase where the data starts in the worksheet. Be sure to use a numericvalue as the dummy value.
For example:
6 Select Essbase, then FlashBack.
7 Delete cells A1, B1, and C1.
8 In cell B4, enter 0 to provide Essbase with a data cell reference point.
Figure 119 Defining a Free-Form Report Without All Dimensions
9 Select Essbase, then Retrieve.
Essbase adds the dimensions that were omitted from the free-form report to the worksheet andretrieves data.
Figure 120 Retrieval in a Free-Form Report Without All Dimensions
10 Select File, then Close to close the worksheet.
Performing Advanced Retrieval Tasks 133
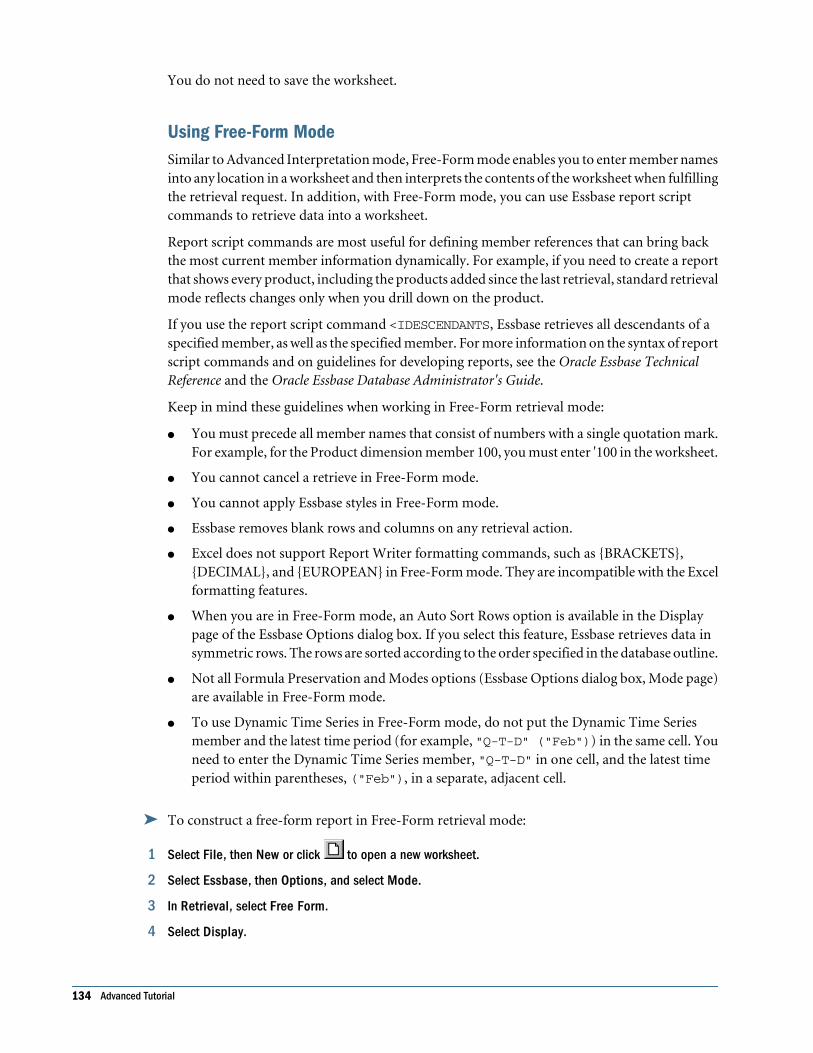
You do not need to save the worksheet.
Using Free-Form ModeSimilar to Advanced Interpretation mode, Free-Form mode enables you to enter member namesinto any location in a worksheet and then interprets the contents of the worksheet when fulfillingthe retrieval request. In addition, with Free-Form mode, you can use Essbase report scriptcommands to retrieve data into a worksheet.
Report script commands are most useful for defining member references that can bring backthe most current member information dynamically. For example, if you need to create a reportthat shows every product, including the products added since the last retrieval, standard retrievalmode reflects changes only when you drill down on the product.
If you use the report script command <IDESCENDANTS, Essbase retrieves all descendants of aspecified member, as well as the specified member. For more information on the syntax of reportscript commands and on guidelines for developing reports, see the Oracle Essbase TechnicalReference and the Oracle Essbase Database Administrator's Guide.
Keep in mind these guidelines when working in Free-Form retrieval mode:
● You must precede all member names that consist of numbers with a single quotation mark.For example, for the Product dimension member 100, you must enter '100 in the worksheet.
● You cannot cancel a retrieve in Free-Form mode.
● You cannot apply Essbase styles in Free-Form mode.
● Essbase removes blank rows and columns on any retrieval action.
● Excel does not support Report Writer formatting commands, such as {BRACKETS},{DECIMAL}, and {EUROPEAN} in Free-Form mode. They are incompatible with the Excelformatting features.
● When you are in Free-Form mode, an Auto Sort Rows option is available in the Displaypage of the Essbase Options dialog box. If you select this feature, Essbase retrieves data insymmetric rows. The rows are sorted according to the order specified in the database outline.
● Not all Formula Preservation and Modes options (Essbase Options dialog box, Mode page)are available in Free-Form mode.
● To use Dynamic Time Series in Free-Form mode, do not put the Dynamic Time Seriesmember and the latest time period (for example, "Q-T-D" ("Feb")) in the same cell. Youneed to enter the Dynamic Time Series member, "Q-T-D" in one cell, and the latest timeperiod within parentheses, ("Feb"), in a separate, adjacent cell.
➤ To construct a free-form report in Free-Form retrieval mode:
1 Select File, then New or click to open a new worksheet.
2 Select Essbase, then Options, and select Mode.
3 In Retrieval, select Free Form.
4 Select Display.
134 Advanced Tutorial
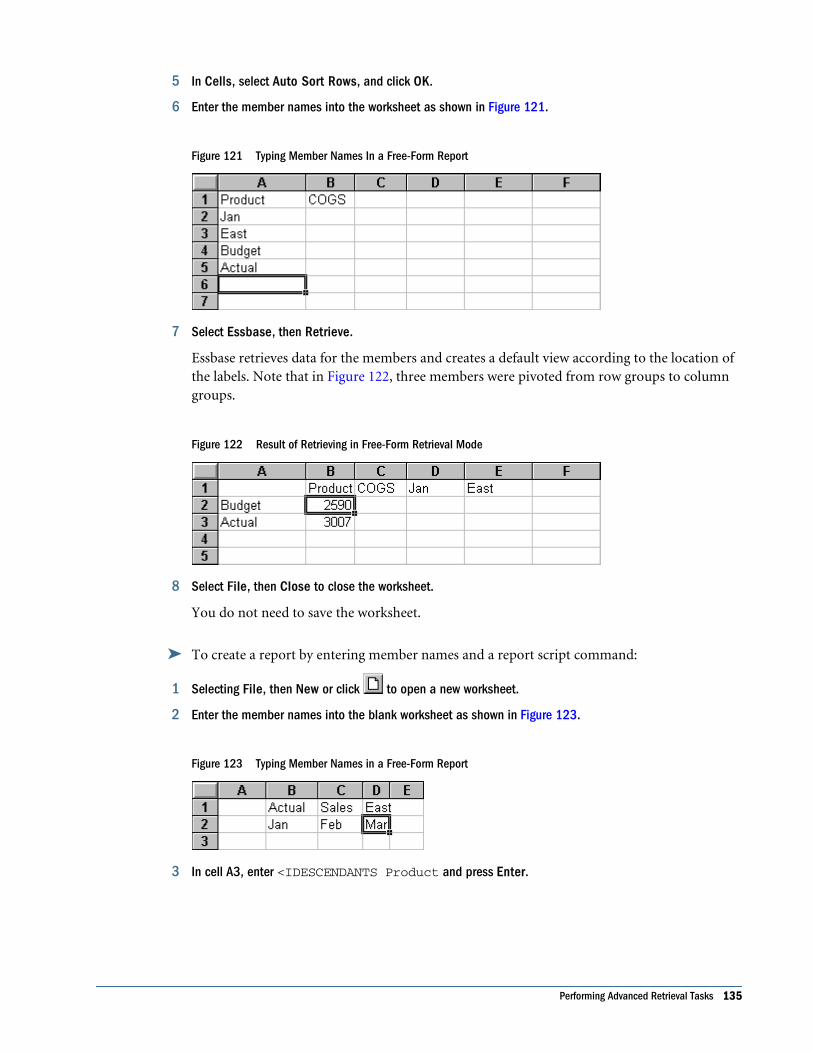
5 In Cells, select Auto Sort Rows, and click OK.
6 Enter the member names into the worksheet as shown in Figure 121.
Figure 121 Typing Member Names In a Free-Form Report
7 Select Essbase, then Retrieve.
Essbase retrieves data for the members and creates a default view according to the location ofthe labels. Note that in Figure 122, three members were pivoted from row groups to columngroups.
Figure 122 Result of Retrieving in Free-Form Retrieval Mode
8 Select File, then Close to close the worksheet.
You do not need to save the worksheet.
➤ To create a report by entering member names and a report script command:
1 Selecting File, then New or click to open a new worksheet.
2 Enter the member names into the blank worksheet as shown in Figure 123.
Figure 123 Typing Member Names in a Free-Form Report
3 In cell A3, enter <IDESCENDANTS Product and press Enter.
Performing Advanced Retrieval Tasks 135
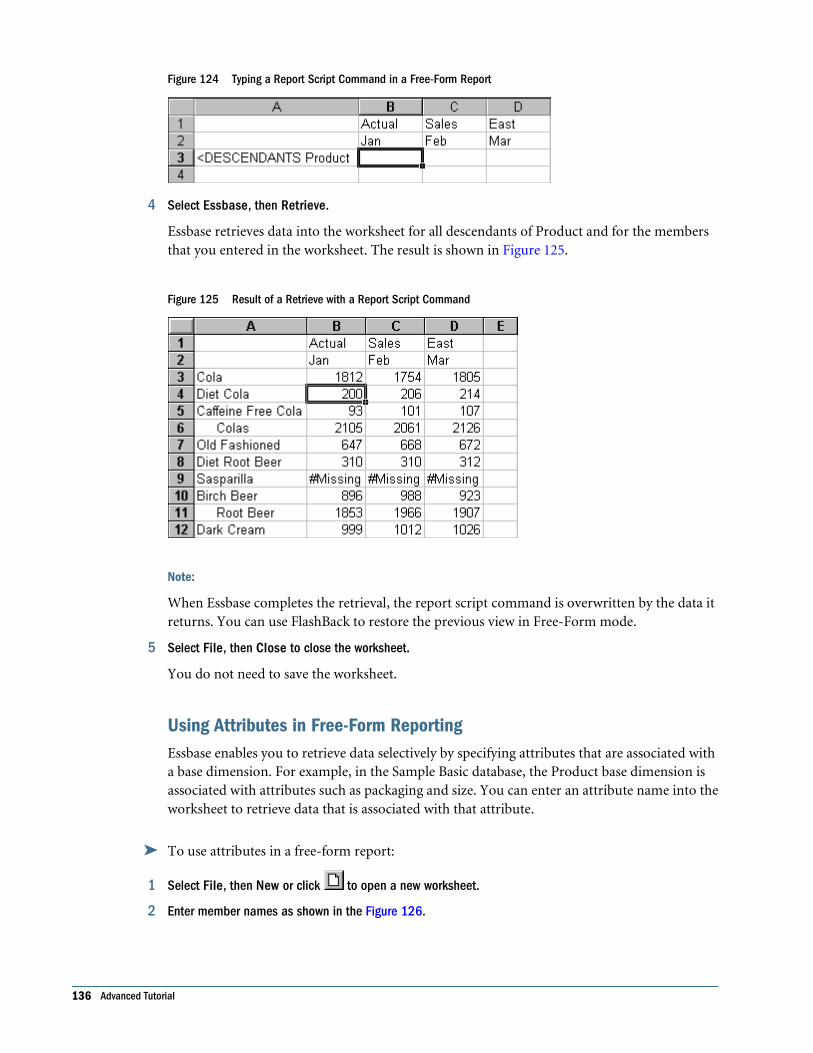
Figure 124 Typing a Report Script Command in a Free-Form Report
4 Select Essbase, then Retrieve.
Essbase retrieves data into the worksheet for all descendants of Product and for the membersthat you entered in the worksheet. The result is shown in Figure 125.
Figure 125 Result of a Retrieve with a Report Script Command
Note:
When Essbase completes the retrieval, the report script command is overwritten by the data itreturns. You can use FlashBack to restore the previous view in Free-Form mode.
5 Select File, then Close to close the worksheet.
You do not need to save the worksheet.
Using Attributes in Free-Form ReportingEssbase enables you to retrieve data selectively by specifying attributes that are associated witha base dimension. For example, in the Sample Basic database, the Product base dimension isassociated with attributes such as packaging and size. You can enter an attribute name into theworksheet to retrieve data that is associated with that attribute.
➤ To use attributes in a free-form report:
1 Select File, then New or click to open a new worksheet.
2 Enter member names as shown in the Figure 126.
136 Advanced Tutorial
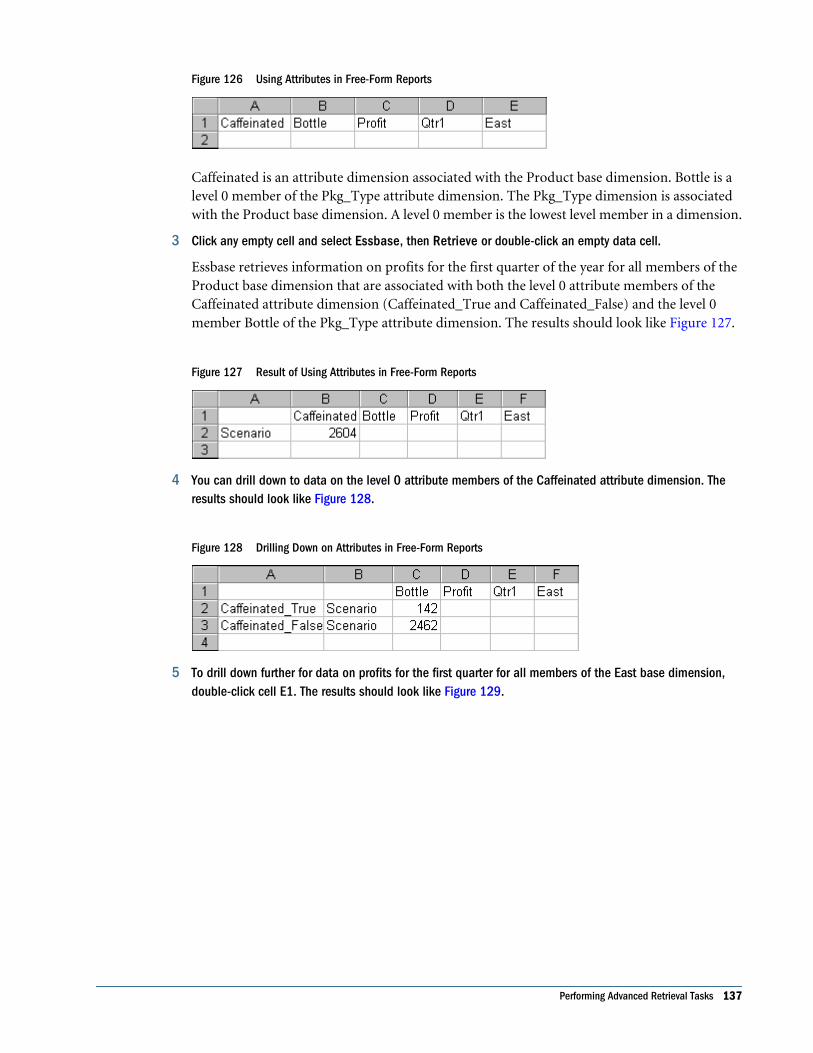
Figure 126 Using Attributes in Free-Form Reports
Caffeinated is an attribute dimension associated with the Product base dimension. Bottle is alevel 0 member of the Pkg_Type attribute dimension. The Pkg_Type dimension is associatedwith the Product base dimension. A level 0 member is the lowest level member in a dimension.
3 Click any empty cell and select Essbase, then Retrieve or double-click an empty data cell.
Essbase retrieves information on profits for the first quarter of the year for all members of theProduct base dimension that are associated with both the level 0 attribute members of theCaffeinated attribute dimension (Caffeinated_True and Caffeinated_False) and the level 0member Bottle of the Pkg_Type attribute dimension. The results should look like Figure 127.
Figure 127 Result of Using Attributes in Free-Form Reports
4 You can drill down to data on the level 0 attribute members of the Caffeinated attribute dimension. Theresults should look like Figure 128.
Figure 128 Drilling Down on Attributes in Free-Form Reports
5 To drill down further for data on profits for the first quarter for all members of the East base dimension,double-click cell E1. The results should look like Figure 129.
Performing Advanced Retrieval Tasks 137
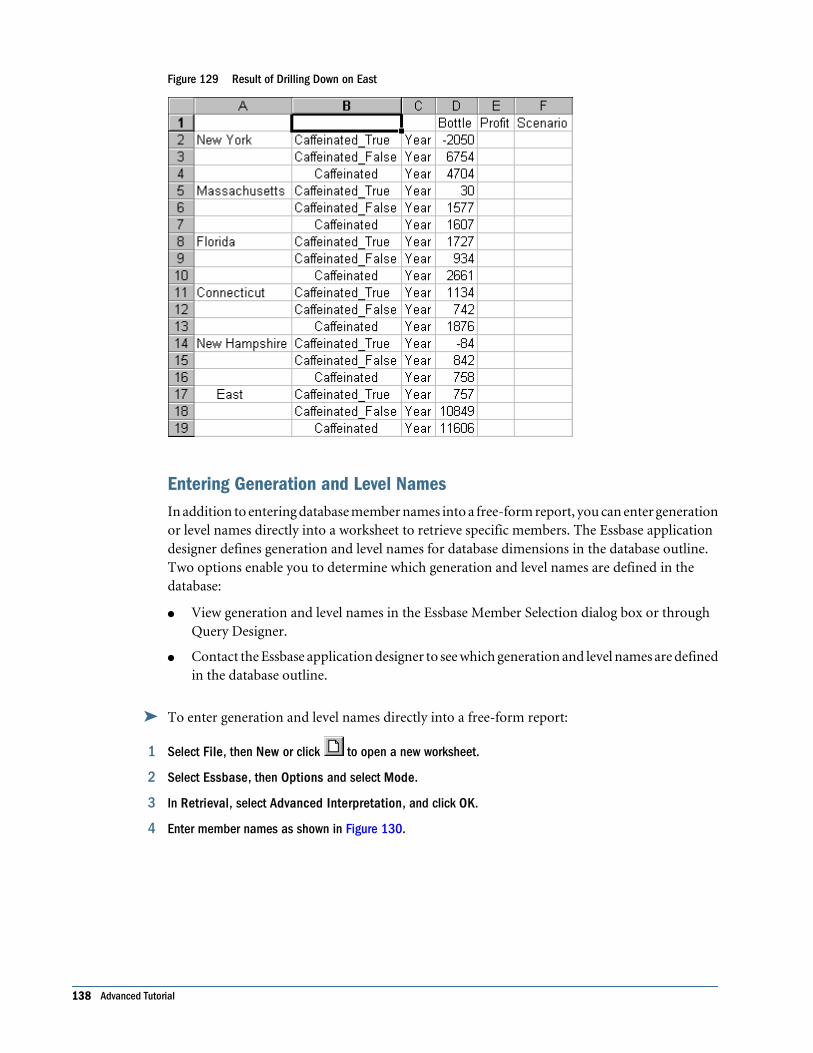
Figure 129 Result of Drilling Down on East
Entering Generation and Level NamesIn addition to entering database member names into a free-form report, you can enter generationor level names directly into a worksheet to retrieve specific members. The Essbase applicationdesigner defines generation and level names for database dimensions in the database outline.Two options enable you to determine which generation and level names are defined in thedatabase:
● View generation and level names in the Essbase Member Selection dialog box or throughQuery Designer.
● Contact the Essbase application designer to see which generation and level names are definedin the database outline.
➤ To enter generation and level names directly into a free-form report:
1 Select File, then New or click to open a new worksheet.
2 Select Essbase, then Options and select Mode.
3 In Retrieval, select Advanced Interpretation, and click OK.
4 Enter member names as shown in Figure 130.
138 Advanced Tutorial
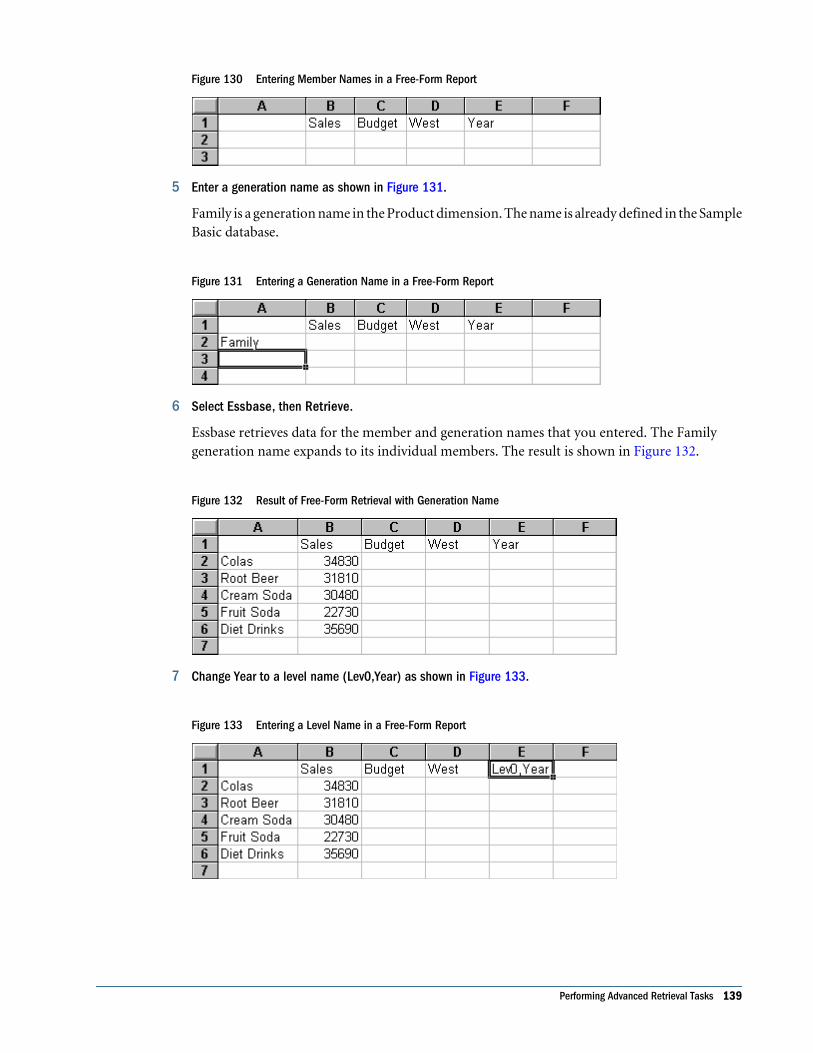
Figure 130 Entering Member Names in a Free-Form Report
5 Enter a generation name as shown in Figure 131.
Family is a generation name in the Product dimension. The name is already defined in the SampleBasic database.
Figure 131 Entering a Generation Name in a Free-Form Report
6 Select Essbase, then Retrieve.
Essbase retrieves data for the member and generation names that you entered. The Familygeneration name expands to its individual members. The result is shown in Figure 132.
Figure 132 Result of Free-Form Retrieval with Generation Name
7 Change Year to a level name (Lev0,Year) as shown in Figure 133.
Figure 133 Entering a Level Name in a Free-Form Report
Performing Advanced Retrieval Tasks 139
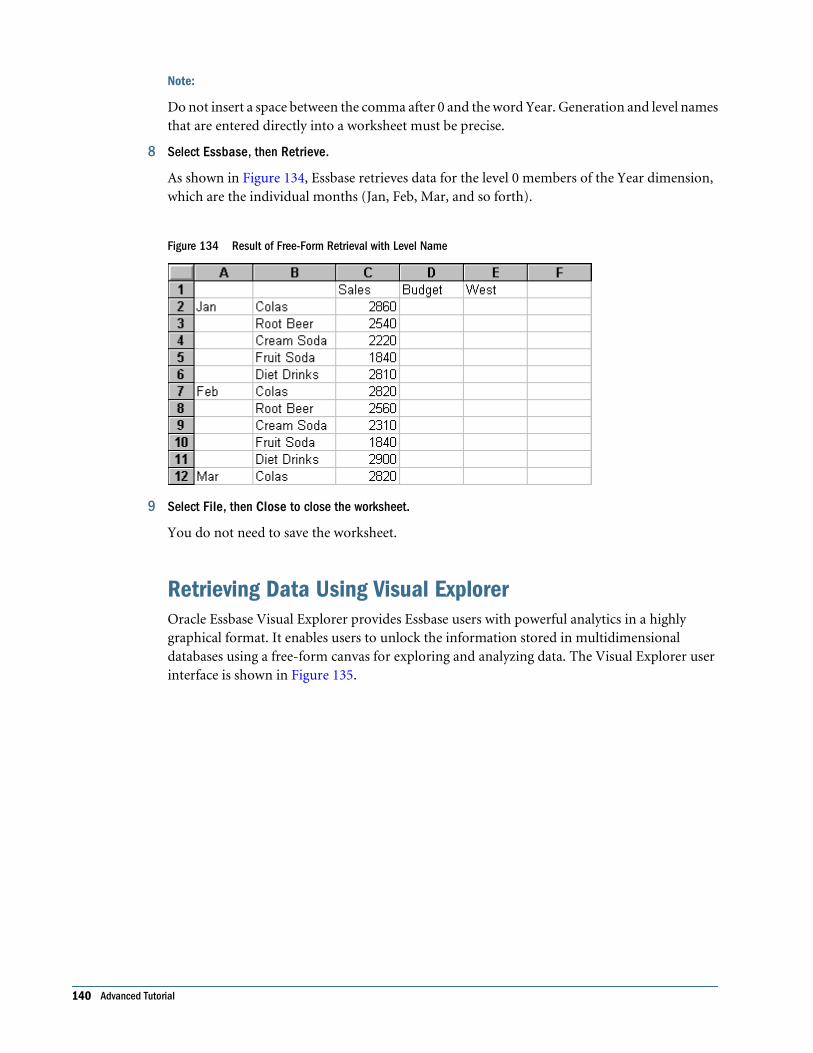
Note:
Do not insert a space between the comma after 0 and the word Year. Generation and level namesthat are entered directly into a worksheet must be precise.
8 Select Essbase, then Retrieve.
As shown in Figure 134, Essbase retrieves data for the level 0 members of the Year dimension,which are the individual months (Jan, Feb, Mar, and so forth).
Figure 134 Result of Free-Form Retrieval with Level Name
9 Select File, then Close to close the worksheet.
You do not need to save the worksheet.
Retrieving Data Using Visual ExplorerOracle Essbase Visual Explorer provides Essbase users with powerful analytics in a highlygraphical format. It enables users to unlock the information stored in multidimensionaldatabases using a free-form canvas for exploring and analyzing data. The Visual Explorer userinterface is shown in Figure 135.
140 Advanced Tutorial
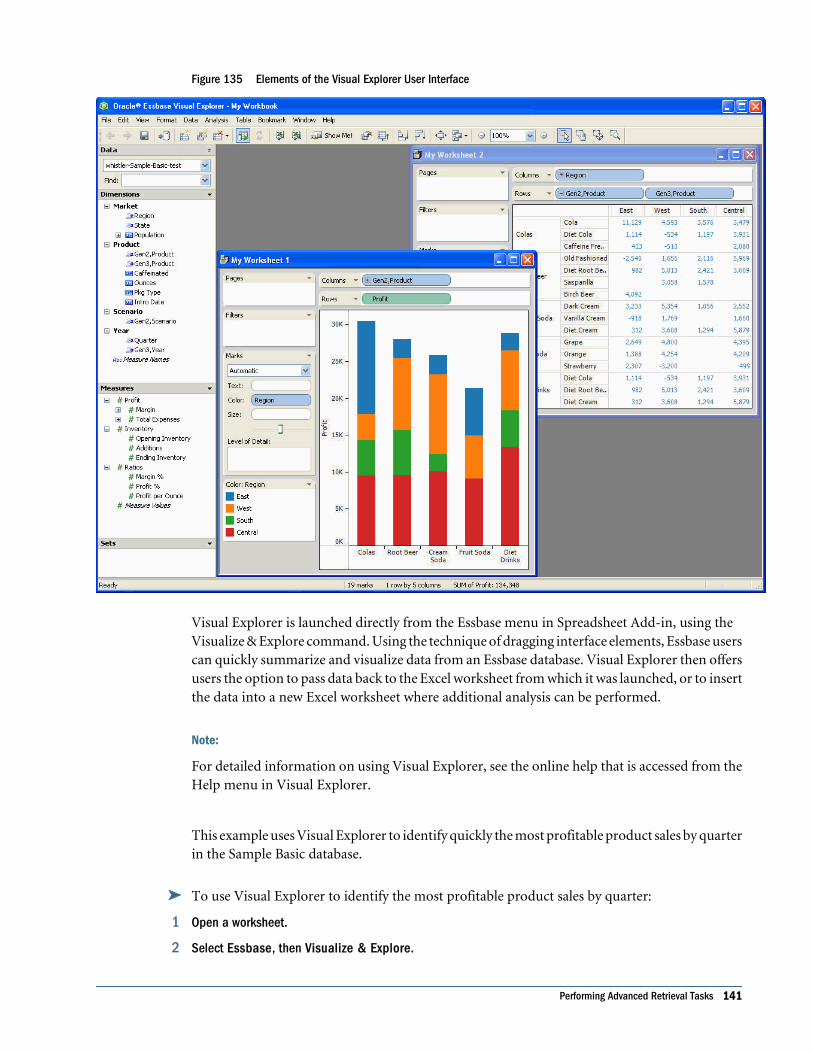
Figure 135 Elements of the Visual Explorer User Interface
Visual Explorer is launched directly from the Essbase menu in Spreadsheet Add-in, using the Visualize & Explore command. Using the technique of dragging interface elements, Essbase userscan quickly summarize and visualize data from an Essbase database. Visual Explorer then offersusers the option to pass data back to the Excel worksheet from which it was launched, or to insertthe data into a new Excel worksheet where additional analysis can be performed.
Note:
For detailed information on using Visual Explorer, see the online help that is accessed from theHelp menu in Visual Explorer.
This example uses Visual Explorer to identify quickly the most profitable product sales by quarterin the Sample Basic database.
➤ To use Visual Explorer to identify the most profitable product sales by quarter:
1 Open a worksheet.
2 Select Essbase, then Visualize & Explore.
Performing Advanced Retrieval Tasks 141
The Visual Explorer interface is displayed.
3 Optional: If you are not already logged in to the Sample Basic database, you can log in from Visual Explorerby completing these tasks:
a. From Visual Explorer, select Data, then Connect to Data.
b. In Connect to Data, select Essbase.
The Essbase System Login dialog box is displayed.
c. In Server, select the server to access, or enter the name of the server.
d. Enter your user name.
e. Enter your password.
f. Click OK to connect to the server.
When your server connection is complete, a list of available application and database pairsis displayed in the Application/Database list.
g. Select the application and database pair and click OK.
h. In Name Connection, click OK to save the Server-Application-Database name of thisconnection for future use.
You can rename the connection to a user-friendly name.
i. Click Yes at the prompt to save the connection name.
Note:
If you save the connection name, it is displayed on subsequent logins in the Connect toData dialog box (see step 3.b).
You are now ready to use Visual Explorer.
4 Under Marks, select Bar.
5 Drag Year from the Dimension section of the Data window and drop it on the Column shelf.
6 Drag Sales from the Measures section of the Data window and drop it on the Column shelf, placing it tothe right of Quarter.
7 Drag Profit % from the Measures section of the Data window and drop it on the Color shelf.
At this point, you can see which quarter is the most profitable based on sales as indicated by thedarkest color bar.
8 Drag Region from the Dimension section of the Data window and drop it on the Row shelf.
9 Drag Category from the Dimension section of the Data window and drop it on the Row shelf, placing it tothe right of Region.
When you drag a generation to a shelf, all generations that are ancestors of the selected generationare automatically included in this placement. However, if you press and hold down the Control(Ctrl) key while dragging a generation to a shelf, only that specific generation is included in theplacement.
142 Advanced Tutorial
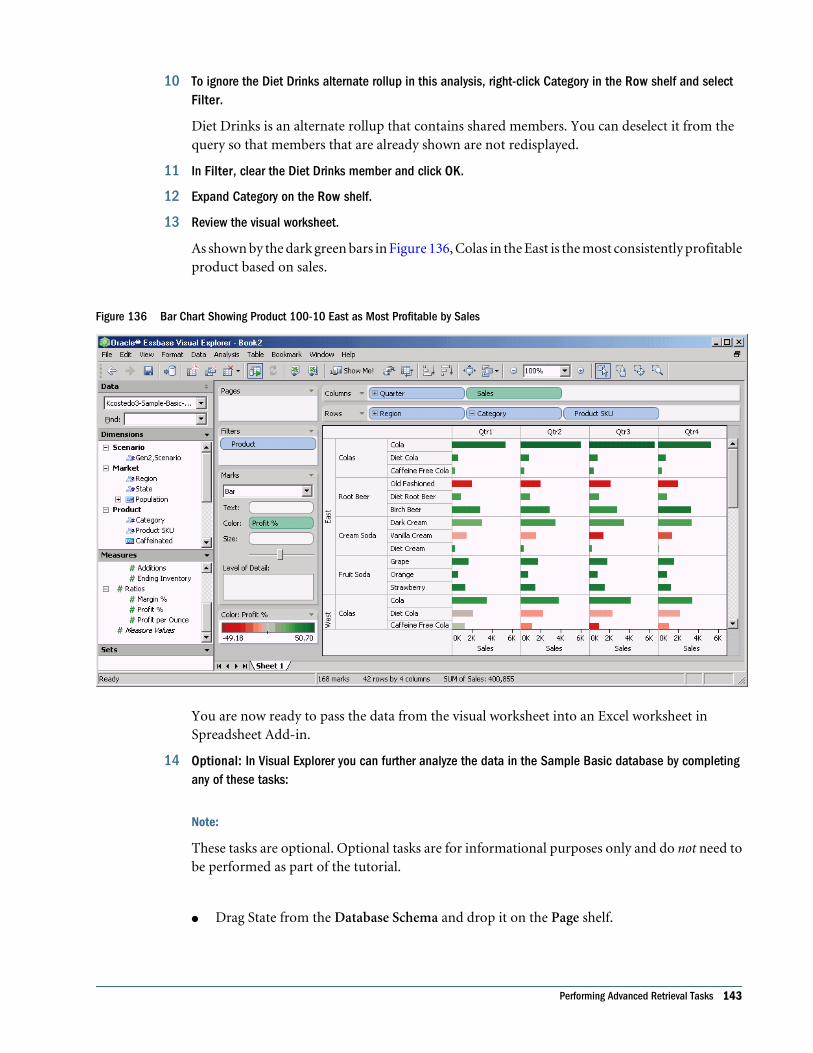
10 To ignore the Diet Drinks alternate rollup in this analysis, right-click Category in the Row shelf and selectFilter.
Diet Drinks is an alternate rollup that contains shared members. You can deselect it from thequery so that members that are already shown are not redisplayed.
11 In Filter, clear the Diet Drinks member and click OK.
12 Expand Category on the Row shelf.
13 Review the visual worksheet.
As shown by the dark green bars in Figure 136, Colas in the East is the most consistently profitableproduct based on sales.
Figure 136 Bar Chart Showing Product 100-10 East as Most Profitable by Sales
You are now ready to pass the data from the visual worksheet into an Excel worksheet inSpreadsheet Add-in.
14 Optional: In Visual Explorer you can further analyze the data in the Sample Basic database by completingany of these tasks:
Note:
These tasks are optional. Optional tasks are for informational purposes only and do not need tobe performed as part of the tutorial.
● Drag State from the Database Schema and drop it on the Page shelf.
Performing Advanced Retrieval Tasks 143
The view is recalculated to view the data for individual states. The Current Page shows thatwe are viewing data for New York. For example, hover over the bar for Cola in New Yorkin the East region during Qtr1, and the pop-up shows that the Sales total for New York inthat quarter is $1,998.00. Click the right direction arrow or use the drop-down to view datafrom another state.
● Drag Gen3, Population from the Database Schema and drop it on the Groups shelf.
The view is recalculated so that each column is now broken into market size based onpopulation, separated by lines. Hover over individual sections and view Sales data by marketsize.
15 In Oracle Essbase Visual Explorer, select File, then Export, then Cross-tab to Excel, to transfer data fromthe visual worksheet to worksheet in Excel.
Note:
Alternatively, you can select File, then Update Excel (New Worksheet), to transfer the data fromthe visual worksheet to a new worksheet in Excel.
Using Linked Reporting ObjectsA linked reporting object is an external file, cell note, or World Wide Web resource that you linkto a cell in an Essbase database. The file, note, or Web resource (indicated by a URL, or UniformResource Locator) can then be retrieved by the Spreadsheet Add-in users who have access to thedatabase.
Note:
If your organization has implemented the Essbase Partitioning option, you can also access linkedpartitions from cells in Spreadsheet Add-in. For more information on linked partitions, see“Access Methods for Linked Partitions” on page 158.
In this topic, these procedures are discussed:
● “Linking a File to a Data Cell” on page 145
● “Linking a Cell Note to a Data Cell” on page 148
● “Linking a URL to a Data Cell” on page 149
● “Accessing and Editing Linked Reporting Objects” on page 151
For additional information on using linked reporting objects, see Oracle Essbase SpreadsheetAdd-in Online Help.
144 Advanced Tutorial
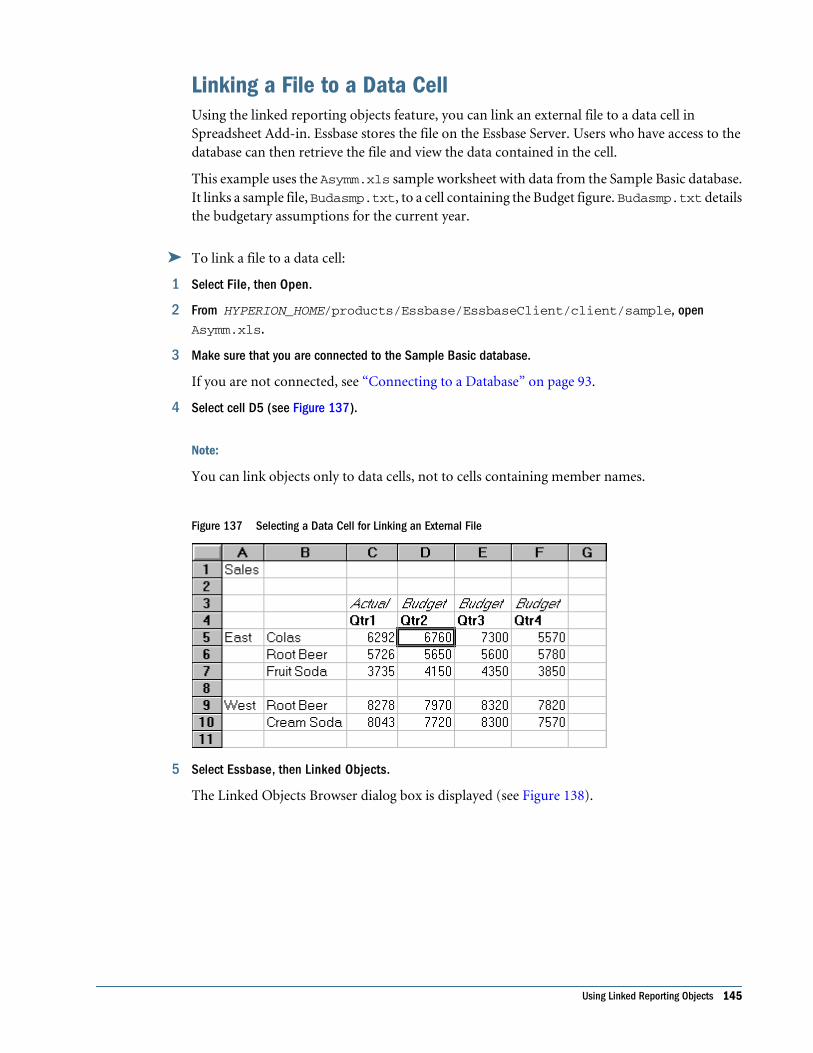
Linking a File to a Data CellUsing the linked reporting objects feature, you can link an external file to a data cell inSpreadsheet Add-in. Essbase stores the file on the Essbase Server. Users who have access to thedatabase can then retrieve the file and view the data contained in the cell.
This example uses the Asymm.xls sample worksheet with data from the Sample Basic database.It links a sample file, Budasmp.txt, to a cell containing the Budget figure. Budasmp.txt detailsthe budgetary assumptions for the current year.
➤ To link a file to a data cell:
1 Select File, then Open.
2 From HYPERION_HOME/products/Essbase/EssbaseClient/client/sample, openAsymm.xls.
3 Make sure that you are connected to the Sample Basic database.
If you are not connected, see “Connecting to a Database” on page 93.
4 Select cell D5 (see Figure 137).
Note:
You can link objects only to data cells, not to cells containing member names.
Figure 137 Selecting a Data Cell for Linking an External File
5 Select Essbase, then Linked Objects.
The Linked Objects Browser dialog box is displayed (see Figure 138).
Using Linked Reporting Objects 145
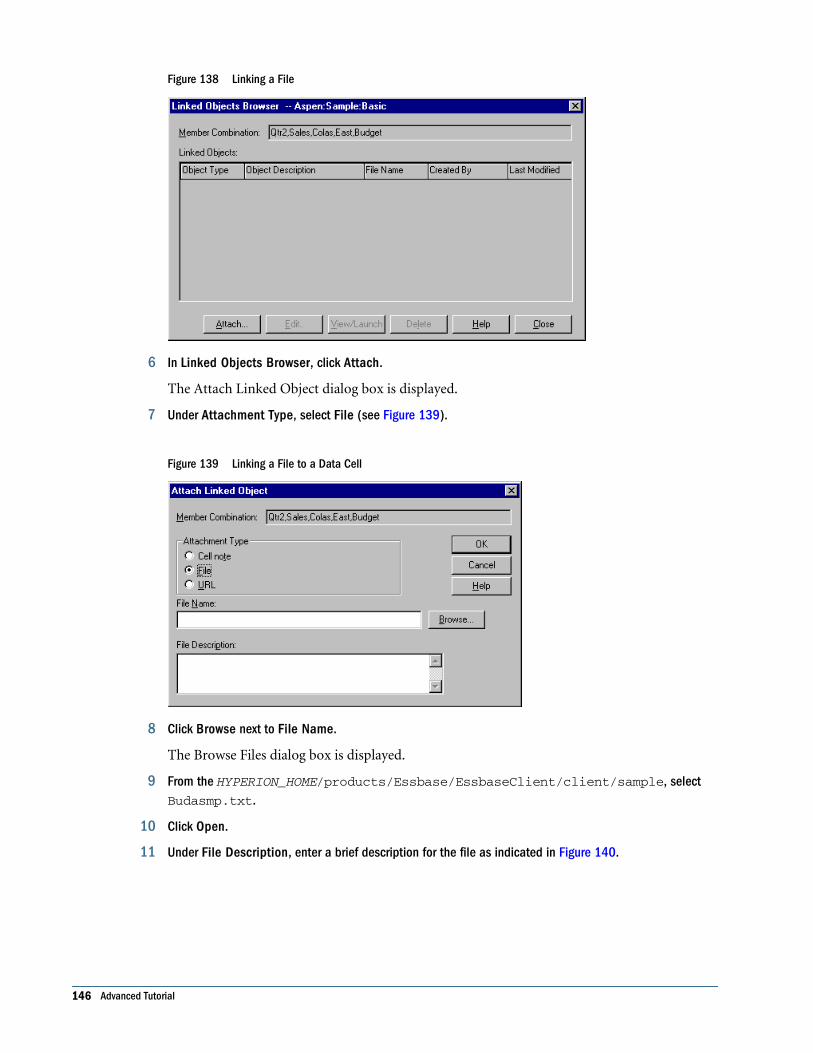
Figure 138 Linking a File
6 In Linked Objects Browser, click Attach.
The Attach Linked Object dialog box is displayed.
7 Under Attachment Type, select File (see Figure 139).
Figure 139 Linking a File to a Data Cell
8 Click Browse next to File Name.
The Browse Files dialog box is displayed.
9 From the HYPERION_HOME/products/Essbase/EssbaseClient/client/sample, selectBudasmp.txt.
10 Click Open.
11 Under File Description, enter a brief description for the file as indicated in Figure 140.
146 Advanced Tutorial
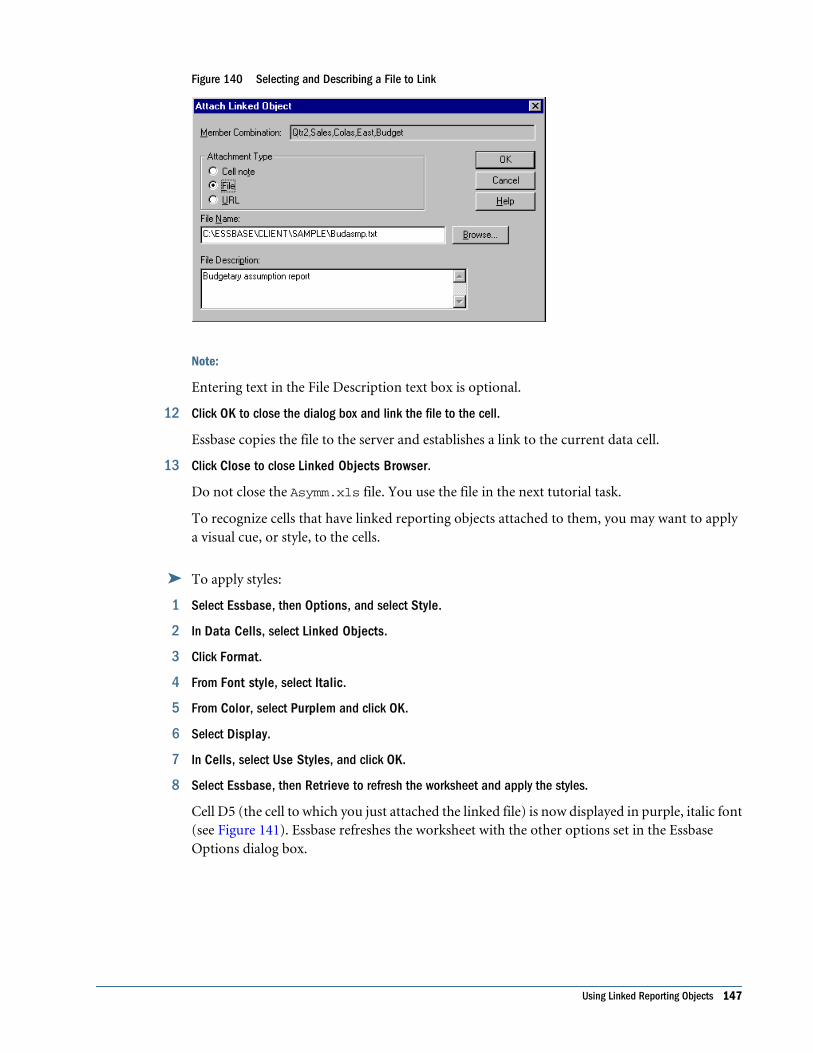
Figure 140 Selecting and Describing a File to Link
Note:
Entering text in the File Description text box is optional.
12 Click OK to close the dialog box and link the file to the cell.
Essbase copies the file to the server and establishes a link to the current data cell.
13 Click Close to close Linked Objects Browser.
Do not close the Asymm.xls file. You use the file in the next tutorial task.
To recognize cells that have linked reporting objects attached to them, you may want to applya visual cue, or style, to the cells.
➤ To apply styles:
1 Select Essbase, then Options, and select Style.
2 In Data Cells, select Linked Objects.
3 Click Format.
4 From Font style, select Italic.
5 From Color, select Purplem and click OK.
6 Select Display.
7 In Cells, select Use Styles, and click OK.
8 Select Essbase, then Retrieve to refresh the worksheet and apply the styles.
Cell D5 (the cell to which you just attached the linked file) is now displayed in purple, italic font(see Figure 141). Essbase refreshes the worksheet with the other options set in the EssbaseOptions dialog box.
Using Linked Reporting Objects 147
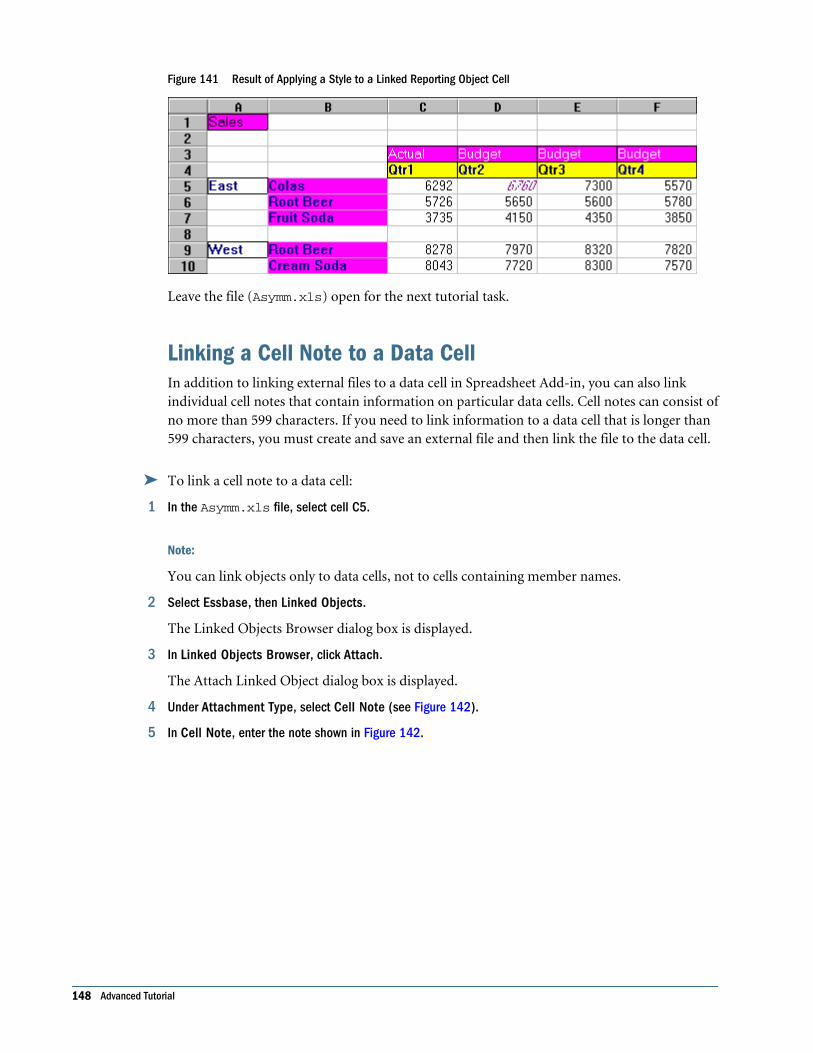
Figure 141 Result of Applying a Style to a Linked Reporting Object Cell
Leave the file (Asymm.xls) open for the next tutorial task.
Linking a Cell Note to a Data CellIn addition to linking external files to a data cell in Spreadsheet Add-in, you can also linkindividual cell notes that contain information on particular data cells. Cell notes can consist ofno more than 599 characters. If you need to link information to a data cell that is longer than599 characters, you must create and save an external file and then link the file to the data cell.
➤ To link a cell note to a data cell:
1 In the Asymm.xls file, select cell C5.
Note:
You can link objects only to data cells, not to cells containing member names.
2 Select Essbase, then Linked Objects.
The Linked Objects Browser dialog box is displayed.
3 In Linked Objects Browser, click Attach.
The Attach Linked Object dialog box is displayed.
4 Under Attachment Type, select Cell Note (see Figure 142).
5 In Cell Note, enter the note shown in Figure 142.
148 Advanced Tutorial
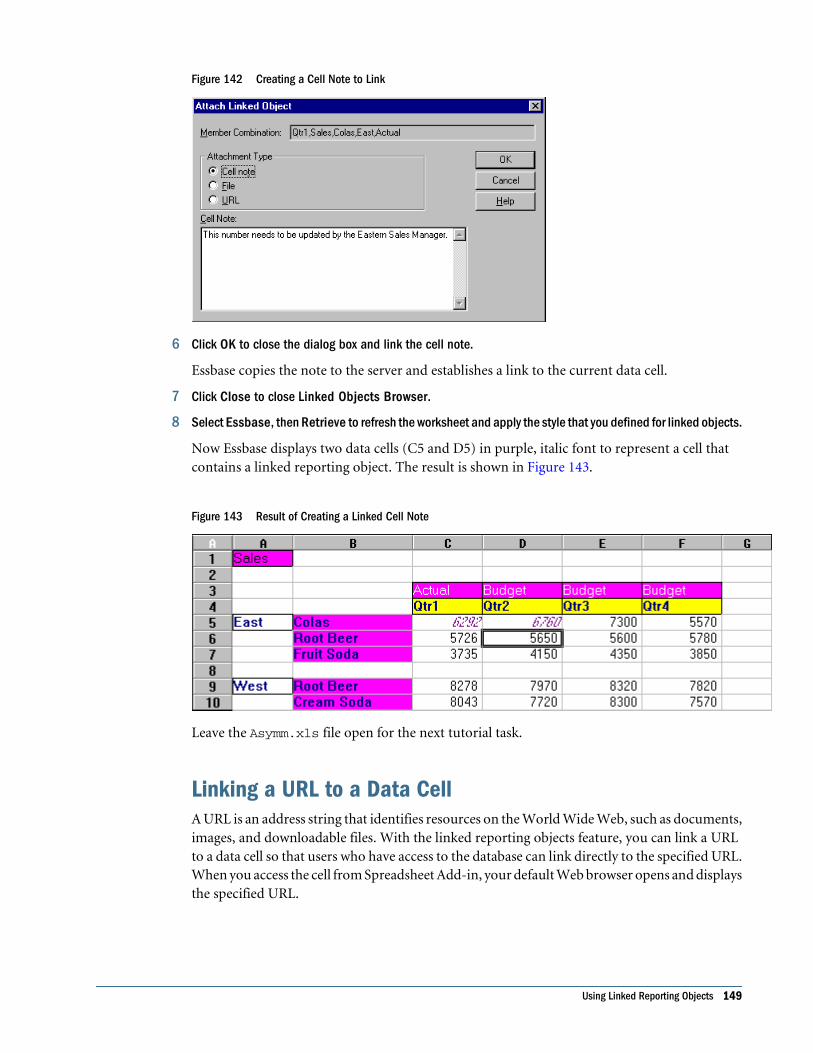
Figure 142 Creating a Cell Note to Link
6 Click OK to close the dialog box and link the cell note.
Essbase copies the note to the server and establishes a link to the current data cell.
7 Click Close to close Linked Objects Browser.
8 Select Essbase, then Retrieve to refresh the worksheet and apply the style that you defined for linked objects.
Now Essbase displays two data cells (C5 and D5) in purple, italic font to represent a cell thatcontains a linked reporting object. The result is shown in Figure 143.
Figure 143 Result of Creating a Linked Cell Note
Leave the Asymm.xls file open for the next tutorial task.
Linking a URL to a Data CellA URL is an address string that identifies resources on the World Wide Web, such as documents,images, and downloadable files. With the linked reporting objects feature, you can link a URLto a data cell so that users who have access to the database can link directly to the specified URL.When you access the cell from Spreadsheet Add-in, your default Web browser opens and displaysthe specified URL.
Using Linked Reporting Objects 149
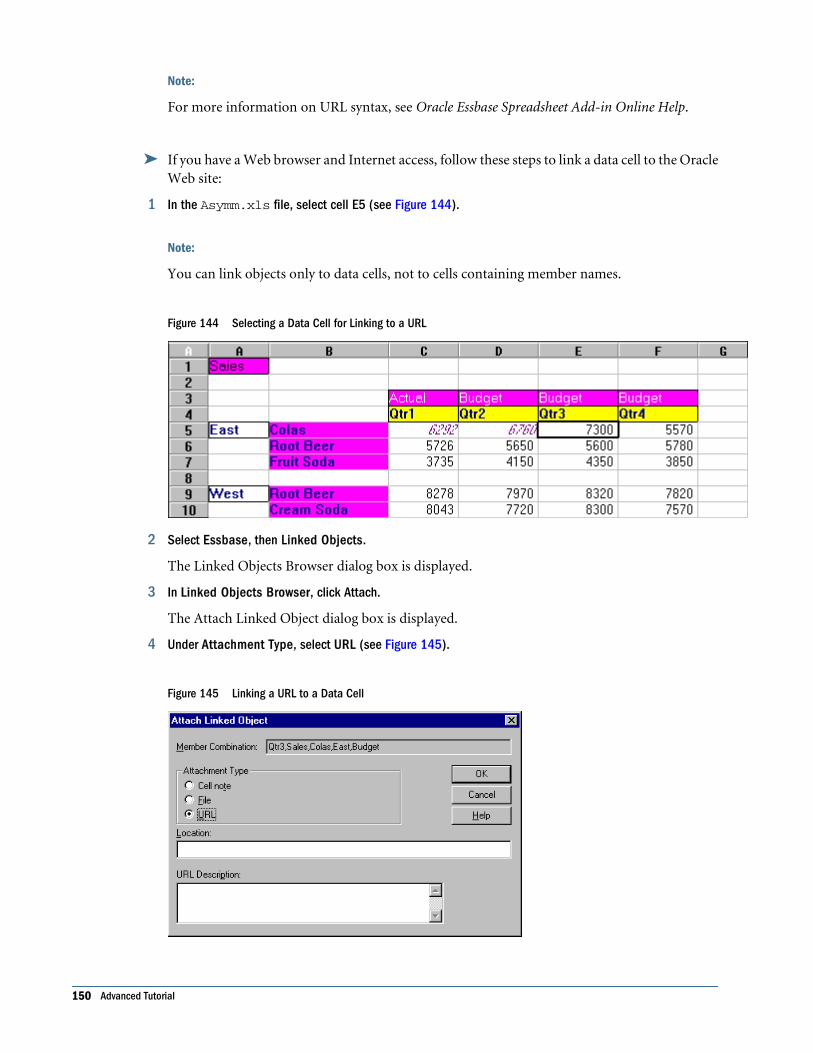
Note:
For more information on URL syntax, see Oracle Essbase Spreadsheet Add-in Online Help.
➤ If you have a Web browser and Internet access, follow these steps to link a data cell to the OracleWeb site:
1 In the Asymm.xls file, select cell E5 (see Figure 144).
Note:
You can link objects only to data cells, not to cells containing member names.
Figure 144 Selecting a Data Cell for Linking to a URL
2 Select Essbase, then Linked Objects.
The Linked Objects Browser dialog box is displayed.
3 In Linked Objects Browser, click Attach.
The Attach Linked Object dialog box is displayed.
4 Under Attachment Type, select URL (see Figure 145).
Figure 145 Linking a URL to a Data Cell
150 Advanced Tutorial
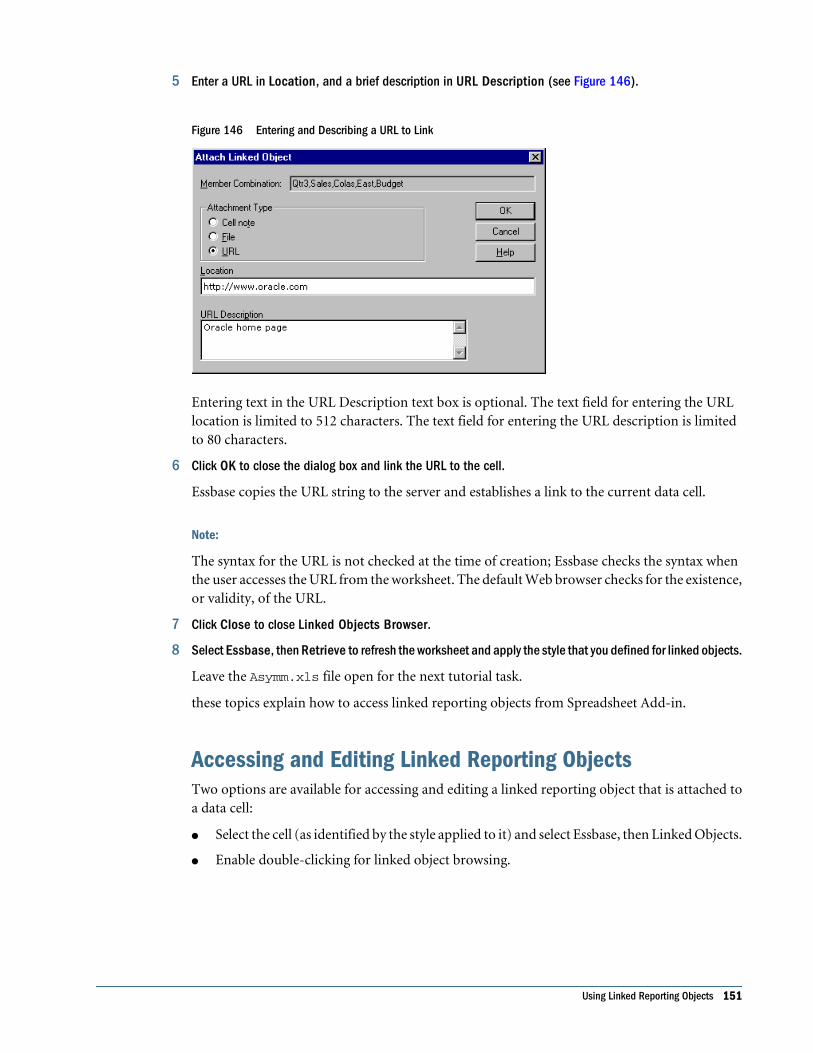
5 Enter a URL in Location, and a brief description in URL Description (see Figure 146).
Figure 146 Entering and Describing a URL to Link
Entering text in the URL Description text box is optional. The text field for entering the URLlocation is limited to 512 characters. The text field for entering the URL description is limitedto 80 characters.
6 Click OK to close the dialog box and link the URL to the cell.
Essbase copies the URL string to the server and establishes a link to the current data cell.
Note:
The syntax for the URL is not checked at the time of creation; Essbase checks the syntax whenthe user accesses the URL from the worksheet. The default Web browser checks for the existence,or validity, of the URL.
7 Click Close to close Linked Objects Browser.
8 Select Essbase, then Retrieve to refresh the worksheet and apply the style that you defined for linked objects.
Leave the Asymm.xls file open for the next tutorial task.
these topics explain how to access linked reporting objects from Spreadsheet Add-in.
Accessing and Editing Linked Reporting ObjectsTwo options are available for accessing and editing a linked reporting object that is attached toa data cell:
● Select the cell (as identified by the style applied to it) and select Essbase, then Linked Objects.
● Enable double-clicking for linked object browsing.
Using Linked Reporting Objects 151
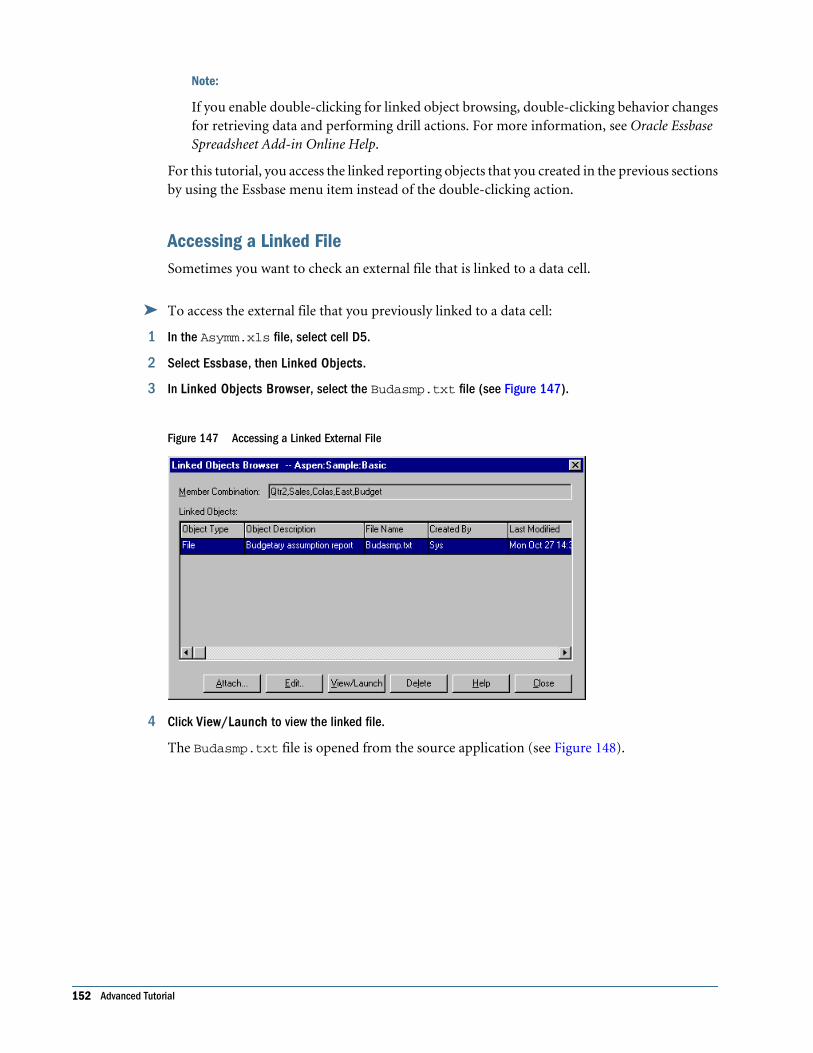
Note:
If you enable double-clicking for linked object browsing, double-clicking behavior changesfor retrieving data and performing drill actions. For more information, see Oracle EssbaseSpreadsheet Add-in Online Help.
For this tutorial, you access the linked reporting objects that you created in the previous sectionsby using the Essbase menu item instead of the double-clicking action.
Accessing a Linked FileSometimes you want to check an external file that is linked to a data cell.
➤ To access the external file that you previously linked to a data cell:
1 In the Asymm.xls file, select cell D5.
2 Select Essbase, then Linked Objects.
3 In Linked Objects Browser, select the Budasmp.txt file (see Figure 147).
Figure 147 Accessing a Linked External File
4 Click View/Launch to view the linked file.
The Budasmp.txt file is opened from the source application (see Figure 148).
152 Advanced Tutorial
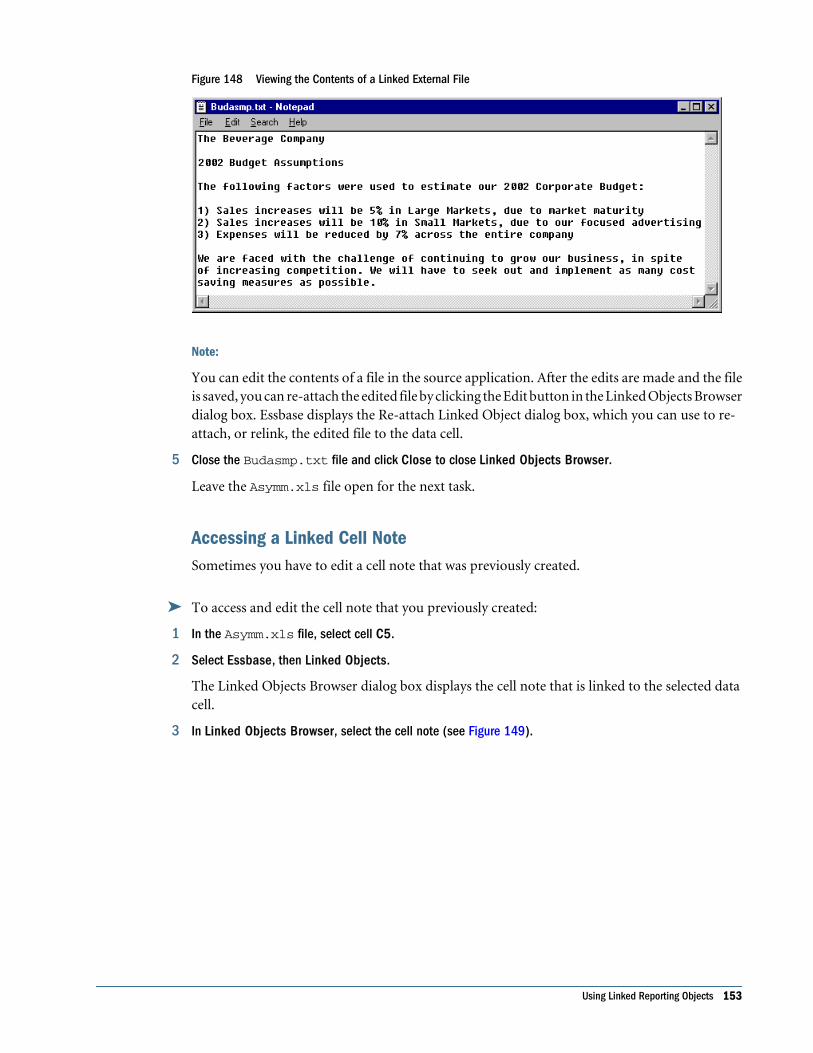
Figure 148 Viewing the Contents of a Linked External File
Note:
You can edit the contents of a file in the source application. After the edits are made and the fileis saved, you can re-attach the edited file by clicking the Edit button in the Linked Objects Browserdialog box. Essbase displays the Re-attach Linked Object dialog box, which you can use to re-attach, or relink, the edited file to the data cell.
5 Close the Budasmp.txt file and click Close to close Linked Objects Browser.
Leave the Asymm.xls file open for the next task.
Accessing a Linked Cell NoteSometimes you have to edit a cell note that was previously created.
➤ To access and edit the cell note that you previously created:
1 In the Asymm.xls file, select cell C5.
2 Select Essbase, then Linked Objects.
The Linked Objects Browser dialog box displays the cell note that is linked to the selected datacell.
3 In Linked Objects Browser, select the cell note (see Figure 149).
Using Linked Reporting Objects 153
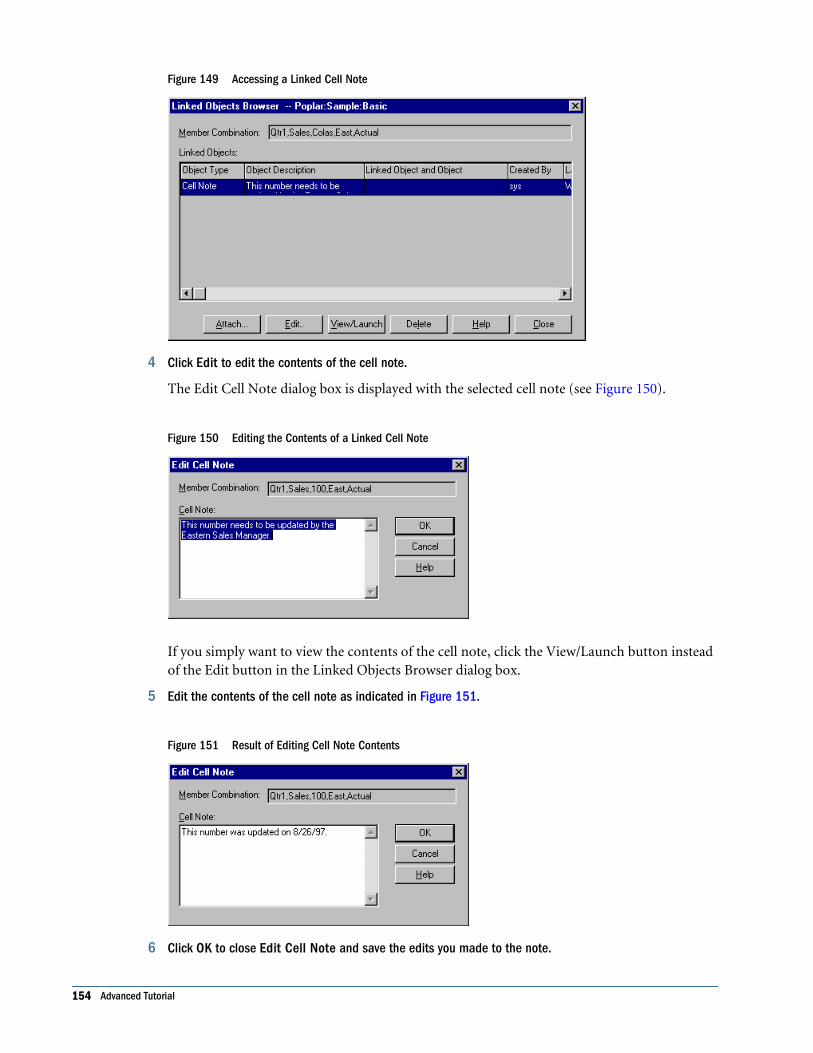
Figure 149 Accessing a Linked Cell Note
4 Click Edit to edit the contents of the cell note.
The Edit Cell Note dialog box is displayed with the selected cell note (see Figure 150).
Figure 150 Editing the Contents of a Linked Cell Note
If you simply want to view the contents of the cell note, click the View/Launch button insteadof the Edit button in the Linked Objects Browser dialog box.
5 Edit the contents of the cell note as indicated in Figure 151.
Figure 151 Result of Editing Cell Note Contents
6 Click OK to close Edit Cell Note and save the edits you made to the note.
154 Advanced Tutorial
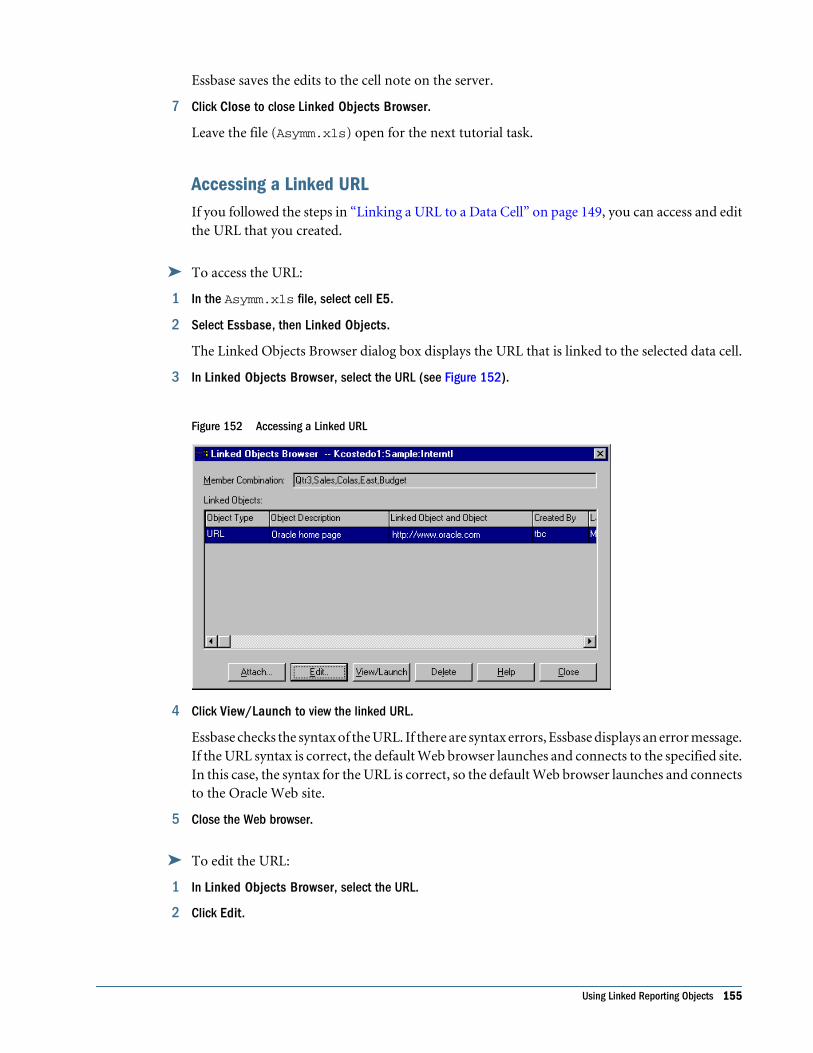
Essbase saves the edits to the cell note on the server.
7 Click Close to close Linked Objects Browser.
Leave the file (Asymm.xls) open for the next tutorial task.
Accessing a Linked URLIf you followed the steps in “Linking a URL to a Data Cell” on page 149, you can access and editthe URL that you created.
➤ To access the URL:
1 In the Asymm.xls file, select cell E5.
2 Select Essbase, then Linked Objects.
The Linked Objects Browser dialog box displays the URL that is linked to the selected data cell.
3 In Linked Objects Browser, select the URL (see Figure 152).
Figure 152 Accessing a Linked URL
4 Click View/Launch to view the linked URL.
Essbase checks the syntax of the URL. If there are syntax errors, Essbase displays an error message.If the URL syntax is correct, the default Web browser launches and connects to the specified site.In this case, the syntax for the URL is correct, so the default Web browser launches and connectsto the Oracle Web site.
5 Close the Web browser.
➤ To edit the URL:
1 In Linked Objects Browser, select the URL.
2 Click Edit.
Using Linked Reporting Objects 155
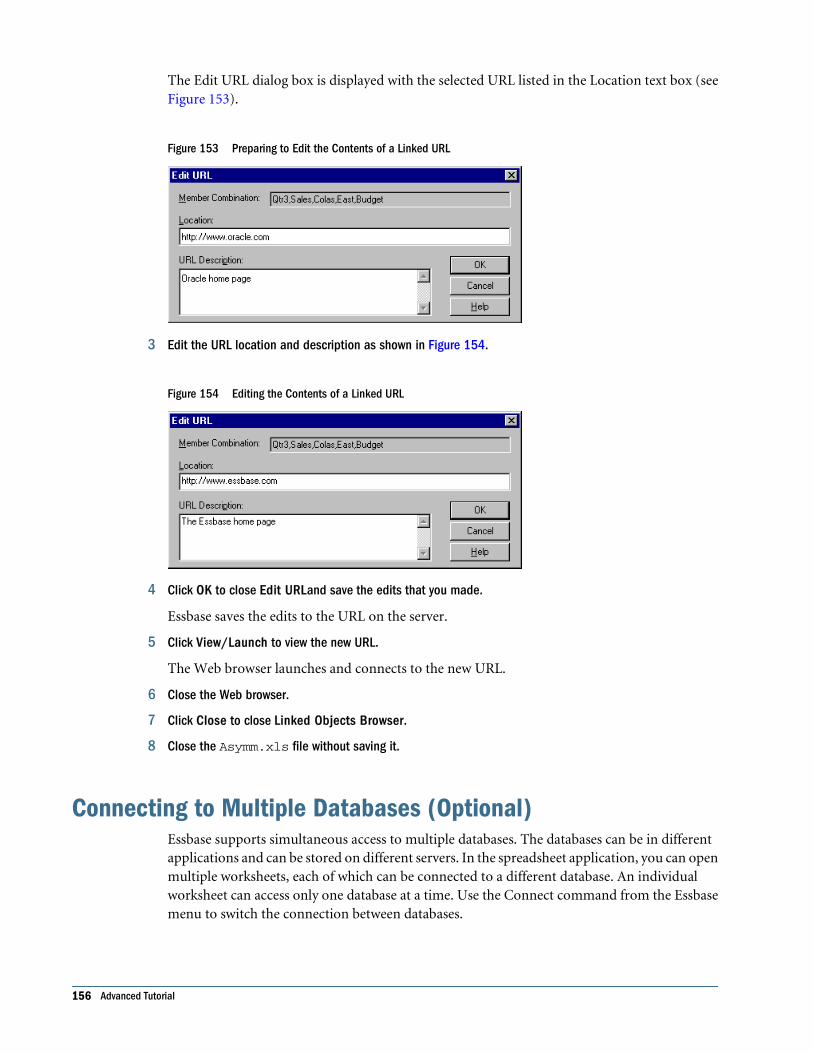
The Edit URL dialog box is displayed with the selected URL listed in the Location text box (seeFigure 153).
Figure 153 Preparing to Edit the Contents of a Linked URL
3 Edit the URL location and description as shown in Figure 154.
Figure 154 Editing the Contents of a Linked URL
4 Click OK to close Edit URLand save the edits that you made.
Essbase saves the edits to the URL on the server.
5 Click View/Launch to view the new URL.
The Web browser launches and connects to the new URL.
6 Close the Web browser.
7 Click Close to close Linked Objects Browser.
8 Close the Asymm.xls file without saving it.
Connecting to Multiple Databases (Optional)Essbase supports simultaneous access to multiple databases. The databases can be in differentapplications and can be stored on different servers. In the spreadsheet application, you can openmultiple worksheets, each of which can be connected to a different database. An individualworksheet can access only one database at a time. Use the Connect command from the Essbasemenu to switch the connection between databases.
156 Advanced Tutorial
Note:
Depending on the status of production applications at your site, you may not have access toadditional applications or databases. Contact the Essbase system administrator if you need accessto other applications.
For this tutorial, you do not need to connect to another database.
Note:
This task is optional. Optional tasks are for informational purposes only and do not need to beperformed as part of the tutorial.
➤ To access multiple databases:
1 Select Essbase, then Connect, to open Essbase System Login.
2 In Server, select a server to access, or enter the name of the server.
3 Enter your user name.
4 Enter your password.
5 Click OK to connect to the server.
When the server connection is complete, a list of available application and database pairs isdisplayed in the Application/Database list.
6 Select an application and database pair and click OK.
If the application is not already running, Essbase automatically starts it. There may be a briefpause as the application loads; the time required to start an application depends on size andnumber of databases contained within the application and the sizes of their indexes.
7 Open a worksheet and repeat the steps to connect to additional databases.
You can open one database at a time per worksheet.
For information on connecting to multiple databases from Query Designer, see “Connecting toMultiple Databases from Query Designer” on page 80.
Ways to View Active Database ConnectionsIf you frequently connect to multiple databases, you may need to check the active database foreach worksheet. You can view the database connection status in two ways:
● The Style page of the Essbase Options dialog box contains a Connection Information textbox. This box displays connection information for the active worksheet.
● The Essbase Disconnect dialog box lists all active worksheets and their connectioninformation. This dialog box also enables you to disconnect one or more worksheets fromtheir respective databases.
Ways to View Active Database Connections 157
Access Methods for Linked PartitionsLinked partitions are part of the Essbase Partitioning product. They provide the ability to linkEssbase databases that contain different dimensions without losing access to all dimensions ofboth databases. If your organization implemented the Partitioning product, you can takeadvantage of its capabilities. The Oracle Essbase Database Administrator's Guide describes howto design and implement a linked partition. The Essbase application designer usually sets uppartitioning.
Note:
The Partitioning product also enables the Essbase application designer to set up transparent orremote partitions. For more information on partitioning, see the Oracle Essbase DatabaseAdministrator's Guide.
You can set visual cues, or styles, for cells tagged as linked objects. These cells are access pointsto the linked partition within the linked database. Two options are available for accessing a linkedpartition from a data cell in Spreadsheet Add-in:
● Select the cell and select Essbase, then Linked Objects.
● Enable double-clicking for linked object browsing.
If you enable double-clicking for linked object browsing, double-clicking behavior changesfor retrieving data and performing drill actions. For more information on these changes,see Oracle Essbase Spreadsheet Add-in Online Help.
When you select Linked Objects from a linked partition cell, Essbase completes these actions:
● Essbase displays the Linked Objects Browser dialog box, which contains a list of possiblepartitions which you can access. From this dialog box, select the partition to connect to.
The Linked Objects Browser dialog box may also contain a list of linked reporting objects,such as cell notes and external files. For more information on linked objects, see “UsingLinked Reporting Objects” on page 144.
● After you select a partition, Essbase creates a new worksheet that contains correspondingmembers and dimensions for the cell in the linked partition.
Note:
Essbase does not preserve formulas across partitions.
● Essbase retrieves data values from the linked partition.
You can now perform operations such as drill down and drill up to get more information onthe worksheet.
Note:
The Sample Basic database that you are using for this tutorial does not contain a linked partition.However, the instructions for accessing a linked partition are shown as an optional task in thelight-colored box below.
158 Advanced Tutorial
Note:
This task is optional. Optional tasks are for informational purposes only and do not need to beperformed as part of the tutorial.
➤ To access a linked partition in Spreadsheet Add-in if the Essbase application designer set up alinked partition:
1 Locate a linked object cell, as indicated by the style applied to the cell.
2 Select one method to access Linked Objects Browser:
● Select Essbase, then Linked Objects.
● In Essbase Options, select Enable Linked Object Browsing to enable double-clicking to viewlinked objects.
3 Select the partition to connect to and click View/Launch.
Essbase creates a worksheet that contains the dimensions and members for the cell in the linkedpartition.
You need the proper privileges to access a linked partition. If your user account and passwordmatch the account information for the linked partition, Essbase establishes a connection withthe linked partition. Otherwise, Essbase displays the Essbase System Login dialog box for you toenter the user account and password.
Updating Data on Essbase ServerData values are changed frequently in applications that involve planning, budgeting, andforecasting. After you retrieve data into the worksheet, you can use Spreadsheet Add-in to changevalues, enter formulas, and format data. Essbase is also designed to permit multiple-user,concurrent database access and update.
Depending on your security privileges, you may be able to modify all data values or a certainsubset of values. To recognize cells to which you have read/write access, apply a visual cue, orstyle, to the cells. For more information on applying styles, see “Applying Styles to Data Cells(Optional)” on page 60.
To update data from a worksheet, you must lock the database area that contains the values thatyou want to change. Locking prohibits other users from changing the data that you want toupdate. Other users can retrieve locked data but cannot lock or change the data. You haveexclusive update rights to that area.
Note:
You cannot update attribute-related data on the server because attribute data is always calculateddynamically and, hence, is not saved.
You can lock data values in three ways:
Updating Data on Essbase Server 159
● The Retrieve & Lock command retrieves data into the worksheet while lockingthe corresponding data area on the server. When you perform a subsequent retrieval, Essbaseautomatically unlocks the previous data values.
Note:
The Retrieve & Lock command is not supported with Dynamic Time Series members.
● The Lock command locks information that you have already retrieved. When you performa subsequent retrieval, Essbase automatically unlocks the previous data values.
● The Update Mode option in the Mode page of the Essbase Options dialog box automaticallylocks the corresponding database area for each retrieval.
To update the server with data values from the worksheet, use the Send command on the Essbasemenu. After updating the server, the Send command automatically unlocks data (unless you arein Update Mode). You must clear Update Mode to stop the automatic locking of blocks.
You can unlock data blocks in two ways:
● The Unlock command unlocks all blocks that you have locked.
● The server automatically unlocks data blocks that have been locked for the maximum timeallowed as defined by the Essbase system administrator. Automatic unlock ensures thatblocks are not locked for extended periods of time.
The P&l.xls file is installed as part of the default Essbase installation. This file illustrates howto update data on the server.
➤ To view P&l.xls:
1 Select File, then Open.
2 From HYPERION_HOME/products/Essbase/EssbaseClient/client/sample, openP&l.xls.
3 Select Essbase, then Retrieve & Lock.
Essbase retrieves data and locks the appropriate area of the database (see Figure 155).
160 Advanced Tutorial
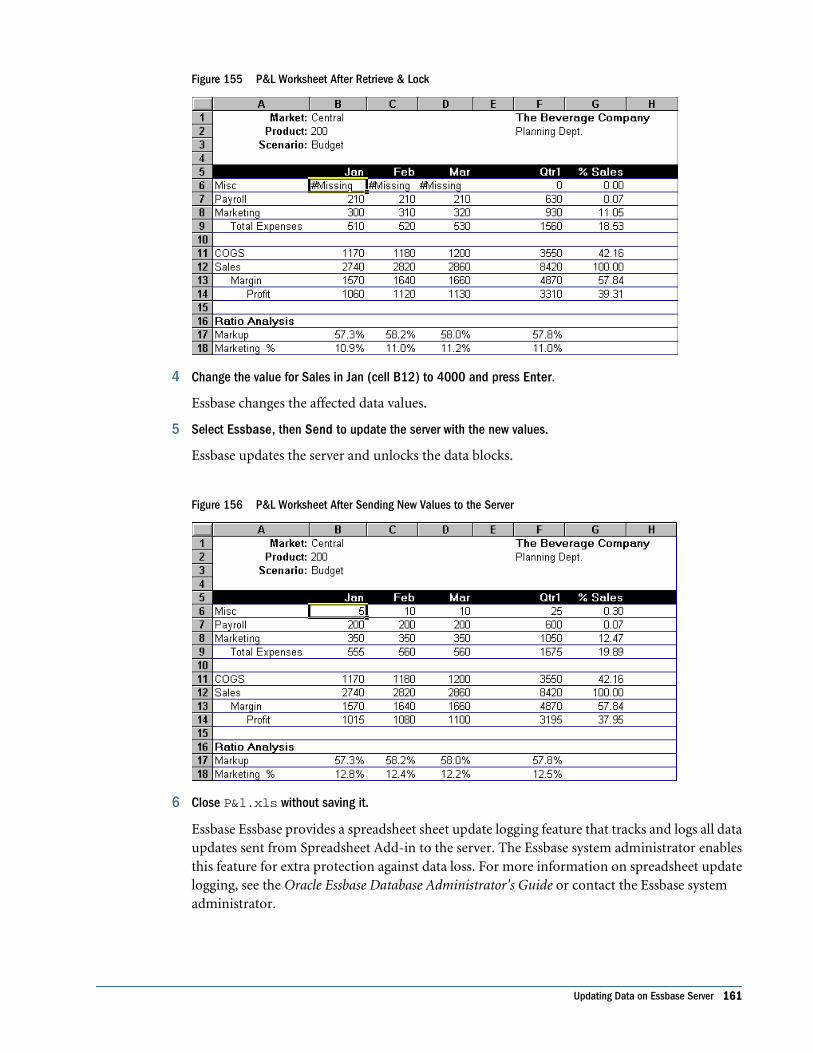
Figure 155 P&L Worksheet After Retrieve & Lock
4 Change the value for Sales in Jan (cell B12) to 4000 and press Enter.
Essbase changes the affected data values.
5 Select Essbase, then Send to update the server with the new values.
Essbase updates the server and unlocks the data blocks.
Figure 156 P&L Worksheet After Sending New Values to the Server
6 Close P&l.xls without saving it.
Essbase Essbase provides a spreadsheet sheet update logging feature that tracks and logs all dataupdates sent from Spreadsheet Add-in to the server. The Essbase system administrator enablesthis feature for extra protection against data loss. For more information on spreadsheet updatelogging, see the Oracle Essbase Database Administrator's Guide or contact the Essbase systemadministrator.
Updating Data on Essbase Server 161
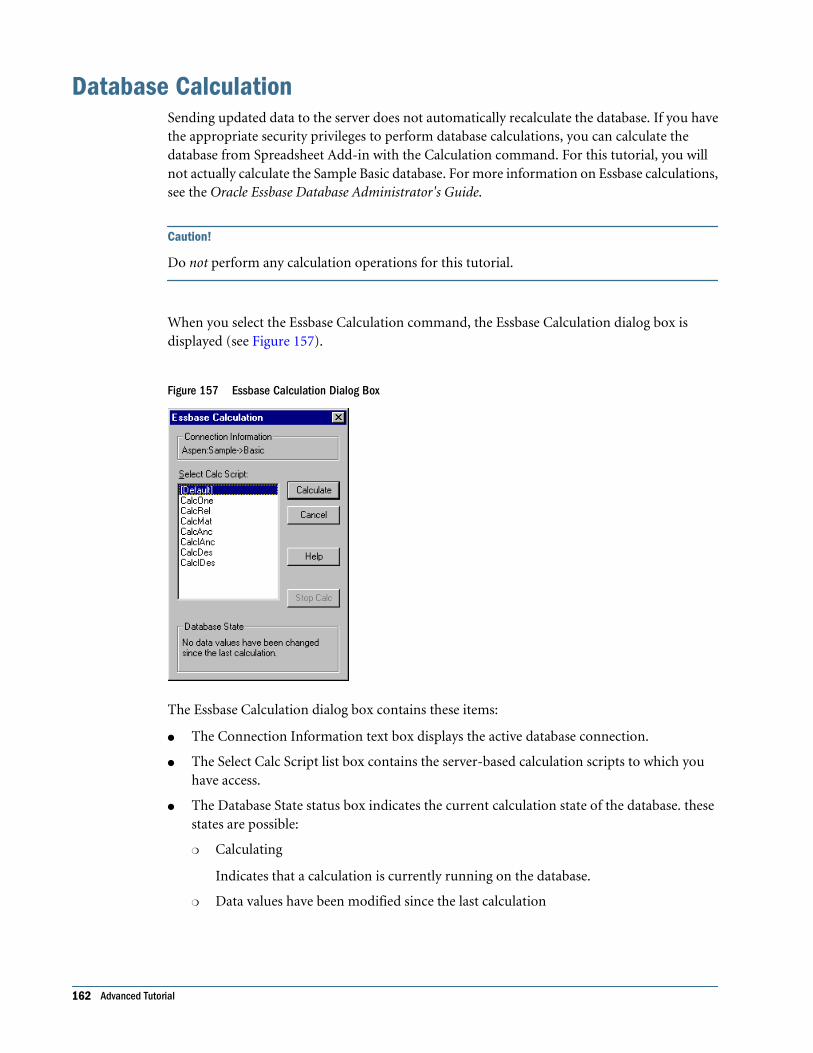
Database CalculationSending updated data to the server does not automatically recalculate the database. If you havethe appropriate security privileges to perform database calculations, you can calculate thedatabase from Spreadsheet Add-in with the Calculation command. For this tutorial, you willnot actually calculate the Sample Basic database. For more information on Essbase calculations,see the Oracle Essbase Database Administrator's Guide.
Caution!
Do not perform any calculation operations for this tutorial.
When you select the Essbase Calculation command, the Essbase Calculation dialog box isdisplayed (see Figure 157).
Figure 157 Essbase Calculation Dialog Box
The Essbase Calculation dialog box contains these items:
● The Connection Information text box displays the active database connection.
● The Select Calc Script list box contains the server-based calculation scripts to which youhave access.
● The Database State status box indicates the current calculation state of the database. thesestates are possible:
❍ Calculating
Indicates that a calculation is currently running on the database.
❍ Data values have been modified since the last calculation
162 Advanced Tutorial
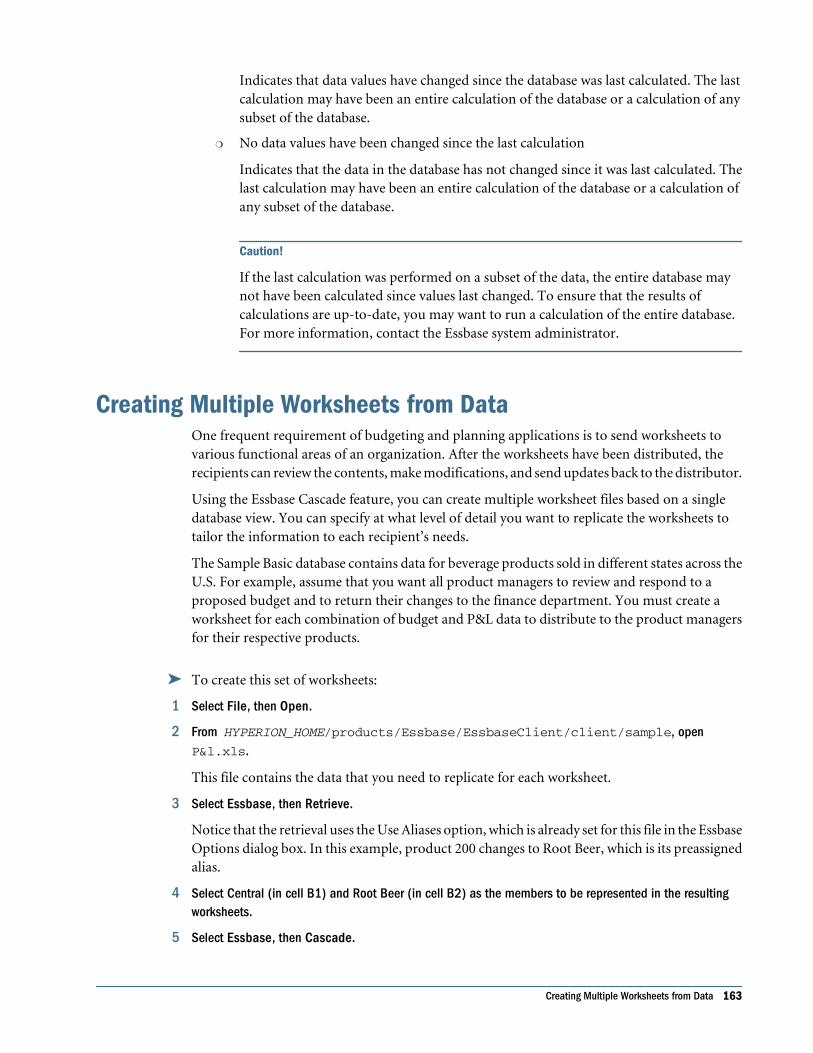
Indicates that data values have changed since the database was last calculated. The lastcalculation may have been an entire calculation of the database or a calculation of anysubset of the database.
❍ No data values have been changed since the last calculation
Indicates that the data in the database has not changed since it was last calculated. Thelast calculation may have been an entire calculation of the database or a calculation ofany subset of the database.
Caution!
If the last calculation was performed on a subset of the data, the entire database maynot have been calculated since values last changed. To ensure that the results ofcalculations are up-to-date, you may want to run a calculation of the entire database.For more information, contact the Essbase system administrator.
Creating Multiple Worksheets from DataOne frequent requirement of budgeting and planning applications is to send worksheets tovarious functional areas of an organization. After the worksheets have been distributed, therecipients can review the contents, make modifications, and send updates back to the distributor.
Using the Essbase Cascade feature, you can create multiple worksheet files based on a singledatabase view. You can specify at what level of detail you want to replicate the worksheets totailor the information to each recipient’s needs.
The Sample Basic database contains data for beverage products sold in different states across theU.S. For example, assume that you want all product managers to review and respond to aproposed budget and to return their changes to the finance department. You must create aworksheet for each combination of budget and P&L data to distribute to the product managersfor their respective products.
➤ To create this set of worksheets:
1 Select File, then Open.
2 From HYPERION_HOME/products/Essbase/EssbaseClient/client/sample, openP&l.xls.
This file contains the data that you need to replicate for each worksheet.
3 Select Essbase, then Retrieve.
Notice that the retrieval uses the Use Aliases option, which is already set for this file in the EssbaseOptions dialog box. In this example, product 200 changes to Root Beer, which is its preassignedalias.
4 Select Central (in cell B1) and Root Beer (in cell B2) as the members to be represented in the resultingworksheets.
5 Select Essbase, then Cascade.
Creating Multiple Worksheets from Data 163
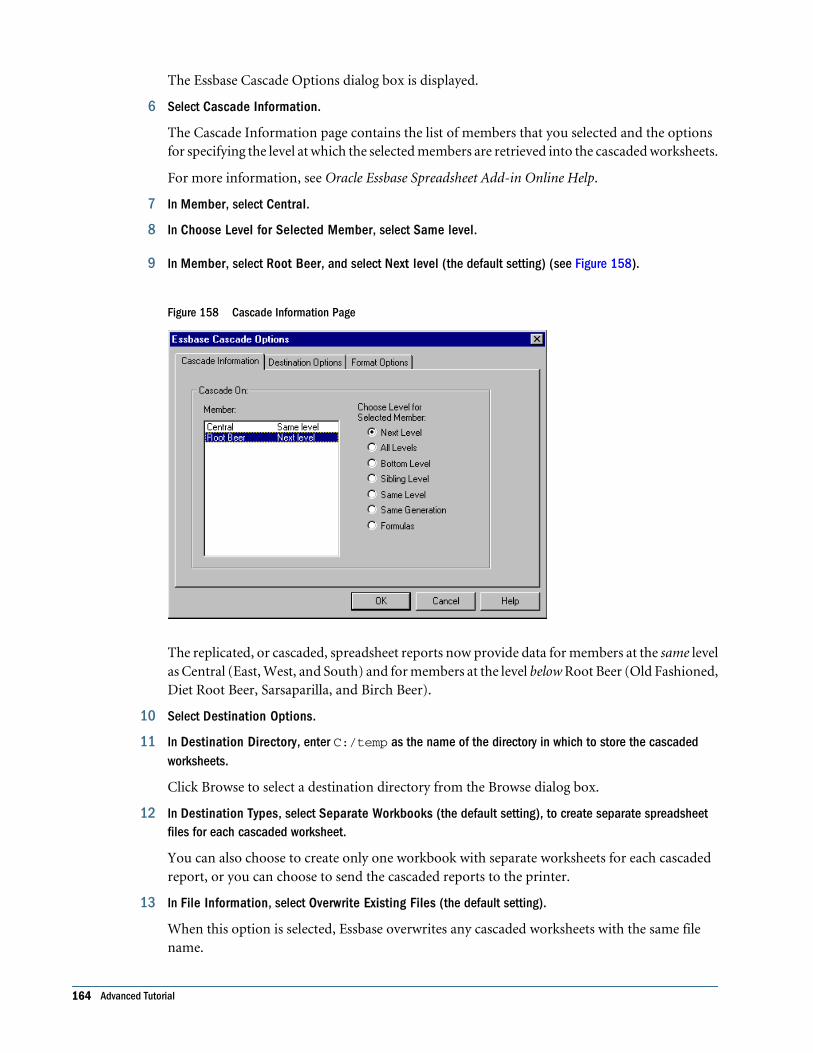
The Essbase Cascade Options dialog box is displayed.
6 Select Cascade Information.
The Cascade Information page contains the list of members that you selected and the optionsfor specifying the level at which the selected members are retrieved into the cascaded worksheets.
For more information, see Oracle Essbase Spreadsheet Add-in Online Help.
7 In Member, select Central.
8 In Choose Level for Selected Member, select Same level.
9 In Member, select Root Beer, and select Next level (the default setting) (see Figure 158).
Figure 158 Cascade Information Page
The replicated, or cascaded, spreadsheet reports now provide data for members at the same levelas Central (East, West, and South) and for members at the level below Root Beer (Old Fashioned,Diet Root Beer, Sarsaparilla, and Birch Beer).
10 Select Destination Options.
11 In Destination Directory, enter C:/temp as the name of the directory in which to store the cascadedworksheets.
Click Browse to select a destination directory from the Browse dialog box.
12 In Destination Types, select Separate Workbooks (the default setting), to create separate spreadsheetfiles for each cascaded worksheet.
You can also choose to create only one workbook with separate worksheets for each cascadedreport, or you can choose to send the cascaded reports to the printer.
13 In File Information, select Overwrite Existing Files (the default setting).
When this option is selected, Essbase overwrites any cascaded worksheets with the same filename.
164 Advanced Tutorial
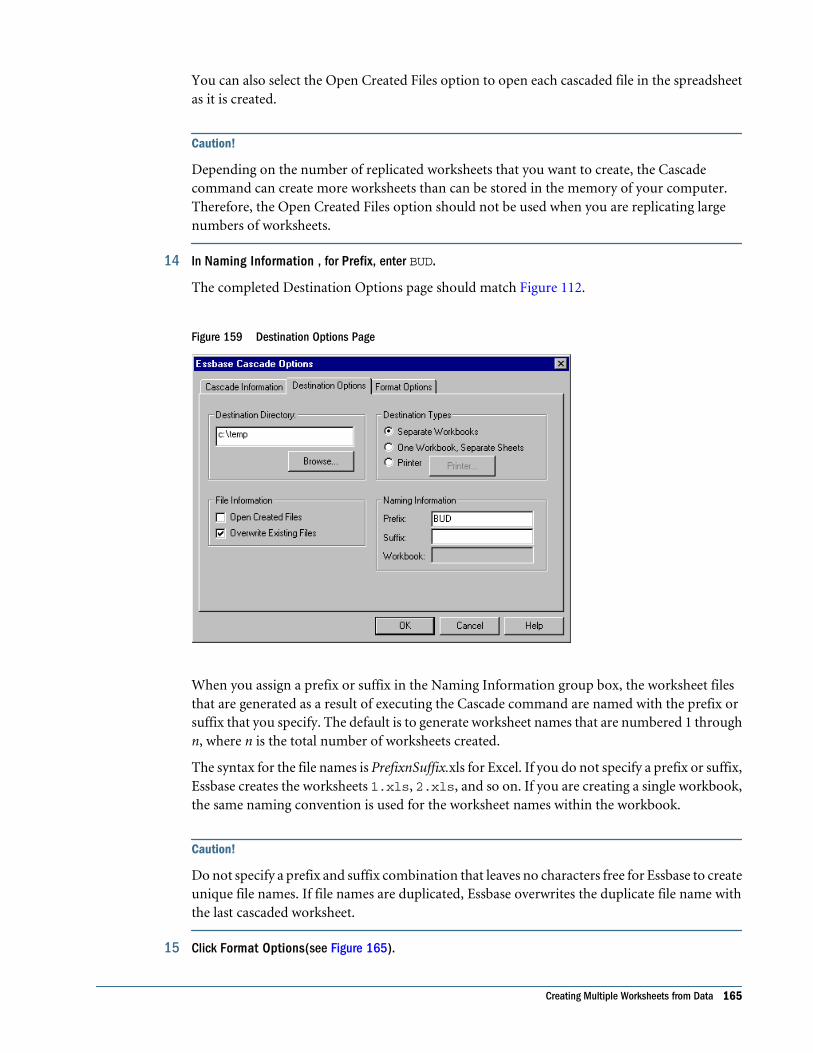
You can also select the Open Created Files option to open each cascaded file in the spreadsheetas it is created.
Caution!
Depending on the number of replicated worksheets that you want to create, the Cascadecommand can create more worksheets than can be stored in the memory of your computer.Therefore, the Open Created Files option should not be used when you are replicating largenumbers of worksheets.
14 In Naming Information , for Prefix, enter BUD.
The completed Destination Options page should match Figure 112.
Figure 159 Destination Options Page
When you assign a prefix or suffix in the Naming Information group box, the worksheet filesthat are generated as a result of executing the Cascade command are named with the prefix orsuffix that you specify. The default is to generate worksheet names that are numbered 1 throughn, where n is the total number of worksheets created.
The syntax for the file names is PrefixnSuffix.xls for Excel. If you do not specify a prefix or suffix,Essbase creates the worksheets 1.xls, 2.xls, and so on. If you are creating a single workbook,the same naming convention is used for the worksheet names within the workbook.
Caution!
Do not specify a prefix and suffix combination that leaves no characters free for Essbase to createunique file names. If file names are duplicated, Essbase overwrites the duplicate file name withthe last cascaded worksheet.
15 Click Format Options(see Figure 165).
Creating Multiple Worksheets from Data 165
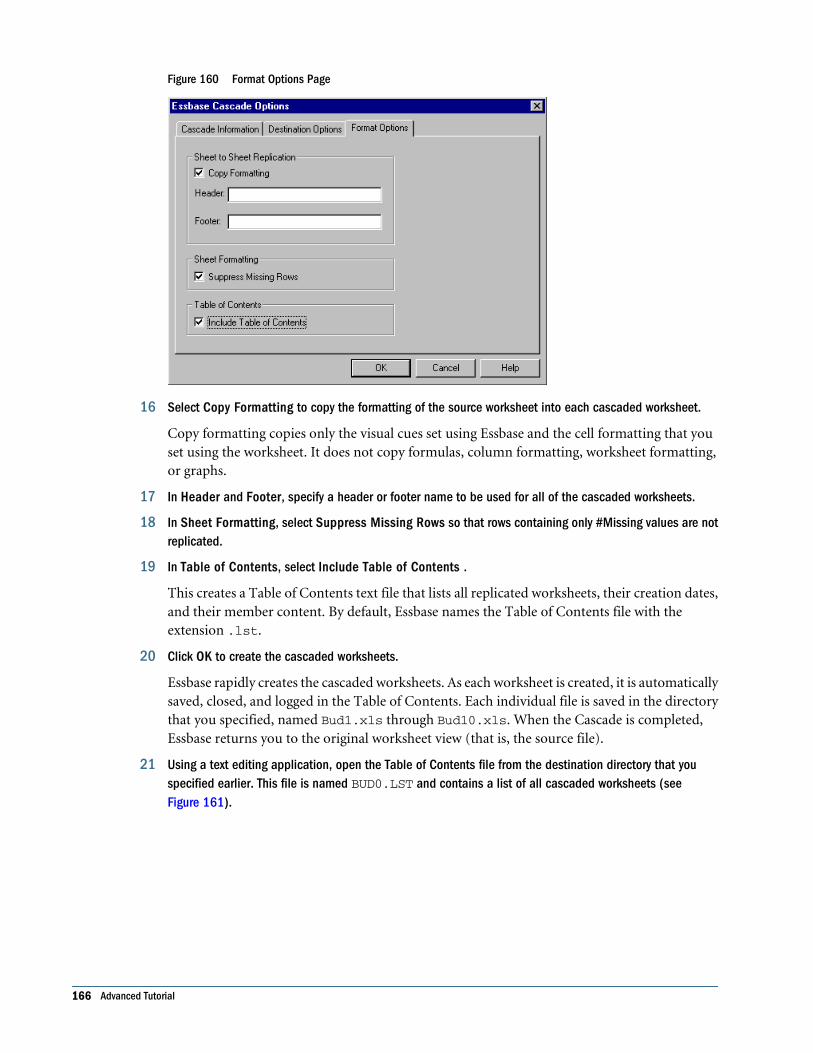
Figure 160 Format Options Page
16 Select Copy Formatting to copy the formatting of the source worksheet into each cascaded worksheet.
Copy formatting copies only the visual cues set using Essbase and the cell formatting that youset using the worksheet. It does not copy formulas, column formatting, worksheet formatting,or graphs.
17 In Header and Footer, specify a header or footer name to be used for all of the cascaded worksheets.
18 In Sheet Formatting, select Suppress Missing Rows so that rows containing only #Missing values are notreplicated.
19 In Table of Contents, select Include Table of Contents .
This creates a Table of Contents text file that lists all replicated worksheets, their creation dates,and their member content. By default, Essbase names the Table of Contents file with theextension .lst.
20 Click OK to create the cascaded worksheets.
Essbase rapidly creates the cascaded worksheets. As each worksheet is created, it is automaticallysaved, closed, and logged in the Table of Contents. Each individual file is saved in the directorythat you specified, named Bud1.xls through Bud10.xls. When the Cascade is completed,Essbase returns you to the original worksheet view (that is, the source file).
21 Using a text editing application, open the Table of Contents file from the destination directory that youspecified earlier. This file is named BUD0.LST and contains a list of all cascaded worksheets (seeFigure 161).
166 Advanced Tutorial
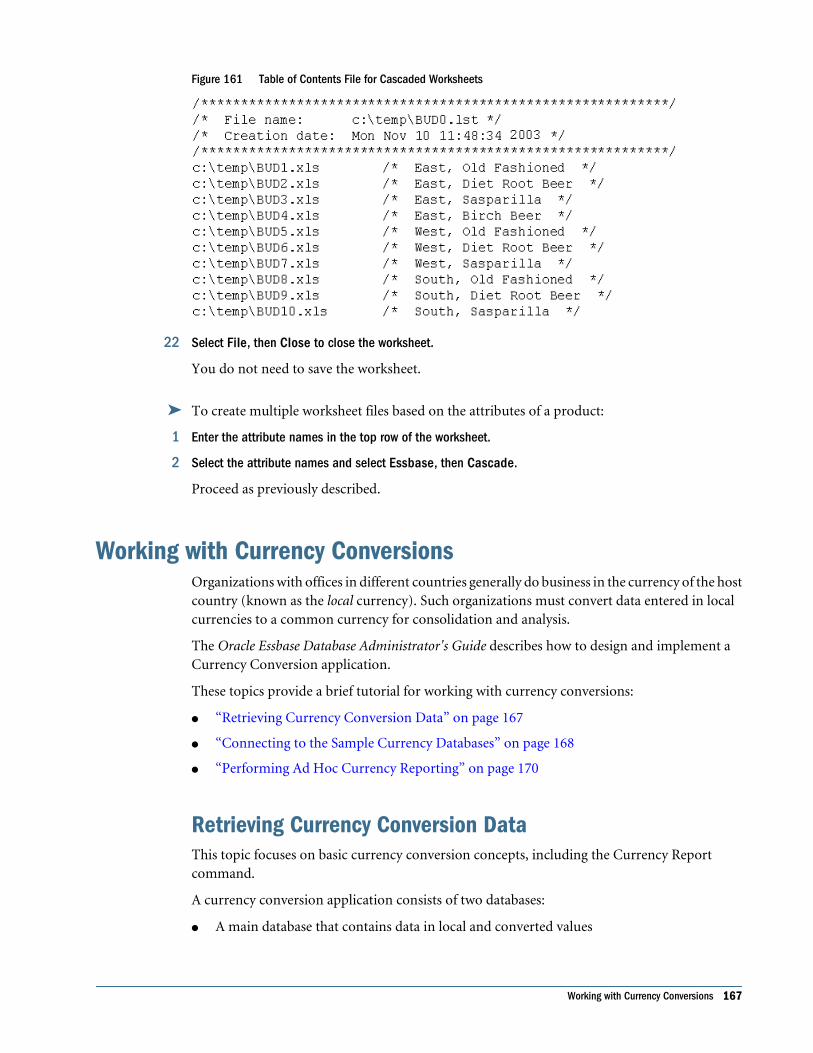
Figure 161 Table of Contents File for Cascaded Worksheets
22 Select File, then Close to close the worksheet.
You do not need to save the worksheet.
➤ To create multiple worksheet files based on the attributes of a product:
1 Enter the attribute names in the top row of the worksheet.
2 Select the attribute names and select Essbase, then Cascade.
Proceed as previously described.
Working with Currency ConversionsOrganizations with offices in different countries generally do business in the currency of the hostcountry (known as the local currency). Such organizations must convert data entered in localcurrencies to a common currency for consolidation and analysis.
The Oracle Essbase Database Administrator's Guide describes how to design and implement aCurrency Conversion application.
These topics provide a brief tutorial for working with currency conversions:
● “Retrieving Currency Conversion Data” on page 167
● “Connecting to the Sample Currency Databases” on page 168
● “Performing Ad Hoc Currency Reporting” on page 170
Retrieving Currency Conversion DataThis topic focuses on basic currency conversion concepts, including the Currency Reportcommand.
A currency conversion application consists of two databases:
● A main database that contains data in local and converted values
Working with Currency Conversions 167
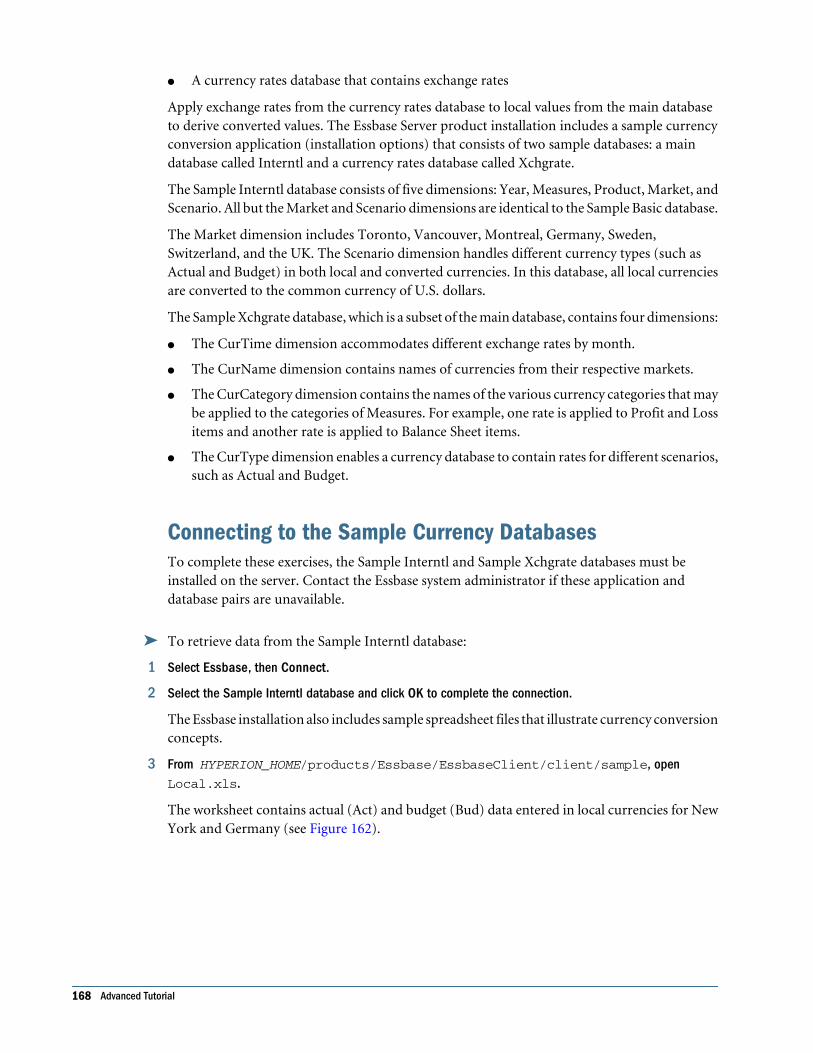
● A currency rates database that contains exchange rates
Apply exchange rates from the currency rates database to local values from the main databaseto derive converted values. The Essbase Server product installation includes a sample currencyconversion application (installation options) that consists of two sample databases: a maindatabase called Interntl and a currency rates database called Xchgrate.
The Sample Interntl database consists of five dimensions: Year, Measures, Product, Market, andScenario. All but the Market and Scenario dimensions are identical to the Sample Basic database.
The Market dimension includes Toronto, Vancouver, Montreal, Germany, Sweden,Switzerland, and the UK. The Scenario dimension handles different currency types (such asActual and Budget) in both local and converted currencies. In this database, all local currenciesare converted to the common currency of U.S. dollars.
The Sample Xchgrate database, which is a subset of the main database, contains four dimensions:
● The CurTime dimension accommodates different exchange rates by month.
● The CurName dimension contains names of currencies from their respective markets.
● The CurCategory dimension contains the names of the various currency categories that maybe applied to the categories of Measures. For example, one rate is applied to Profit and Lossitems and another rate is applied to Balance Sheet items.
● The CurType dimension enables a currency database to contain rates for different scenarios,such as Actual and Budget.
Connecting to the Sample Currency DatabasesTo complete these exercises, the Sample Interntl and Sample Xchgrate databases must beinstalled on the server. Contact the Essbase system administrator if these application anddatabase pairs are unavailable.
➤ To retrieve data from the Sample Interntl database:
1 Select Essbase, then Connect.
2 Select the Sample Interntl database and click OK to complete the connection.
The Essbase installation also includes sample spreadsheet files that illustrate currency conversionconcepts.
3 From HYPERION_HOME/products/Essbase/EssbaseClient/client/sample, openLocal.xls.
The worksheet contains actual (Act) and budget (Bud) data entered in local currencies for NewYork and Germany (see Figure 162).
168 Advanced Tutorial
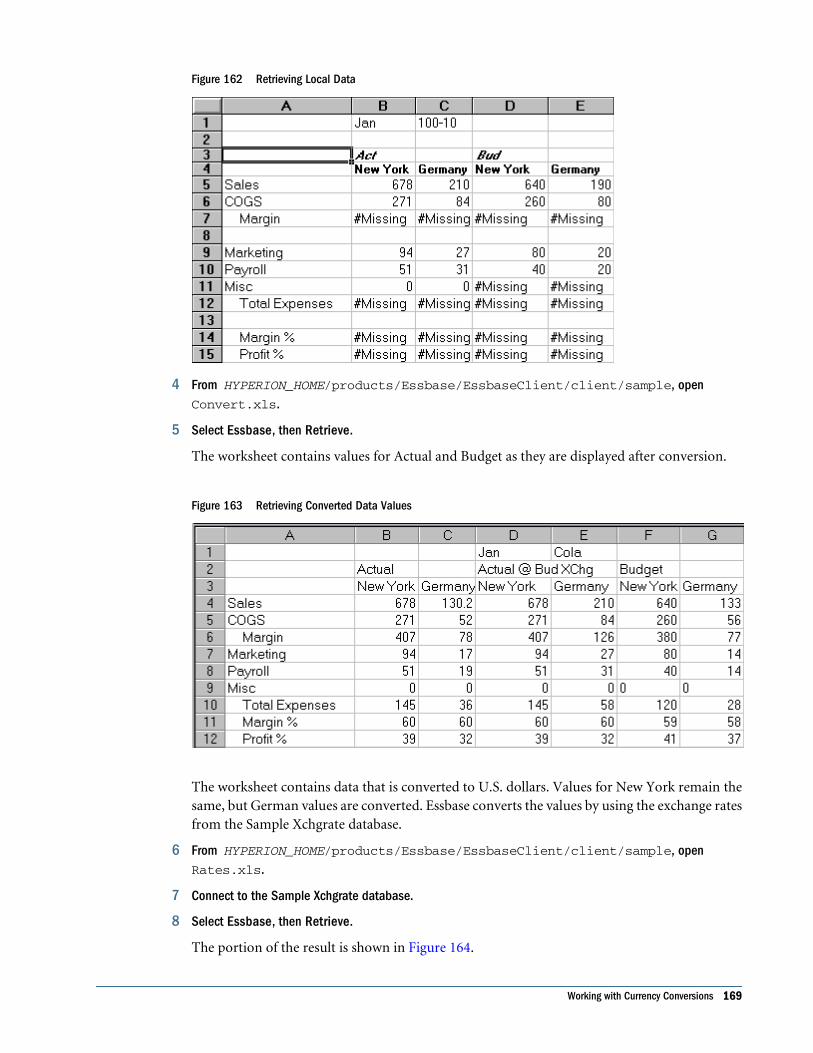
Figure 162 Retrieving Local Data
4 From HYPERION_HOME/products/Essbase/EssbaseClient/client/sample, openConvert.xls.
5 Select Essbase, then Retrieve.
The worksheet contains values for Actual and Budget as they are displayed after conversion.
Figure 163 Retrieving Converted Data Values
The worksheet contains data that is converted to U.S. dollars. Values for New York remain thesame, but German values are converted. Essbase converts the values by using the exchange ratesfrom the Sample Xchgrate database.
6 From HYPERION_HOME/products/Essbase/EssbaseClient/client/sample, openRates.xls.
7 Connect to the Sample Xchgrate database.
8 Select Essbase, then Retrieve.
The portion of the result is shown in Figure 164.
Working with Currency Conversions 169
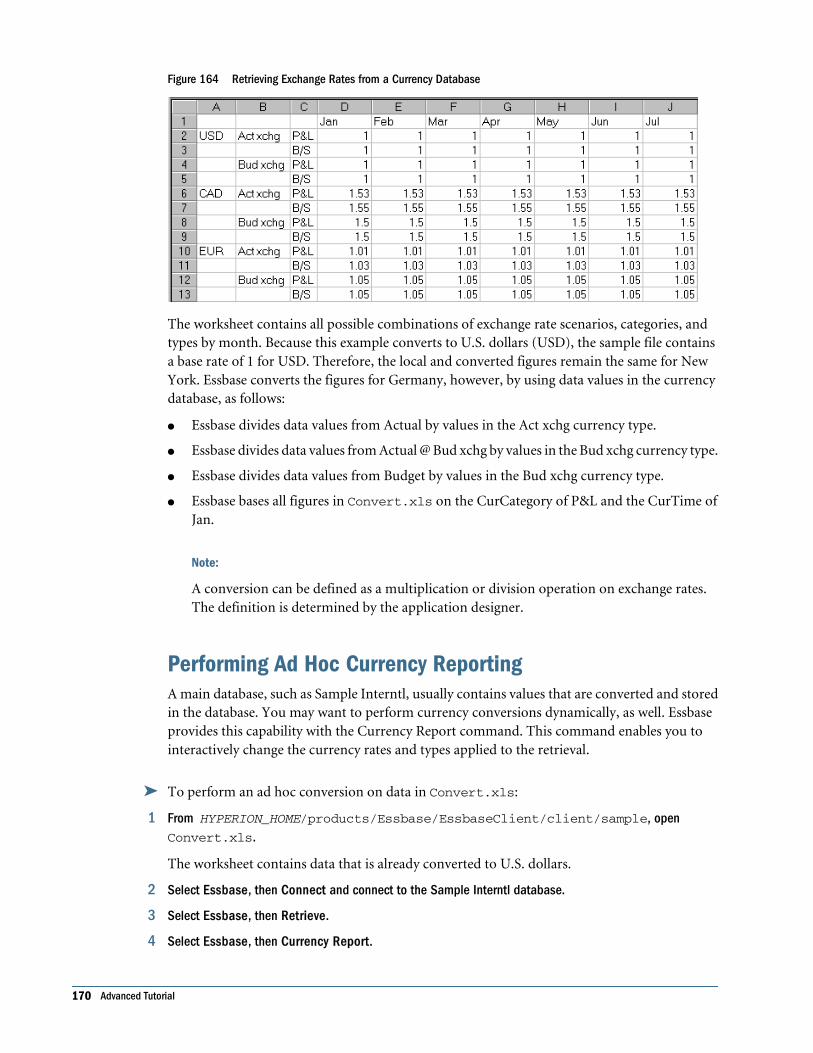
Figure 164 Retrieving Exchange Rates from a Currency Database
The worksheet contains all possible combinations of exchange rate scenarios, categories, andtypes by month. Because this example converts to U.S. dollars (USD), the sample file containsa base rate of 1 for USD. Therefore, the local and converted figures remain the same for NewYork. Essbase converts the figures for Germany, however, by using data values in the currencydatabase, as follows:
● Essbase divides data values from Actual by values in the Act xchg currency type.
● Essbase divides data values from Actual @ Bud xchg by values in the Bud xchg currency type.
● Essbase divides data values from Budget by values in the Bud xchg currency type.
● Essbase bases all figures in Convert.xls on the CurCategory of P&L and the CurTime ofJan.
Note:
A conversion can be defined as a multiplication or division operation on exchange rates.The definition is determined by the application designer.
Performing Ad Hoc Currency ReportingA main database, such as Sample Interntl, usually contains values that are converted and storedin the database. You may want to perform currency conversions dynamically, as well. Essbaseprovides this capability with the Currency Report command. This command enables you tointeractively change the currency rates and types applied to the retrieval.
➤ To perform an ad hoc conversion on data in Convert.xls:
1 From HYPERION_HOME/products/Essbase/EssbaseClient/client/sample, openConvert.xls.
The worksheet contains data that is already converted to U.S. dollars.
2 Select Essbase, then Connect and connect to the Sample Interntl database.
3 Select Essbase, then Retrieve.
4 Select Essbase, then Currency Report.
170 Advanced Tutorial
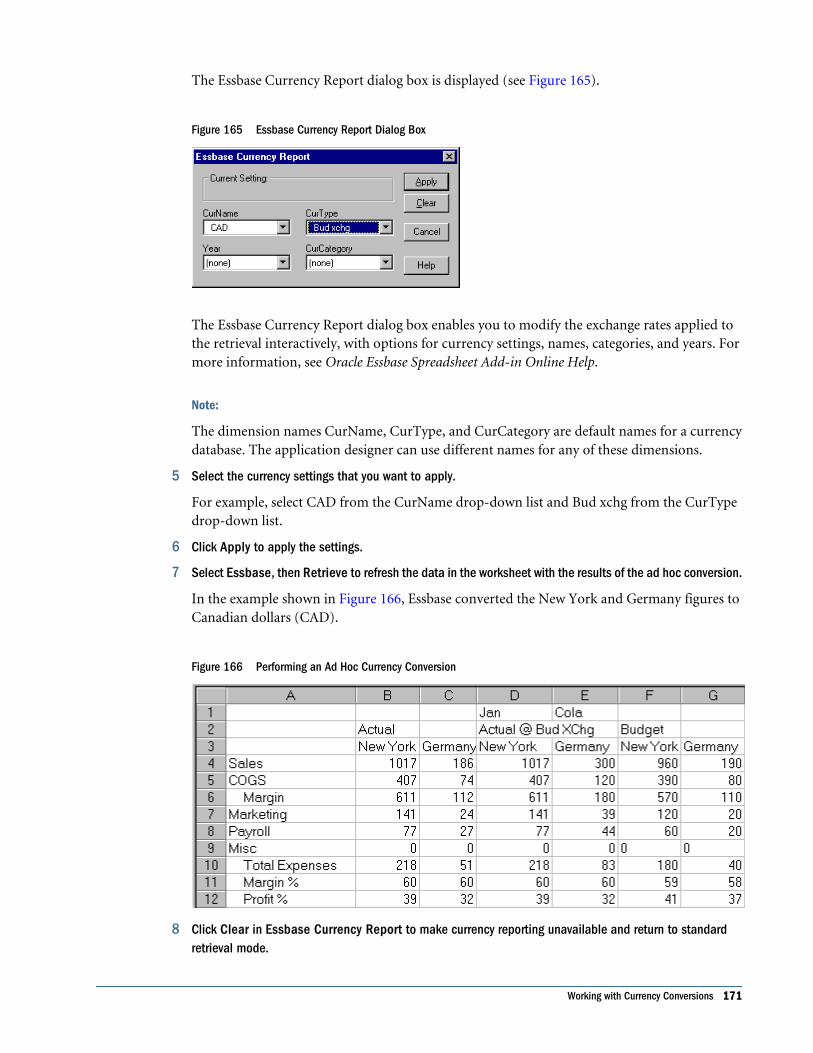
The Essbase Currency Report dialog box is displayed (see Figure 165).
Figure 165 Essbase Currency Report Dialog Box
The Essbase Currency Report dialog box enables you to modify the exchange rates applied tothe retrieval interactively, with options for currency settings, names, categories, and years. Formore information, see Oracle Essbase Spreadsheet Add-in Online Help.
Note:
The dimension names CurName, CurType, and CurCategory are default names for a currencydatabase. The application designer can use different names for any of these dimensions.
5 Select the currency settings that you want to apply.
For example, select CAD from the CurName drop-down list and Bud xchg from the CurTypedrop-down list.
6 Click Apply to apply the settings.
7 Select Essbase, then Retrieve to refresh the data in the worksheet with the results of the ad hoc conversion.
In the example shown in Figure 166, Essbase converted the New York and Germany figures toCanadian dollars (CAD).
Figure 166 Performing an Ad Hoc Currency Conversion
8 Click Clear in Essbase Currency Report to make currency reporting unavailable and return to standardretrieval mode.
Working with Currency Conversions 171

Performing a currency report retrieval does not change values in the database. The processperforms a temporary conversion as part of the retrieval. Converted data values may not alwaysbalance, because the ad hoc conversion is performed on values that were previously calculatedor previously consolidated in another currency.
If values must balance and be verified, they must be converted to the target currency in thedatabase, calculated, and retrieved. This procedure differs from the ad hoc currency conversionretrievals described in this section.
172 Advanced Tutorial
4Drill-Through Tutorial
In This Chapter
About the Drill-Through Tutorial. . . . . . . . . . . . . . . . . . . . . . . . . . . . . . . . . . . . . . . . . . . . . . . . . . . . . . . . . . . . . . . . . . . . . . . . . . . . . . . . . . . . . . . . . . . . . . . . . 173
Understanding Drill-Through ... . . . . . . . . . . . . . . . . . . . . . . . . . . . . . . . . . . . . . . . . . . . . . . . . . . . . . . . . . . . . . . . . . . . . . . . . . . . . . . . . . . . . . . . . . . . . . . . . . 173
About the Drill-Through Wizard ... . . . . . . . . . . . . . . . . . . . . . . . . . . . . . . . . . . . . . . . . . . . . . . . . . . . . . . . . . . . . . . . . . . . . . . . . . . . . . . . . . . . . . . . . . . . . . . 175
Before You Start . . . . . . . . . . . . . . . . . . . . . . . . . . . . . . . . . . . . . . . . . . . . . . . . . . . . . . . . . . . . . . . . . . . . . . . . . . . . . . . . . . . . . . . . . . . . . . . . . . . . . . . . . . . . . . . . . . 176
Accessing Drill-Through Reports from the Spreadsheet .. . . . . . . . . . . . . . . . . . . . . . . . . . . . . . . . . . . . . . . . . . . . . . . . . . . . . . . . . . . . . . . . . . . . . 183
Selecting Drill-Through Reports to View or Customize ... . . . . . . . . . . . . . . . . . . . . . . . . . . . . . . . . . . . . . . . . . . . . . . . . . . . . . . . . . . . . . . . . . . . . . 189
Selecting and Ordering Columns ... . . . . . . . . . . . . . . . . . . . . . . . . . . . . . . . . . . . . . . . . . . . . . . . . . . . . . . . . . . . . . . . . . . . . . . . . . . . . . . . . . . . . . . . . . . . . 194
Ordering Data ... . . . . . . . . . . . . . . . . . . . . . . . . . . . . . . . . . . . . . . . . . . . . . . . . . . . . . . . . . . . . . . . . . . . . . . . . . . . . . . . . . . . . . . . . . . . . . . . . . . . . . . . . . . . . . . . . . 196
Filtering Data ... . . . . . . . . . . . . . . . . . . . . . . . . . . . . . . . . . . . . . . . . . . . . . . . . . . . . . . . . . . . . . . . . . . . . . . . . . . . . . . . . . . . . . . . . . . . . . . . . . . . . . . . . . . . . . . . . . . 198
Disconnecting from Essbase ... . . . . . . . . . . . . . . . . . . . . . . . . . . . . . . . . . . . . . . . . . . . . . . . . . . . . . . . . . . . . . . . . . . . . . . . . . . . . . . . . . . . . . . . . . . . . . . . . . 204
About the Drill-Through TutorialDrill-through is a tool provided with Integration Services, a suite of tools and data integrationservices that serves as a bridge between relational data sources and Essbase Server. IntegrationServices works with Essbase and Spreadsheet Add-in. Essbase.
Drill-through enables you to view and customize spreadsheet reports that display data retrievedfrom relational databases.
This tutorial provides a brief overview of drill-through and guides you through tasks for usingdrill-through. It includes a description of the sample database, spreadsheet file, and drill-throughreport used in the tutorial.
Understanding Drill-ThroughDespite the benefits of the multidimensional database for storing analytic data, some dataelements required for analysis are better suited to the relational structure of a relational database.
The scope of data residing in an Essbase database is typically at a summary level, where data issummarized and calculated for planning and analysis. Detailed, transactional data usually is notexamined during the planning and analysis of a business.
For example, you might use Essbase to analyze retail sales for the first quarter in the Easternregion. Detailed data, such as a list of customers who purchased a particular product in a
About the Drill-Through Tutorial 173
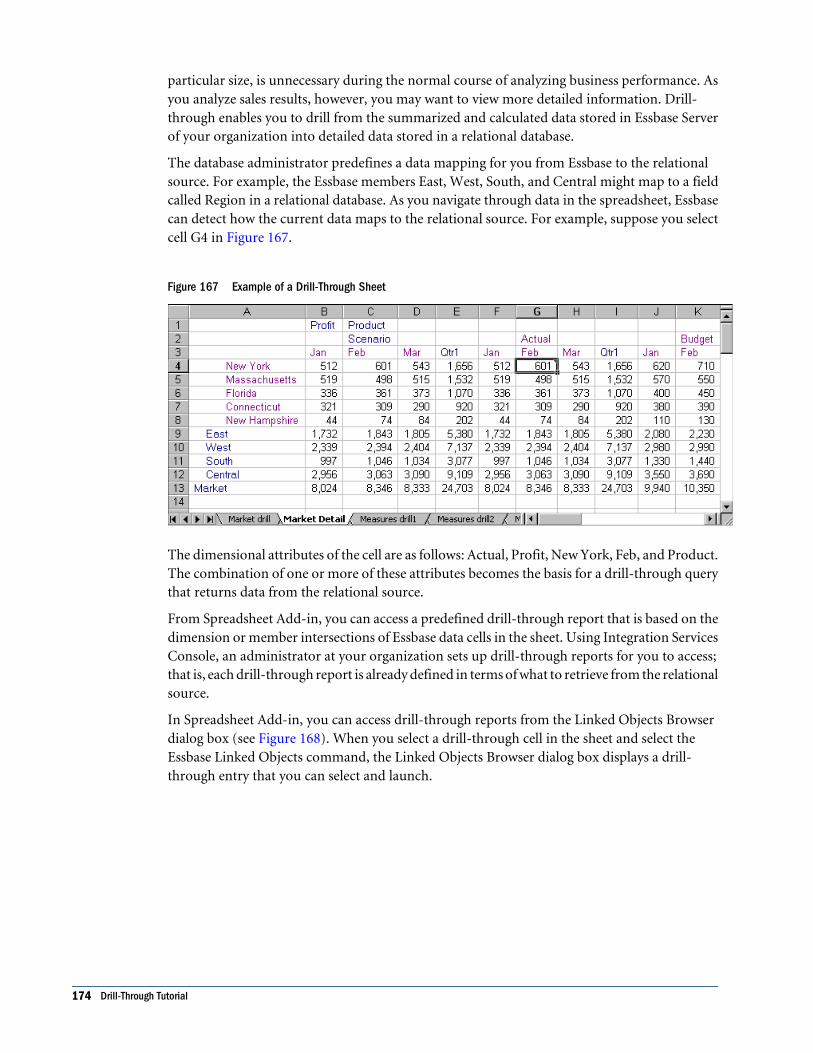
particular size, is unnecessary during the normal course of analyzing business performance. Asyou analyze sales results, however, you may want to view more detailed information. Drill-through enables you to drill from the summarized and calculated data stored in Essbase Serverof your organization into detailed data stored in a relational database.
The database administrator predefines a data mapping for you from Essbase to the relationalsource. For example, the Essbase members East, West, South, and Central might map to a fieldcalled Region in a relational database. As you navigate through data in the spreadsheet, Essbasecan detect how the current data maps to the relational source. For example, suppose you selectcell G4 in Figure 167.
Figure 167 Example of a Drill-Through Sheet
The dimensional attributes of the cell are as follows: Actual, Profit, New York, Feb, and Product.The combination of one or more of these attributes becomes the basis for a drill-through querythat returns data from the relational source.
From Spreadsheet Add-in, you can access a predefined drill-through report that is based on thedimension or member intersections of Essbase data cells in the sheet. Using Integration ServicesConsole, an administrator at your organization sets up drill-through reports for you to access;that is, each drill-through report is already defined in terms of what to retrieve from the relationalsource.
In Spreadsheet Add-in, you can access drill-through reports from the Linked Objects Browserdialog box (see Figure 168). When you select a drill-through cell in the sheet and select theEssbase Linked Objects command, the Linked Objects Browser dialog box displays a drill-through entry that you can select and launch.
174 Drill-Through Tutorial
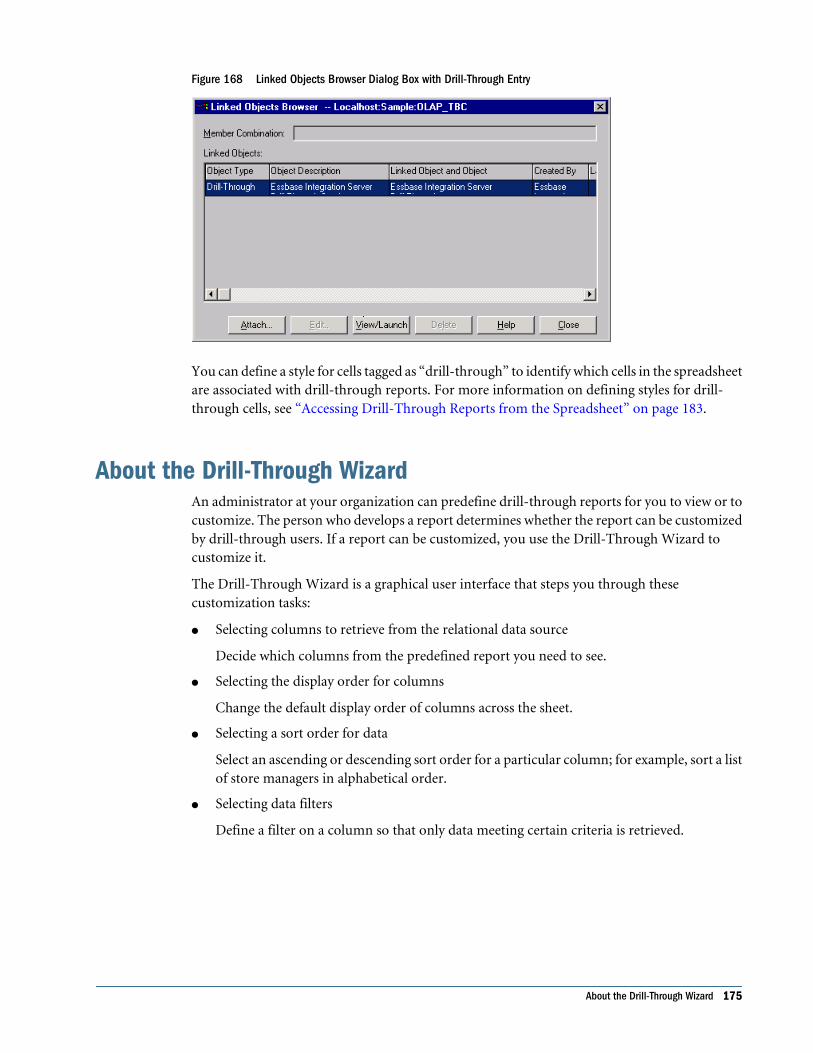
Figure 168 Linked Objects Browser Dialog Box with Drill-Through Entry
You can define a style for cells tagged as “drill-through” to identify which cells in the spreadsheetare associated with drill-through reports. For more information on defining styles for drill-through cells, see “Accessing Drill-Through Reports from the Spreadsheet” on page 183.
About the Drill-Through WizardAn administrator at your organization can predefine drill-through reports for you to view or tocustomize. The person who develops a report determines whether the report can be customizedby drill-through users. If a report can be customized, you use the Drill-Through Wizard tocustomize it.
The Drill-Through Wizard is a graphical user interface that steps you through thesecustomization tasks:
● Selecting columns to retrieve from the relational data source
Decide which columns from the predefined report you need to see.
● Selecting the display order for columns
Change the default display order of columns across the sheet.
● Selecting a sort order for data
Select an ascending or descending sort order for a particular column; for example, sort a listof store managers in alphabetical order.
● Selecting data filters
Define a filter on a column so that only data meeting certain criteria is retrieved.
About the Drill-Through Wizard 175
Before You StartBefore starting the tutorial, you should have a working familiarity with the Essbase productthrough the use of the Spreadsheet Add-in interface. Review in this guide Chapter 2, “BasicTutorial” and Chapter 3, “Advanced Tutorial” as prerequisite reading.
A sample Essbase database is the basis for the examples in this tutorial. The databaseadministrator creates this sample Essbase database using the sample metaoutline suppliedwithIntegration Services (see Oracle Essbase Integration Services Online Help). A samplespreadsheet file, Essdt.xls, contains a worksheet with the appropriate member intersectionsfor the sample drill-through report. For more information on the sample database, spreadsheetfile, and drill-through report, see “About the Samples Used in This Tutorial” on page 182.
If you plan to follow the examples in a live working session, check with the person at yourorganization who installs theIntegration Services product family for information on the sampledatabase that you need for drill-through, and to which instance of Essbase Server you shouldconnect.
Note:
The Essdt.xls file also contains sample results of the drill-through reports when you run themwithout customizing the reports. The results are provided in separate sheets in the workbook sothat you can see the sample report results without working through the tutorial. For moreinformation about the sample reports, see “About the Samples Used in This Tutorial” on page182.
Before starting the tutorial, make sure you meet these requirements:
● You must install these components on your client computer:
❍ A 32-bit version of Excel
❍ Spreadsheet Add-in
❍ The Drill-through module
The drill-through module is installed automatically when you install Spreadsheet Add-in. This module is transparent until you invoke it from the Linked Objects Browser. Formore information on installation, contact the Essbase system administrator.
● The Essbase system administrator must install the Essbase Server.
● You must have access toIntegration Services and to an instance of Essbase Server. For moreinformation, contact the Essbase system administrator or the person who administersIntegration Services at your organization.
● You must have access to the underlying relational database (typically using a user name andpassword that are different from those that you use for Essbase). To obtain the appropriateaccess, contact the Essbase system administrator or the person who administers IntegrationServices at your organization.
● Make sure that the Essdt.xls sample drill-through report spreadsheet is available inHYPERION_HOME/products/Essbase/EssbaseClient/client/sample.
176 Drill-Through Tutorial
● To use the Essdt.xls sample drill-through report spreadsheet, you need to log in to acomputer with both Essbase Server and Integration Services installed. You must perform amember and data load and calculate the data for the sample Essbase database that you willaccess from Spreadsheet Add-in.
● The sample database that contains the drill-through report must be set up and running. Thesample drill-through reports used in this tutorial (called “Market Detail,” “Measures Detail,”and “Product Detail”) are available with the sample spreadsheet files. Contact the person atyour organization who installs Integration Services to find out the name of the sampledatabase to use for drill-through.
For more information on Essbase installations, see the Essbase Integration Services InstallationGuide. For more information on Essbase installations, see the Oracle Hyperion EnterprisePerformance Management System Installation and Configuration Guide.
➤ Before starting the drill-through tutorial, perform these tasks:
1 Open the sample Essdt.xls file.
The sample spreadsheet file contains the appropriate member intersections from the sampledatabase for the drill-through report. This file is provided as part of the default Essbaseinstallation.
2 Set a style for data cells that are associated with drill-through reports.
Keep in mind these guidelines during the tutorial:
● Each tutorial task builds upon the previous one, and tasks must be followed in succession.
● Optional tasks are included for your reference only and should not be performed as part ofthe tutorial. For more information on these tasks, see the Drill-through Help sectionof .Oracle Essbase Spreadsheet Add-in Online Help
● The examples used in this tutorial are based on the sample database that is included withthe Integration Services installation. Contact the person at your organization who installsIntegration Services for information about accessing the sample database.
● Set the options in the Essbase Options dialog box as described in “Setting Essbase Options”on page 177. If the option settings are different, the illustrations presented in this chaptermay not match the spreadsheet view.
● If you make a mistake during the tutorial, select Essbase, then FlashBack, to return to theprevious spreadsheet view.
Setting Essbase OptionsBefore you begin the tutorial, make sure that the spreadsheet options are set to the initial settings,as illustrated in Figure 169 through Figure 173. If your option settings are different, theillustrations presented in this chapter may not match the spreadsheet view.
For information about Essbase options, see Oracle Essbase Spreadsheet Add-in Online Help.
Before You Start 177
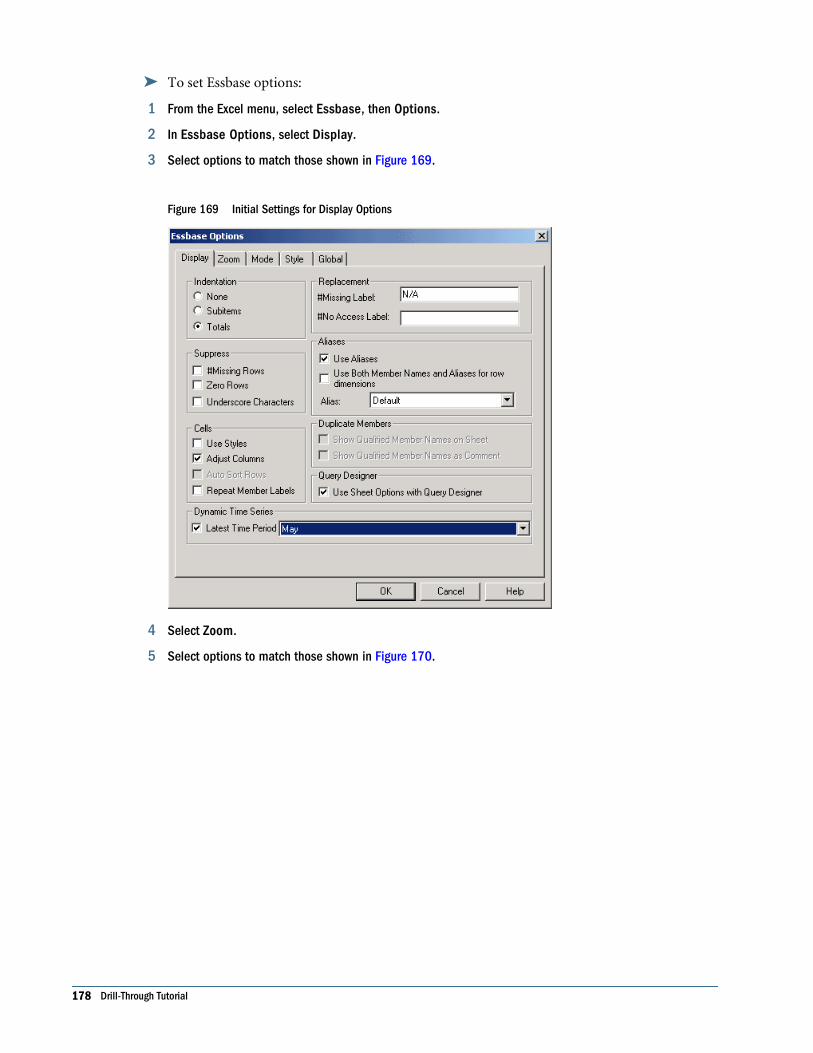
➤ To set Essbase options:
1 From the Excel menu, select Essbase, then Options.
2 In Essbase Options, select Display.
3 Select options to match those shown in Figure 169.
Figure 169 Initial Settings for Display Options
4 Select Zoom.
5 Select options to match those shown in Figure 170.
178 Drill-Through Tutorial
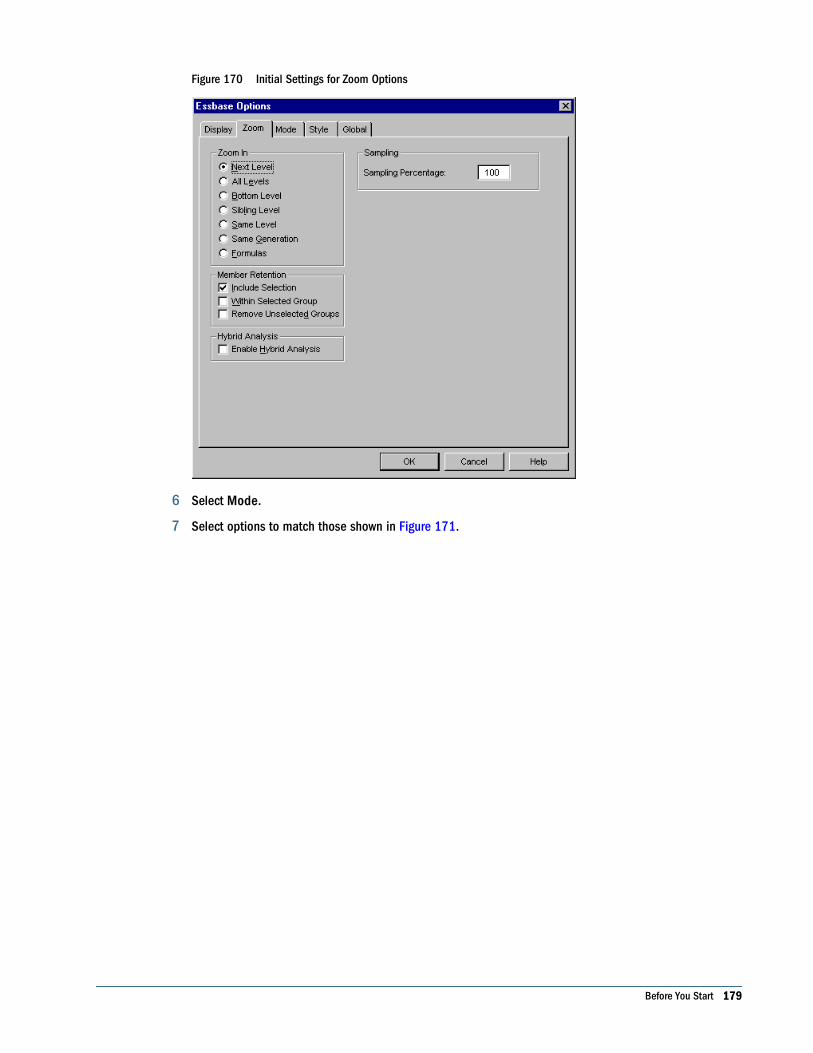
Figure 170 Initial Settings for Zoom Options
6 Select Mode.
7 Select options to match those shown in Figure 171.
Before You Start 179
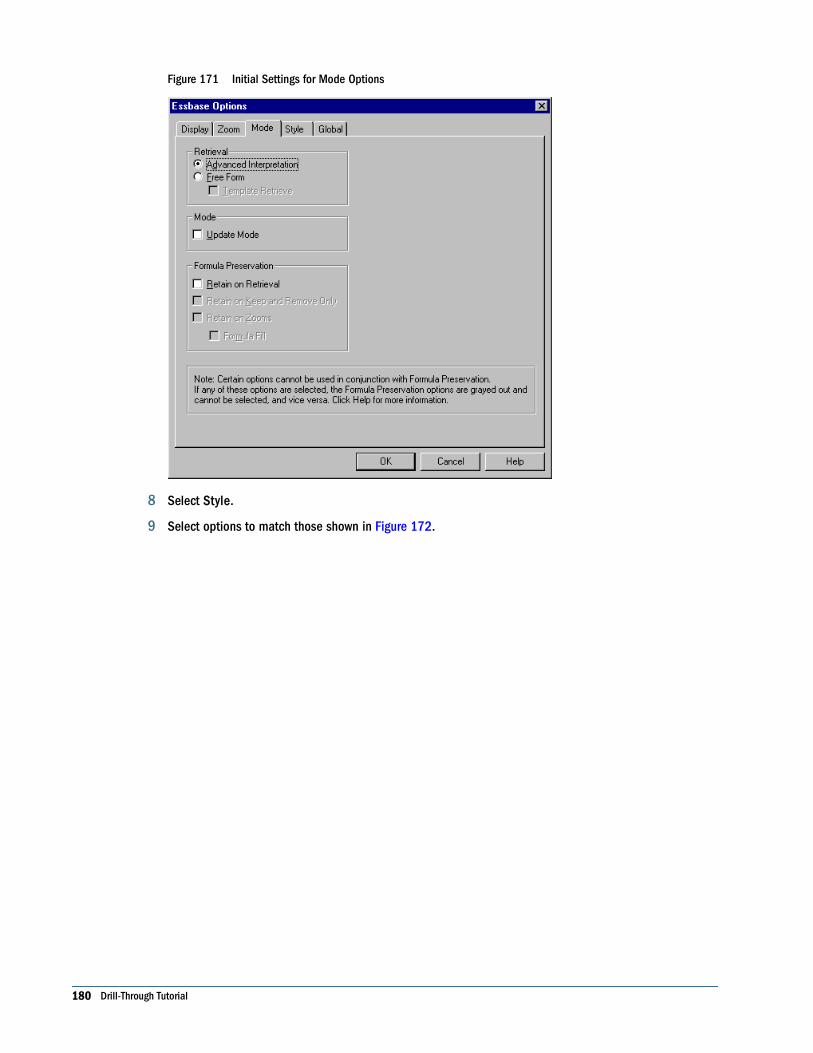
Figure 171 Initial Settings for Mode Options
8 Select Style.
9 Select options to match those shown in Figure 172.
180 Drill-Through Tutorial
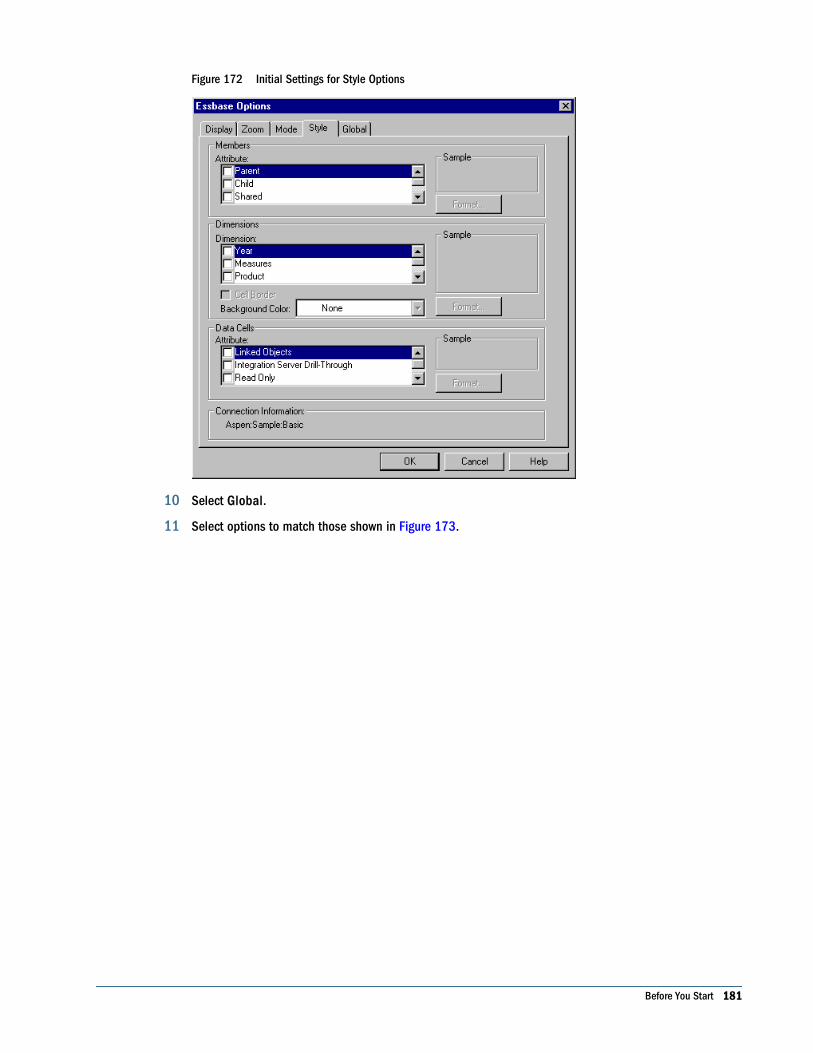
Figure 172 Initial Settings for Style Options
10 Select Global.
11 Select options to match those shown in Figure 173.
Before You Start 181
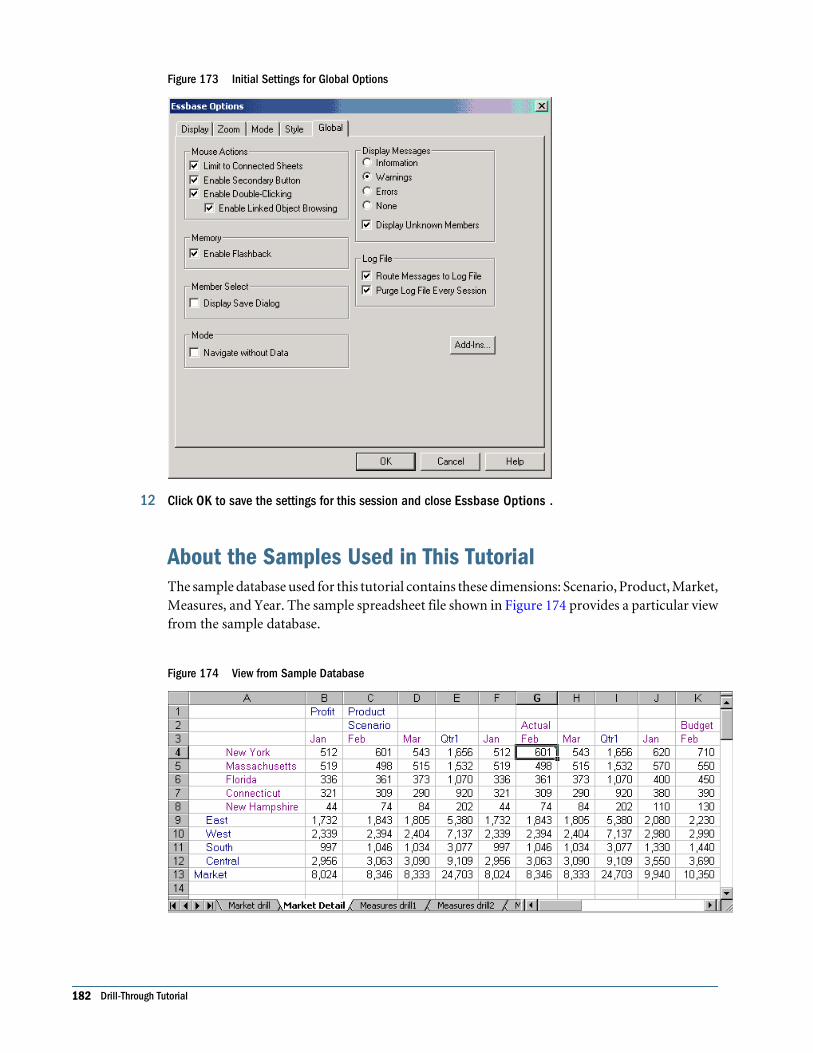
Figure 173 Initial Settings for Global Options
12 Click OK to save the settings for this session and close Essbase Options .
About the Samples Used in This TutorialThe sample database used for this tutorial contains these dimensions: Scenario, Product, Market,Measures, and Year. The sample spreadsheet file shown in Figure 174 provides a particular viewfrom the sample database.
Figure 174 View from Sample Database
182 Drill-Through Tutorial
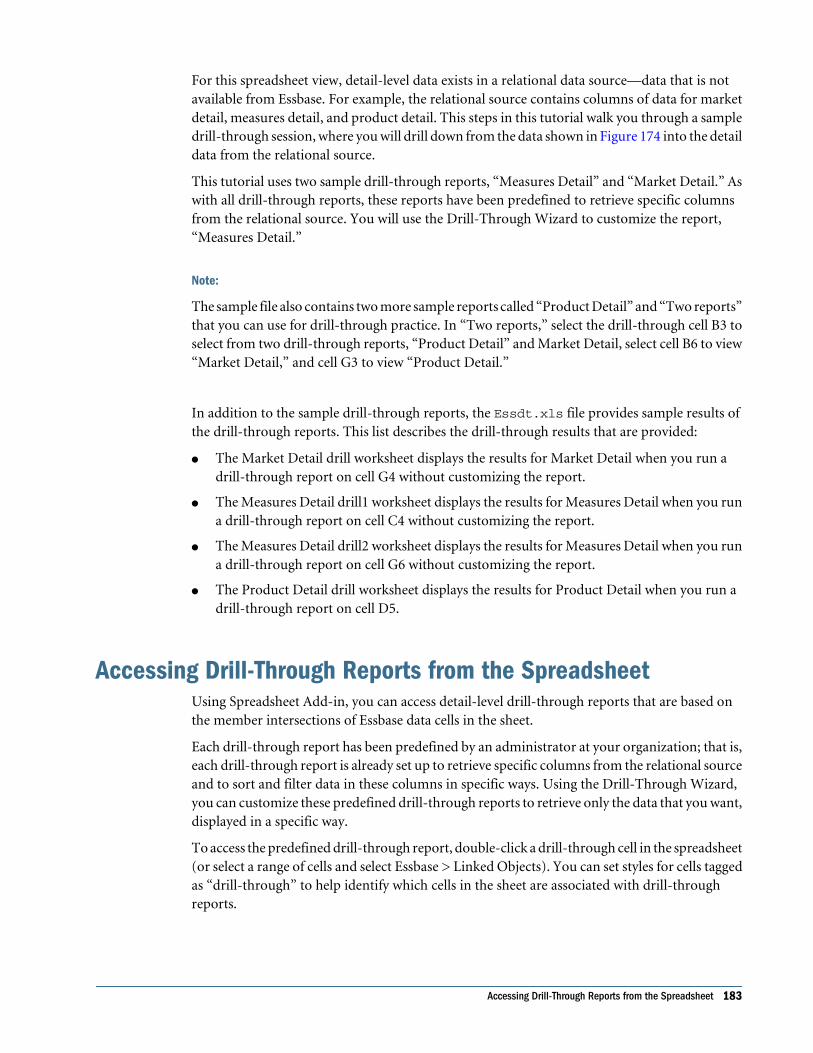
For this spreadsheet view, detail-level data exists in a relational data source—data that is notavailable from Essbase. For example, the relational source contains columns of data for marketdetail, measures detail, and product detail. This steps in this tutorial walk you through a sampledrill-through session, where you will drill down from the data shown in Figure 174 into the detaildata from the relational source.
This tutorial uses two sample drill-through reports, “Measures Detail” and “Market Detail.” Aswith all drill-through reports, these reports have been predefined to retrieve specific columnsfrom the relational source. You will use the Drill-Through Wizard to customize the report,“Measures Detail.”
Note:
The sample file also contains two more sample reports called “Product Detail” and “Two reports”that you can use for drill-through practice. In “Two reports,” select the drill-through cell B3 toselect from two drill-through reports, “Product Detail” and Market Detail, select cell B6 to view“Market Detail,” and cell G3 to view “Product Detail.”
In addition to the sample drill-through reports, the Essdt.xls file provides sample results ofthe drill-through reports. This list describes the drill-through results that are provided:
● The Market Detail drill worksheet displays the results for Market Detail when you run adrill-through report on cell G4 without customizing the report.
● The Measures Detail drill1 worksheet displays the results for Measures Detail when you runa drill-through report on cell C4 without customizing the report.
● The Measures Detail drill2 worksheet displays the results for Measures Detail when you runa drill-through report on cell G6 without customizing the report.
● The Product Detail drill worksheet displays the results for Product Detail when you run adrill-through report on cell D5.
Accessing Drill-Through Reports from the SpreadsheetUsing Spreadsheet Add-in, you can access detail-level drill-through reports that are based onthe member intersections of Essbase data cells in the sheet.
Each drill-through report has been predefined by an administrator at your organization; that is,each drill-through report is already set up to retrieve specific columns from the relational sourceand to sort and filter data in these columns in specific ways. Using the Drill-Through Wizard,you can customize these predefined drill-through reports to retrieve only the data that you want,displayed in a specific way.
To access the predefined drill-through report, double-click a drill-through cell in the spreadsheet(or select a range of cells and select Essbase > Linked Objects). You can set styles for cells taggedas “drill-through” to help identify which cells in the sheet are associated with drill-throughreports.
Accessing Drill-Through Reports from the Spreadsheet 183
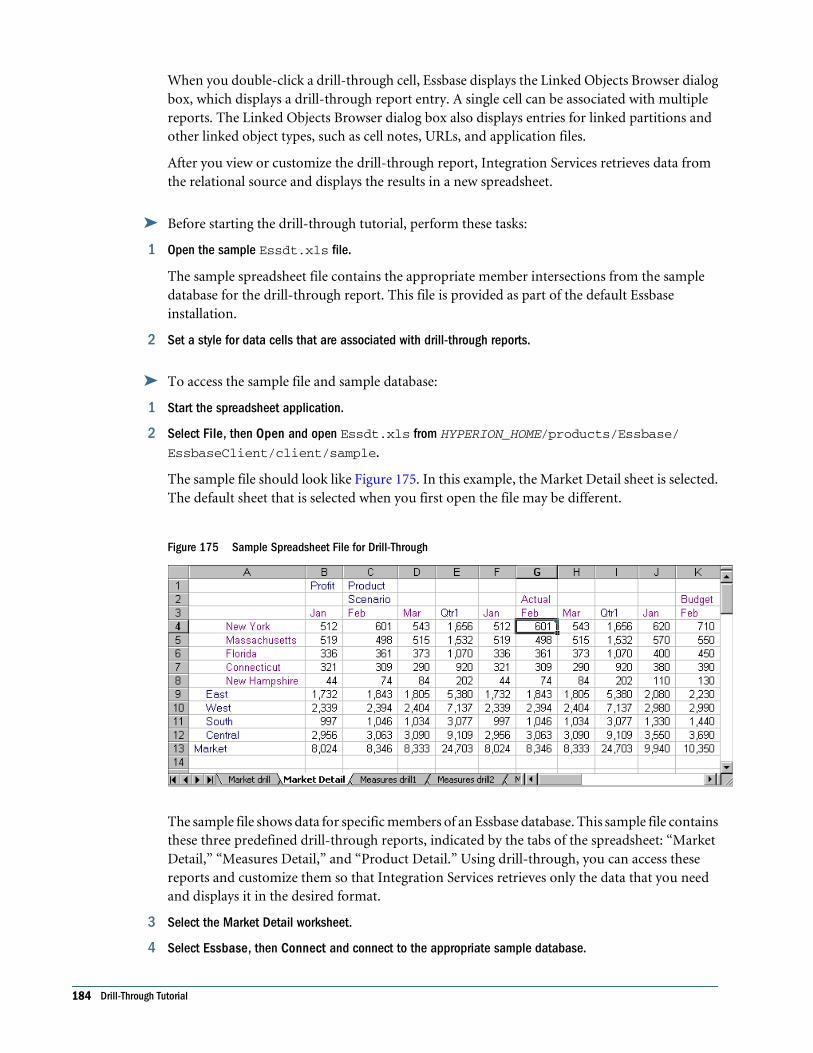
When you double-click a drill-through cell, Essbase displays the Linked Objects Browser dialogbox, which displays a drill-through report entry. A single cell can be associated with multiplereports. The Linked Objects Browser dialog box also displays entries for linked partitions andother linked object types, such as cell notes, URLs, and application files.
After you view or customize the drill-through report, Integration Services retrieves data fromthe relational source and displays the results in a new spreadsheet.
➤ Before starting the drill-through tutorial, perform these tasks:
1 Open the sample Essdt.xls file.
The sample spreadsheet file contains the appropriate member intersections from the sampledatabase for the drill-through report. This file is provided as part of the default Essbaseinstallation.
2 Set a style for data cells that are associated with drill-through reports.
➤ To access the sample file and sample database:
1 Start the spreadsheet application.
2 Select File, then Open and open Essdt.xls from HYPERION_HOME/products/Essbase/EssbaseClient/client/sample.
The sample file should look like Figure 175. In this example, the Market Detail sheet is selected.The default sheet that is selected when you first open the file may be different.
Figure 175 Sample Spreadsheet File for Drill-Through
The sample file shows data for specific members of an Essbase database. This sample file containsthese three predefined drill-through reports, indicated by the tabs of the spreadsheet: “MarketDetail,” “Measures Detail,” and “Product Detail.” Using drill-through, you can access thesereports and customize them so that Integration Services retrieves only the data that you needand displays it in the desired format.
3 Select the Market Detail worksheet.
4 Select Essbase, then Connect and connect to the appropriate sample database.
184 Drill-Through Tutorial
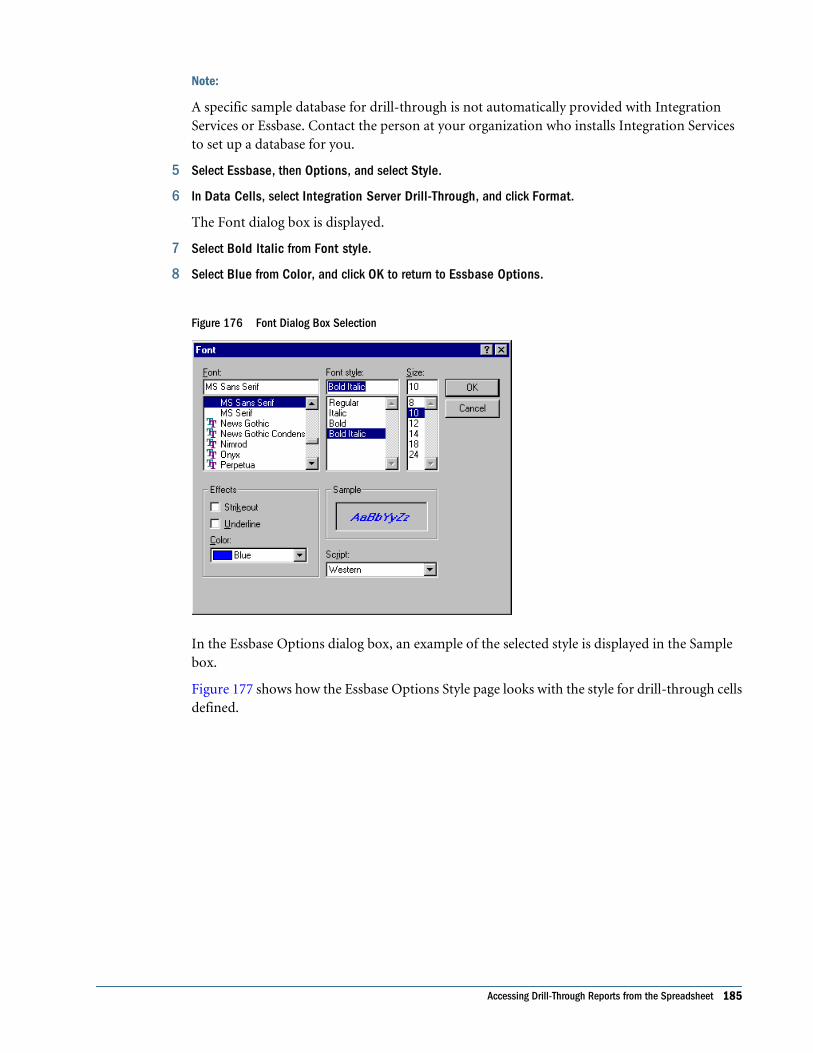
Note:
A specific sample database for drill-through is not automatically provided with IntegrationServices or Essbase. Contact the person at your organization who installs Integration Servicesto set up a database for you.
5 Select Essbase, then Options, and select Style.
6 In Data Cells, select Integration Server Drill-Through, and click Format.
The Font dialog box is displayed.
7 Select Bold Italic from Font style.
8 Select Blue from Color, and click OK to return to Essbase Options.
Figure 176 Font Dialog Box Selection
In the Essbase Options dialog box, an example of the selected style is displayed in the Samplebox.
Figure 177 shows how the Essbase Options Style page looks with the style for drill-through cellsdefined.
Accessing Drill-Through Reports from the Spreadsheet 185
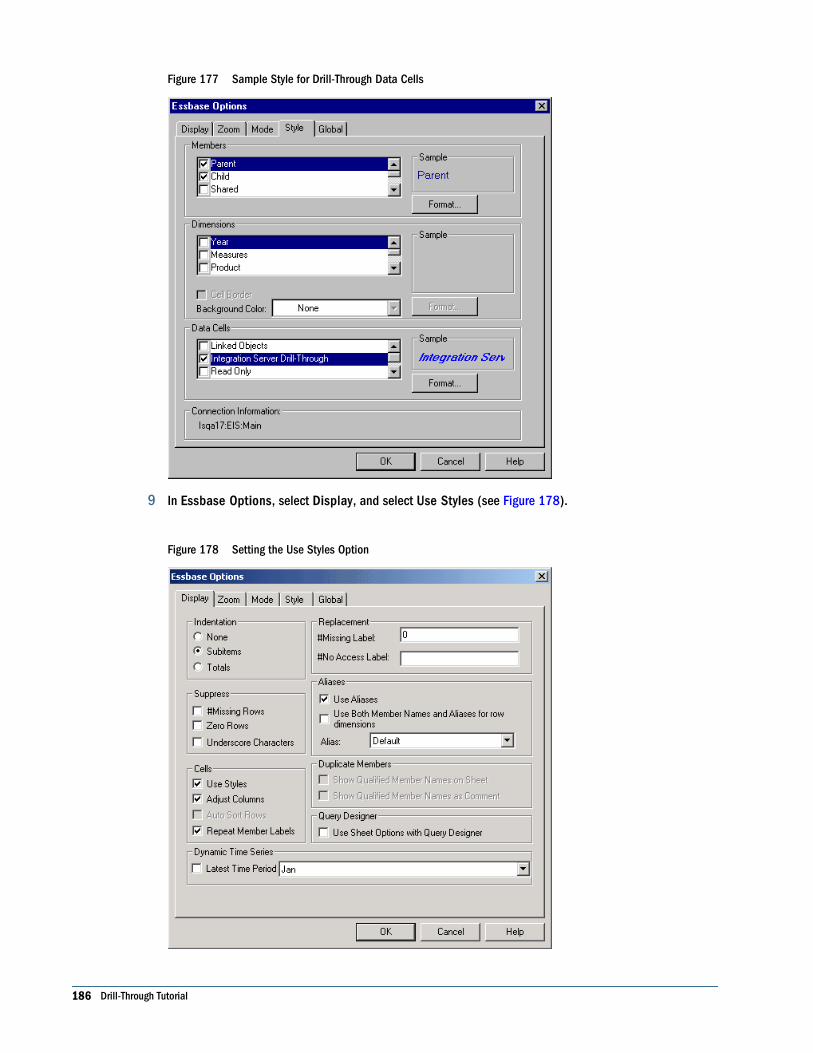
Figure 177 Sample Style for Drill-Through Data Cells
9 In Essbase Options, select Display, and select Use Styles (see Figure 178).
Figure 178 Setting the Use Styles Option
186 Drill-Through Tutorial
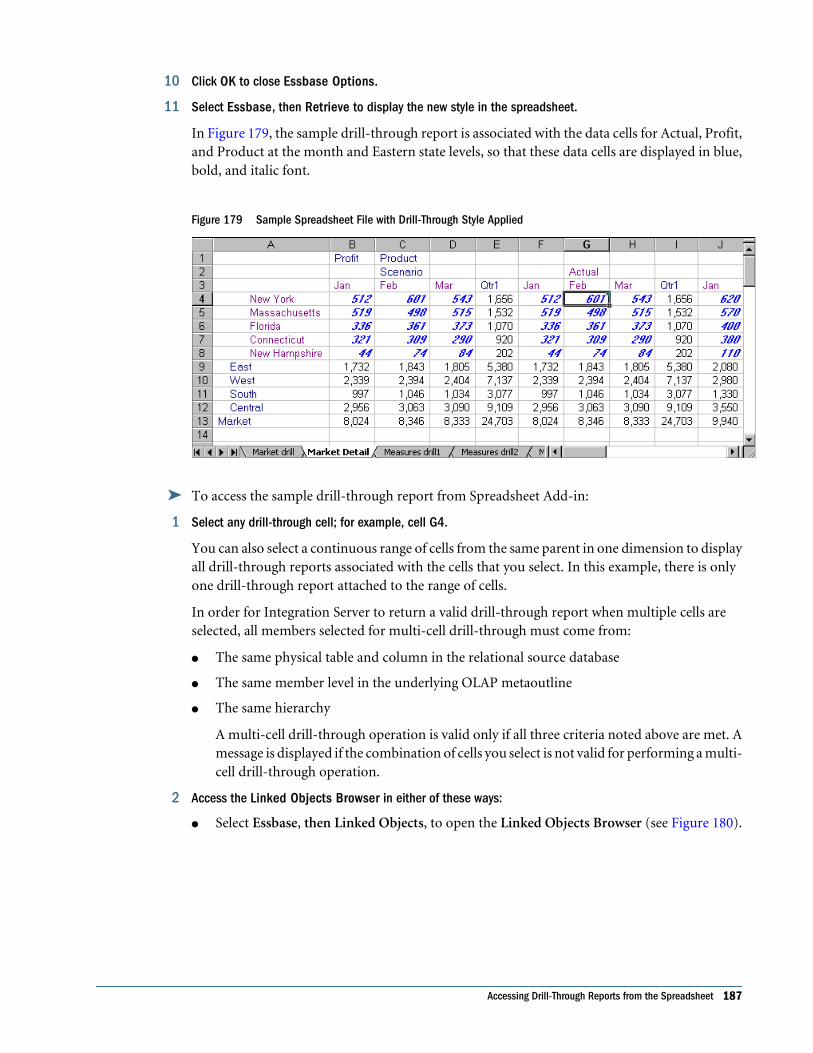
10 Click OK to close Essbase Options.
11 Select Essbase, then Retrieve to display the new style in the spreadsheet.
In Figure 179, the sample drill-through report is associated with the data cells for Actual, Profit,and Product at the month and Eastern state levels, so that these data cells are displayed in blue,bold, and italic font.
Figure 179 Sample Spreadsheet File with Drill-Through Style Applied
➤ To access the sample drill-through report from Spreadsheet Add-in:
1 Select any drill-through cell; for example, cell G4.
You can also select a continuous range of cells from the same parent in one dimension to displayall drill-through reports associated with the cells that you select. In this example, there is onlyone drill-through report attached to the range of cells.
In order for Integration Server to return a valid drill-through report when multiple cells areselected, all members selected for multi-cell drill-through must come from:
● The same physical table and column in the relational source database
● The same member level in the underlying OLAP metaoutline
● The same hierarchy
A multi-cell drill-through operation is valid only if all three criteria noted above are met. Amessage is displayed if the combination of cells you select is not valid for performing a multi-cell drill-through operation.
2 Access the Linked Objects Browser in either of these ways:
● Select Essbase, then Linked Objects, to open the Linked Objects Browser (see Figure 180).
Accessing Drill-Through Reports from the Spreadsheet 187
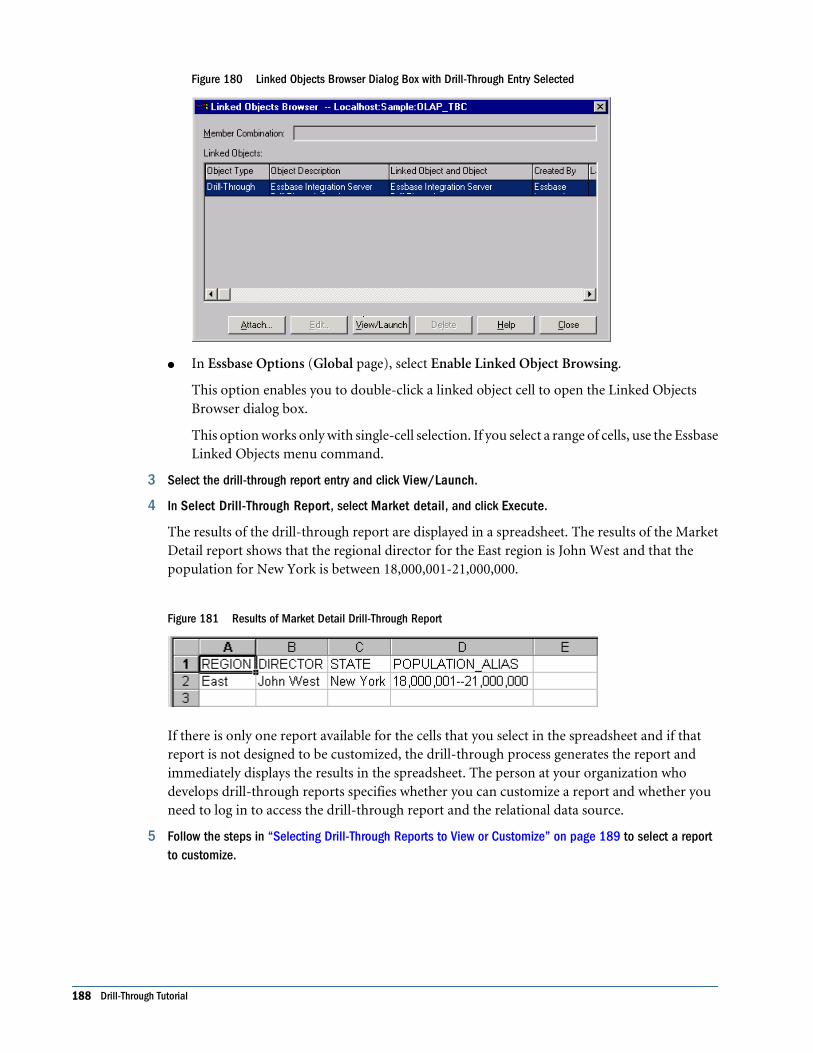
Figure 180 Linked Objects Browser Dialog Box with Drill-Through Entry Selected
● In Essbase Options (Global page), select Enable Linked Object Browsing.
This option enables you to double-click a linked object cell to open the Linked ObjectsBrowser dialog box.
This option works only with single-cell selection. If you select a range of cells, use the EssbaseLinked Objects menu command.
3 Select the drill-through report entry and click View/Launch.
4 In Select Drill-Through Report, select Market detail, and click Execute.
The results of the drill-through report are displayed in a spreadsheet. The results of the MarketDetail report shows that the regional director for the East region is John West and that thepopulation for New York is between 18,000,001-21,000,000.
Figure 181 Results of Market Detail Drill-Through Report
If there is only one report available for the cells that you select in the spreadsheet and if thatreport is not designed to be customized, the drill-through process generates the report andimmediately displays the results in the spreadsheet. The person at your organization whodevelops drill-through reports specifies whether you can customize a report and whether youneed to log in to access the drill-through report and the relational data source.
5 Follow the steps in “Selecting Drill-Through Reports to View or Customize” on page 189 to select a reportto customize.
188 Drill-Through Tutorial
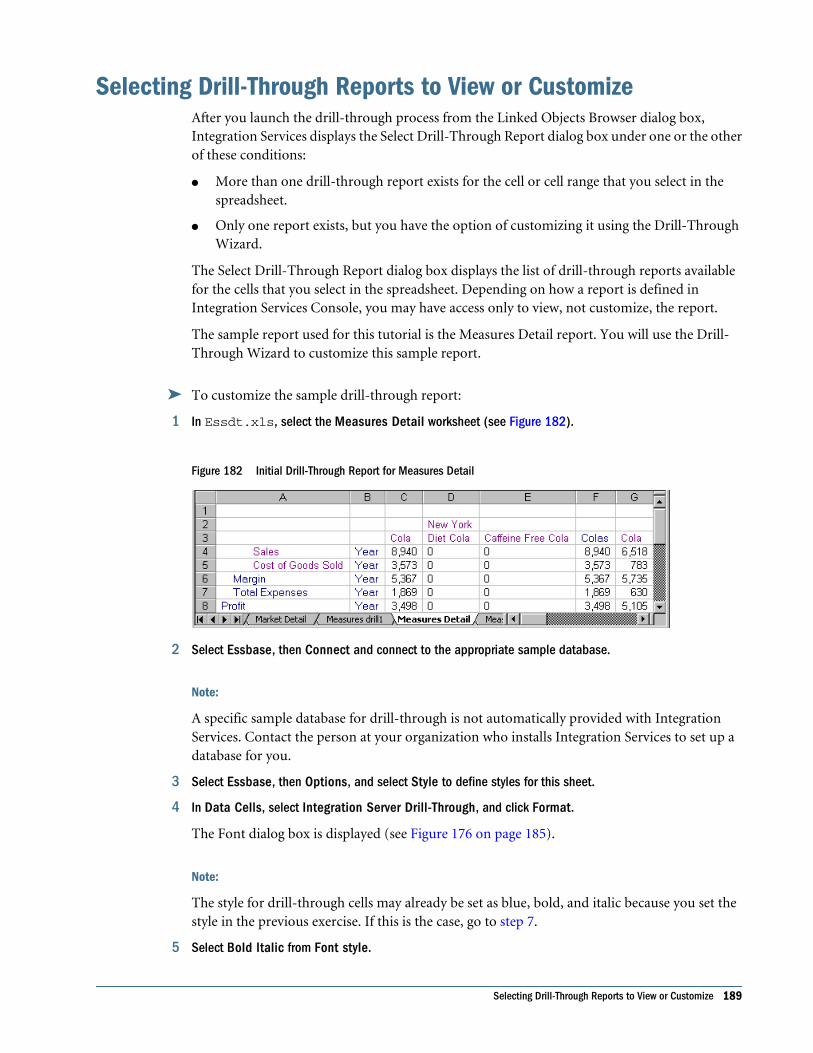
Selecting Drill-Through Reports to View or CustomizeAfter you launch the drill-through process from the Linked Objects Browser dialog box,Integration Services displays the Select Drill-Through Report dialog box under one or the otherof these conditions:
● More than one drill-through report exists for the cell or cell range that you select in thespreadsheet.
● Only one report exists, but you have the option of customizing it using the Drill-ThroughWizard.
The Select Drill-Through Report dialog box displays the list of drill-through reports availablefor the cells that you select in the spreadsheet. Depending on how a report is defined inIntegration Services Console, you may have access only to view, not customize, the report.
The sample report used for this tutorial is the Measures Detail report. You will use the Drill-Through Wizard to customize this sample report.
➤ To customize the sample drill-through report:
1 In Essdt.xls, select the Measures Detail worksheet (see Figure 182).
Figure 182 Initial Drill-Through Report for Measures Detail
2 Select Essbase, then Connect and connect to the appropriate sample database.
Note:
A specific sample database for drill-through is not automatically provided with IntegrationServices. Contact the person at your organization who installs Integration Services to set up adatabase for you.
3 Select Essbase, then Options, and select Style to define styles for this sheet.
4 In Data Cells, select Integration Server Drill-Through, and click Format.
The Font dialog box is displayed (see Figure 176 on page 185).
Note:
The style for drill-through cells may already be set as blue, bold, and italic because you set thestyle in the previous exercise. If this is the case, go to step 7.
5 Select Bold Italic from Font style.
Selecting Drill-Through Reports to View or Customize 189
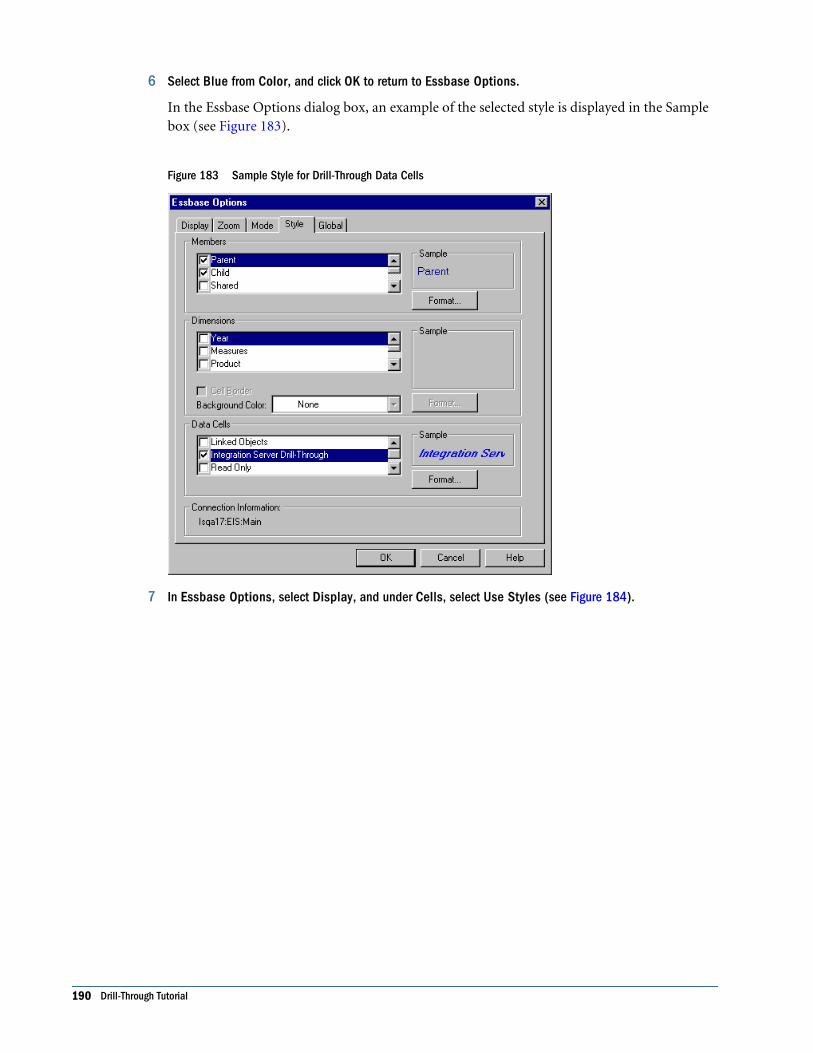
6 Select Blue from Color, and click OK to return to Essbase Options.
In the Essbase Options dialog box, an example of the selected style is displayed in the Samplebox (see Figure 183).
Figure 183 Sample Style for Drill-Through Data Cells
7 In Essbase Options, select Display, and under Cells, select Use Styles (see Figure 184).
190 Drill-Through Tutorial
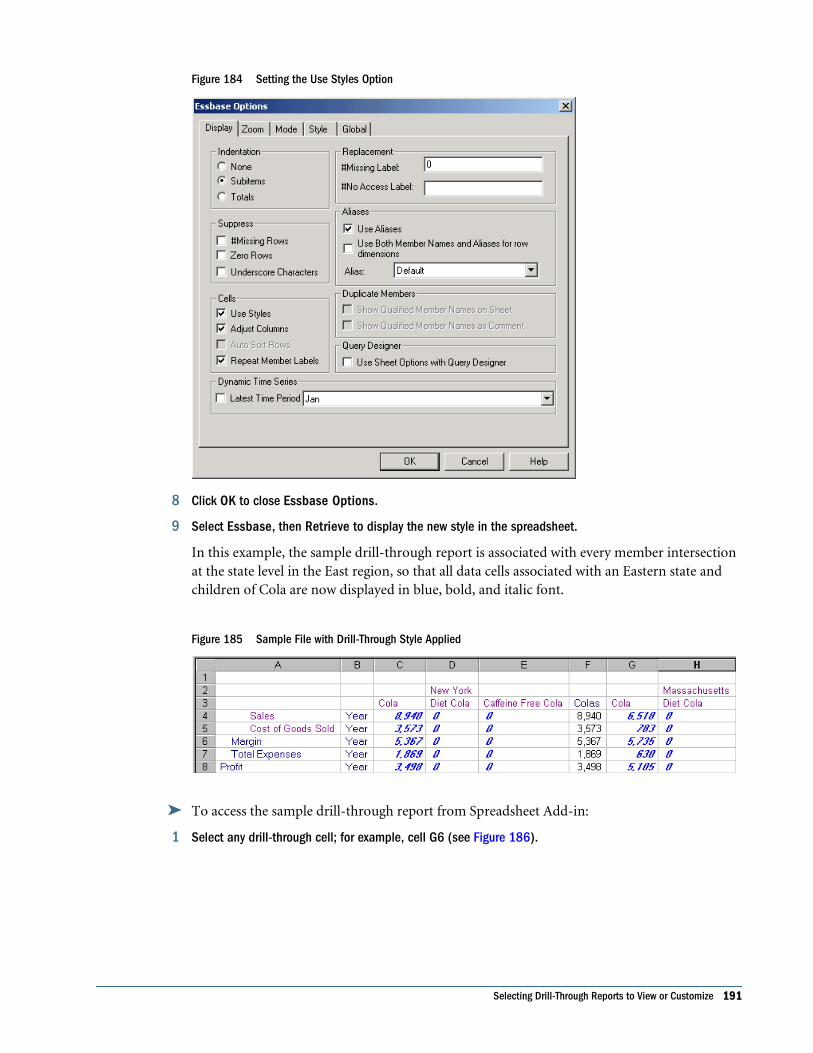
Figure 184 Setting the Use Styles Option
8 Click OK to close Essbase Options.
9 Select Essbase, then Retrieve to display the new style in the spreadsheet.
In this example, the sample drill-through report is associated with every member intersectionat the state level in the East region, so that all data cells associated with an Eastern state andchildren of Cola are now displayed in blue, bold, and italic font.
Figure 185 Sample File with Drill-Through Style Applied
➤ To access the sample drill-through report from Spreadsheet Add-in:
1 Select any drill-through cell; for example, cell G6 (see Figure 186).
Selecting Drill-Through Reports to View or Customize 191
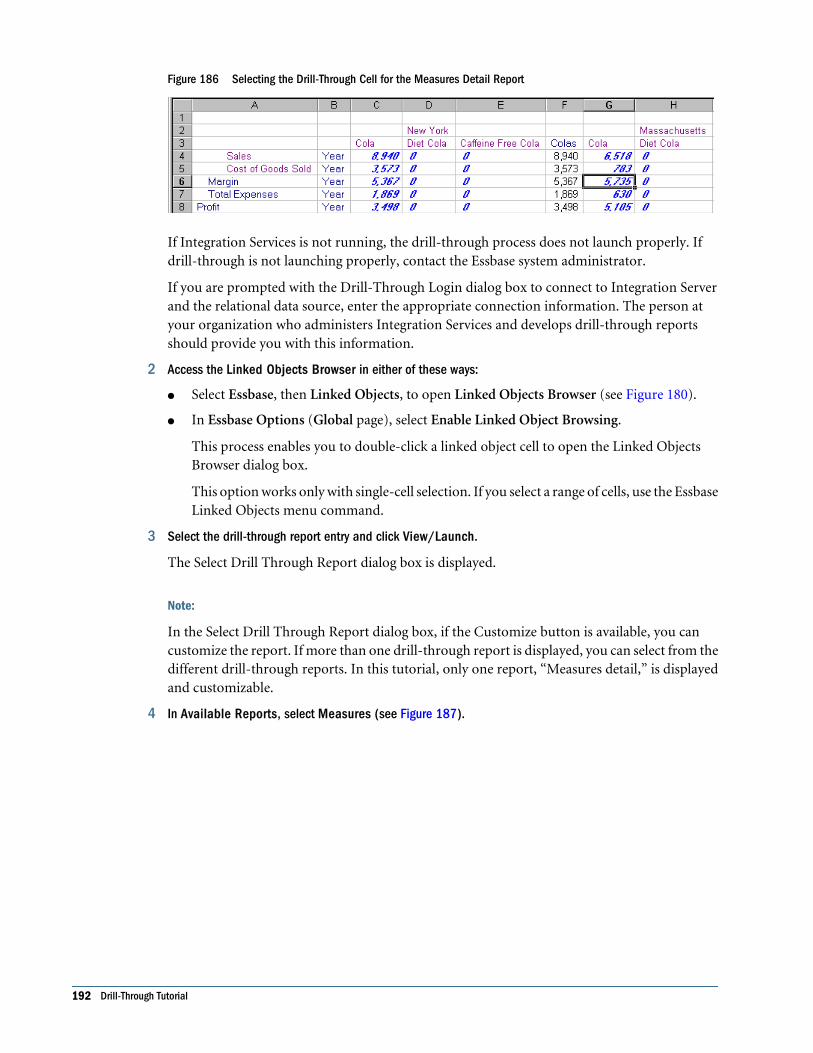
Figure 186 Selecting the Drill-Through Cell for the Measures Detail Report
If Integration Services is not running, the drill-through process does not launch properly. Ifdrill-through is not launching properly, contact the Essbase system administrator.
If you are prompted with the Drill-Through Login dialog box to connect to Integration Serverand the relational data source, enter the appropriate connection information. The person atyour organization who administers Integration Services and develops drill-through reportsshould provide you with this information.
2 Access the Linked Objects Browser in either of these ways:
● Select Essbase, then Linked Objects, to open Linked Objects Browser (see Figure 180).
● In Essbase Options (Global page), select Enable Linked Object Browsing.
This process enables you to double-click a linked object cell to open the Linked ObjectsBrowser dialog box.
This option works only with single-cell selection. If you select a range of cells, use the EssbaseLinked Objects menu command.
3 Select the drill-through report entry and click View/Launch.
The Select Drill Through Report dialog box is displayed.
Note:
In the Select Drill Through Report dialog box, if the Customize button is available, you cancustomize the report. If more than one drill-through report is displayed, you can select from thedifferent drill-through reports. In this tutorial, only one report, “Measures detail,” is displayedand customizable.
4 In Available Reports, select Measures (see Figure 187).
192 Drill-Through Tutorial
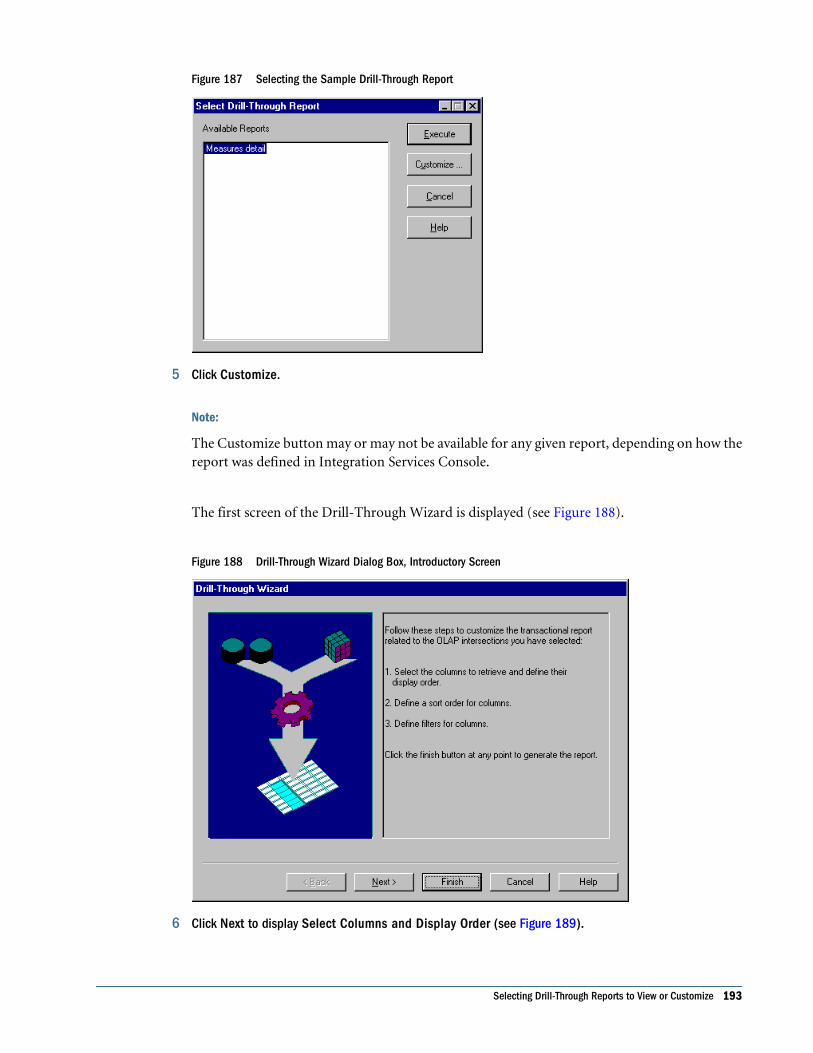
Figure 187 Selecting the Sample Drill-Through Report
5 Click Customize.
Note:
The Customize button may or may not be available for any given report, depending on how thereport was defined in Integration Services Console.
The first screen of the Drill-Through Wizard is displayed (see Figure 188).
Figure 188 Drill-Through Wizard Dialog Box, Introductory Screen
6 Click Next to display Select Columns and Display Order (see Figure 189).
Selecting Drill-Through Reports to View or Customize 193
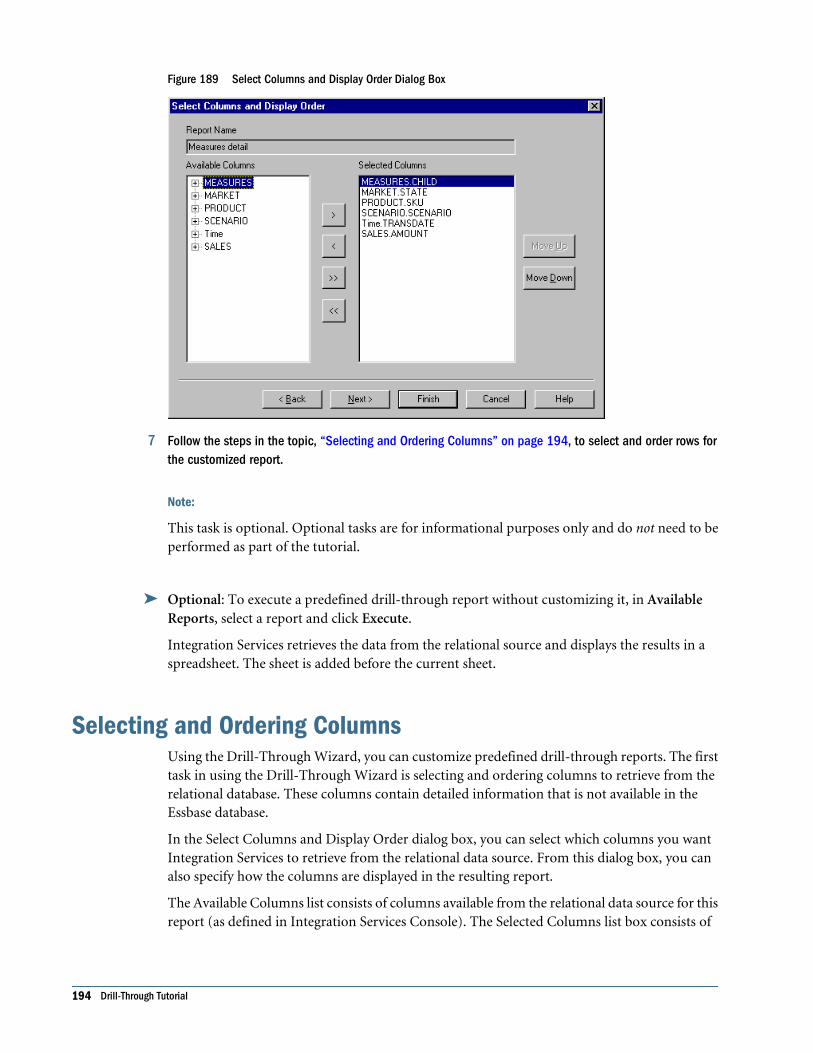
Figure 189 Select Columns and Display Order Dialog Box
7 Follow the steps in the topic, “Selecting and Ordering Columns” on page 194, to select and order rows forthe customized report.
Note:
This task is optional. Optional tasks are for informational purposes only and do not need to beperformed as part of the tutorial.
➤ Optional: To execute a predefined drill-through report without customizing it, in AvailableReports, select a report and click Execute.
Integration Services retrieves the data from the relational source and displays the results in aspreadsheet. The sheet is added before the current sheet.
Selecting and Ordering ColumnsUsing the Drill-Through Wizard, you can customize predefined drill-through reports. The firsttask in using the Drill-Through Wizard is selecting and ordering columns to retrieve from therelational database. These columns contain detailed information that is not available in theEssbase database.
In the Select Columns and Display Order dialog box, you can select which columns you wantIntegration Services to retrieve from the relational data source. From this dialog box, you canalso specify how the columns are displayed in the resulting report.
The Available Columns list consists of columns available from the relational data source for thisreport (as defined in Integration Services Console). The Selected Columns list box consists of
194 Drill-Through Tutorial
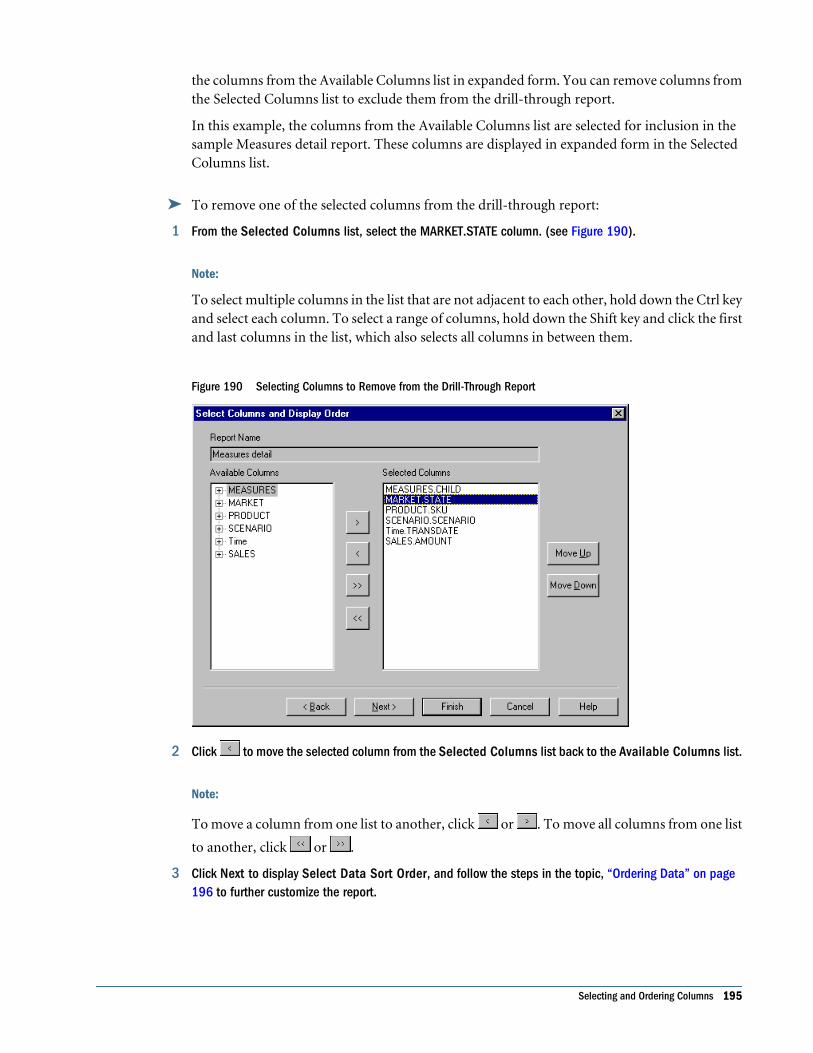
the columns from the Available Columns list in expanded form. You can remove columns fromthe Selected Columns list to exclude them from the drill-through report.
In this example, the columns from the Available Columns list are selected for inclusion in thesample Measures detail report. These columns are displayed in expanded form in the SelectedColumns list.
➤ To remove one of the selected columns from the drill-through report:
1 From the Selected Columns list, select the MARKET.STATE column. (see Figure 190).
Note:
To select multiple columns in the list that are not adjacent to each other, hold down the Ctrl keyand select each column. To select a range of columns, hold down the Shift key and click the firstand last columns in the list, which also selects all columns in between them.
Figure 190 Selecting Columns to Remove from the Drill-Through Report
2 Click to move the selected column from the Selected Columns list back to the Available Columns list.
Note:
To move a column from one list to another, click or . To move all columns from one list
to another, click or .
3 Click Next to display Select Data Sort Order, and follow the steps in the topic, “Ordering Data” on page196 to further customize the report.
Selecting and Ordering Columns 195
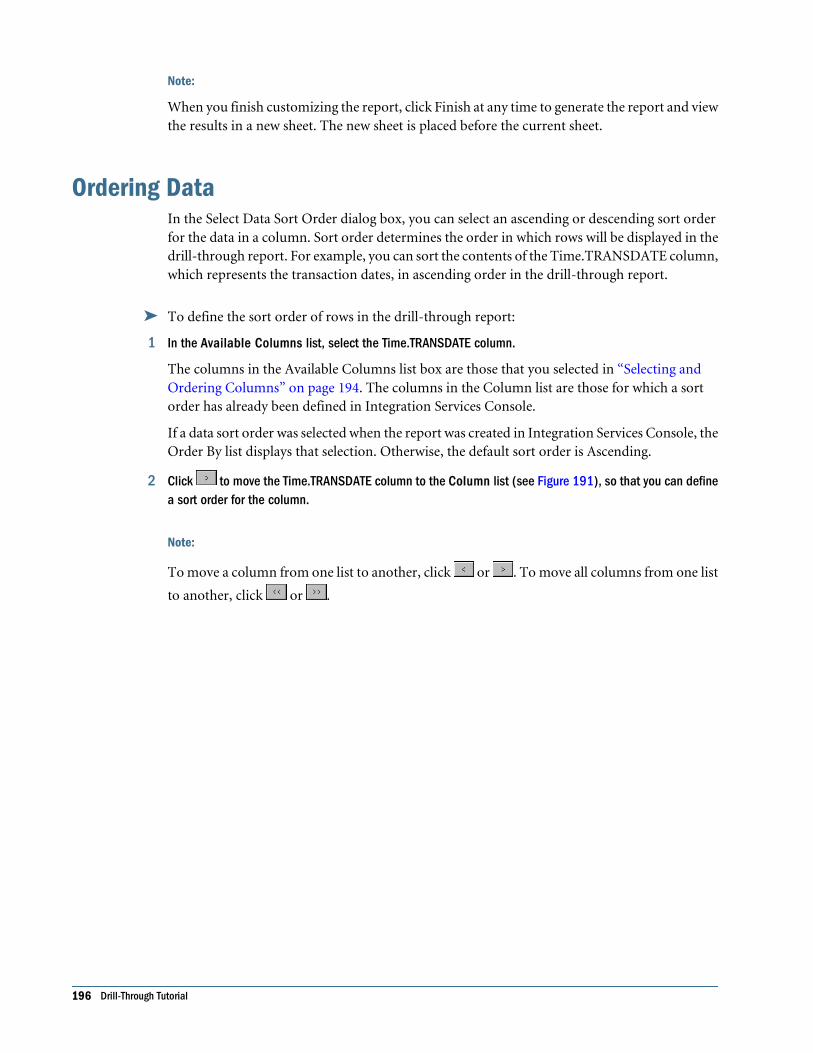
Note:
When you finish customizing the report, click Finish at any time to generate the report and viewthe results in a new sheet. The new sheet is placed before the current sheet.
Ordering DataIn the Select Data Sort Order dialog box, you can select an ascending or descending sort orderfor the data in a column. Sort order determines the order in which rows will be displayed in thedrill-through report. For example, you can sort the contents of the Time.TRANSDATE column,which represents the transaction dates, in ascending order in the drill-through report.
➤ To define the sort order of rows in the drill-through report:
1 In the Available Columns list, select the Time.TRANSDATE column.
The columns in the Available Columns list box are those that you selected in “Selecting andOrdering Columns” on page 194. The columns in the Column list are those for which a sortorder has already been defined in Integration Services Console.
If a data sort order was selected when the report was created in Integration Services Console, theOrder By list displays that selection. Otherwise, the default sort order is Ascending.
2 Click to move the Time.TRANSDATE column to the Column list (see Figure 191), so that you can definea sort order for the column.
Note:
To move a column from one list to another, click or . To move all columns from one list
to another, click or .
196 Drill-Through Tutorial
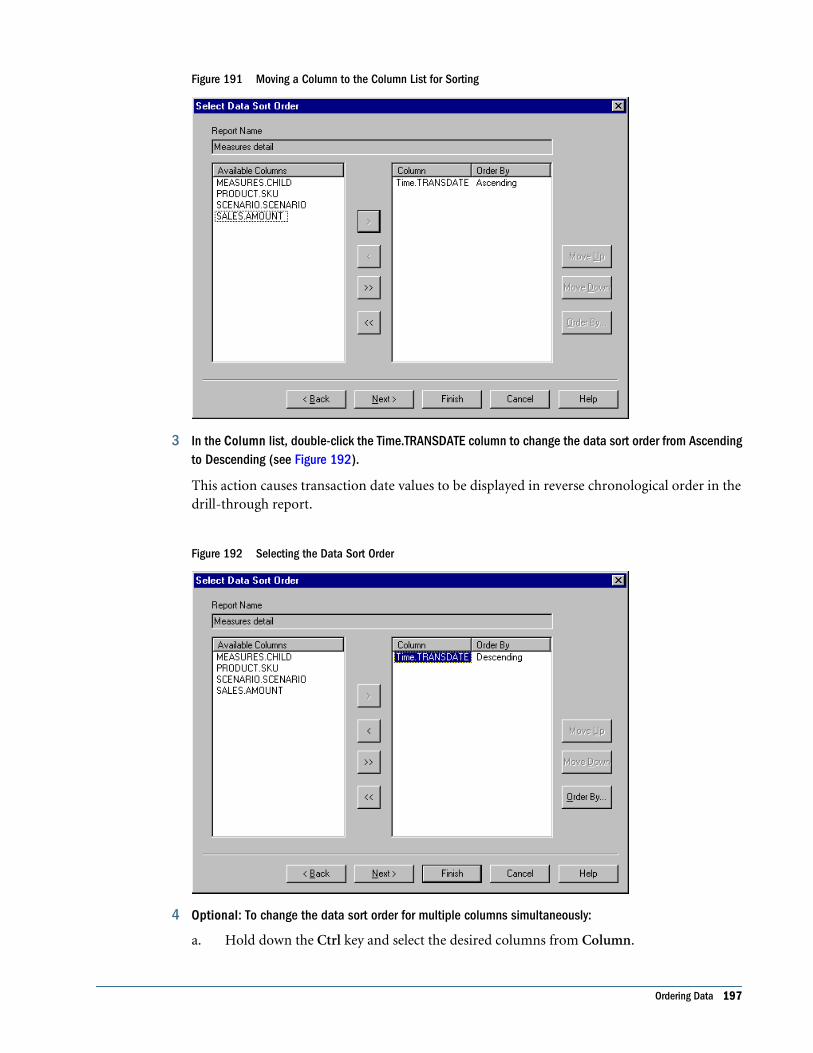
Figure 191 Moving a Column to the Column List for Sorting
3 In the Column list, double-click the Time.TRANSDATE column to change the data sort order from Ascendingto Descending (see Figure 192).
This action causes transaction date values to be displayed in reverse chronological order in thedrill-through report.
Figure 192 Selecting the Data Sort Order
4 Optional: To change the data sort order for multiple columns simultaneously:
a. Hold down the Ctrl key and select the desired columns from Column.
Ordering Data 197
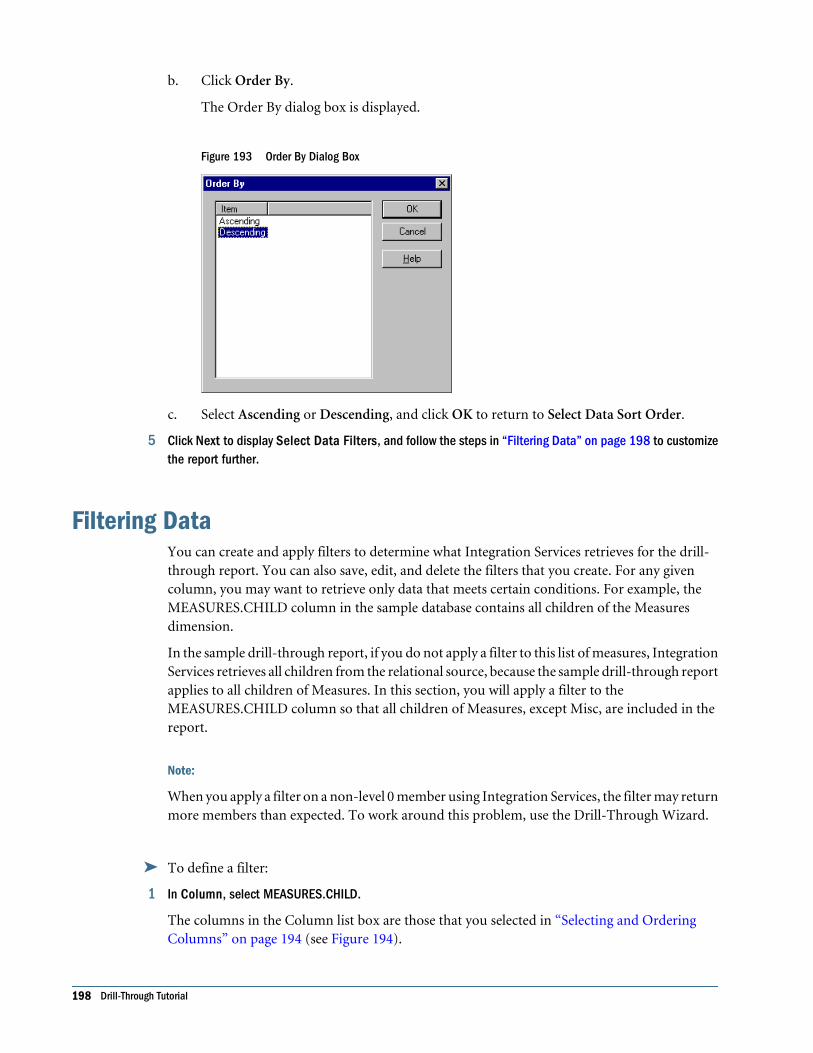
b. Click Order By.
The Order By dialog box is displayed.
Figure 193 Order By Dialog Box
c. Select Ascending or Descending, and click OK to return to Select Data Sort Order.
5 Click Next to display Select Data Filters, and follow the steps in “Filtering Data” on page 198 to customizethe report further.
Filtering DataYou can create and apply filters to determine what Integration Services retrieves for the drill-through report. You can also save, edit, and delete the filters that you create. For any givencolumn, you may want to retrieve only data that meets certain conditions. For example, theMEASURES.CHILD column in the sample database contains all children of the Measuresdimension.
In the sample drill-through report, if you do not apply a filter to this list of measures, IntegrationServices retrieves all children from the relational source, because the sample drill-through reportapplies to all children of Measures. In this section, you will apply a filter to theMEASURES.CHILD column so that all children of Measures, except Misc, are included in thereport.
Note:
When you apply a filter on a non-level 0 member using Integration Services, the filter may returnmore members than expected. To work around this problem, use the Drill-Through Wizard.
➤ To define a filter:
1 In Column, select MEASURES.CHILD.
The columns in the Column list box are those that you selected in “Selecting and OrderingColumns” on page 194 (see Figure 194).
198 Drill-Through Tutorial
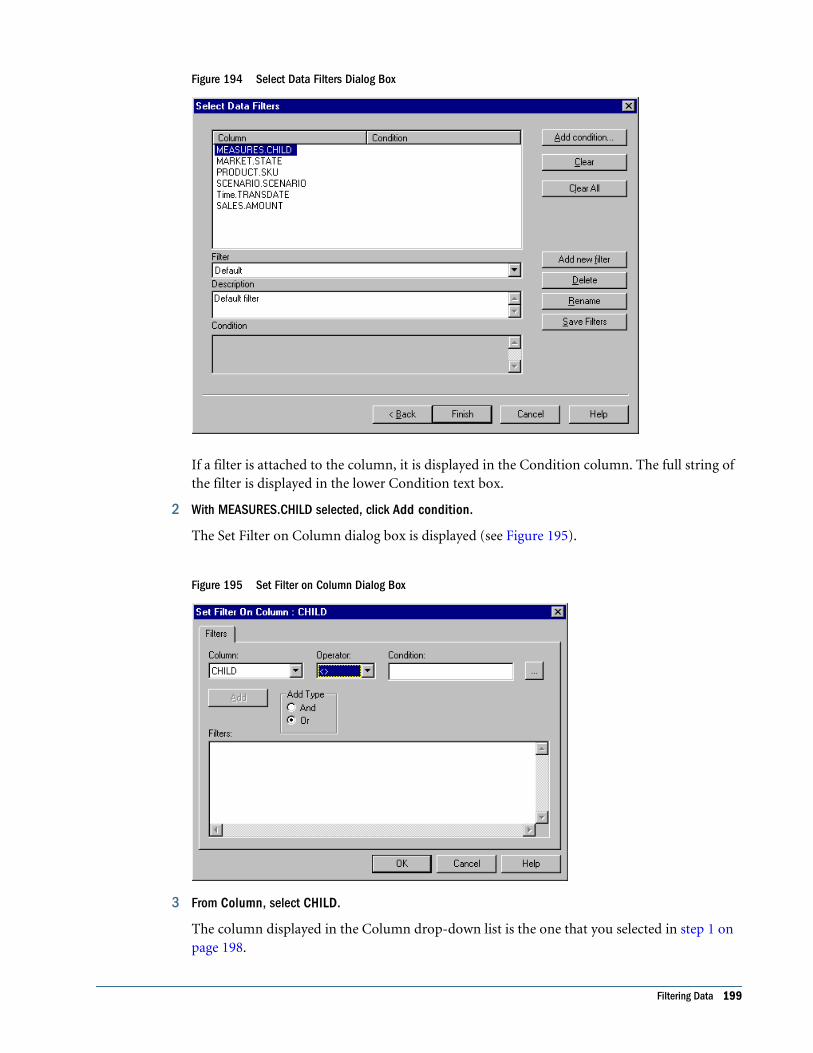
Figure 194 Select Data Filters Dialog Box
If a filter is attached to the column, it is displayed in the Condition column. The full string ofthe filter is displayed in the lower Condition text box.
2 With MEASURES.CHILD selected, click Add condition.
The Set Filter on Column dialog box is displayed (see Figure 195).
Figure 195 Set Filter on Column Dialog Box
3 From Column, select CHILD.
The column displayed in the Column drop-down list is the one that you selected in step 1 onpage 198.
Filtering Data 199
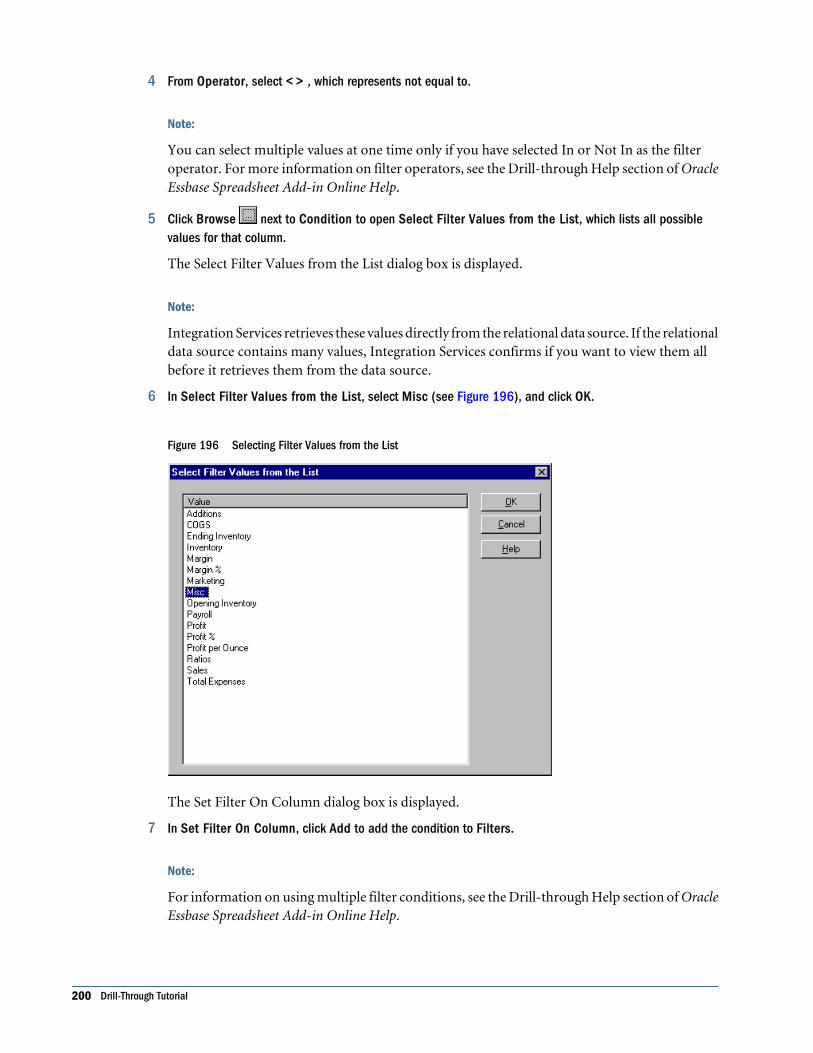
4 From Operator, select < > , which represents not equal to.
Note:
You can select multiple values at one time only if you have selected In or Not In as the filteroperator. For more information on filter operators, see the Drill-through Help section of OracleEssbase Spreadsheet Add-in Online Help.
5 Click Browse next to Condition to open Select Filter Values from the List, which lists all possiblevalues for that column.
The Select Filter Values from the List dialog box is displayed.
Note:
Integration Services retrieves these values directly from the relational data source. If the relationaldata source contains many values, Integration Services confirms if you want to view them allbefore it retrieves them from the data source.
6 In Select Filter Values from the List, select Misc (see Figure 196), and click OK.
Figure 196 Selecting Filter Values from the List
The Set Filter On Column dialog box is displayed.
7 In Set Filter On Column, click Add to add the condition to Filters.
Note:
For information on using multiple filter conditions, see the Drill-through Help section of OracleEssbase Spreadsheet Add-in Online Help.
200 Drill-Through Tutorial
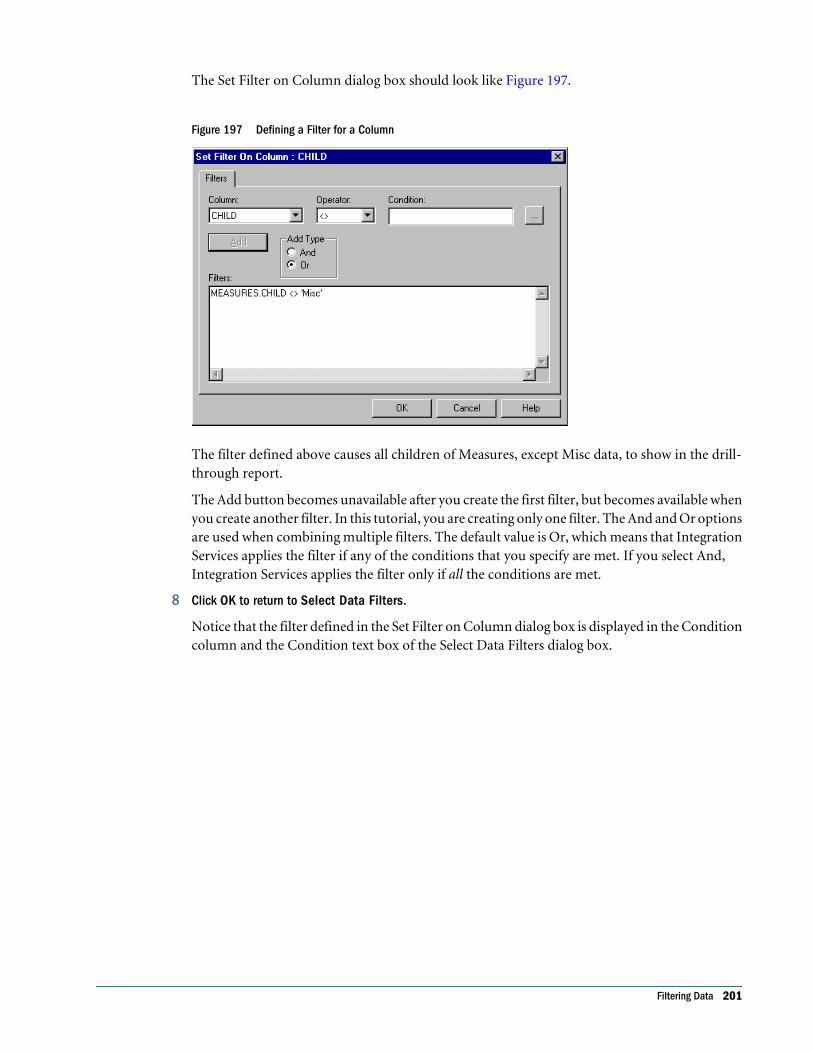
The Set Filter on Column dialog box should look like Figure 197.
Figure 197 Defining a Filter for a Column
The filter defined above causes all children of Measures, except Misc data, to show in the drill-through report.
The Add button becomes unavailable after you create the first filter, but becomes available whenyou create another filter. In this tutorial, you are creating only one filter. The And and Or optionsare used when combining multiple filters. The default value is Or, which means that IntegrationServices applies the filter if any of the conditions that you specify are met. If you select And,Integration Services applies the filter only if all the conditions are met.
8 Click OK to return to Select Data Filters.
Notice that the filter defined in the Set Filter on Column dialog box is displayed in the Conditioncolumn and the Condition text box of the Select Data Filters dialog box.
Filtering Data 201
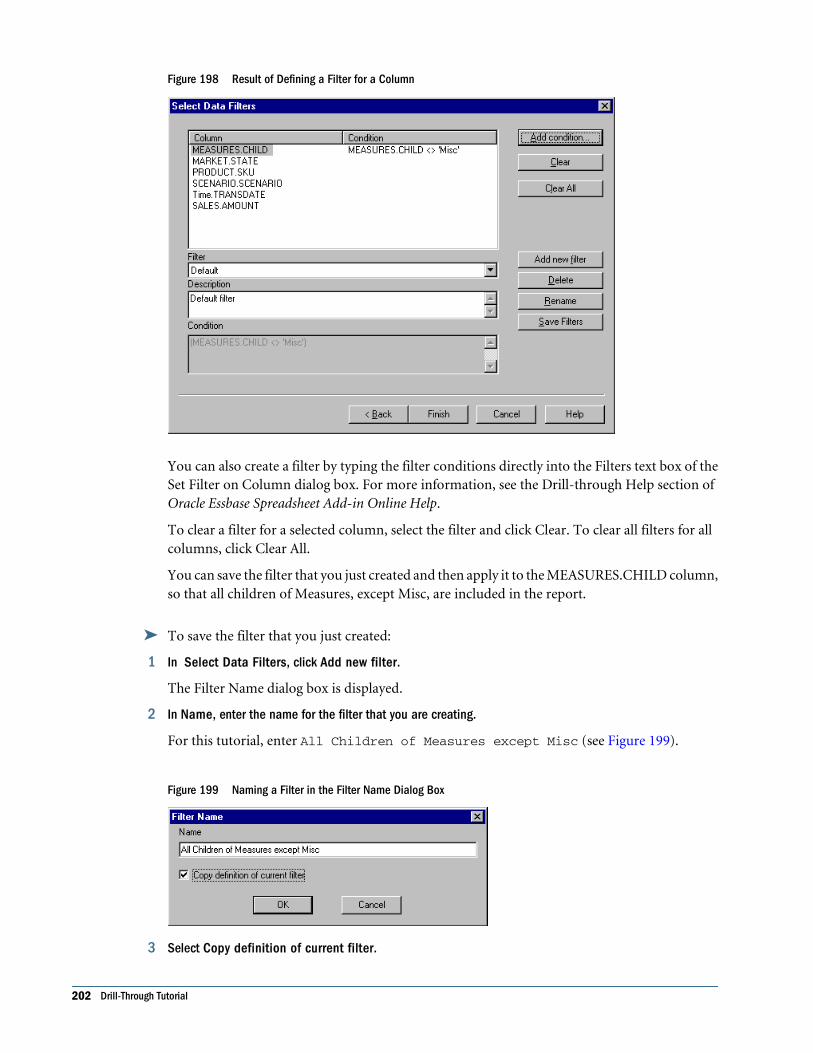
Figure 198 Result of Defining a Filter for a Column
You can also create a filter by typing the filter conditions directly into the Filters text box of theSet Filter on Column dialog box. For more information, see the Drill-through Help section ofOracle Essbase Spreadsheet Add-in Online Help.
To clear a filter for a selected column, select the filter and click Clear. To clear all filters for allcolumns, click Clear All.
You can save the filter that you just created and then apply it to the MEASURES.CHILD column,so that all children of Measures, except Misc, are included in the report.
➤ To save the filter that you just created:
1 In Select Data Filters, click Add new filter.
The Filter Name dialog box is displayed.
2 In Name, enter the name for the filter that you are creating.
For this tutorial, enter All Children of Measures except Misc (see Figure 199).
Figure 199 Naming a Filter in the Filter Name Dialog Box
3 Select Copy definition of current filter.
202 Drill-Through Tutorial
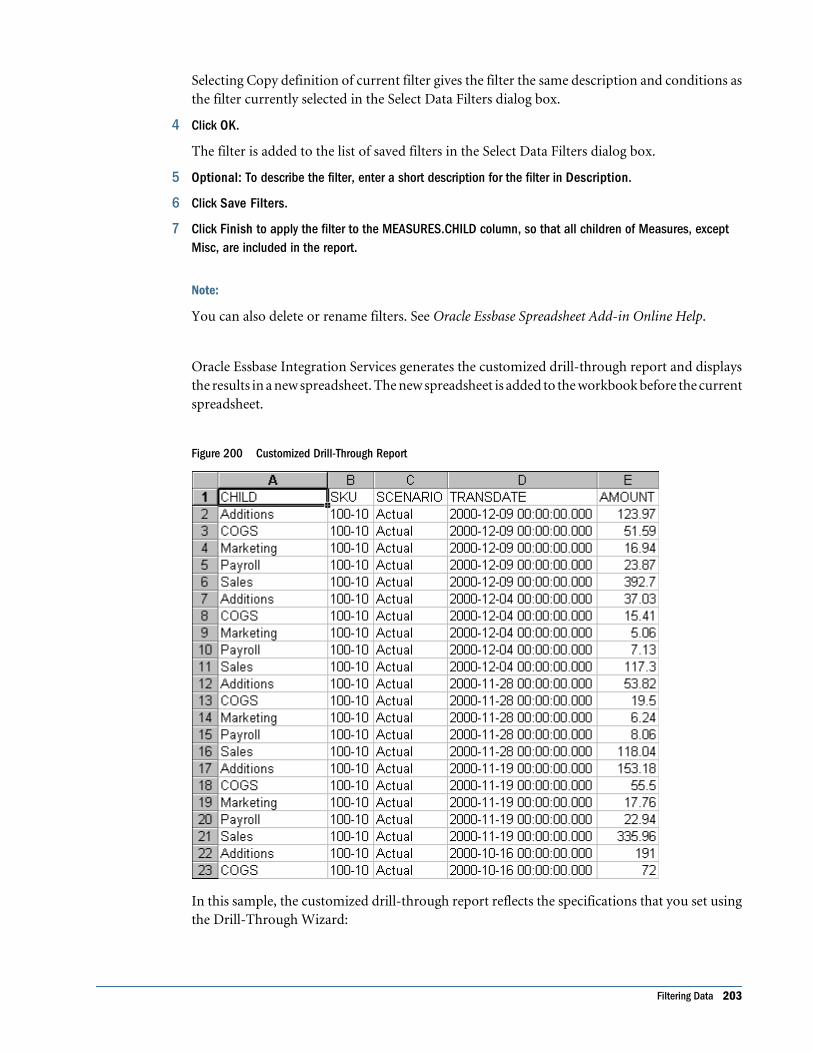
Selecting Copy definition of current filter gives the filter the same description and conditions asthe filter currently selected in the Select Data Filters dialog box.
4 Click OK.
The filter is added to the list of saved filters in the Select Data Filters dialog box.
5 Optional: To describe the filter, enter a short description for the filter in Description.
6 Click Save Filters.
7 Click Finish to apply the filter to the MEASURES.CHILD column, so that all children of Measures, exceptMisc, are included in the report.
Note:
You can also delete or rename filters. See Oracle Essbase Spreadsheet Add-in Online Help.
Oracle Essbase Integration Services generates the customized drill-through report and displaysthe results in a new spreadsheet. The new spreadsheet is added to the workbook before the currentspreadsheet.
Figure 200 Customized Drill-Through Report
In this sample, the customized drill-through report reflects the specifications that you set usingthe Drill-Through Wizard:
Filtering Data 203
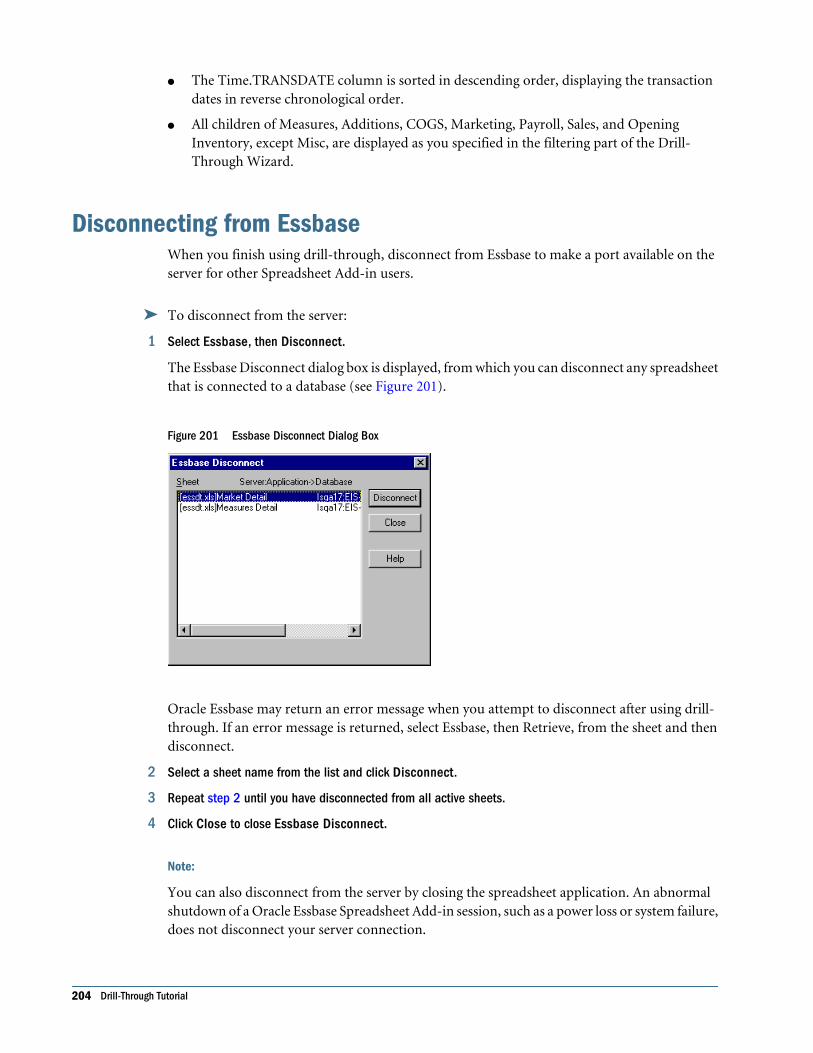
● The Time.TRANSDATE column is sorted in descending order, displaying the transactiondates in reverse chronological order.
● All children of Measures, Additions, COGS, Marketing, Payroll, Sales, and OpeningInventory, except Misc, are displayed as you specified in the filtering part of the Drill-Through Wizard.
Disconnecting from EssbaseWhen you finish using drill-through, disconnect from Essbase to make a port available on theserver for other Spreadsheet Add-in users.
➤ To disconnect from the server:
1 Select Essbase, then Disconnect.
The Essbase Disconnect dialog box is displayed, from which you can disconnect any spreadsheetthat is connected to a database (see Figure 201).
Figure 201 Essbase Disconnect Dialog Box
Oracle Essbase may return an error message when you attempt to disconnect after using drill-through. If an error message is returned, select Essbase, then Retrieve, from the sheet and thendisconnect.
2 Select a sheet name from the list and click Disconnect.
3 Repeat step 2 until you have disconnected from all active sheets.
4 Click Close to close Essbase Disconnect.
Note:
You can also disconnect from the server by closing the spreadsheet application. An abnormalshutdown of a Oracle Essbase Spreadsheet Add-in session, such as a power loss or system failure,does not disconnect your server connection.
204 Drill-Through Tutorial
Glossary
! See bang character (!).
#MISSING See missing data (#MISSING).
access permissions A set of operations that a user can
perform on a resource.
accessor Input and output data specifications for data
mining algorithms.
account blocking The process by which accounts accept
input data in the consolidated file. Blocked accounts do not
receive their value through the additive consolidation
process.
account eliminations Accounts which have their values set
to zero in the consolidated file during consolidation.
account type How an account's value flows over time, and
its sign behavior. Account type options can include expense,
income, asset, liability, and equity.
accountability map A visual, hierarchical representation of
the responsibility, reporting, and dependency structure of
the accountability teams (also known as critical business
areas) in an organization.
accounts dimension A dimension type that makes
accounting intelligence available. Only one dimension can
be defined as Accounts.
active service A service whose Run Type is set to Start rather
than Hold.
activity-level authorization Defines user access to
applications and the types of activities they can perform on
applications, independent of the data that will be operated
on.
ad hoc report An online analytical query created on-the-fly
by an end user.
adapter Software that enables a program to integrate with
data and metadata from target and source systems.
adaptive states Interactive Reporting Web Client level of
permission.
adjustment See journal entry (JE).
Advanced Relational Access The integration of a relational
database with an Essbase multidimensional database so that
all data remains in the relational database and is mapped to
summary-level data residing in the Essbase database.
agent An Essbase server process that starts and stops
applications and databases, manages connections from
users, and handles user-access security. The agent is referred
to as ESSBASE.EXE.
aggregate cell A cell comprising several cells. For example,
a data cell that uses Children(Year) expands to four cells
containing Quarter 1, Quarter 2, Quarter 3, and Quarter 4
data.
aggregate function A type of function, such as sum or
calculation of an average, that summarizes or performs
analysis on data.
aggregate limit A limit placed on an aggregated request line
item or aggregated metatopic item.
aggregate storage database The database storage model
designed to support large-scale, sparsely distributed data
which is categorized into many, potentially large
dimensions. Upper level members and formulas are
dynamically calculated, and selected data values are
aggregated and stored, typically with improvements in
overall aggregation time.
aggregate view A collection of aggregate cells based on the
levels of the members within each dimension. To reduce
calculation time, values are pre-aggregated and stored as
aggregate views. Retrievals start from aggregate view totals
and add up from there.
Glossary 205
aggregation The process of rolling up and storing values in
an aggregate storage database; the stored result of the
aggregation process.
aggregation script In aggregate storage databases only, a
file that defines a selection of aggregate views to be built into
an aggregation.
alias An alternative name. For example, for a more easily
identifiable column descriptor you can display the alias
instead of the member name.
alias table A table that contains alternate names for
members.
alternate hierarchy A hierarchy of shared members. An
alternate hierarchy is based upon an existing hierarchy in a
database outline, but has alternate levels in the dimension.
An alternate hierarchy allows the same data to be seen from
different points of view.
ancestor A branch member that has members below it. For
example, the members Qtr2 and 2006 are ancestors of the
member April.
appender A Log4j term for destination.
application (1) A software program designed to run a
specific task or group of tasks such as a spreadsheet program
or database management system. (2) A related set of
dimensions and dimension members that are used to meet
a specific set of analytical and/or reporting requirements.
application currency The default reporting currency for
the application.
area A predefined set of members and values that makes up
a partition.
arithmetic data load A data load that performs operations
on values in the database, such as adding 10 to each value.
artifact An individual application or repository item; for
example, scripts, forms, rules files, Interactive Reporting
documents, and financial reports. Also known as an object.
assemblies Installation files for EPM System products or
components.
asset account An account type that stores values that
represent a company's assets.
assignment The association of a source and destination in
the allocation model that controls the direction of allocated
costs or revenue flow within Profitability and Cost
Management.
attribute Characteristic of a dimension member. For
example, Employee dimension members may have
attributes of Name, Age, or Address. Product dimension
members can have several attributes, such as a size and
flavor.
attribute association A relationship in a database outline
whereby a member in an attribute dimension describes a
characteristic of a member of its base dimension. For
example, if product 100-10 has a grape flavor, the product
100-10 has the Flavor attribute association of grape. Thus,
the 100-10 member of the Product dimension is associated
with the Grape member of the Flavor attribute dimension.
Attribute Calculations dimension A system-defined
dimension that performs these calculation operations on
groups of members: Sum, Count, Avg, Min, and Max. This
dimension is calculated dynamically and is not visible in the
database outline. For example, using the Avg member, you
can calculate the average sales value for Red products in New
York in January.
attribute dimension A type of dimension that enables
analysis based on the attributes or qualities of dimension
members.
attribute reporting A reporting process based on the
attributes of the base dimension members. See also base
dimension.
attribute type A text, numeric, Boolean, date, or linked-
attribute type that enables different functions for grouping,
selecting, or calculating data. For example, because the
Ounces attribute dimension has the type numeric, the
number of ounces specified as the attribute of each product
can be used to calculate the profit per ounce for that
product.
authentication Verification of identity as a security
measure. Authentication is typically based on a user name
and password. Passwords and digital signatures are forms
of authentication.
authentication service A core service that manages one
authentication system.
206 Glossary
auto-reversing journal A journal for entering adjustments
that you want to reverse in the next period.
automated stage A stage that does not require human
intervention, for example, a data load.
axis (1) A straight line that passes through a graphic used
for measurement and categorization. (2) A report aspect
used to arrange and relate multidimensional data, such as
filters, pages, rows, and columns. For example, for a data
query in Simple Basic, an axis can define columns for values
for Qtr1, Qtr2, Qtr3, and Qtr4. Row data would be retrieved
with totals in the following hierarchy: Market, Product.
backup A duplicate copy of an application instance.
balance account An account type that stores unsigned
values that relate to a particular point in time.
balanced journal A journal in which the total debits equal
the total credits.
bang character (!) A character that terminates a series of
report commands and requests information from the
database. A report script must be terminated with a bang
character; several bang characters can be used within a
report script.
bar chart A chart that can consist of one to 50 data sets,
with any number of values assigned to each data set. Data
sets are displayed as groups of corresponding bars, stacked
bars, or individual bars in separate rows.
base currency The currency in which daily business
transactions are performed.
base dimension A standard dimension that is associated
with one or more attribute dimensions. For example,
assuming products have flavors, the Product dimension is
the base dimension for the Flavors attribute dimension.
base entity An entity at the bottom of the organization
structure that does not own other entities.
batch calculation Any calculation on a database that is
done in batch; for example, a calculation script or a full
database calculation. Dynamic calculations are not
considered to be batch calculations.
batch file An operating system file that can call multiple
ESSCMD scripts and run multiple sessions of ESSCMD. On
Windows-based systems, batch files have BAT file
extensions. On UNIX, batch files are written as a shell script.
batch loader An FDM component that enables the
processing of multiple files.
batch POV A collection of all dimensions on the user POV
of every report and book in the batch. While scheduling the
batch, you can set the members selected on the batch POV.
batch processing mode A method of using ESSCMD to
write a batch or script file that can be used to automate
routine server maintenance and diagnostic tasks. ESSCMD
script files can execute multiple commands and can be run
from the operating system command line or from within
operating system batch files. Batch files can be used to call
multiple ESSCMD scripts or run multiple instances of
ESSCMD.
block The primary storage unit which is a
multidimensional array representing the cells of all dense
dimensions.
block storage database The Essbase database storage model
categorizing and storing data based on the sparsity of data
values defined in sparse dimensions. Data values are stored
in blocks, which exist only for sparse dimension members
for which there are values.
Blocked Account An account that you do not want
calculated in the consolidated file because you want to enter
it manually.
book A container that holds a group of similar Financial
Reporting documents. Books may specify dimension
sections or dimension changes.
book POV The dimension members for which a book is
run.
bookmark A link to a reporting document or a Web site,
displayed on a personal page of a user. The two types of
bookmarks are My Bookmarks and image bookmarks.
bounding rectangle The required perimeter that
encapsulates the Interactive Reporting document content
when embedding Interactive Reporting document sections
in a personal page, specified in pixels for height and width
or row per page.
broadcast message A simple text message sent by an
administrator to a user who is logged on to a Planning
application. The message displays information to the user
such as system availability, notification of application
refresh, or application backups.
Glossary 207
budget administrator A person responsible for setting up,
configuring, maintaining, and controlling an application.
Has all application privileges and data access permissions.
build method A method used to modify database outlines.
Choice of a build method is based on the format of data in
data source files.
business process A set of activities that collectively
accomplish a business objective.
business rules Logical expressions or formulas that are
created within an application to produce a desired set of
resulting values.
cache A buffer in memory that holds data temporarily.
calc script A set of commands that define how a database
is consolidated or aggregated. A calculation script may also
contain commands that specify allocation and other
calculation rules separate from the consolidation process.
calculated member in MaxL DML A member designed for
analytical purposes and defined in the optional WITH
section of a MaxL DML query.
calculated member in MaxL DML A member designed for
analytical purposes and defined in the optional WITH
section of a MaxL DML query.
calculation The process of aggregating data, or of running
a calculation script on a database.
Calculation Manager A module of Performance
Management Architect that Planning and Financial
Management users can use to design, validate, and
administrate business rules in a graphical environment.
calculation status A consolidation status that indicates that
some values or formula calculations have changed. You
must reconsolidate to get the correct values for the affected
entity.
calendar User-defined time periods and their relationship
to each other. Q1, Q2, Q3, and Q4 comprise a calendar or
fiscal year.
cascade The process of creating multiple reports for a
subset of member values.
Catalog pane Displays a list of elements available to the
active section. If Query is the active section, a list of database
tables is displayed. If Pivot is the active section, a list of
results columns is displayed. If Dashboard is the active
section, a list of embeddable sections, graphic tools, and
control tools are displayed.
categories Groupings by which data is organized. For
example, Month.
cause and effect map Depicts how the elements that form
your corporate strategy relate and how they work together
to meet your organization's strategic goals. A Cause and
Effect map tab is automatically created for each Strategy
map.
CDF See custom-defined function (CDF).
CDM See custom-defined macro (CDM).
cell (1) The data value at the intersection of dimensions in
a multidimensional database; the intersection of a row and
a column in a worksheet. (2) A logical group of nodes
belonging to one administrative domain.
cell note A text annotation for a cell in an Essbase database.
Cell notes are a type of LRO.
CHANGED status Consolidation status that indicates data
for an entity has changed.
chart A graphical representation of spreadsheet data. The
visual nature expedites analysis, color-coding, and visual
cues that aid comparisons.
chart template A template that defines the metrics to
display in Workspace charts.
child A member with a parent above it in the database
outline.
choice list A list of members that a report designer can
specify for each dimension when defining the report's point
of view. A user who wants to change the point of view for a
dimension that uses a choice list can select only the members
specified in that defined member list or those members that
meet the criteria defined in the function for the dynamic list.
clean block A data block that where the database is fully
calculated, if a calculation script calculates all dimensions at
once, or if the SET CLEARUPDATESTATUS command is
used in a calculation script.
208 Glossary
cluster An array of servers or databases that behave as a
single resource which share task loads and provide failover
support; eliminates one server or database as a single point
of failure in a system.
clustered bar charts Charts in which categories are viewed
side-by-side; useful for side-by-side category analysis; used
only with vertical bar charts.
code page A mapping of bit combinations to a set of text
characters. Different code pages support different sets of
characters. Each computer contains a code page setting for
the character set requirements of the language of the
computer user. In the context of this document, code pages
map characters to bit combinations for non-Unicode
encodings. See also encoding.
column A vertical display of information in a grid or table.
A column can contain data from one field, derived data from
a calculation, or textual information.
committed access An Essbase Kernel Isolation Level setting
that affects how Essbase handles transactions. Under
committed access, concurrent transactions hold long-term
write locks and yield predictable results.
computed item A virtual column (as opposed to a column
that is physically stored in the database or cube) that can be
calculated by the database during a query, or by Interactive
Reporting Studio in the Results section. Computed items
are calculations of data based on functions, data items, and
operators provided in the dialog box and can be included in
reports or reused to calculate other data.
configuration file The security platform relies on XML
documents to be configured by the product administrator
or software installer. The XML document must be modified
to indicate meaningful values for properties, specifying
locations and attributes pertaining to the corporate
authentication scenario.
connection file See Interactive Reporting connection file
(.oce).
consolidated file (Parent) A file into which all of the
business unit files are consolidated; contains the definition
of the consolidation.
consolidation The process of aggregating data from
dependent entities to parent entities. For example, if the
dimension Year consists of the members Qtr1, Qtr2, Qtr3,
and Qtr4, its consolidation is Year.
consolidation file (*.cns) The consolidation file is a
graphical interface that enables you to add, delete or move
Strategic Finance files in the consolidation process using
either a Chart or Tree view. It also enables you to define and
modify the consolidation.
consolidation rule Identifies the rule that is executed
during the consolidation of the node of the hierarchy. This
rule can contain customer specific formulas appropriate for
the correct consolidation of parent balances. Elimination
processing can be controlled within these rules.
content Information stored in the repository for any type
of file.
content browser A Component that allows users to Browse
and select content to be placed in a Workspace Page .
context variable A variable that is defined for a particular
task flow to identify the context of the taskflow instance.
contribution The value added to a parent from a child
entity. Each child has a contribution to its parent.
controls group Used in FDM to maintain and organize
certification and assessment information, especially helpful
for meeting Sarbanes-Oxley requirements.
conversion rate See exchange rate.
cookie A segment of data placed on your computer by a
Web site.
correlated subqueries Subqueries that are evaluated once
for every row in the parent query; created by joining a topic
item in the subquery with a topic in the parent query.
critical business area (CBA) An individual or a group
organized into a division, region, plant, cost center, profit
center, project team, or process; also called accountability
team or business area.
critical success factor (CSF) A capability that must be
established and sustained to achieve a strategic objective;
owned by a strategic objective or a critical process and is a
parent to one or more actions.
Glossary 209
crosstab reporting Categorizes and summarizes data in
table format. The table cells contain summaries of the data
that fit within the intersecting categories. For example, a
crosstab report of product sales information could show size
attributes, such as Small and Large, as column headings and
color attributes, such as Blue and Yellow, as row headings.
The cell in the table where Large and Blue intersect could
contain the total sales of all Blue products that are sized
Large.
cube A block of data that contains three or more
dimensions. An Essbase database is a cube.
cube deployment In Essbase Studio, the process of setting
load options for a model to build an outline and load data
into an Essbase application and database.
cube schema In Essbase Studio, the metadata elements,
such as measures and hierarchies, representing the logical
model of a cube.
currency conversion A process that converts currency
values in a database from one currency into another. For
example, to convert one U. S. dollar into the European euro,
the exchange rate (for example, 0.923702) is multiplied with
the dollar (1* 0.923702). After conversion, the European
euro amount is .92.
Currency Overrides In any input period, the selected input
method can be overridden to enable input of that period's
value as Default Currency/Items. To override the input
method, enter a pound sign (#) either before or after the
number.
currency partition A dimension type that separates local
currency members from a base currency, as defined in an
application. Identifies currency types, such as Actual,
Budget, and Forecast.
custom calendar Any calendar created by an administrator.
custom dimension A dimension created and defined by
users. Channel, product, department, project, or region
could be custom dimensions.
custom property A property of a dimension or dimension
member that is created by a user.
custom report A complex report from the Design Report
module, composed of any combination of components.
custom-defined function (CDF) Essbase calculation
functions developed in Java and added to the standard
Essbase calculation scripting language using MaxL. See also
custom-defined macro (CDM).
custom-defined macro (CDM) Essbase macros written
with Essbase calculator functions and special macro
functions. Custom-defined macros use an internal Essbase
macro language that enables the combination of calculation
functions and they operate on multiple input parameters.
See also custom-defined function (CDF).
cycle through To perform multiple passes through a
database while calculating it.
dashboard A collection of metrics and indicators that
provide an interactive summary of your business.
Dashboards enable you to build and deploy analytic
applications.
data cache A buffer in memory that holds uncompressed
data blocks.
data cell See cell.
data file cache A buffer in memory that holds compressed
data (PAG) files.
data form A grid display that enables users to enter data
into the database from an interface such as a Web browser,
and to view and analyze data or related text. Certain
dimension member values are fixed, giving users a specific
view into the data.
data function That computes aggregate values, including
averages, maximums, counts, and other statistics, that
summarize groupings of data.
data load location In FDM, a reporting unit responsible for
submitting source data into the target system. Typically,
there is one FDM data load location for each source file
loaded to the target system.
data load rules A set of criteria that determines how to load
data from a text-based file, a spreadsheet, or a relational data
set into a database.
data lock Prevents changes to data according to specified
criteria, such as period or scenario.
data mining The process of searching through an Essbase
database for hidden relationships and patterns in a large
amount of data.
210 Glossary
data model A representation of a subset of database tables.
data value See cell.
database connection File that stores definitions and
properties used to connect to data sources and enables
database references to be portable and widely used.
date measure In Essbase, a member tagged as “Date” in the
dimension where measures are represented. The cell values
are displayed as formatted dates. Dates as measures can be
useful for types of analysis that are difficult to represent
using the Time dimension. For example, an application may
need to track acquisition dates for a series of capital assets,
but the acquisition dates span too large a period to allow for
feasible Time dimension modeling. See also typed
measure.
Default Currency Units Define the unit scale of data. For
example, if you select to define your analysis in Thousands,
and enter “10”, this is interpreted as “10,000”.
dense dimension In block storage databases, a dimension
likely to contain data for every combination of dimension
members. For example, time dimensions are often dense
because they can contain all combinations of all members.
Contrast with sparse dimension.
dependent entity An entity that is owned by another entity
in the organization.
derived text measure In Essbase Studio, a text measure
whose values are governed by a predefined rule expressed
as a range. For example, a derived text measure, called "Sales
Performance Index," based on a measure Sales, could
consist of the values "High," "Medium," and "Low." This
derived text measure is defined to display "High,"
"Medium," and "Low" depending on the range in which the
corresponding sales values fall. See also text measure.
descendant Any member below a parent in the database
outline. In a dimension that includes years, quarters, and
months, the members Qtr2 and April are descendants of the
member Year.
Design Report An interface in Web Analysis Studio for
designing custom reports, from a library of components.
destination Within a Profitability and Cost Management
assignment, the destination is the receiving point for
allocated values.
destination currency The currency to which balances are
converted. You enter exchange rates and convert from the
source currency to the destination currency. For example,
when you convert from EUR to USD, the destination
currency is USD.
detail chart A chart that provides the detailed information
that you see in a Summary chart. Detail charts appear in the
Investigate Section in columns below the Summary charts.
If the Summary chart shows a Pie chart, then the Detail
charts below represent each piece of the pie.
dimension A data category used to organize business data
for retrieval and preservation of values. Dimensions usually
contain hierarchies of related members grouped within
them. For example, a Year dimension often includes
members for each time period, such as quarters and months.
dimension build The process of adding dimensions and
members to an Essbase outline.
dimension build rules Specifications, similar to data load
rules, that Essbase uses to modify an outline. The
modification is based on data in an external data source file.
dimension tab In the Pivot section, the tab that enables you
to pivot data between rows and columns.
dimension table (1) A table that includes numerous
attributes about a specific business process. (2) In Essbase
Integration Services, a container in the OLAP model for one
or more relational tables that define a potential dimension
in Essbase.
dimension type A dimension property that enables the use
of predefined functionality. Dimensions tagged as time have
a predefined calendar functionality.
dimensionality In MaxL DML, the represented
dimensions (and the order in which they are represented)
in a set. For example, the following set consists of two tuples
of the same dimensionality because they both reflect the
dimensions (Region, Year): { (West, Feb), (East, Mar) }
direct rate A currency rate that you enter in the exchange
rate table. The direct rate is used for currency conversion.
For example, to convert balances from JPY to USD, In the
exchange rate table, enter a rate for the period/scenario
where the source currency is JPY and the destination
currency is USD.
Glossary 211
dirty block A data block containing cells that have been
changed since the last calculation. Upper level blocks are
marked as dirty if their child blocks are dirty (that is, they
have been updated).
display type One of three Web Analysis formats saved to
the repository: spreadsheet, chart, and pinboard.
dog-ear The flipped page corner in the upper right corner
of the chart header area.
domain In data mining, a variable representing a range of
navigation within data.
drill-down Navigation through the query result set using
the dimensional hierarchy. Drilling down moves the user
perspective from aggregated data to detail. For example,
drilling down can reveal hierarchical relationships between
years and quarters or quarters and months.
drill-through The navigation from a value in one data
source to corresponding data in another source.
driver A driver is an allocation method that describes the
mathematical relationship between the sources that utilize
the driver, and the destinations to which those sources
allocate cost or revenue.
duplicate alias name A name that occurs more than once
in an alias table and that can be associated with more than
one member in a database outline. Duplicate alias names
can be used with duplicate member outlines only.
duplicate member name The multiple occurrence of a
member name in a database, with each occurrence
representing a different member. For example, a database
has two members named “New York.” One member
represents New York state and the other member represents
New York city.
duplicate member outline A database outline containing
duplicate member names.
Dynamic Calc and Store members A member in a block
storage outline that Essbase calculates only upon the first
retrieval of the value. Essbase then stores the calculated value
in the database. Subsequent retrievals do not require
calculating.
Dynamic Calc members A member in a block storage
outline that Essbase calculates only at retrieval time. Essbase
discards calculated values after completing the retrieval
request.
dynamic calculation In Essbase, a calculation that occurs
only when you retrieve data on a member that is tagged as
Dynamic Calc or Dynamic Calc and Store. The member's
values are calculated at retrieval time instead of being
precalculated during batch calculation.
dynamic hierarchy In aggregate storage database outlines
only, a hierarchy in which members are calculated at
retrieval time.
dynamic member list A system-created named member set
that is based on user-defined criteria. The list is refreshed
automatically whenever it is referenced in the application.
As dimension members are added and deleted, the list
automatically reapplies the criteria to reflect the changes.
dynamic reference A pointer in the rules file to header
records in a data source.
dynamic report A report containing data that is updated
when you run the report.
Dynamic Time Series A process that performs period-to-
date reporting in block storage databases.
dynamic view account An account type indicating that
account values are calculated dynamically from the data that
is displayed.
Eliminated Account An account that does not appear in
the consolidated file.
elimination The process of zeroing out (eliminating)
transactions between entities within an organization.
employee A user responsible for, or associated with,
specific business objects. Employees need not work for an
organization; for example, they can be consultants.
Employees must be associated with user accounts for
authorization purposes.
encoding A method for mapping bit combinations to
characters for creating, storing, and displaying text. Each
encoding has a name; for example, UTF-8. Within an
encoding, each character maps to a specific bit combination;
for example, in UTF-8, uppercase A maps to HEX41. See
also code page and locale.
212 Glossary
ending period A period enabling you to adjust the date
range in a chart. For example, an ending period of “month”,
produces a chart showing information through the end of
the current month.
Enterprise View An Administration Services feature that
enables management of the Essbase environment from a
graphical tree view. From Enterprise View, you can operate
directly on Essbase artifacts.
entity A dimension representing organizational units.
Examples: divisions, subsidiaries, plants, regions, products,
or other financial reporting units.
Equity Beta The riskiness of a stock, measured by the
variance between its return and the market return, indicated
by an index called “beta”. For example, if a stock's return
normally moves up or down 1.2% when the market moves
up or down 1%, the stock has a beta of 1.2.
essbase.cfg An optional configuration file for Essbase.
Administrators may edit this file to customize Essbase
Server functionality. Some configuration settings may also
be used with Essbase clients to override Essbase Server
settings.
EssCell A function entered into a cell in Essbase
Spreadsheet Add-in to retrieve a value representing an
intersection of specific Essbase database members.
ESSCMD A command-line interface for performing
Essbase operations interactively or through batch script
files.
ESSLANG The Essbase environment variable that defines
the encoding used to interpret text characters. See also
encoding.
ESSMSH See MaxL Shell.
exceptions Values that satisfy predefined conditions. You
can define formatting indicators or notify subscribing users
when exceptions are generated.
exchange rate A numeric value for converting one currency
to another. For example, to convert 1 USD into EUR, the
exchange rate of 0.8936 is multiplied with the U.S. dollar.
The European euro equivalent of $1 is 0.8936.
exchange rate type An identifier for an exchange rate.
Different rate types are used because there may be multiple
rates for a period and year. Users traditionally define rates
at period end for the average rate of the period and for the
end of the period. Additional rate types are historical rates,
budget rates, forecast rates, and so on. A rate type applies to
one point in time.
expense account An account that stores periodic and year-
to-date values that decrease net worth if they are positive.
Extensible Markup Language (XML) A language
comprising a set of tags used to assign attributes to data that
can be interpreted between applications according to a
schema.
external authentication Logging on to Oracle's Hyperion
applications with user information stored outside the
applications, typically in a corporate directory such as
MSAD or NTLM.
externally triggered events Non-time-based events for
scheduling job runs.
Extract, Transform, and Load (ETL) Data source-specific
programs for extracting data and migrating it to
applications.
extraction command An Essbase reporting command that
handles the selection, orientation, grouping, and ordering
of raw data extracted from a database; begins with the less
than (<) character.
fact table The central table in a star join schema,
characterized by a foreign key and elements drawn from a
dimension table. This table typically contains numeric data
that can be related to all other tables in the schema.
Favorites gadget Contains links to Reporting and Analysis
documents and URLs.
field An item in a data source file to be loaded into an
Essbase database.
file delimiter Characters, such as commas or tabs, that
separate fields in a data source.
filter A constraint on data sets that restricts values to
specific criteria; for example, to exclude certain tables,
metadata, or values, or to control access.
flow account An unsigned account that stores periodic and
year-to-date values.
Glossary 213

folder A file containing other files for the purpose of
structuring a hierarchy.
footer Text or images at the bottom of report pages,
containing dynamic functions or static text such as page
numbers, dates, logos, titles or file names, and author
names.
format Visual characteristics of documents or report
objects.
format string In Essbase, a method for transforming the
way cell values are displayed.
formula A combination of operators, functions,
dimension and member names, and numeric constants
calculating database members.
frame An area on the desktop. There are two main areas:
the navigation and Workspace frames.
free-form grid An object for presenting, entering, and
integrating data from different sources for dynamic
calculations.
free-form reporting Creating reports by entering
dimension members or report script commands in
worksheets.
function A routine that returns values or database
members.
gadget Simple, specialized, lightweight applications that
provide easy viewing of EPM content and enable access to
core Reporting and Analysis functionality.
genealogy data Additional data that is optionally generated
after allocation calculations. This data enables reporting on
all cost or revenue flows from start to finish through all
allocation steps.
generation A layer in a hierarchical tree structure that
defines member relationships in a database. Generations are
ordered incrementally from the top member of the
dimension (generation 1) down to the child members. Use
the unique generation name to identify a layer in the
hierarchical tree structure.
generic jobs Non-SQR Production Reporting or non-
Interactive Reporting jobs.
global report command A command in a running report
script that is effective until replaced by another global
command or the file ends.
grid POV A means for specifying dimension members on
a grid without placing dimensions in rows, columns, or page
intersections. A report designer can set POV values at the
grid level, preventing user POVs from affecting the grid. If
a dimension has one grid value, you put the dimension into
the grid POV instead of the row, column, or page.
group A container for assigning similar access permissions
to multiple users.
GUI Graphical user interface
head up display A mode that shows your loaded Smart
Space desktop including the background image above your
Windows desktop.
highlighting Depending on your configuration, chart cells
or ZoomChart details may be highlighted, indicating value
status: red (bad), yellow (warning), or green (good).
Historical Average An average for an account over a
number of historical periods.
holding company An entity that is part of a legal entity
group, with direct or indirect investments in all entities in
the group.
host A server on which applications and services are
installed.
host properties Properties pertaining to a host, or if the
host has multiple Install_Homes, to an Install_Home. The
host properties are configured from the CMC.
Hybrid Analysis An analysis mapping low-level data stored
in a relational database to summary-level data stored in
Essbase, combining the mass scalability of relational systems
with multidimensional data.
hyperlink A link to a file, Web page, or an intranet HTML
page.
Hypertext Markup Language (HTML) A programming
language specifying how Web browsers display data.
identity A unique identification for a user or group in
external authentication.
image bookmarks Graphic links to Web pages or
repository items.
214 Glossary
IMPACTED status Indicates changes in child entities
consolidating into parent entities.
implied share A member with one or more children, but
only one is consolidated, so the parent and child share a
value.
import format In FDM, defines the structure of the source
file which enables the loading of a source data file to an FDM
data load location.
inactive group A group for which an administrator has
deactivated system access.
inactive service A service suspended from operating.
INACTIVE status Indicates entities deactivated from
consolidation for the current period.
inactive user A user whose account has been deactivated by
an administrator.
income account An account storing periodic and year-to-
date values that, if positive, increase net worth.
index (1) A method where Essbase uses sparse-data
combinations to retrieve data in block storage databases. (2)
The index file.
index cache A buffer containing index pages.
index entry A pointer to an intersection of sparse
dimensions. Index entries point to data blocks on disk and
use offsets to locate cells.
index file An Essbase file storing block storage data retrieval
information, residing on disk, and containing index pages.
index page A subdivision in an index file. Contains pointers
to data blocks.
input data Data loaded from a source rather than
calculated.
Install_Home A variable for the directory where EPM
System products are installed. Refers to one instance of an
EPM System product when multiple applications are
installed on the same computer.
integration Process that is run to move data between EPM
System products using Shared Services. Data integration
definitions specify the data moving between a source
application and a destination application, and enable the
data movements to be grouped, ordered, and scheduled.
intelligent calculation A calculation method tracking
updated data blocks since the last calculation.
Interactive Reporting connection file (.oce) Files
encapsulating database connection information, including:
the database API (ODBC, SQL*Net, etc.), database
software, the database server network address, and database
user name. Administrators create and publish Interactive
Reporting connection files (.oce).
intercompany elimination See elimination.
intercompany matching The process of comparing
balances for pairs of intercompany accounts within an
application. Intercompany receivables are compared to
intercompany payables for matches. Matching accounts are
used to eliminate intercompany transactions from an
organization's consolidated totals.
intercompany matching report A report that compares
intercompany account balances and indicates if the
accounts are in, or out, of balance.
interdimensional irrelevance A situation in which a
dimension does not intersect with other dimensions.
Because the data in the dimension cannot be accessed from
the non-intersecting dimensions, the non-intersecting
dimensions are not relevant to that dimension.
intersection A unit of data representing the intersection of
dimensions in a multidimensional database; also, a
worksheet cell.
intrastage assignment Assignments in the financial flow
that are assigned to objects within the same stage.
introspection A deep inspection of a data source to
discover hierarchies based on the inherent relationships in
the database. Contrast with scraping.
Investigation See drill-through.
isolation level An Essbase Kernel setting that determines
the lock and commit behavior of database operations.
Choices are: committed access and uncommitted access.
iteration A “pass” of the budget or planning cycle in which
the same version of data is revised and promoted.
Java Database Connectivity (JDBC) A client-server
communication protocol used by Java based clients and
relational databases. The JDBC interface provides a call-
level API for SQL-based database access.
Glossary 215
job output Files or reports produced from running a job.
jobs Documents with special properties that can be
launched to generate output. A job can contain Interactive
Reporting, SQR Production Reporting, or generic
documents.
join A link between two relational database tables or topics
based on common content in a column or row. A join
typically occurs between identical or similar items within
different tables or topics. For example, a record in the
Customer table is joined to a record in the Orders table
because the Customer ID value is the same in each table.
journal entry (JE) A set of debit/credit adjustments to
account balances for a scenario and period.
JSP Java Server Pages.
KeyContacts gadget Contains a group of Smart Space users
and provides access to Smart Space Collaborator. For
example, you can have a KeyContacts gadget for your
marketing team and another for your development team.
latest A Spreadsheet key word used to extract data values
from the member defined as the latest time period.
layer (1) The horizontal location of members in a
hierarchical structure, specified by generation (top down)
or level (bottom up). (2) Position of objects relative to other
objects. For example, in the Sample Basic database, Qtr1 and
Qtr4 are in the same layer, so they are also in the same
generation, but in a database with a ragged hierarchy, Qtr1
and Qtr4 might not be in same layer, though they are in the
same generation.
layout area Used to designate an area on a Workspace Page
where content can be placed.
legend box A box containing labels that identify the data
categories of a dimension.
level A layer in a hierarchical tree structure that defines
database member relationships. Levels are ordered from the
bottom dimension member (level 0) up to the parent
members.
level 0 block A data block for combinations of sparse, level
0 members.
level 0 member A member that has no children.
liability account An account type that stores “point in
time” balances of a company's liabilities. Examples of
liability accounts include accrued expenses, accounts
payable, and long term debt.
life cycle management The process of managing
application information from inception to retirement.
Lifecycle Management Utility A command-line utility for
migrating applications and artifacts.
line chart A chart that displays one to 50 data sets, each
represented by a line. A line chart can display each line
stacked on the preceding ones, as represented by an absolute
value or a percent.
line item detail The lowest level of detail in an account.
lineage The relationship between different metadata
elements showing how one metadata element is derived
from one or more other metadata elements, ultimately
tracing the metadata element to its physical source. In
Essbase Studio, a lineage viewer displays the relationships
graphically. See also traceability.
link (1) A reference to a repository object. Links can
reference folders, files, shortcuts, and other links. (2) In a
task flow, the point where the activity in one stage ends and
another begins.
link condition A logical expression evaluated by the
taskflow engine to determine the sequence of launching
taskflow stages.
linked data model Documents that are linked to a master
copy in a repository.
linked partition A shared partition that enables you to use
a data cell to link two databases. When a user clicks a linked
cell in a worksheet, Essbase opens a new sheet displaying the
dimensions in the linked database. The user can then drill
down those dimensions.
linked reporting object (LRO) A cell-based link to an
external file such as cell notes, URLs, or files with text, audio,
video, or pictures. (Only cell notes are supported for Essbase
LROs in Financial Reporting.) Contrast with local report
object.
local currency An input currency type. When an input
currency type is not specified, the local currency matches
the entity's base currency.
216 Glossary
local report object A report object that is not linked to a
Financial Reporting report object in Explorer. Contrast with
linked reporting object (LRO).
local results A data model's query results. Results can be
used in local joins by dragging them into the data model.
Local results are displayed in the catalog when requested.
locale A computer setting that specifies a location's
language, currency and date formatting, data sort order, and
the character set encoding used on the computer. Essbase
uses only the encoding portion. See also encoding and
ESSLANG.
locale header record A text record at the beginning of some
non-Unicode-encoded text files, such as scripts, that
identifies the encoding locale.
location alias A descriptor that identifies a data source. The
location alias specifies a server, application, database, user
name, and password. Location aliases are set by DBAs at the
database level using Administration Services Console,
ESSCMD, or the API.
locked A user-invoked process that prevents users and
processes from modifying data.
locked data model Data models that cannot be modified by
a user.
LOCKED status A consolidation status indicating that an
entity contains data that cannot be modified.
Log Analyzer An Administration Services feature that
enables filtering, searching, and analysis of Essbase logs.
logic group In FDM, contains one or more logic accounts
that are generated after a source file is loaded into FDM.
Logic accounts are calculated accounts that are derived from
the source data.
LRO See linked reporting object (LRO).
managed server An application server process running in
its own Java Virtual Machine (JVM).
manual stage A stage that requires human intervention to
complete.
Map File Used to store the definition for sending data to or
retrieving data from an external database. Map files have
different extensions (.mps to send data; .mpr to retrieve
data).
Map Navigator A feature that displays your current
position on a Strategy, Accountability, or Cause and Effect
map, indicated by a red outline.
Marginal Tax Rate Used to calculate the after-tax cost of
debt. Represents the tax rate applied to the last earned
income dollar (the rate from the highest tax bracket into
which income falls) and includes federal, state and local
taxes. Based on current level of taxable income and tax
bracket, you can predict marginal tax rate.
Market Risk Premium The additional rate of return paid
over the risk-free rate to persuade investors to hold “riskier”
investments than government securities. Calculated by
subtracting the risk-free rate from the expected market
return. These figures should closely model future market
conditions.
master data model An independent data model that is
referenced as a source by multiple queries. When used,
“Locked Data Model” is displayed in the Query section's
Content pane; the data model is linked to the master data
model displayed in the Data Model section, which an
administrator may hide.
mathematical operator A symbol that defines how data is
calculated in formulas and outlines. Can be any of the
standard mathematical or Boolean operators; for example,
+, -, *, /, and %.
MaxL The multidimensional database access language for
Essbase, consisting of a data definition language (MaxL
DDL) and a data manipulation language (MaxL DML). See
also MaxL DDL, MaxL DML, and MaxL Shell.
MaxL DDL Data definition language used by Essbase for
batch or interactive system-administration tasks.
MaxL DML Data manipulation language used in Essbase
for data query and extraction.
MaxL Perl Module A Perl module (essbase.pm) that is part
of Essbase MaxL DDL. This module can be added to the Perl
package to provide access to Essbase databases from Perl
programs.
MaxL Script Editor A script-development environment in
Administration Services Console. MaxL Script Editor is an
alternative to using a text editor and the MaxL Shell for
administering Essbase with MaxL scripts.
Glossary 217
MaxL Shell An interface for passing MaxL statements to
Essbase Server. The MaxL Shell executable file is located in
the Essbase bin directory (UNIX: essmsh, Windows:
essmsh.exe).
MDX (multidimensional expression) The language that
give instructions to OLE DB for OLAP- compliant
databases, as SQL is used for relational databases. When you
build the OLAPQuery section's Outliner, Interactive
Reporting Clients translate requests into MDX instructions.
When you process the query, MDX is sent to the database
server, which returns records that answer your query. See
also SQL spreadsheet.
measures Numeric values in an OLAP database cube that
are available for analysis. Measures are margin, cost of goods
sold, unit sales, budget amount, and so on. See also fact
table.
member A discrete component within a dimension. A
member identifies and differentiates the organization of
similar units. For example, a time dimension might include
such members as Jan, Feb, and Qtr1.
member list A named group, system- or user-defined, that
references members, functions, or member lists within a
dimension.
member load In Integration Services, the process of adding
dimensions and members (without data) to Essbase
outlines.
member selection report command A type of Report
Writer command that selects member ranges based on
outline relationships, such as sibling, generation, and level.
member-specific report command A type of Report Writer
formatting command that is executed as it is encountered
in a report script. The command affects only its associated
member and executes the format command before
processing the member.
merge A data load option that clears values only from the
accounts specified in the data load file and replaces them
with values in the data load file.
metadata A set of data that defines and describes the
properties and attributes of the data stored in a database or
used by an application. Examples of metadata are
dimension names, member names, properties, time
periods, and security.
metadata elements Metadata derived from data sources
and other metadata that is stored and cataloged for Essbase
Studio use.
metadata sampling The process of retrieving a sample of
members in a dimension in a drill-down operation.
metadata security Security set at the member level to
restrict users from accessing certain outline members.
metaoutline In Integration Services, a template containing
the structure and rules for creating an Essbase outline from
an OLAP model.
metric A numeric measurement computed from business
data to help assess business performance and analyze
company trends.
migration The process of copying applications, artifacts,
or users from one environment or computer to another; for
example, from a testing environment to a production
environment.
migration audit report A report generated from the
migration log that provides tracking information for an
application migration.
migration definition file (.mdf) A file that contains
migration parameters for an application migration,
enabling batch script processing.
migration log A log file that captures all application
migration actions and messages.
migration snapshot A snapshot of an application
migration that is captured in the migration log.
MIME Type (Multipurpose Internet Mail Extension) An
attribute that describes the data format of an item, so that
the system knows which application should open the object.
A file's mime type is determined by the file extension or
HTTP header. Plug-ins tell browsers what mime types they
support and what file extensions correspond to each mime
type.
mining attribute In data mining, a class of values used as a
factor in analysis of a set of data.
minireport A report component that includes layout,
content, hyperlinks, and the query or queries to load the
report. Each report can include one or more minireports.
218 Glossary
minischema A graphical representation of a subset of tables
from a data source that represents a data modeling context.
missing data (#MISSING) A marker indicating that data in
the labeled location does not exist, contains no value, or was
never entered or loaded. For example, missing data exists
when an account contains data for a previous or future
period but not for the current period.
model (1) In data mining, a collection of an algorithm's
findings about examined data. A model can be applied
against a wider data set to generate useful information about
that data. (2) A file or content string containing an
application-specific representation of data. Models are the
basic data managed by Shared Services, of two major types:
dimensional and non-dimensional application objects. (3)
In Business Modeling, a network of boxes connected to
represent and calculate the operational and financial flow
through the area being examined.
monetary A money-related value.
multidimensional database A method of organizing,
storing, and referencing data through three or more
dimensions. An individual value is the intersection point for
a set of dimensions. Contrast with relational database.
multiload An FDM feature that allows the simultaneous
loading of multiple periods, categories, and locations.
My Workspace Page A page created with content from
multiple sources including documents, URL, and other
content types. Enables a user to aggregate content from
Oracle and non-Oracle sources.
named set In MaxL DML, a set with its logic defined in the
optional WITH section of a MaxL DML query. The named
set can be referenced multiple times in the query.
native authentication The process of authenticating a user
name and password from within the server or application.
nested column headings A report column heading format
that displays data from multiple dimensions. For example,
a column heading that contains Year and Scenario members
is a nested column. The nested column heading shows Q1
(from the Year dimension) in the top line of the heading,
qualified by Actual and Budget (from the Scenario
dimension) in the bottom line of the heading.
NO DATA status A consolidation status indicating that
this entity contains no data for the specified period and
account.
non-dimensional model A Shared Services model type that
includes application objects such as security files, member
lists, calculation scripts, and Web forms.
non-unique member name See duplicate member name.
note Additional information associated with a box,
measure, scorecard or map element.
Notifications gadget Shows notification message history
received from other users or systems.
null value A value that is absent of data. Null values are not
equal to zero.
numeric attribute range A feature used to associate a base
dimension member that has a discrete numeric value with
an attribute that represents a value range. For example, to
classify customers by age, an Age Group attribute dimension
can contain members for the following age ranges: 0-20,
21-40, 41-60, and 61-80. Each Customer dimension
member can be associated with an Age Group range. Data
can be retrieved based on the age ranges rather than on
individual age values.
ODBC Open Database Connectivity. A database access
method used from any application regardless of how the
database management system (DBMS) processes the
information.
OK status A consolidation status indicating that an entity
has already been consolidated, and that data has not
changed below it in the organization structure.
OLAP Metadata Catalog In Integration Services, a
relational database containing metadata describing the
nature, source, location, and type of data that is pulled from
the relational data source.
OLAP model In Integration Services, a logical model (star
schema) that is created from tables and columns in a
relational database. The OLAP model is then used to
generate the structure of a multidimensional database.
Glossary 219
online analytical processing (OLAP) A multidimensional,
multiuser, client-server computing environment for users
who analyze consolidated enterprise data in real time. OLAP
systems feature drill-down, data pivoting, complex
calculations, trend analysis, and modeling.
Open Database Connectivity (ODBC) Standardized
application programming interface (API) technology that
allows applications to access multiple third-party databases.
organization An entity hierarchy that defines each entity
and their relationship to others in the hierarchy.
origin The intersection of two axes.
outline The database structure of a multidimensional
database, including all dimensions, members, tags, types,
consolidations, and mathematical relationships. Data is
stored in the database according to the structure defined in
the outline.
outline synchronization For partitioned databases, the
process of propagating outline changes from one database
to another database.
P&L accounts (P&L) Profit and loss accounts. Refers to a
typical grouping of expense and income accounts that
comprise a company's income statement.
page A display of information in a grid or table often
represented by the Z-axis. A page can contain data from one
field, derived data from a calculation, or text.
page file Essbase data file.
page heading A report heading type that lists members
represented on the current page of the report. All data values
on the page have the members in the page heading as a
common attribute.
page member A member that determines the page axis.
palette A JASC compliant file with a .PAL extension. Each
palette contains 16 colors that complement each other and
can be used to set the dashboard color elements.
parallel calculation A calculation option. Essbase divides a
calculation into tasks and calculates some tasks
simultaneously.
parallel data load In Essbase, the concurrent execution of
data load stages by multiple process threads.
parallel export The ability to export Essbase data to
multiple files. This may be faster than exporting to a single
file, and it may resolve problems caused by a single data file
becoming too large for the operating system to handle.
parent adjustments The journal entries that are posted to
a child in relation to its parent.
parents The entities that contain one or more dependent
entities that report directly to them. Because parents are
both entities and associated with at least one node, they have
entity, node, and parent information associated with them.
partition area A sub cube within a database. A partition is
composed of one or more areas of cells from a portion of
the database. For replicated and transparent partitions, the
number of cells within an area must be the same for the data
source and target to ensure that the two partitions have the
same shape. If the data source area contains 18 cells, the data
target area must also contain 18 cells to accommodate the
number of values.
partitioning The process of defining areas of data that are
shared or linked between data models. Partitioning can
affect the performance and scalability of Essbase
applications.
pattern matching The ability to match a value with any or
all characters of an item entered as a criterion. Missing
characters may be represented by wild card values such as a
question mark (?) or an asterisk (*). For example, “Find all
instances of apple” returns apple, but “Find all instances of
apple*” returns apple, applesauce, applecranberry, and so
on.
percent consolidation The portion of a child's values that
is consolidated to its parent.
percent control Identifies the extent to which an entity is
controlled within the context of its group.
percent ownership Identifies the extent to which an entity
is owned by its parent.
performance indicator An image file used to represent
measure and scorecard performance based on a range you
specify; also called a status symbol. You can use the default
performance indicators or create an unlimited number of
your own.
220 Glossary
periodic value method (PVA) A process of currency
conversion that applies the periodic exchange rate values
over time to derive converted results.
permission A level of access granted to users and groups
for managing data or other users and groups.
persistence The continuance or longevity of effect for any
Essbase operation or setting. For example, an Essbase
administrator may limit the persistence of user name and
password validity.
personal pages A personal window to repository
information. You select what information to display and its
layout and colors.
personal recurring time events Reusable time events that
are accessible only to the user who created them.
personal variable A named selection statement of complex
member selections.
perspective A category used to group measures on a
scorecard or strategic objectives within an application. A
perspective can represent a key stakeholder (such as a
customer, employee, or shareholder/financial) or a key
competency area (such as time, cost, or quality).
pie chart A chart that shows one data set segmented in a pie
formation.
pinboard One of the three data object display types.
Pinboards are graphics, composed of backgrounds and
interactive icons called pins. Pinboards require traffic
lighting definitions.
pins Interactive icons placed on graphic reports called
pinboards. Pins are dynamic. They can change images and
traffic lighting color based on the underlying data values and
analysis tools criteria.
pivot The ability to alter the perspective of retrieved data.
When Essbase first retrieves a dimension, it expands data
into rows. You can then pivot or rearrange the data to obtain
a different viewpoint.
planner Planners, who comprise the majority of users, can
input and submit data, use reports that others create,
execute business rules, use task lists, enable e-mail
notification for themselves, and use Smart View.
planning unit A data slice at the intersection of a scenario,
version, and entity; the basic unit for preparing, reviewing,
annotating, and approving plan data.
plot area The area bounded by X, Y, and Z axes; for pie
charts, the rectangular area surrounding the pie.
plug account An account in which the system stores any
out of balance differences between intercompany account
pairs during the elimination process.
post stage assignment Assignments in the allocation model
that are assigned to locations in a subsequent model stage.
POV (point of view) A feature for setting data focus by
selecting members that are not already assigned to row,
column, or page axes. For example, selectable POVs in FDM
could include location, period, category, and target
category. In another example, using POV as a filter in Smart
View, you could assign the Currency dimension to the POV
and select the Euro member. Selecting this POV in data
forms displays data in Euro values.
precalculation Calculating the database prior to user
retrieval.
precision Number of decimal places displayed in numbers.
predefined drill paths Paths used to drill to the next level
of detail, as defined in the data model.
presentation A playlist of Web Analysis documents,
enabling reports to be grouped, organized, ordered,
distributed, and reviewed. Includes pointers referencing
reports in the repository.
preserve formulas User-created formulas kept within a
worksheet while retrieving data.
primary measure A high-priority measure important to
your company and business needs. Displayed in the
Contents frame.
process monitor report Displays a list of locations and their
positions within the FDM data conversion process. You can
use the process monitor report to monitor the status of the
closing process. The report is time-stamped. Therefore, it
can be used to determine to which locations at which time
data was loaded.
product In Shared Services, an application type, such as
Planning or Performance Scorecard.
Glossary 221
Production Reporting See SQR Production Reporting.
project An instance of EPM System products grouped
together in an implementation. For example, a Planning
project may consist of a Planning application, an Essbase
cube, and a Financial Reporting server instance.
property A characteristic of an artifact, such as size, type,
or processing instructions.
provisioning The process of granting users and groups
specific access permissions to resources.
proxy server A server acting as an intermediary between
workstation users and the Internet to ensure security.
public job parameters Reusable, named job parameters
created by administrators and accessible to users with
requisite access privileges.
public recurring time events Reusable time events created
by administrators and accessible through the access control
system.
PVA See periodic value method (PVA).
qualified name A member name in a qualified format that
differentiates duplicate member names in a duplicate
member outline. For example, [Market].[East].[State].
[New York] or [Market].[East].[City].[New York]
query Information requests from data providers. For
example, used to access relational data sources.
query governor An Essbase Integration server parameter
or Essbase server configuration setting that controls the
duration and size of queries made to data sources.
range A set of values including upper and lower limits, and
values falling between limits. Can contain numbers,
amounts, or dates.
reciprocal assignment An assignment in the financial flow
that also has the source as one of its destinations.
reconfigure URL URL used to reload servlet configuration
settings dynamically when users are already logged on to the
Workspace.
record In a database, a group of fields making up one
complete entry. For example, a customer record may
contain fields for name, address, telephone number, and
sales data.
recurring template A journal template for making identical
adjustments in every period.
recurring time event An event specifying a starting point
and the frequency for running a job.
redundant data Duplicate data blocks that Essbase retains
during transactions until Essbase commits updated blocks.
regular journal A feature for entering one-time
adjustments for a period. Can be balanced, balanced by
entity, or unbalanced.
Related Accounts The account structure groups all main
and related accounts under the same main account number.
The main account is distinguished from related accounts by
the first suffix of the account number.
relational database A type of database that stores data in
related two-dimensional tables. Contrast with
multidimensional database.
replace A data load option that clears existing values from
all accounts for periods specified in the data load file, and
loads values from the data load file. If an account is not
specified in the load file, its values for the specified periods
are cleared.
replicated partition A portion of a database, defined
through Partition Manager, used to propagate an update to
data mastered at one site to a copy of data stored at another
site. Users can access the data as though it were part of their
local database.
Report Extractor An Essbase component that retrieves
report data from the Essbase database when report scripts
are run.
report object In report designs, a basic element with
properties defining behavior or appearance, such as text
boxes, grids, images, and charts.
report script A text file containing Essbase Report Writer
commands that generate one or more production reports.
Report Viewer An Essbase component that displays
complete reports after report scripts are run.
reporting currency The currency used to prepare financial
statements, and converted from local currencies to
reporting currencies.
222 Glossary

repository Stores metadata, formatting, and annotation
information for views and queries.
resources Objects or services managed by the system, such
as roles, users, groups, files, and jobs.
restore An operation to reload data and structural
information after a database has been damaged or
destroyed, typically performed after shutting down and
restarting the database.
restructure An operation to regenerate or rebuild the
database index and, in some cases, data files.
result frequency The algorithm used to create a set of dates
to collect and display results.
review level A Process Management review status indicator
representing the process unit level, such as Not Started, First
Pass, Submitted, Approved, and Published.
Risk Free Rate The rate of return expected from “safer”
investments such as long-term U.S. government securities.
role The means by which access permissions are granted to
users and groups for resources.
roll-up See consolidation.
root member The highest member in a dimension branch.
RSC services Services that are configured with Remote
Service Configurator, including Repository Service, Service
Broker, Name Service, Event Service, and Job Service.
runtime prompt A variable that users enter or select before
a business rule is run.
sampling The process of selecting a representative portion
of an entity to determine the entity's characteristics. See also
metadata sampling.
saved assumptions User-defined Planning assumptions
that drive key business calculations (for example, the cost
per square foot of office floor space).
scaling Scaling determines the display of values in whole
numbers, tens, hundreds, thousands, millions, and so on.
scenario A dimension for classifying data (for example,
Actuals, Budget, Forecast1, and Forecast2).
scope The area of data encompassed by any Essbase
operation or setting; for example, the area of data affected
by a security setting. Most commonly, scope refers to three
levels of granularity, where higher levels encompass lower
levels. From highest to lowest, these levels are as follows: the
entire system (Essbase Server), applications on Essbase
servers, or databases within Essbase server applications. See
also persistence.
score The level at which targets are achieved, usually
expressed as a percentage of the target.
scorecard Business object that represents the progress of an
employee, strategy element, or accountability element
toward goals. Scorecards ascertain this progress based on
data collected for each measure and child scorecard added
to the scorecard.
scraping An inspection of a data source to derive the most
basic metadata elements from it. Contrast with
introspection.
Search gadget Searches the Reporting and Analysis
repository. The Search gadget looks for a match in the
document keywords and description, which are set when
you import a document.
secondary measure A low-priority measure, less important
than primary measures. Secondary measures do not have
Performance reports but can be used on scorecards and to
create dimension measure templates.
security agent A Web access management provider (for
example, Netegrity SiteMinder) that protects corporate
Web resources.
security platform A framework enabling EPM System
products to use external authentication and single sign-on.
serial calculation The default calculation setting. Divides a
calculation pass into tasks and calculates one task at a time.
services Resources that enable business items to be
retrieved, changed, added, or deleted. Examples:
Authorization and Authentication.
servlet A piece of compiled code executable by a Web
server.
Servlet Configurator A utility for configuring all locally
installed servlets.
Glossary 223
shared member A member that shares storage space with
another member of the same name, preventing duplicate
calculation of members that occur multiple times in an
Essbase outline.
Shared Services Registry Part of the Shared Services
database, the Shared Services Registry stores and re-uses
information for most installed EPM System products,
including installation directories, database settings,
deployment settings, computer names, ports, servers, URLs,
and dependent service data.
Shared Workspace Page Workspace Pages shared across an
organization which are stored in a special System folder and
can be accessed by authorized users from the Shared
Workspace Pages Navigate menu.
sibling A child member at the same generation as another
child member and having the same immediate parent. For
example, the members Florida and New York are children
of East and each other's siblings.
single sign-on Ability to access multiple EPM System
products after a single login using external credentials.
smart slice In Smart View, a reusable perspective of a data
source that contains a restricted set of dimensions or
dimension members.
Smart Space client software Runs on the client's computer
and provides gadgets, instant collaboration and access to the
Reporting and Analysis repository. It is composed of the
Smart Space framework and gadgets.
Smart Space Collaborator A service that enables users or
systems to send messages and share Reporting and Analysis
repository content. The message can take many forms,
including instant message style discussions, meetings, and
toast messages.
smart tags Keywords in Microsoft Office applications that
are associated with predefined actions available from the
Smart Tag menu. In EPM System products, smart tags can
also be used to import Reporting and Analysis content, and
access Financial Management and Essbase functions.
SmartBook gadget Contains documents from the
Reporting and Analysis repository or URLs. All documents
are loaded when the SmartBook is opened so you can access
all content immediately.
SmartCut A link to a repository item, in URL form.
snapshot Read-only data from a specific time.
source currency The currency from which values originate
and are converted through exchange rates to the destination
currency.
sparse dimension In block storage databases, a dimension
unlikely to contain data for all member combinations when
compared to other dimensions. For example, not all
customers have data for all products. Contrast with dense
dimension.
SPF files Printer-independent files created by an SQR
Production Reporting server, containing a representation
of the actual formatted report output, including fonts,
spacing, headers, footers, and so on.
Spotlighter A tool that enables color coding based on
selected conditions.
SQL spreadsheet A data object that displays the result set
of a SQL query.
SQR Production Reporting A specialized programming
language for data access, data manipulation, and creating
SQR Production Reporting documents.
stage A task description that forms one logical step within
a taskflow, usually performed by an individual. A stage can
be manual or automated.
stage action For automated stages, the invoked action that
executes the stage.
staging area A database that you create to meet the needs
of a specific application. A staging area is a snapshot or
restructured version of one or more RDBMSs.
standard dimension A dimension that is not an attribute
dimension.
standard journal template A journal function used to post
adjustments that have common adjustment information for
each period. For example, you can create a standard
template that contains the common account IDs, entity IDs,
or amounts, then use the template as the basis for many
regular journals.
Status bar The status bar at the bottom of the screen
displays helpful information about commands, accounts,
and the current status of your data file.
224 Glossary
stored hierarchy In aggregate storage databases outlines
only. A hierarchy in which the members are aggregated
according to the outline structure. Stored hierarchy
members have certain restrictions, for example, they cannot
contain formulas.
strategic objective (SO) A long-term goal defined by
measurable results. Each strategic objective is associated
with one perspective in the application, has one parent, the
entity, and is a parent to critical success factors or other
strategic objectives.
Strategy map Represents how the organization
implements high-level mission and vision statements into
lower-level, constituent strategic goals and objectives.
structure view Displays a topic as a simple list of
component data items.
Structured Query Language A language used to process
instructions to relational databases.
Subaccount Numbering A system for numbering
subaccounts using non-sequential, whole numbers.
subscribe Flags an item or folder to receive automatic
notification whenever the item or folder is updated.
Summary chart In the Investigates Section, rolls up detail
charts shown below in the same column, plotting metrics at
the summary level at the top of each chart column.
super service A special service used by the
startCommonServices script to start the RSC services.
supervisor A user with full access to all applications,
databases, related files, and security mechanisms for a
server.
supporting detail Calculations and assumptions from
which the values of cells are derived.
suppress rows Excludes rows containing missing values,
and underscores characters from spreadsheet reports.
symmetric multiprocessing (SMP) A server architecture
that enables multiprocessing and multithreading.
Performance is not significantly degraded when a large
number of users connect to an single instance
simultaneously.
sync Synchronizes Shared Services and application models.
synchronized The condition that exists when the latest
version of a model resides in both the application and in
Shared Services. See also model.
system extract Transfers data from an application's
metadata into an ASCII file.
tabs Navigable views of accounts and reports in Strategic
Finance.
target Expected results of a measure for a specified period
of time (day, quarter, and so on).
task list A detailed status list of tasks for a particular user.
taskflow The automation of a business process in which
tasks are passed from one taskflow participant to another
according to procedural rules.
taskflow definition Represents business processes in the
taskflow management system. Consists of a network of
stages and their relationships; criteria indicating the start
and end of the taskflow; and information about individual
stages, such as participants, associated applications,
associated activities, and so on.
taskflow instance Represents a single instance of a taskflow
including its state and associated data.
taskflow management system Defines, creates, and
manages the execution of a taskflow including: definitions,
user or application interactions, and application
executables.
taskflow participant The resource who performs the task
associated with the taskflow stage instance for both manual
and automated stages.
Taxes - Initial Balances Strategic Finance assumes that the
Initial Loss Balance, Initial Gain Balance and the Initial
Balance of Taxes Paid entries have taken place in the period
before the first Strategic Finance time period.
TCP/IP See Transmission Control Protocol/Internet Protocol
(TCP/IP).
template A predefined format designed to retrieve
particular data consistently.
text list In Essbase, an object that stores text values mapped
to numeric identifiers. Text Lists enable the use of text
measures.
Glossary 225
text measure A data type that allows measure values to be
expressed as text. In Essbase, a member tagged as “Text” in
the dimension where measures are represented. The cell
values are displayed as predefined text. For example, the text
measure "Satisfaction Index" may have the values Low,
Medium, and High. See also typed measure, text list, derived
text measure.
time dimension Defines the time period that the data
represents, such as fiscal or calendar periods.
time events Triggers for execution of jobs.
time line viewer An FDM feature that allows a user to view
dates and times of completed process flow steps for specific
locations.
time scale Displays metrics by a specific period in time,
such as monthly or quarterly.
time series reporting A process for reporting data based on
a calendar date (for example, year, quarter, month, or
week).
Title bar Displays the Strategic Finance name, the file
name, and the scenario name Version box.
toast message Messages that appear in the lower right
corner of the screen and fade in and out.
token An encrypted identification of one valid user or
group on an external authentication system.
top and side labels Column and row headings on the top
and sides of a Pivot report.
top-level member A dimension member at the top of the
tree in a dimension outline hierarchy, or the first member
of the dimension in sort order if there is no hierarchical
relationship among dimension members. The top-level
member name is generally the same as the dimension name
if a hierarchical relationship exists.
trace allocations A feature of Profitability and Cost
Management that enables you to visually follow the flow of
financial data, either forwards or backwards, from a single
intersection throughout the model.
trace level Defines the level of detail captured in the log file.
traceability The ability to track a metadata element to its
physical source. For example, in Essbase Studio, a cube
schema can be traced from its hierarchies and measure
hierarchies, to its dimension elements, date/time elements,
and measures, and ultimately, to its physical source
elements.
traffic lighting Color-coding of report cells, or pins based
on a comparison of two dimension members, or on fixed
limits.
transformation (1) Transforms artifacts so that they
function properly in the destination environment after
application migration. (2) In data mining, modifies data
(bidirectionally) flowing between the cells in the cube and
the algorithm.
translation See currency conversion.
Transmission Control Protocol/Internet Protocol (TCP/
IP) A standard set of communication protocols linking
computers with different operating systems and internal
architectures. TCP/IP utilities are used to exchange files,
send mail, and store data to various computers that are
connected to local and wide area networks.
transparent login Logs in authenticated users without
launching the login screen.
transparent partition A shared partition that enables users
to access and change data in a remote database as though it
is part of a local database
triangulation A means of converting balances from one
currency to another via a third common currency. In
Europe, this is the euro for member countries. For example,
to convert from French franc to Italian lira, the common
currency is defined as European euro. Therefore, in order
to convert balances from French franc to Italian lira,
balances are converted from French franc to European euro
and from European euro to Italian lira.
triggers An Essbase feature whereby data is monitored
according to user-specified criteria which when met cause
Essbase to alert the user or system administrator.
trusted password A password that enables users
authenticated for one product to access other products
without reentering their passwords.
trusted user Authenticated user.
226 Glossary
tuple MDX syntax element that references a cell as an
intersection of a member from each dimension. If a
dimension is omitted, its top member is implied. Examples:
(Jan); (Jan, Sales); ( [Jan], [Sales], [Cola], [Texas], [Actual] )
two-pass An Essbase property that is used to recalculate
members that are dependent on the calculated values of
other members. Two-pass members are calculated during a
second pass through the outline.
typed measure In Essbase, a member tagged as “Text” or
“Date” in the dimension where measures are represented.
The cell values are displayed as predefined text or dates.
unary operator A mathematical indicator (+, -, *, /, %)
associated with an outline member. The unary operator
defines how the member is calculated during a database roll-
up.
Unicode-mode application An Essbase application
wherein character text is encoded in UTF-8, enabling users
with computers set up for different languages to share
application data.
Uniform Resource Locator The address of a resource on
the Internet or an intranet.
unique member name A non-shared member name that
exists only once in a database outline.
unique member outline A database outline that is not
enabled for duplicate member names.
upgrade The process of replacing an earlier software release
with a current release or replacing one product with
another.
upper-level block A type of data block wherein at least one
of the sparse members is a parent-level member.
user directory A centralized location for user and group
information. Also known as a repository or provider.
user variable Dynamically renders data forms based on a
user's member selection, displaying only the specified
entity. For example, user variable named Department
displays specific departments and employees.
user-defined attribute (UDA) User-defined attribute,
associated with members of an outline to describe a
characteristic of the members. Users can use UDAs to return
lists of members that have the specified UDA associated with
them.
user-defined member list A named, static set of members
within a dimension defined by the user.
validation A process of checking a business rule, report
script, or partition definition against the outline to make
sure that the object being checked is valid. For example, in
FDM, validation rules ensure that certain conditions are
met after data is loaded from FDM to the target application.
value dimension Used to define input value, translated
value, and consolidation detail.
variance Difference between two values (for example,
planned and actual value).
varying attribute An attribute association that changes
over one or more dimensions. It can be used to track a value
in relation to these dimensions; for example, the varying
attribute Sales Representative, associated with the Product
dimension, can be used to track the value Customer Sales
of several different sales representatives in relation to the
Time dimension. Varying attributes can also be used for
member selection, such as finding the Products that a Sales
Representative was responsible for in May.
version Possible outcome used within the context of a
scenario of data. For example, Budget - Best Case and
Budget - Worst Case where Budget is scenario and Best Case
and Worst Case are versions.
view Representation of either a year-to-date or periodic
display of data.
visual cue A formatted style, such as a font or a color, that
highlights specific types of data values. Data values may be
dimension members; parent, child, or shared members;
dynamic calculations; members containing a formula; read
only data cells; read and write data cells; or linked objects.
Web server Software or hardware hosting intranet or
Internet Web pages or Web applications.
weight Value assigned to an item on a scorecard that
indicates the relative importance of that item in the
calculation of the overall scorecard score. The weighting of
all items on a scorecard accumulates to 100%. For example,
to recognize the importance of developing new features for
a product, the measure for New Features Coded on a
developer's scorecard would be assigned a higher weighting
than a measure for Number of Minor Defect Fixes.
Glossary 227
wild card Character that represents any single character or
group of characters (*) in a search string.
WITH section In MaxL DML, an optional section of the
query used for creating re-usable logic to define sets or
members. Sets or custom members can be defined once in
the WITH section, and then referenced multiple times
during a query.
work flow The steps required to process data from start to
finish in FDM. The workflow consists of Import (loading
data from the GL file), Validate (ensures all members are
mapped to a valid account), Export (loads the mapped
members to the target application), and Check (verifies
accuracy of data by processing data with user-defined
validation rules).
workbook An entire spreadsheet file with many
worksheets.
Workspace Page A page created with content from
multiple sources including documents, URL, and other
content types. Enables a user to aggregate content from
Oracle and non-Oracle sources.
write-back The ability for a retrieval client, such as a
spreadsheet, to update a database value.
ws.conf A configuration file for Windows platforms.
wsconf_platform A configuration file for UNIX platforms.
XML See Extensible Markup Language (XML).
XOLAP An Essbase multidimensional database that stores
only the outline metadata and retrieves all data from a
relational database at query time. XOLAP supports
aggregate storage databases and applications that contain
duplicate member names.
Y axis scale Range of values on Y axis of charts displayed in
Investigate Section. For example, use a unique Y axis scale
for each chart, the same Y axis scale for all Detail charts, or
the same Y axis scale for all charts in the column. Often,
using a common Y axis improves your ability to compare
charts at a glance.
Zero Administration Software tool that identifies version
number of the most up-to-date plug-in on the server.
zoom Sets the magnification of a report. For example,
magnify a report to fit whole page, page width, or percentage
of magnification based on 100%.
ZoomChart Used to view detailed information by
enlarging a chart. Enables you to see detailed numeric
information on the metric that is displayed in the chart.
228 Glossary
Index
Symbols#Missing strings, suppressing, 53#NoAccess strings, suppressing, 53* wildcard character, 84? wildcard character, 84
Aaccess
to databases, 30, 93to Essbase data, 30, 93to linked partitions, 158to linked reporting objects, 151to multiple applications, 31to multiple databases, 156to online help, 21using drill-through reports, 183using Essbase commands, 28
ad hoc reports, 7, 32, 114, 170Add button, 199add-ins, managing, 18adding members. See members, addingadjusting columns. See columns, adjusting widthadministrators, 8advanced interpretation engine, 132Advanced Interpretation mode, 132, 138aliases
definition of, 63displaying
process of, 63with member names, 64with Query Designer results, 81
in tables, 63alternate dimensions. See dimensions, alternatealternate names. See aliasesancestors, definition of, 14AND operators, 82API, 10
application designer, 8application partitions. See linked partitionsapplication programming interface, 10applications/databases
Sample Basic, 17, 29, 31, 94sample for drill-through, 182Sample Interntl, 168Sample Xchgrate, 168
applying queries, 78ascending sort order
in drill-through reports, 196IN Query Designer, 105
asymmetric reportsdefinition of, 107pivoting, 108retrieving data into, 107
Attach Linked Object dialog box, 146, 148, 150attaching reporting objects to cells. See linkingattaching to databases. See connectingattributes, drill down, 37auditing updates, 161auto logouts, 91Auto Sort Rows option, 134
Bblank
columns, 111rows, 111
blocks, locking data, 159Boolean operators, 82, 85
CCalculation command, 162Calculation dialog box, 162calculations
database status, 162databases, 125, 162
A B C D E F G H I K L M N O P Q R S T U V W X Z
Index 229
dynamic, 125reducing calculation time, 125scripts, 162specifying latest time period, 128substitution variables, 130with Dynamic Time Series, 128with EssCell, 124
canceling data retrievals, 34Cascade command, 163Cascade Information page, 164Cascade Options dialog box, 164cascading sheets
creating table of contents, 166destination, 164format, 165level of detail, 164names, 165output type, 164
cell notesaccessing linked, 153linking to cells, 148
cell rangeskeeping, 46removing, 48retrieving, 119selecting nonadjacent, 47with drill-through, 187
cellsaccessing linked partitions, 158applying styles, 56, 60attaching reports. See linkingattaching URLs. See linkingEssCell function in, 122formatting, 56, 60, 147
in data cells, 60of dimension members, 59of Dynamic Calculation members, 126of parent members, 56
formulas in, 111, 113, 116, 122linked reporting objects, 145, 149linking files to, 145linking notes to, 148linking URLs to, 149retrieving a range of, 119retrieving single values, 122selecting nonadjacent, 47with nondatabase values, 111
Change Password dialog box, 32changing
passwords, 32row and column orientation, 42spreadsheet format, 55styles, 56
children (defined), 14Clear All button, 202Clear button, 202Clear command, 35clearing styles, 62click (defined), 22client
components, 8software, 17
client-server environment, 8collapsing data views. See drillcolors, setting, 56columns
adjusting width, 29, 112blank, 111displaying as rows, 42displaying selected, 46filtering by, 101keeping selected, 46nested, 36pivoting, 42removing selected, 48retrieving into, 36
columns, drill-throughchoosing, 194selecting display order, 194selecting for retrieval from relational source, 194sorting, 196
commandsCalculation, 162Cascade, 163Clear, 35Connect, 30, 94, 156Currency Report, 167, 171Disconnect, 90FlashBack, 34Keep Only, 46Linked Objects, 145, 149Lock, 160Member Selection, 83Navigate Without Data, 49, 52
A B C D E F G H I K L M N O P Q R S T U V W X Z
230 Index
Pivot, 42Remove Only, 48Retrieve, 33Retrieve & Lock, 160Send, 160Undo, 34Unlock, 160Zoom In, 35Zoom Out, 38
comparison operators, 82, 101compatibility with Smart View, 24concurrent
database access, 31, 156updates to server, 159
conditional retrievals, 100Connect command, 30, 94, 156Connect icon, 20connecting, 30. See also disconnecting
to a database, 30, 93to a relational data source, 173, 183, 192to Essbase, 31, 94to Integration Server, 183, 192to multiple databases, 156viewing current connections, 157
Connection Information text box, 157, 162consolidations (defined), 15conversions, currency, 167creating queries, 71creating reports. See reports, creatingCurrency Conversion product, 10currency conversions
modifying exchange rates, 171reporting, 170sample databases, 168settings, 171
Currency Report command, 167, 171Currency Report dialog box, 171current time period. See Dynamic Time Seriescursors (Essbase), 33custom applications, 10Customize button, 192customizing drill-through reports, 189
Ddata
calculating, 162changing orientation, 42
comparison operators, 101displaying, 11, 33dynamically calculating, 125filtering, 100filtering, in drill-through reports, 202formatting, 55locking, 159missing, 53modifying, 159navigating, 15, 49pivoting, 42relational, and drill-through reporting, 173removing subsets, 48retaining subsets, 46retrieving. See retrievingsorting, 100unlocking, 160updating, 159, 161
data sort order, and drill-through reporting, 196data source, relational, 192databases
calculating. See calculationsconcurrent access, 31connecting. See connectingconsolidations, 15defined, 11dimensions, 14disconnecting from, 90linked. See linked partitionsloading, 32, 95locking, 159members, 14organization, 12outlines, 15queries. See queriesrestoring previous views, 34rules, 12sample, 29, 168, 182selecting. See connectingswitching, 156viewing connections, 157
deletingfilters, in drill-through reports, 202selected members, 48styles, 62
descendants (defined), 14descending sort order
A B C D E F G H I K L M N O P Q R S T U V W X Z
Index 231
in drill-through reports, 196with Query Designer, 105
Destination Options page, 164destinations
cascaded sheets, 164Query Designer queries, 76
detaching. See disconnectingdialog boxes, Help buttons, 22dimensions
alternate, 11applying styles, 59currency conversion and, 168described, 11, 14drilling down on, 35, 36drilling up on, 39naming elements, 14pivoting, 42
disabling data retrieval. See navigating without dataDisconnect
command, 90dialog box, 90
disconnectingforced logouts, 91from Essbase, 90from Integration Server, 204
discontinuous rows and columns, 47disk space, effect on Dynamic Calculation, 126display
options, 55order of columns in drill-through reports, 194
Display page (Essbase Options dialog box), 25, 178Display Unknown Member option, 113, 115displaying data, 11, 33distributed sheets. See cascading sheetsdouble-clicking
defined, 22enabling
for drilling, 23for linked object browsing, 151, 158, 188, 192
drag, defined, 22drag-and-drop operations, 42drill
by double-clicking, 23down on attributes, 37, 38down on consolidations, 15down to sample of members, 109, 110Formula Fill, 116
retain formulas during, 116to less detail, 38
drill-throughaccessing, 174, 183cells, defining styles for, 183described, 173installing, 176multiple cell selection, 187multiple reports, 174sample
database, 182drill-through report, 183file, 177, 184
saving filters, 202styles for cells, 175tutorial guidelines, 177tutorial requirements, 176
Drill-Through Wizarddialog box, 193introductory screen, 193
duplicate member namesenabling display of qualified member name as
comment, 68enabling display of qualified member name on
sheet, 68example scenario, 68qualifed member name, defined, 67working with, 67
duplicating sheets. See cascading sheetsDynamic Calculation members, applying styles to,
126Dynamic Time Series
defined, 128specifying latest time period, 129, 130
EEdit Cell Note dialog box, 154Edit menu, 35Edit URL dialog box, 156editing
cell notes, 153linked files, 153URLs, 155
Enable Hybrid Analysis option in Zoom page (EssbaseOptions dialog box), 25
enablingcompatibility with Smart View, 24
A B C D E F G H I K L M N O P Q R S T U V W X Z
232 Index
Essbase toolbar, 19FlashBack setting, 35mouse actions, 23, 151, 158Navigate Without Data, 49
Essbasearchitecture, 8Cascade Options dialog box, 164connecting to. See connectingDisconnect dialog box, 90disconnecting from. See disconnectingintended audience, 8Member Selection dialog box, 83, 88Member Selection dialog box, from Query
Designer, 71menu, 19Options dialog box, 25, 95, 178products of, 9starting a session, 19System Login dialog box, 30, 94toolbar
described, 20installing, 19
Essbase Application Programming Interface (API),10
Essbase Integration Server drill-through. See drill-through
EssCell function, 122error messages, 125syntax, 123
Excelclearing formats, 35, 62mouse actions, 23sample tutorial files, 93
exchange rates, 168Execute button, 192executing drill-through reports, 188, 194expanding data views. See drill downexpanding formulas when drilling, 117external files, 144
Ffiles
accessing linked, 152destinations, cascaded sheets, 164linking to data cells, 145sample for tutorial, 93
filtering data, 100
filtersin drill-through reports, 202operators, 200saving in drill-through reports, 202
Find Member dialog box, 84finding members, 82, 84FlashBack command, 34FlashBack icon, 21font
formats, 57style list, 57
Font dialog box, 57forced logouts, 91formatted sheets
pivoting in, 114retrieving data into, 111
formattingdata cells
linked objects, 147, 158read-only, 60read/write, 60
dimension members, 59displaying aliases, 63displaying aliases and names, 64Dynamic Calculation members, 126enabling styles, 58linked object cells, 147, 158options for cascaded sheets, 165parent members, 56repeating member labels, 65spreadsheets, 55text and cell styles, 61
Formula Fill option, 116, 118Formula Preservation mode
Formula Fill, 116pivoting in, 114restrictions with, 114, 116Retain on Keep and Remove Only, 116Retain on Retrieval, 113, 116
formulasEssCell, 122expanding when drilling, 117in cells, 111, 116preservation
effects on other operations, 116enabling, 113, 116restrictions with, 114
A B C D E F G H I K L M N O P Q R S T U V W X Z
Index 233
free-form reportingentering generation and level names in, 138in Advanced Interpretation mode, 132in Free-Form mode, 134retrieving data, 131
Free-Form retrieval mode, 134Free-Form retrieval mode guidelines, 134functions. See macro functions
Ggenerations
defined, 15entering names in spreadsheet, 138
Global page (Essbase Options dialog box), 23
HHelp buttons, 22Help, accessing, 21Hybrid Analysis, enabling in the Zoom page (Essbase
Options dialog box), 25
Iin-cell editing, 23installation, drill-through, 176installation, toolbar, 19Integration Server, 10, 173Integration Server drill-through. See drill-throughInternet, linking cells to URLs, 149Interntl sample database, 168
KKeep Only command
described, 46in Formula Preservation mode, 116
Keep Only icon, 21
Llabels
applying styles, 59displaying with aliases, 64entering in spreadsheet, 131, 134member names. See member namesrepeating, 65
Latest Time Period option, 129latest time period, specifying, 128
levelscascading by, 164defined, 15drilling down, 39drilling in, 40entering names, 138
linked objectspartitions. See linked partitionsreporting objects. See linked reporting objects
Linked Objects Browser dialog box, 156, 158, 188,192
LROs, 145Linked Objects command, 145, 148, 150linked partitions
access privileges, 159accessing from spreadsheet, 158cells, applying styles, 158
Linked Reporting Objectsaccessing from spreadsheet, 151applying styles, 147cell notes, 148creating, 144external files, 145URLs, 149
linkingcell notes, 148external files, 145partitions, 158URLs to data cells, 149
list, cascaded sheets, 166Lock command, 160locking data blocks, with multiple users, 159logging
off of Essbase. See disconnectingon to a relational data source, 192on to Essbase. See connectingon to Integration Server, 192
logging data updates from spreadsheet, 161logical operators, 86logouts, forced or auto, 91
Mmacro functions
EssCell, 122Spreadsheet Toolkit, 9, 22
manual calculation mode, 125Member Information dialog box, 83
A B C D E F G H I K L M N O P Q R S T U V W X Z
234 Index
member namesaliases for, 63alternate. See aliasesapplying styles, 56displaying with aliases, 64entering in spreadsheet, 131, 134formatted sheets, 111indenting, 15repeating, 65with EssCell function, 123
Member Preview dialog box, 87Member Retention option, 40Member Selection command, 83Member Selection dialog box, 83Member Selection icon, 21Member Selection Preview dialog box, 74Member Selection, with Query Designer, 71members
adding, 71aliases for, 63ancestors, 14applying styles, 56, 59children, 14collapsing, 38defined, 14deleting, 48descendants, 14deselecting, 89drilling down on, 36drilling up on, 38Dynamic Calculation, 125Dynamic Time Series, 128finding, 82, 84generations, 15levels, 15names. See member namesparents, 14retaining, 46selecting, 72, 82siblings, 14
menu, Essbase, 19messages (Essbase)
database calculation status, 162display options, 115EssCell, 125unknown member, 113
metadata sampling, 109, 110
missing values, suppressing, 53disabled, 116in cascaded sheets, 166option unavailable, 116
Mode page (Essbase Options dialog box), 26, 98, 116money. See currency conversionsmouse actions, enabling, 22moving
rows and columns. See pivotthrough worksheets, 49
multi-cell selection, with drill-through, 187multidimensional databases. See databasesmultiple cell selection, with drill-through, 187multiple filter conditions, in drill-through reports,
200
Nnames
alternate. See aliasesapplying styles, 56displaying with aliases, 64entering generation, 138entering level, 138repeating, 65
Navigate With or Without Data icon, 20Navigate Without Data command, 49, 52nested columns or rows, 36networks, 9Next Level option, 40, 164nonadjacent cells, 47notes, linking to data cells, 148null values, 123numeric values, preserving, 111
OODBC clients, 10OLAP
defined, 7server. See server
online analytical processing, 7online help
displaying for spreadsheet, 21operators, comparison, 82, 101options
Cascade, 164Display, 25, 95, 178
A B C D E F G H I K L M N O P Q R S T U V W X Z
Index 235
Global, 23, 27, 98, 181Mode, 26, 97, 116, 179settings for advanced tutorial, 95settings for basic tutorial, 24settings for drill-through tutorial, 177Style, 57Zoom, 25, 39, 96, 178
Options dialog box, 25, 178Options icon, 21OR operators, 82Order By dialog box, 198ordering
columns in drill-through reports, 194rows in drill-through reports, 196
outlinesconsolidations, 15described, 12dimensions, 14Dynamic Calculation members, 125Dynamic Time Series members, 128members, 14
output, cascaded sheets, 164overlapping styles, 62
Pparent members
applying styles to, 56defined, 14
Partitioning product. See linked partitionspartitions. See linked partitionspasswords
changing, 32entering, 94
pattern matching, 86pivot
asymmetric reports and, 108by dragging, 42described, 23, 42effect on text, 112formatted sheets and, 114formula preservation and, 114rows or columns, 42, 109unavailable, 112without retrieving data, 50
Pivot command, 42power loss, effect of abnormal shutdown, 91preferences. See options
preserving formulas, 113, 119primary mouse button, 22printer destination, cascaded sheets, 164programming interface, 10
Qqueries
applying, 78applying styles, 79creating, 71defining, 69deleting, 79retrieving, 69saving, 76
Query Designerapplying option settings, 81connecting to multiple databases, 80creating queries, 71data filtering panel, 101data sorting panel, 105filtering data, 100hint panel, 69layout panel, 71messages, 107messages and confirmations, 79navigation panel, 69properties panel, 69save as query dialog box, 76sorting data, 105
Query Designer icon, 21
Rread-only cells, 60read/write cells, 60registering Spreadsheet Add-in, 18relational data source, 192relational databases, accessing using drill-through,
173remote databases . See linked partitionsRemove Only command
described, 48in Formula Preservation mode, 116
Remove Only icon, 21Remove Unselected Groups option, 116removing. See deletingRepeat Member Labels option, 65
A B C D E F G H I K L M N O P Q R S T U V W X Z
236 Index
report script commands, 134, 136reports
ad hoc, 32, 114ad hoc currency, 170asymmetric, 107creating multiple, 163formatted, 111free-form, 131saving, 90
reports, creatingad hoc, 32, 170Cascade, 163Member Selection, 82Query Designer, 69
reports, drill-throughaccessing, 183customizing, 175, 189disconnecting from, 204executing, 188selecting to view or customize, 189
restoring database views, 34restrictions, with Formula Preservation, 116Retain on Keep and Remove Only option, 116Retain on Retrieval option
disabled, 116enabled, 113, 116
Retain on Zooms option, 116, 118retaining
data subsets, 46formulas, 111, 112
when drilling, 116when retaining data, 116when retrieving, 113, 116
selected members, 46Retrieve & Lock command, 160Retrieve command, 33Retrieve icon, 20retrieving
Advanced Interpretation mode and, 132canceling, 34conditional, 100currency conversion, 167cursors, 33data, 29Dynamic Calculation members, 125formula preservation and, 116Free-Form mode and, 134
functions, 122increasing speed, 62, 108, 119, 126into asymmetric reports, 107into columns, 36into formatted sheets, 111
rules for, 111into rows, 36less detail, 38modes, 131more detail, 35performance impact, 62, 108, 126range of cells, 119retaining formulas and, 113, 116selected cells, 119starting process and, 32suppressing data and, 49
reverting to previous database view, 34rows
blank, 111deleting during pivot, 109displaying as columns, 42displaying selected, 46filtering by, 101keeping discontinuous, 47nested, 36pivoting, 42removing selected, 48retrieving into, 36sorting within, 105suppressing values in, 53, 166
Ssample
databasesconnecting to, 31, 168described, 29, 168in drill-through, 182
files for tutorial, location, 93Sample Basic
connecting to, 31described, 29
Sample Data (Zoom In) command, 110sample directory, 93sampling, 109, 110Save As command, 90Save command, 90saving
A B C D E F G H I K L M N O P Q R S T U V W X Z
Index 237
drill-through filters, 202queries, 76worksheets, 90
saving queries, 76secondary mouse button, 22select (defined), 22Select Calc Script option, 162Select Columns and Display Order dialog box, 194,
195Select Data Filters dialog box, 199Select Data Sort Order dialog box, 196Select Drill-Through Report dialog box, 189, 192Select Filter Values from the List dialog box, 200selecting
cells to keep, 46cells to remove, 48latest time period, 128members, 82multiple cells, with drill-through, 187nonadjacent cells, 47range of cells for retrieval, 119
Send command, 160sending
data to server, 159log file, 161
server, 8changing password, 32client-server environment, 8connecting to, 31, 94described, 8disconnecting from, 90Essbase Integration Server, 173Essbase Integration Services, 10Essbase Server, described, 8logging updates to, 159name, 31, 94on network, 9sending data to, 159
Set Filter on Column dialog box, 199shared members, applying styles to, 57sheet destination, Cascade option, 164sheets. See worksheetsshortcuts, mouse actions, 23shortcuts, toolbar icons, 20shutdown, abnormal, 91siblings (defined), 14sort order
in drill-through, 196in Query Designer, 105
sorting criteria, 100Spreadsheet Add-in
accessing drill-through from, 183compatibility with Smart View, 24installing toolbar, 19logging data updates, 161registering, 18retrieval cursors, 33starting, 19users, described, 8
Spreadsheet Toolkit product, 9spreadsheets
applying styles, 56cascading, 163creating multiple, 163data update log file, 161described, 11displaying aliases, 63, 64displaying member names, 64distributing, 163drilling options, 39global options, 23, 35, 115mode options, 116, 131preserving formulas, 116repeating member labels, 65retrieving data, 29saving, 90setting options, 25style options, 56suppressing missing and zero values, 53zoom options, 40
SQL Interface, 9starting
data retrieval, 33drill-through, 183Essbase, 19Spreadsheet Add-in, 19
status of database connections, 157Style page (Essbase Options dialog box), 57styles
applyingto data cells, 60to dimension members, 59to dimensions, 59to drill-through cells, 183
A B C D E F G H I K L M N O P Q R S T U V W X Z
238 Index
to linked partition cells, 158to linked reporting object cells, 147to members, 56to parent members, 56to Query Designer results, 81to shared members, 57
clearing, 62defining, 56, 57hierarchy of, 62overlapping, 62removing, 62selecting members, 57stored in ESSBASE.INI, 60turning off, 62turning on, 58
Subset dialog box, 85, 86subsets
defining members, 85removing, 48retaining, 46
substitution variables, 130, 131suppressing
data retrieval, 49missing and zero values, 53option disabled, 116underscore characters, 53
symmetric reports, 107system administrator, 8system failure, 91
Ttable of contents, with Cascade, 166TCP/IP protocol, 9terminating database connections. See disconnectingtermination, abnormal, 91text
entering free-form, 131formatting, 57hierarchy of styles, 62pivoting. See pivotpreserving formatted, 111
time periods, 128title members, with drill-down, 36to-date calculations, specifying, 128toolbar (Essbase), 21
icons on, 20installing, 19
tracking data updates, 161transaction-level data, accessing with drill-through,
173transparent partitions. See linked partitionstransport protocol, 9tutorial
basic tasks, 17guidelines, 28preparing for, 24
Uunderscore characters, suppressing, 55Undo command. See FlashBack commandundoing actions, 34Unlock command, 160unlocking data blocks, 160up-to-date calculations, 128Update Mode, 160updating
data, 159log file, 161
URLsaccessing linked, 155editing, 155length limits, 151linking to data cells, 149
Use Aliases option, 63Use Both Member Names and Aliases option, 64Use Sheet Options with Query Designer option, 81Use Styles option, 58user name, entering, 94users, 8
VV2.x mode, 134viewing
active connections, 157aliases, 63aliases and names, 64data in spreadsheet, 33Dynamic Calculation members, 126Essbase menu, 19Essbase toolbar, 19fewer members. See drilllinked partitions, 158linked reporting objects, 151
A B C D E F G H I K L M N O P Q R S T U V W X Z
Index 239
more members. See drillmultidimensional data, 11online help, 21repeated member labels, 65spreadsheet without data, 49styles, 58toolbar, 19
views, restoring, 34visual cues. See stylesVisual Explorer
creating a visual worksheet, 143importing visual worksheet data into Excel, 144logging into Essbase Server, 142user interface described, 141Visualize & Explore command, 141
Visualize & Explore command, 141
WWeb resources, linking to data cells, 149wildcard characters, 84Windows Registry, changes to, 18Within Selected Group option, 41, 108worksheets
formatting, 55navigating without data in, 49
World Wide Web, linking to data cells, 149
XXchgrate sample database, 168
Zzero values
suppressing, 53, 55suppressing options disabled, 116
Zoom commands, customizing, 39Zoom In command
drilling down options, 35selecting levels, 40
Zoom In icon, 21Zoom Out command, drilling up options, 38Zoom Out icon, 21Zoom page (Essbase Options dialog box), 25, 40
Enable Hybrid Analysis option, 25
A B C D E F G H I K L M N O P Q R S T U V W X Z
240 Index