Embed Size (px)
Citation preview
Content
1. Size of leased fleet and market share VNA 3
2. New registrations lease 3
3. Developments in business passenger cars fleets 4
4. Total leased passenger cars and leased light commercial vehicles
in the Netherlands 5
5. Top 10 leasing companies 6
6. Contractual term 6
7. Annual mileage 8
8. Private lease 9
9. Average age of leased fleets 10
10. Company car taxable benefit category 11
11. CO2 emissions 12
12. Contract types 13
13. Top 10 new leased vehicles 16
14. Lease package components 18
15. Number of employees leasing companies 19
Composition: VNA
608114
This report is an elaboration of the infographics on our website: www.vna-lease.nl/feiten-cijfers.
The data contained in this report pertains to the lease fleet as at the end of the financial year.
This publication was produced with the contribution of Bovag Research, the central agency for
mobility information (RDC | CBMI) and the VNA members.
© Association of Dutch Vehicle Leasing Companies, May 2016.
Information may be reproduced with acknowledgement of the source.
3
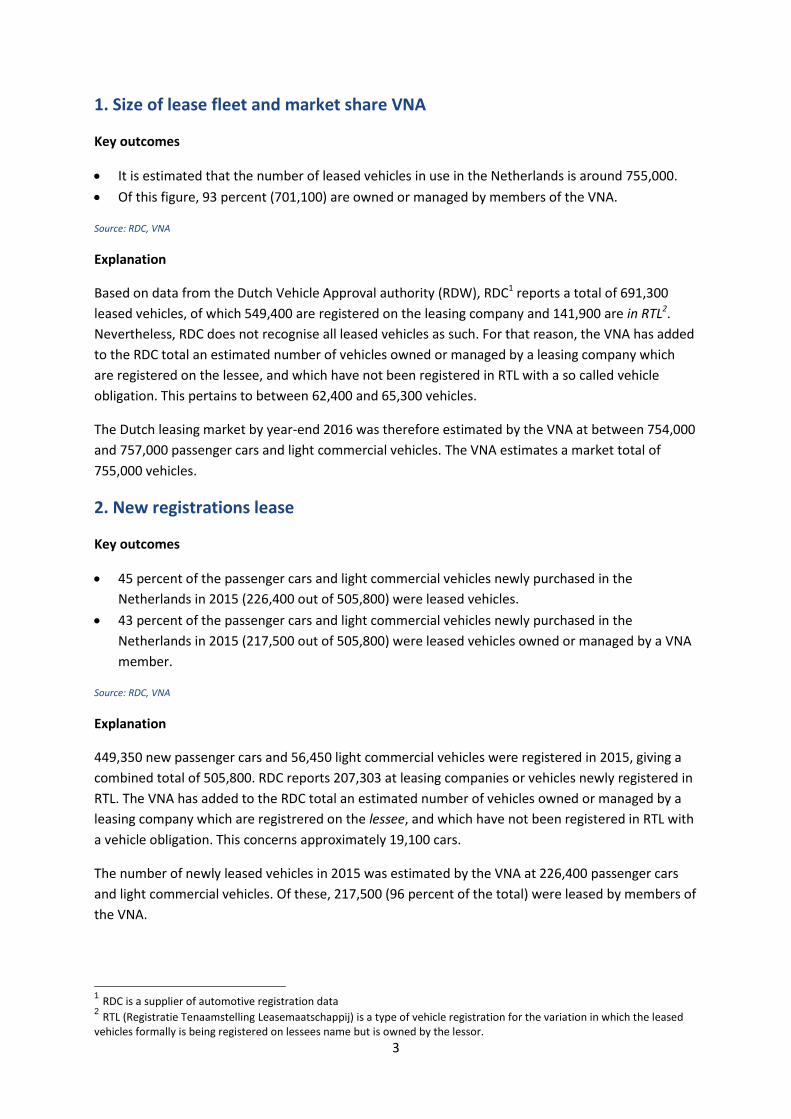
1. Size of lease fleet and market share VNA
Key outcomes
It is estimated that the number of leased vehicles in use in the Netherlands is around 755,000.
Of this figure, 93 percent (701,100) are owned or managed by members of the VNA.
Source: RDC, VNA
Explanation
Based on data from the Dutch Vehicle Approval authority (RDW), RDC1 reports a total of 691,300
leased vehicles, of which 549,400 are registered on the leasing company and 141,900 are in RTL2.
Nevertheless, RDC does not recognise all leased vehicles as such. For that reason, the VNA has added
to the RDC total an estimated number of vehicles owned or managed by a leasing company which
are registered on the lessee, and which have not been registered in RTL with a so called vehicle
obligation. This pertains to between 62,400 and 65,300 vehicles.
The Dutch leasing market by year-end 2016 was therefore estimated by the VNA at between 754,000
and 757,000 passenger cars and light commercial vehicles. The VNA estimates a market total of
755,000 vehicles.
2. New registrations lease
Key outcomes
45 percent of the passenger cars and light commercial vehicles newly purchased in the
Netherlands in 2015 (226,400 out of 505,800) were leased vehicles.
43 percent of the passenger cars and light commercial vehicles newly purchased in the
Netherlands in 2015 (217,500 out of 505,800) were leased vehicles owned or managed by a VNA
member.
Source: RDC, VNA
Explanation
449,350 new passenger cars and 56,450 light commercial vehicles were registered in 2015, giving a
combined total of 505,800. RDC reports 207,303 at leasing companies or vehicles newly registered in
RTL. The VNA has added to the RDC total an estimated number of vehicles owned or managed by a
leasing company which are registrered on the lessee, and which have not been registered in RTL with
a vehicle obligation. This concerns approximately 19,100 cars.
The number of newly leased vehicles in 2015 was estimated by the VNA at 226,400 passenger cars
and light commercial vehicles. Of these, 217,500 (96 percent of the total) were leased by members of
the VNA.
1 RDC is a supplier of automotive registration data
2 RTL (Registratie Tenaamstelling Leasemaatschappij) is a type of vehicle registration for the variation in which the leased
vehicles formally is being registered on lessees name but is owned by the lessor.
4
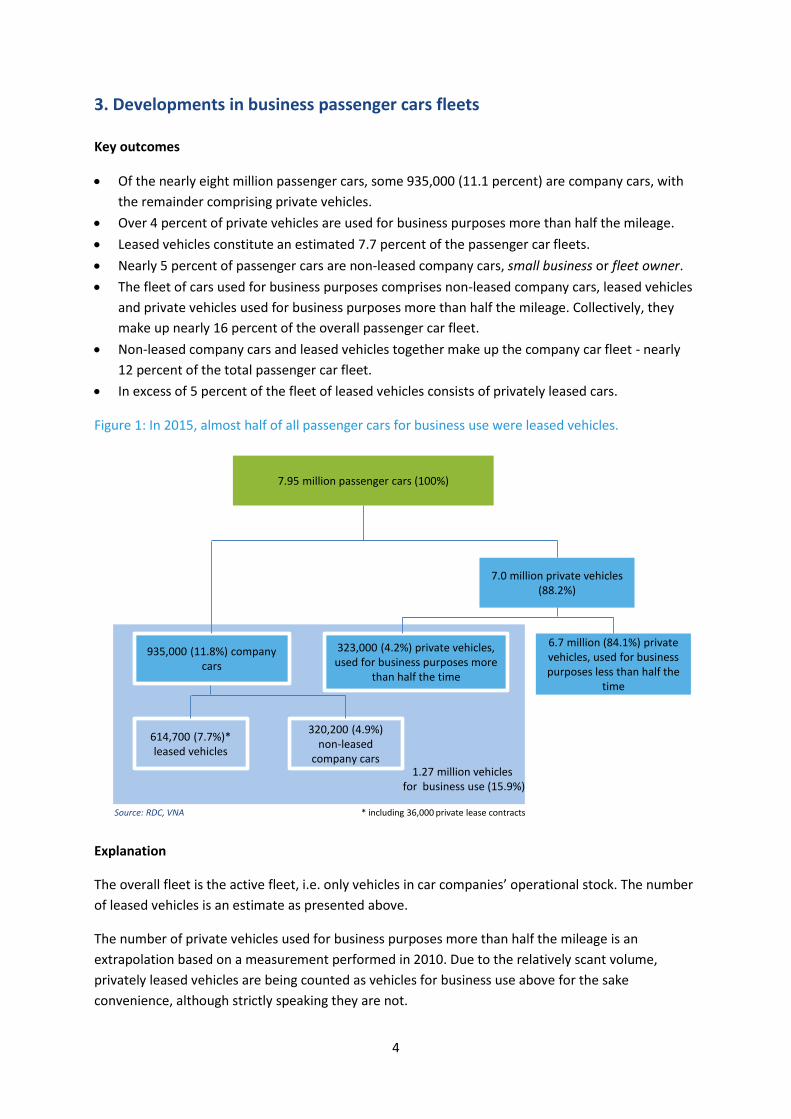
3. Developments in business passenger cars fleets
Key outcomes
Of the nearly eight million passenger cars, some 935,000 (11.1 percent) are company cars, with
the remainder comprising private vehicles.
Over 4 percent of private vehicles are used for business purposes more than half the mileage.
Leased vehicles constitute an estimated 7.7 percent of the passenger car fleets.
Nearly 5 percent of passenger cars are non-leased company cars, small business or fleet owner.
The fleet of cars used for business purposes comprises non-leased company cars, leased vehicles
and private vehicles used for business purposes more than half the mileage. Collectively, they
make up nearly 16 percent of the overall passenger car fleet.
Non-leased company cars and leased vehicles together make up the company car fleet - nearly
12 percent of the total passenger car fleet.
In excess of 5 percent of the fleet of leased vehicles consists of privately leased cars.
Figure 1: In 2015, almost half of all passenger cars for business use were leased vehicles.
Explanation
The overall fleet is the active fleet, i.e. only vehicles in car companies’ operational stock. The number
of leased vehicles is an estimate as presented above.
The number of private vehicles used for business purposes more than half the mileage is an
extrapolation based on a measurement performed in 2010. Due to the relatively scant volume,
privately leased vehicles are being counted as vehicles for business use above for the sake
convenience, although strictly speaking they are not.
7.95 million passenger cars (100%)
935,000 (11.8%) company cars
323,000 (4.2%) private vehicles, used for business purposes more
than half the time
7.0 million private vehicles(88.2%)
6.7 million (84.1%) private vehicles, used for business purposes less than half the
time
614,700 (7.7%)* leased vehicles
320,200 (4.9%) non-leased
company cars
* including 36,000 private lease contractsSource: RDC, VNA
1.27 million vehicles for business use (15.9%)
5
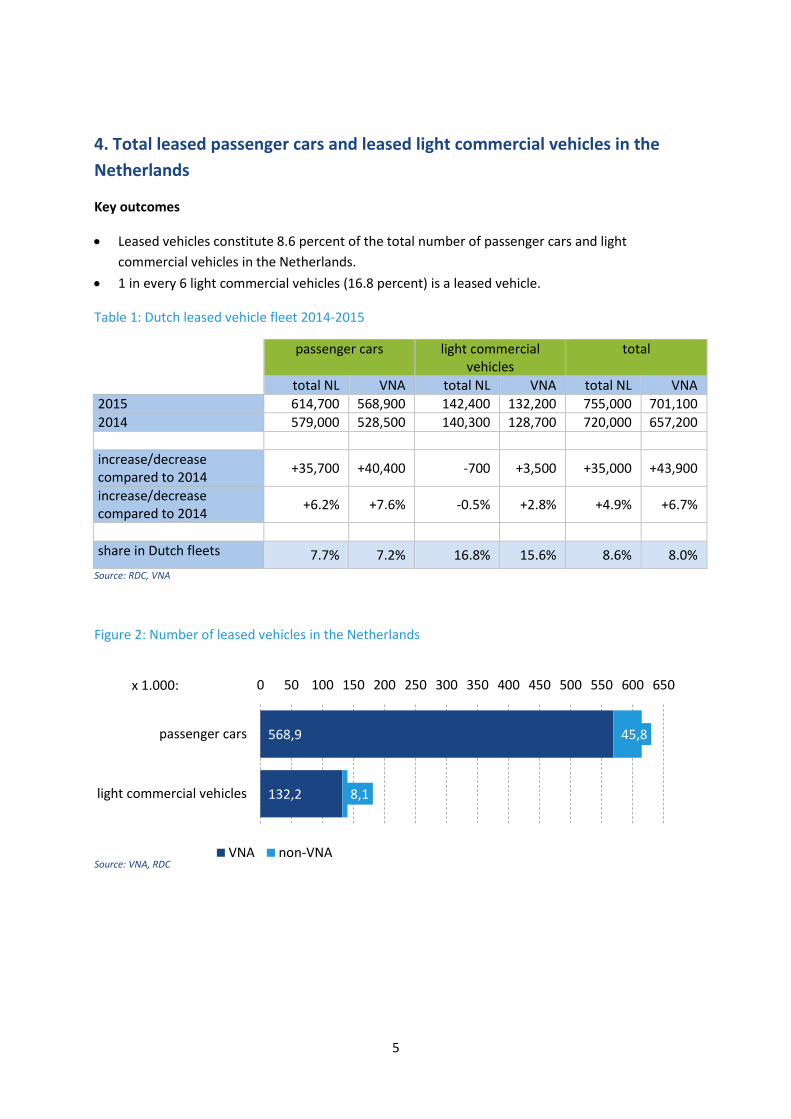
4. Total leased passenger cars and leased light commercial vehicles in the
Netherlands
Key outcomes
Leased vehicles constitute 8.6 percent of the total number of passenger cars and light
commercial vehicles in the Netherlands.
1 in every 6 light commercial vehicles (16.8 percent) is a leased vehicle.
Table 1: Dutch leased vehicle fleet 2014-2015
passenger cars light commercial vehicles
total
total NL VNA total NL VNA total NL VNA
2015 614,700 568,900 142,400 132,200 755,000 701,100
2014 579,000 528,500 140,300 128,700 720,000 657,200
increase/decrease compared to 2014
+35,700 +40,400 -700 +3,500 +35,000 +43,900
increase/decrease compared to 2014
+6.2% +7.6% -0.5% +2.8% +4.9% +6.7%
share in Dutch fleets 7.7% 7.2% 16.8% 15.6% 8.6% 8.0%
Source: RDC, VNA
Figure 2: Number of leased vehicles in the Netherlands
568,9
132,2
45,8
8,1
passenger cars
light commercial vehicles
0 50 100 150 200 250 300 350 400 450 500 550 600 650x 1.000:
VNA non-VNASource: VNA, RDC
6
5. Top 10 largest vehicle leasing companies in the Netherlands
ALD Automotive
Alphabet Netherlands
Arval
Athlon Car Lease Netherlands
BMW Group Financial Services
International Car Lease Holding
LeasePlan Netherlands
Mercedes-Benz Financial Services
Terberg Leasing
Volkswagen Pon Financial Services Source: VNA
Explanation
The size has been measured in terms of the number of vehicles in lease and fleet management as at
31 December 2015. The order in the top 10 is alphabetical rather than according to fleet size.
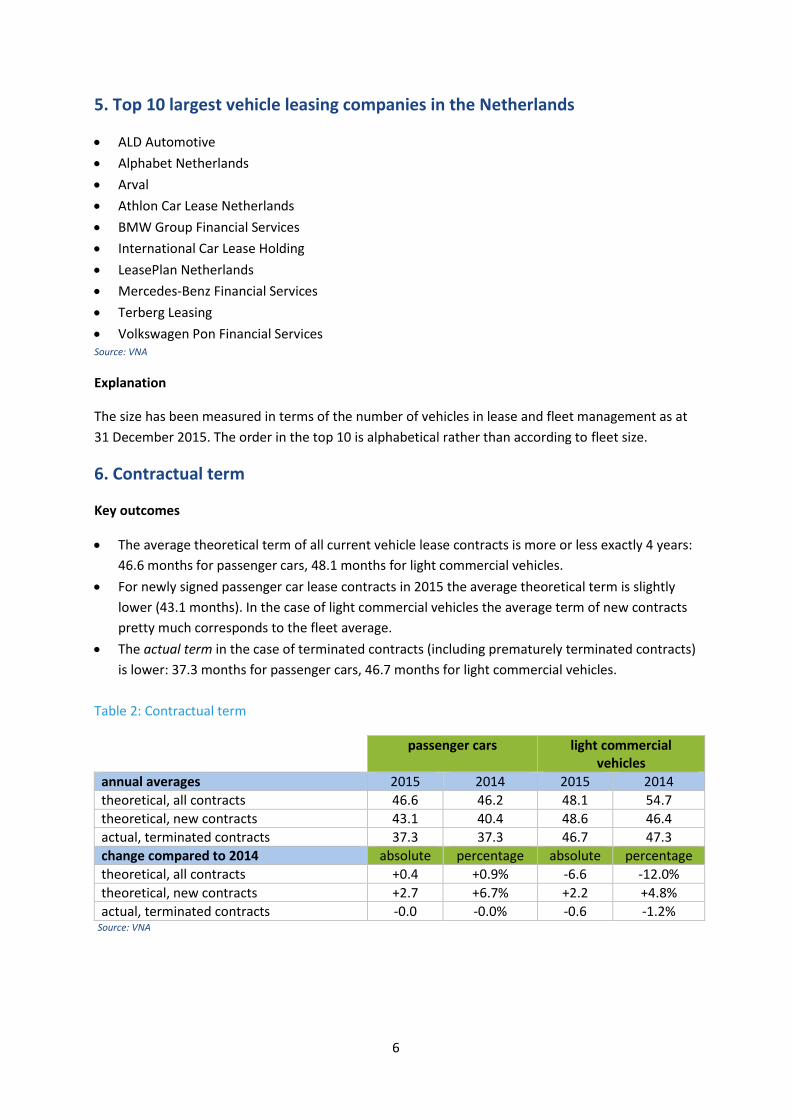
6. Contractual term
Key outcomes
The average theoretical term of all current vehicle lease contracts is more or less exactly 4 years:
46.6 months for passenger cars, 48.1 months for light commercial vehicles.
For newly signed passenger car lease contracts in 2015 the average theoretical term is slightly
lower (43.1 months). In the case of light commercial vehicles the average term of new contracts
pretty much corresponds to the fleet average.
The actual term in the case of terminated contracts (including prematurely terminated contracts)
is lower: 37.3 months for passenger cars, 46.7 months for light commercial vehicles.
Table 2: Contractual term
passenger cars light commercial vehicles
annual averages 2015 2014 2015 2014
theoretical, all contracts 46.6 46.2 48.1 54.7
theoretical, new contracts 43.1 40.4 48.6 46.4
actual, terminated contracts 37.3 37.3 46.7 47.3
change compared to 2014 absolute percentage absolute percentage
theoretical, all contracts +0.4 +0.9% -6.6 -12.0%
theoretical, new contracts +2.7 +6.7% +2.2 +4.8%
actual, terminated contracts -0.0 -0.0% -0.6 -1.2% Source: VNA

7
Figure 3: Average term passenger car lease contracts
Figure 4: Average term light commercial vehicle lease contracts
40
,7
41
,5
41
,8
42
,9
41
,6
42
,2
43
,2
40
,8
40
,3
43
,1
36
,9
37
,5
37
,8
37
,5
39
,3
40
,3
40
,1
39
,0
37
,0
37
,3
28
30
32
34
36
38
40
42
44
2006 2007 2008 2009 2010 2011 2012 2013 2014 2015
theoretical term new contracts actual term terminated contractsSource: VNA
49
,9
50
,9
51
,6
51
,0
49
,8
52
,7
51
,7
49
,4
48
,1
48
,6
42
,3
45
,7
45
,3
46
,0
48
,1
50
,3
49
,4
50
,4
48
,6
46
,7
38
40
42
44
46
48
50
52
54
2006 2007 2008 2009 2010 2011 2012 2013 2014 2015
theoretical term new contracts actual term terminated contractsSource: VNA
8
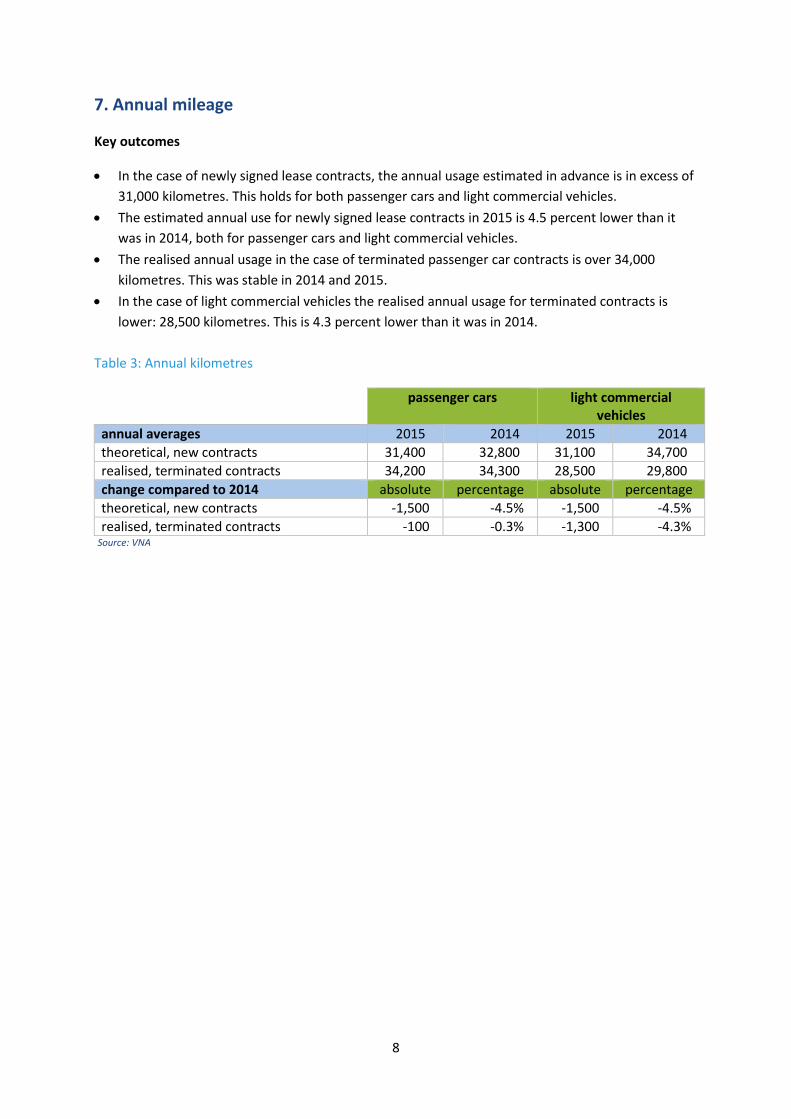
7. Annual mileage
Key outcomes
In the case of newly signed lease contracts, the annual usage estimated in advance is in excess of
31,000 kilometres. This holds for both passenger cars and light commercial vehicles.
The estimated annual use for newly signed lease contracts in 2015 is 4.5 percent lower than it
was in 2014, both for passenger cars and light commercial vehicles.
The realised annual usage in the case of terminated passenger car contracts is over 34,000
kilometres. This was stable in 2014 and 2015.
In the case of light commercial vehicles the realised annual usage for terminated contracts is
lower: 28,500 kilometres. This is 4.3 percent lower than it was in 2014.
Table 3: Annual kilometres
passenger cars light commercial vehicles
annual averages 2015 2014 2015 2014
theoretical, new contracts 31,400 32,800 31,100 34,700
realised, terminated contracts 34,200 34,300 28,500 29,800
change compared to 2014 absolute percentage absolute percentage
theoretical, new contracts -1,500 -4.5% -1,500 -4.5%
realised, terminated contracts -100 -0.3% -1,300 -4.3% Source: VNA
9
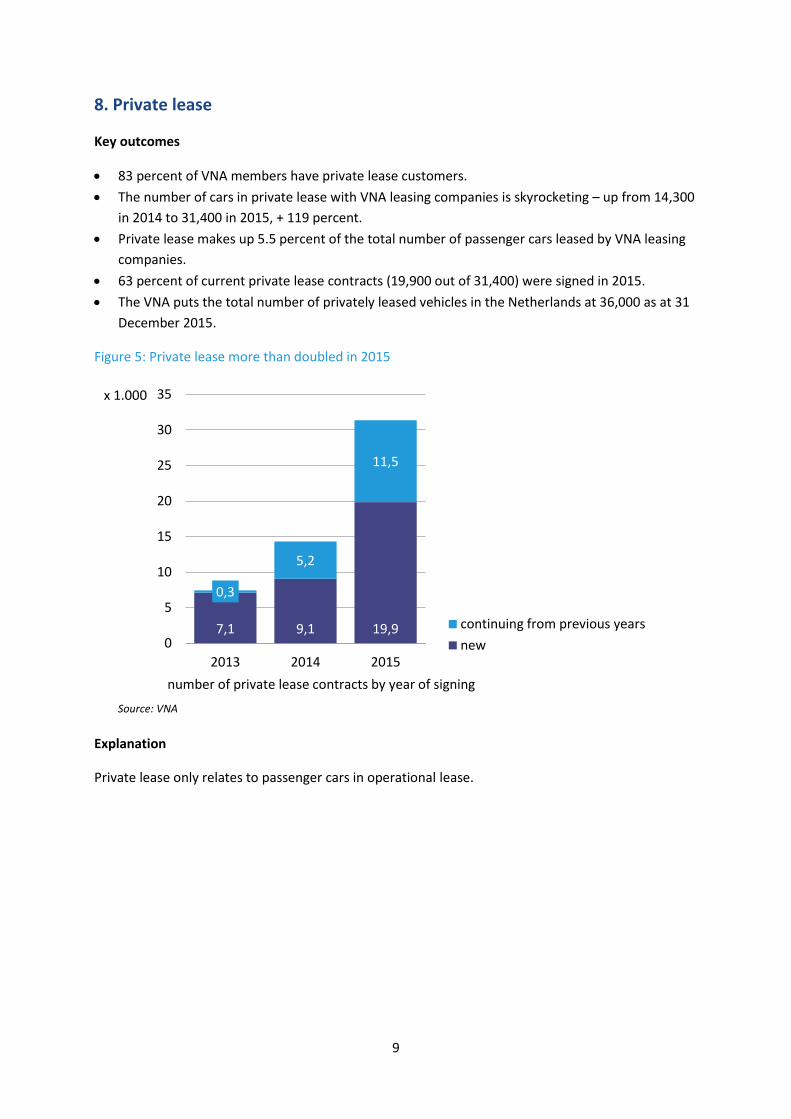
8. Private lease
Key outcomes
83 percent of VNA members have private lease customers.
The number of cars in private lease with VNA leasing companies is skyrocketing – up from 14,300
in 2014 to 31,400 in 2015, + 119 percent.
Private lease makes up 5.5 percent of the total number of passenger cars leased by VNA leasing
companies.
63 percent of current private lease contracts (19,900 out of 31,400) were signed in 2015.
The VNA puts the total number of privately leased vehicles in the Netherlands at 36,000 as at 31
December 2015.
Figure 5: Private lease more than doubled in 2015
Explanation
Private lease only relates to passenger cars in operational lease.
7,1 9,1 19,9
0,3
5,2
11,5
0
5
10
15
20
25
30
35
2013 2014 2015
continuing from previous years
new
Source: VNA
number of private lease contracts by year of signing
x 1.000
10
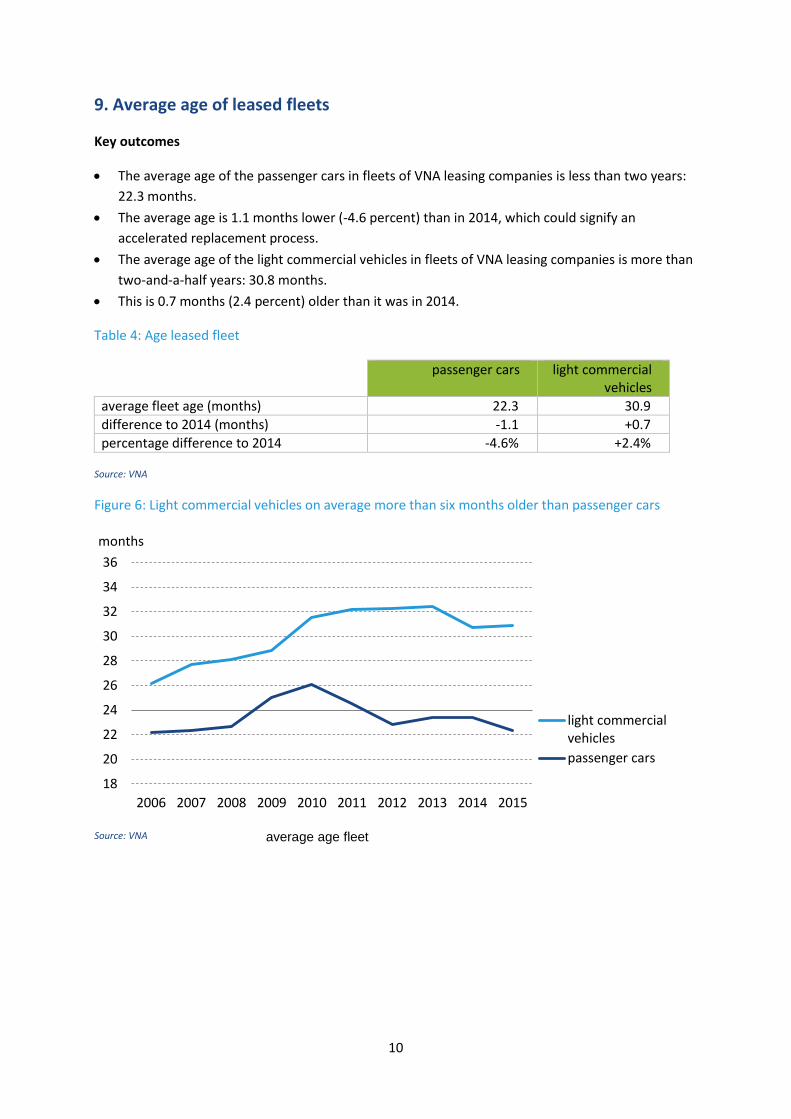
9. Average age of leased fleets
Key outcomes
The average age of the passenger cars in fleets of VNA leasing companies is less than two years:
22.3 months.
The average age is 1.1 months lower (-4.6 percent) than in 2014, which could signify an
accelerated replacement process.
The average age of the light commercial vehicles in fleets of VNA leasing companies is more than
two-and-a-half years: 30.8 months.
This is 0.7 months (2.4 percent) older than it was in 2014.
Table 4: Age leased fleet
passenger cars light commercial vehicles
average fleet age (months) 22.3 30.9
difference to 2014 (months) -1.1 +0.7
percentage difference to 2014 -4.6% +2.4%
Source: VNA
Figure 6: Light commercial vehicles on average more than six months older than passenger cars
18
20
22
24
26
28
30
32
34
36
2006 2007 2008 2009 2010 2011 2012 2013 2014 2015
months
light commercialvehicles
passenger cars
Source: VNA average age fleet

11
10. Company car taxable benefit category for passenger cars (exc. RTL)
Key outcomes
At 44.3 percent, the 20 percent taxable benefit category was the largest category for newly
leased vehicles in 2015.
Of the newly leased vehicles in 2015, 15 percent fall within one of the bottom two taxable
benefit categories (4 and 7 percent).
The aggregate share of the two highest taxable benefit categories (20 and 25 percent) was well
over half of all newly leased vehicles (56.4 percent).
Table 5: Taxable benefit category
quantity share
4% 1,153 0.7%
7% 22,319 14.3%
14% 44,448 28.5%
20% 69,095 44.3%
25% 18,848 12.1%
Source: RDC
Figure 7: Most vehicles in 20 percent taxable benefit category
Explanation
The data only pertains to vehicles registered as ‘Leasing company’ by RDC.
25% taxable benefit, 12.1%
20% taxable benefit, 44.3%
14% taxable benefit, 28.5%
7% taxable benefit, 14.3%
4% taxable benefit, 0.7%
newly leased passenger cars 2015 according to taxable benefit category Source: RDC
12
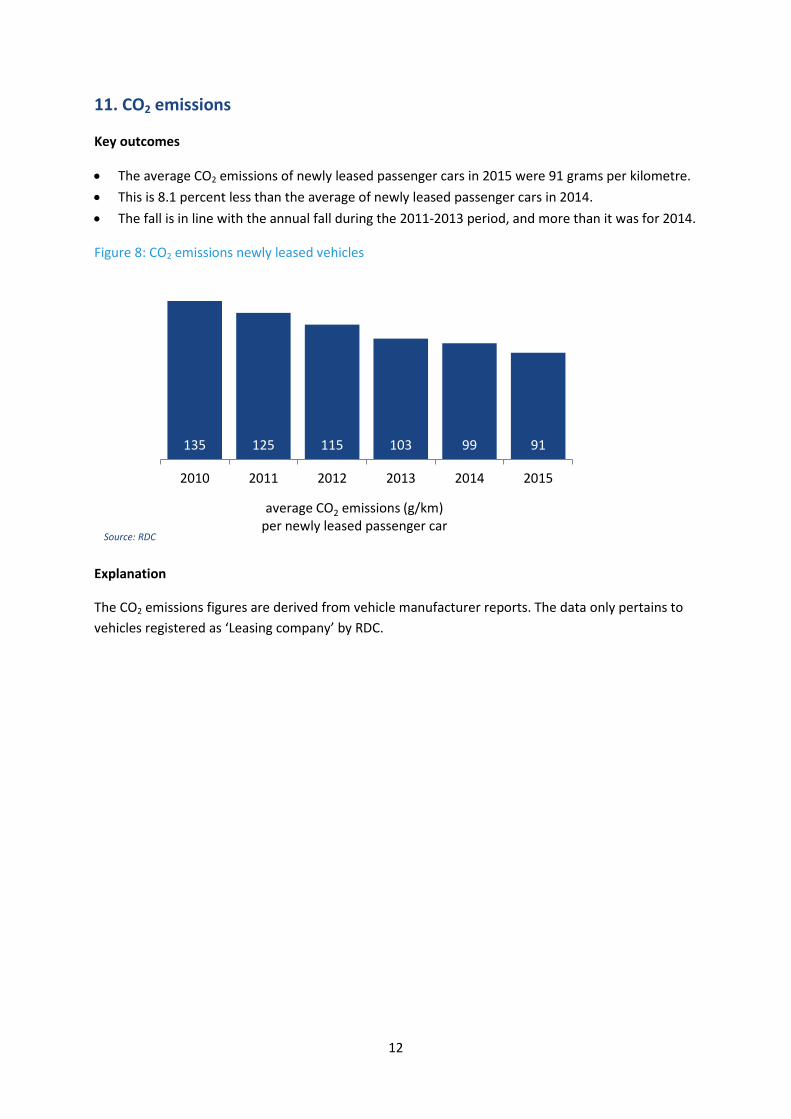
11. CO2 emissions
Key outcomes
The average CO2 emissions of newly leased passenger cars in 2015 were 91 grams per kilometre.
This is 8.1 percent less than the average of newly leased passenger cars in 2014.
The fall is in line with the annual fall during the 2011-2013 period, and more than it was for 2014.
Figure 8: CO2 emissions newly leased vehicles
Explanation
The CO2 emissions figures are derived from vehicle manufacturer reports. The data only pertains to
vehicles registered as ‘Leasing company’ by RDC.
135 125 115 103 99 91
2010 2011 2012 2013 2014 2015
average CO2 emissions (g/km) per newly leased passenger car
Source: RDC
13
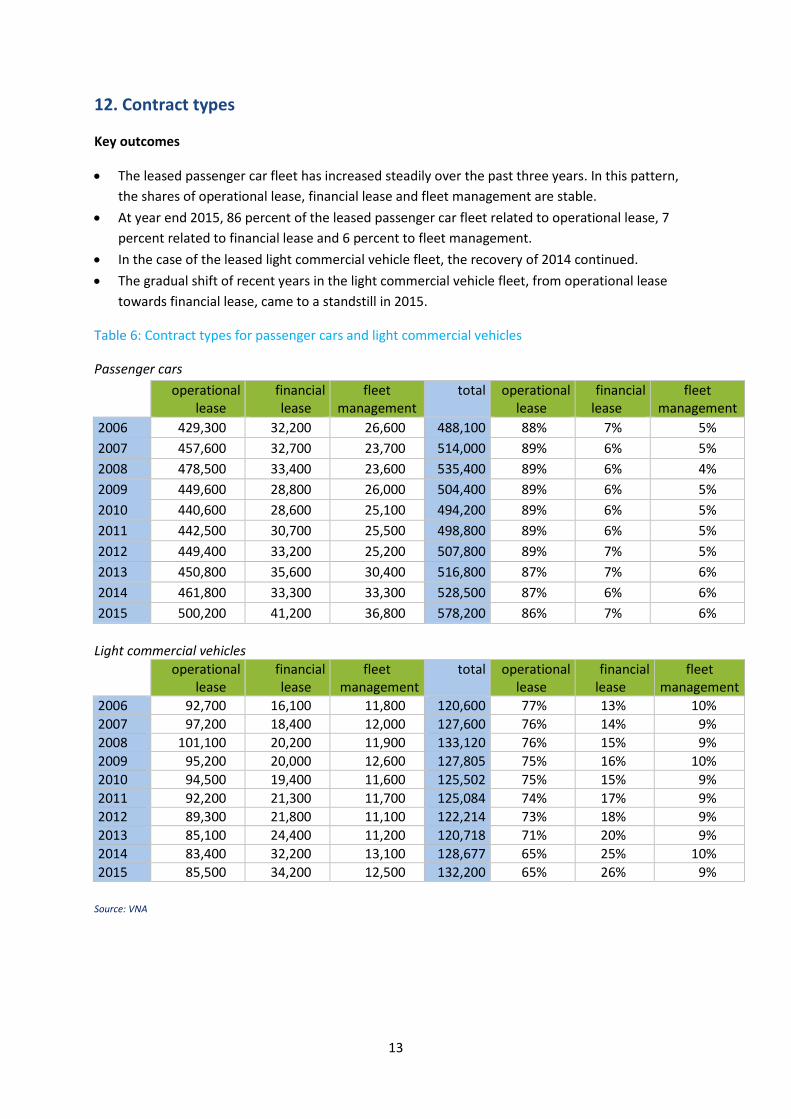
12. Contract types
Key outcomes
The leased passenger car fleet has increased steadily over the past three years. In this pattern,
the shares of operational lease, financial lease and fleet management are stable.
At year end 2015, 86 percent of the leased passenger car fleet related to operational lease, 7
percent related to financial lease and 6 percent to fleet management.
In the case of the leased light commercial vehicle fleet, the recovery of 2014 continued.
The gradual shift of recent years in the light commercial vehicle fleet, from operational lease
towards financial lease, came to a standstill in 2015.
Table 6: Contract types for passenger cars and light commercial vehicles
Passenger cars
operational lease
financial lease
fleet management
total operational lease
financial lease
fleet management
2006 429,300 32,200 26,600 488,100 88% 7% 5%
2007 457,600 32,700 23,700 514,000 89% 6% 5%
2008 478,500 33,400 23,600 535,400 89% 6% 4%
2009 449,600 28,800 26,000 504,400 89% 6% 5%
2010 440,600 28,600 25,100 494,200 89% 6% 5%
2011 442,500 30,700 25,500 498,800 89% 6% 5%
2012 449,400 33,200 25,200 507,800 89% 7% 5%
2013 450,800 35,600 30,400 516,800 87% 7% 6%
2014 461,800 33,300 33,300 528,500 87% 6% 6%
2015 500,200 41,200 36,800 578,200 86% 7% 6%
Light commercial vehicles
operational lease
financial lease
fleet management
total operational lease
financial lease
fleet management
2006 92,700 16,100 11,800 120,600 77% 13% 10%
2007 97,200 18,400 12,000 127,600 76% 14% 9%
2008 101,100 20,200 11,900 133,120 76% 15% 9%
2009 95,200 20,000 12,600 127,805 75% 16% 10%
2010 94,500 19,400 11,600 125,502 75% 15% 9%
2011 92,200 21,300 11,700 125,084 74% 17% 9%
2012 89,300 21,800 11,100 122,214 73% 18% 9%
2013 85,100 24,400 11,200 120,718 71% 20% 9%
2014 83,400 32,200 13,100 128,677 65% 25% 10%
2015 85,500 34,200 12,500 132,200 65% 26% 9%
Source: VNA

14
Figure 9: VNA leased passenger car fleet growing, stable relationships contract types
Figure 10: VNA light commercial vehicle fleet recovery continuing, stable relationships contract types
Explanation
Changes in the size of the aggregate fleets of all VNA members are caused by changes in the number
of VNA members as well as changes in the fleet size of members.
429,3
457,6
478,5
449,6
440,6
442,5
449,4
450,8
461,8
461,8
500,2
32,2
32,7
33,4
28,8
28,6
30,7
33,2
35,6
33,4
33,4
41,2
26,6
23,7
23,6
26,0
25,1
25,5
25,2
30,4
33,3
33,3
36,8
2006
2007
2008
2009
2010
2011
2012
2013
2014
2014
2015
operational lease financial lease fleet management
Source: VNA
leased passenger cars (x1,000) by contract type
92,7
97,2
101,1
95,2
94,5
92,2
89,3
85,1
83,4
85,5
16,1
18,4
20,2
20,0
19,4
21,3
21,8
24,4
32,2
34,2
11,8
12,0
11,9
12,6
11,6
11,7
11,1
11,2
13,1
12,5
2006
2007
2008
2009
2010
2011
2012
2013
2014
2015
operational lease financial lease fleet management
Source: VNA leased light commercial vehicles (x1,000) by contract type
15
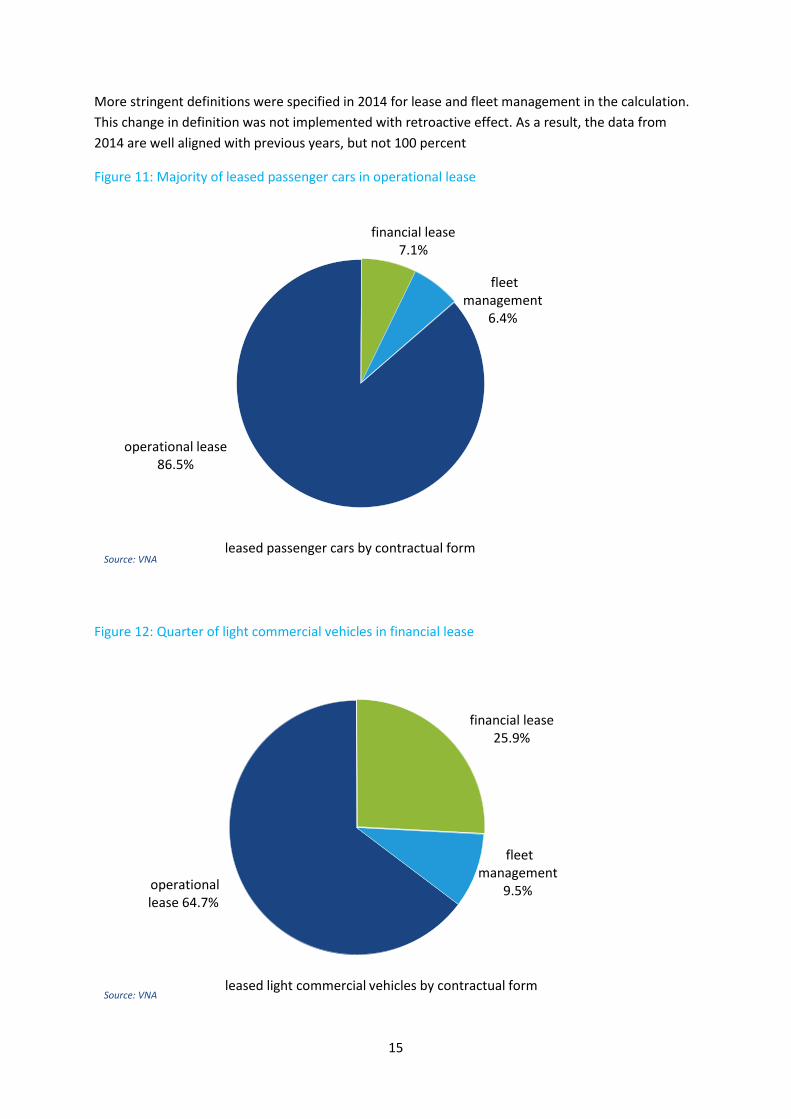
More stringent definitions were specified in 2014 for lease and fleet management in the calculation.
This change in definition was not implemented with retroactive effect. As a result, the data from
2014 are well aligned with previous years, but not 100 percent
Figure 11: Majority of leased passenger cars in operational lease
Figure 12: Quarter of light commercial vehicles in financial lease
operational lease 86.5%
financial lease 7.1%
fleet management
6.4%
leased passenger cars by contractual form Source: VNA
operational lease 64.7%
financial lease 25.9%
fleet management
9.5%
leased light commercial vehicles by contractual form Source: VNA

16
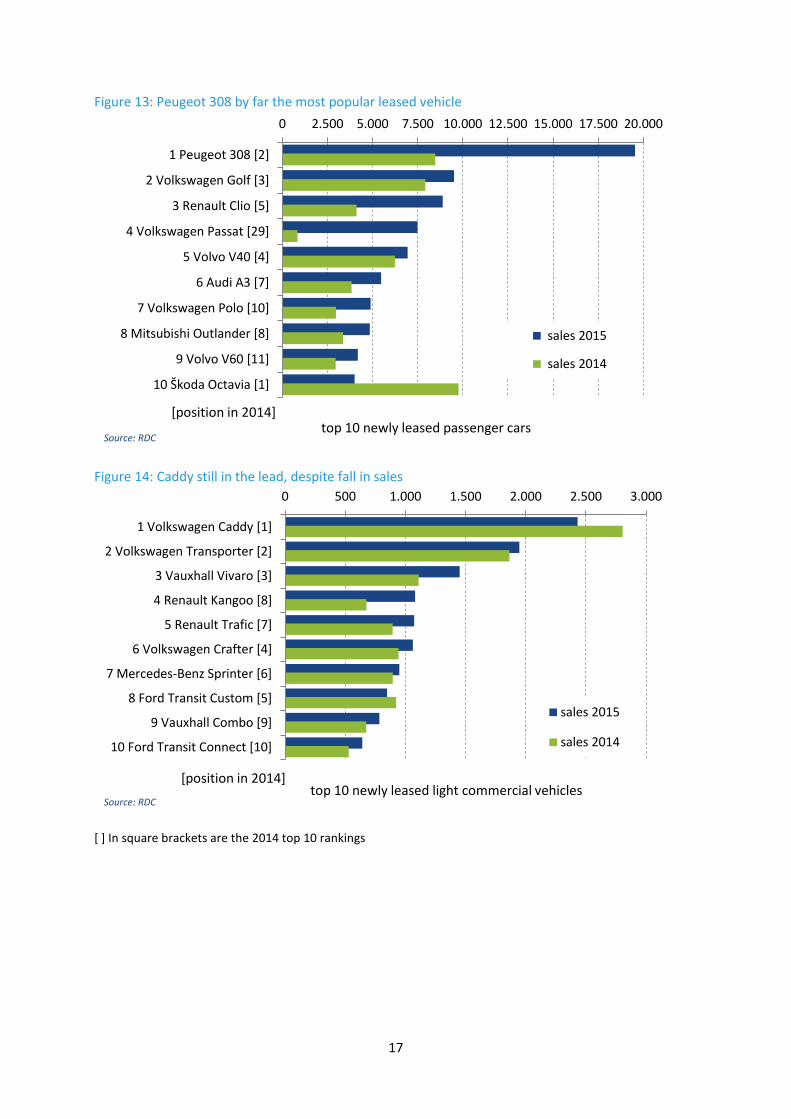
13. Top 10 new leased vehicles
Key outcomes
Passenger cars
The most popular new leased passenger car in 2015 was the Peugeot 308, with a sales total of
19,542. The Peugeot 308 came second in 2014.
The Peugeot 308 (8,477) entered the top 10 in second place.
The number 1 spot in 2014 was held by the Škoda Octavia, which has fallen to tenth place.
The Volkswagen Passat has climbed from 29 to 4, with a ninefold increase in sales total.
The sales total for the number 1 vehicle in 2015 (19,542) is twice as high as the sales total for the
number 1 vehicle in 2014.
The aggregate share of the top 10 cars in the total number of leased new sales (155,904) is 49
percent, just like in 2014.
Light commercial vehicles
The top 10 contains the same models as in 2014
The VW Caddy and the VW Transporter topped the list comfortably, just like last year.
The two Renault models (Kangoo and Trafic) have moved up the rankings.
The aggregate share of the top 10 vehicles in the total number of leased new sales (18,179) is
67.5 percent, which is 7 percentage points less than in 2014.
Table 7: Top 10 of newly sold passenger cars by model
passenger cars 2015 2014 light commercial vehicles 2015 2014
1 Peugeot 308 19,542 8,477 Volkswagen Caddy 2,431 2,806
2 Volkswagen Golf 9,517 7,922 Volkswagen Transporter 1,947 1,865
3 Renault Clio 8,888 4,114 Vauxhall Vivaro 1,451 1,110
4 Volkswagen Passat 7,493 841 Renault Kangoo 1,081 677
5 Volvo V40 6,946 6,248 Renault Trafic 1,074 894
6 Audi A3 5,475 3,846 Volkswagen Crafter 1,063 944
7 Volkswagen Polo 4,895 2,976 Mercedes-Benz Sprinter 950 896
8 Mitsubishi Outlander 4,851 3,373 Ford Transit Custom 848 924
9 Volvo V60 4,190 2,954 Vauxhall Combo 784 676
10 Škoda Octavia 4,014 9,769 Ford Transit Connect 643 530 Source: RDC
17
Figure 13: Peugeot 308 by far the most popular leased vehicle
Figure 14: Caddy still in the lead, despite fall in sales
[ ] In square brackets are the 2014 top 10 rankings
0 2.500 5.000 7.500 10.000 12.500 15.000 17.500 20.000
1 Peugeot 308 [2]
2 Volkswagen Golf [3]
3 Renault Clio [5]
4 Volkswagen Passat [29]
5 Volvo V40 [4]
6 Audi A3 [7]
7 Volkswagen Polo [10]
8 Mitsubishi Outlander [8]
9 Volvo V60 [11]
10 Škoda Octavia [1]
top 10 newly leased passenger cars
sales 2015
sales 2014
[position in 2014]
Source: RDC
0 500 1.000 1.500 2.000 2.500 3.000
1 Volkswagen Caddy [1]
2 Volkswagen Transporter [2]
3 Vauxhall Vivaro [3]
4 Renault Kangoo [8]
5 Renault Trafic [7]
6 Volkswagen Crafter [4]
7 Mercedes-Benz Sprinter [6]
8 Ford Transit Custom [5]
9 Vauxhall Combo [9]
10 Ford Transit Connect [10]
top 10 newly leased light commercial vehicles
sales 2015
sales 2014
[position in 2014]
Source: RDC
18
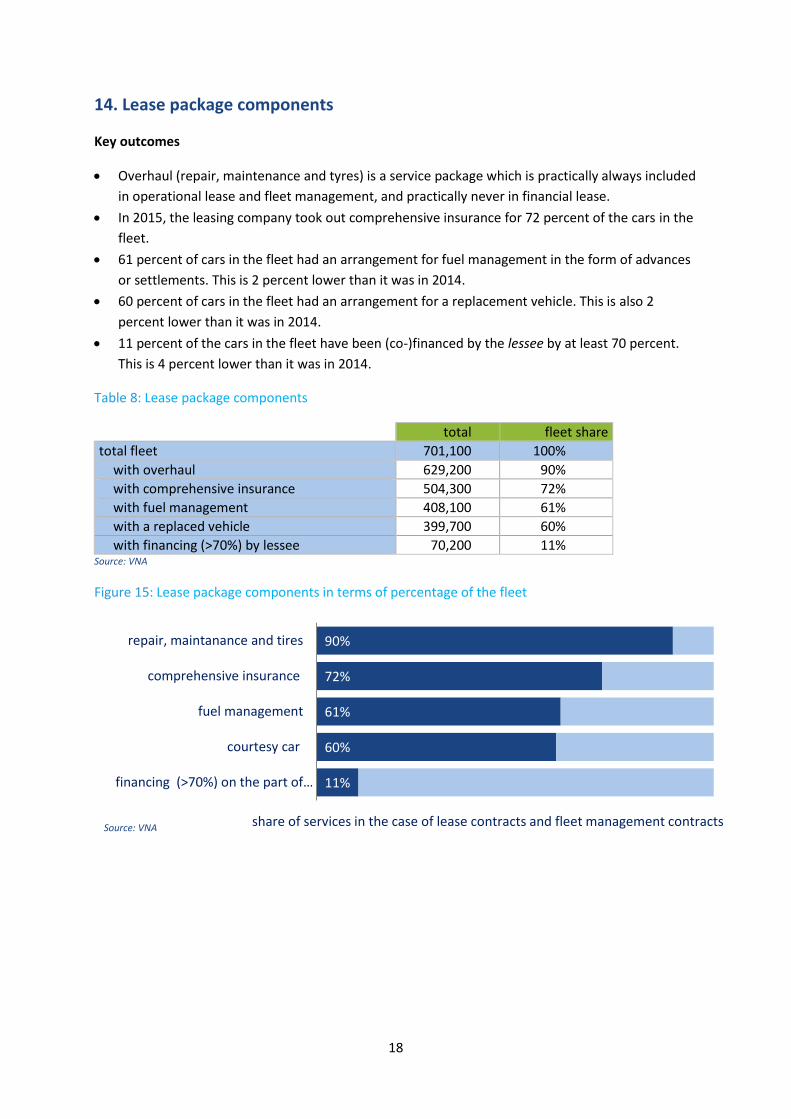
14. Lease package components
Key outcomes
Overhaul (repair, maintenance and tyres) is a service package which is practically always included
in operational lease and fleet management, and practically never in financial lease.
In 2015, the leasing company took out comprehensive insurance for 72 percent of the cars in the
fleet.
61 percent of cars in the fleet had an arrangement for fuel management in the form of advances
or settlements. This is 2 percent lower than it was in 2014.
60 percent of cars in the fleet had an arrangement for a replacement vehicle. This is also 2
percent lower than it was in 2014.
11 percent of the cars in the fleet have been (co-)financed by the lessee by at least 70 percent.
This is 4 percent lower than it was in 2014.
Table 8: Lease package components
total fleet share
total fleet 701,100 100%
with overhaul 629,200 90%
with comprehensive insurance 504,300 72%
with fuel management 408,100 61%
with a replaced vehicle 399,700 60%
with financing (>70%) by lessee 70,200 11% Source: VNA
Figure 15: Lease package components in terms of percentage of the fleet
90%
72%
61%
60%
11%
repair, maintanance and tires
comprehensive insurance
fuel management
courtesy car
financing (>70%) on the part of…
share of services in the case of lease contracts and fleet management contracts Source: VNA

19
15. Number of employees leasing companies
Key outcomes
Staffing levels at the VNA leasing companies fluctuate between 3,200 and 3,600 FTEs.
In 2015 the number of FTEs came to 3,374.
There is a slight rising trend in terms of the average number of cars per FTE, with 2015 deviating
from this trend.
Figure 16: Staffing levels and average number of vehicles per FTE at VNA leasing companies
Explanation
The number of FTEs is partly determined by the way in which leasing companies are organised.
Activities can be done in-house or outsourced, ancillary services can either be shared with sister
companies or bought from a parent company. Consequently, both the number of FTEs and the
average number of vehicles per FTE have limited merit.
3.350 3.430 3.580 3.350 3.220 3.310 3.250 3.255 3.235 3.374
125
150
175
200
2500
2750
3000
3250
3500
3750
4000
2006 2007 2008 2009 2010 2011 2012 2013 2014 2015
FTEs (left axis) cars per FTE (right axis)
Source: VNA


![AppNote - VNA - Calculating VNA Measurement Accuracy [11410-00464]](https://img.dokumen.tips/doc/110x75/577ce6641a28abf10392b8aa/appnote-vna-calculating-vna-measurement-accuracy-11410-00464.jpg)