Embed Size (px)
Citation preview

p.1
Contemporizing the Checkout Area
with Insights from “Informed Choices”February 6, 2019

p.2
The In-Point in Time Experience, is Critical to
Building Baskets and Meeting Shoppers’ Satisfaction
Grocery stores of the future will offer
innovative, customer-centric shopping
experiences to meet needs and demands of
modern shoppers.”
Dr. Pallab Chatterjee, Symphony Retail AI
Source: Progressive Grocer “Experience is Crucial in the Grocery Store of the Future”,
August 21, 2018

p.3
After Price and Location, The Checkout Experience is Cited as
Important by 85% of Shoppers as Where they Elect to Shop
Source: Forrester Opportunity Snapshot / Digimarc “Consumers Cringe at Slow
Checkout”, August 2018
Shoppers cite long lines and speed of checkout leads
to a poor experience impacting their decision where to shop

Self-Checkout Continues to Grow
in terms of Installations and Shopper Usage
p.4
• 2018 was another record setting year with 63,000 self-checkout units shipped worldwide –more than half to the US*
• RBR projects a 7% CAGR for self checkout growth 2017 to 2023*
• 75% of consumers said they tried self-checkout in the past year**
Source: 2018 RBR Global EPOS & Self-Checkout Market report; Diebold Nixdorf “New
Trend Driving Self-Checkout’s Global Popularity” July 2018

p.5
As Well, Retailers Are Testing Many
In-Store Alternative Pay Point Options
Tap and Go
Scan, Bag, and Go Check out with me
Click and Collect

p.6
Hunger Satisfaction
ConvenientItems
Reward Myself
FunctionalItems
Entertain Pass the Time
Hydration
But What about Me - I have Needs and Expectations
that Don’t Change Based on the Transaction Location

Meanwhile, Retailers Are Under Pressure
to Make Changes in Assortment That Could Impact Sales
p.7

*Source: IMC Checkout Update 2017
p.8
Checkout Category is a Top 10 in Revenue at Most Retailers
with Higher Margins when Compared to Overall Store
**Source: IRI - Annual Sales for 52 Weeks ending January 22, 2017 and June 14, 2015 Supermarket Sales
Ranking** Category Dollar SalesDollar Sales %
Chg YAgoRanking** Category Dollar Sales
1 CARBONATED BEVERAGES $10,639,500,000 -0.7 1 CARBONATED BEVERAGES $10,943,968,256
2 BEER/ALE/ALCOHOLIC CIDER $10,518,000,000 2.4 2 MILK $10,594,338,816
3 SALTY SNACKS $10,004,000,000 2.2 3 BEER/ALE/ALCOHOLIC CIDER $9,864,431,616
4 MILK $9,521,600,000 -5.4 4 SALTY SNACKS $9,670,235,136
5 NATURAL CHEESE $9,103,500,000 0 5 FRESH BREAD & ROLLS $9,512,313,856
6 FRESH BREAD & ROLLS $8,948,800,000 -0.7 6 NATURAL CHEESE $9,016,193,024
7 WINE $7,728,300,000 4.7 7 WINE $7,349,528,064
8 BOTTLED WATER $5,831,000,000 8 CHECKOUT* $5,626,256,982
CHECKOUT* $5,539,040,640 -1.6% 8 COLD CEREAL $5,298,443,264
9 PET FOOD $5,238,000,000 0 9 YOGURT $5,207,877,632
10 YOGURT $5,190,900,000 -2.4 10 FZ DINNERS/ENTREES $5,122,487,808
11 COFFEE $5,165,700,000 0.1 11 COFFEE $4,930,121,216
12 COLD CEREAL $5,122,600,000 -2.6 12 BOTTLED WATER $4,868,366,848
13 FROZEN DINNERS/ENTREES $5,019,100,000 -0.9 13 ICE CREAM/SHERBERT $4,331,470,336
14 ICE CREAM/SHERBERT $4,552,300,000 3.9 14 CRACKERS $4,266,127,872
15 CRACKERS $4,356,800,000 0.4 15 RFG FRESH EGGS $4,203,556,608
52 weeks ending Jan 22, 2017 52 weeks ending June 14, 2015

0.0%
10.0%
20.0%
30.0%
40.0%
2016 2017 2018
32.9% 33.6% 31.3%
p.9
Annual US Supermarket Sales*
=
$680 Billion X .82%** of Sales
=
~$5.6 Billion Total Checkout Sales
*Source: Progressive Grocer Institute 2018
**IMC Checkout Update 2018
p.9
The Checkout Category is Big, Delivering Almost 1%
of Store Sales and 1.19% of Store Profits –But Relatively Flat
Profits are
significantly
higher at the
front end
Total Checkout Sales $ Growth
Retailer Gross Margin %
% of Store Sales % of Store Profit
0.82%
1.19%$0.0
$1.0
$2.0
$3.0
$4.0
$5.0
$6.0
2016 2017 2018
$5.6$5.5 $5.6

$2.2
$2.0
$1.8
$1.6
$1.5
$1.4$1.3
$1.1$1.0
$0.9
$0.0
$0.5
$1.0
$1.5
$2.0
$2.5
2008 2009 2010 2011 2012 2013 2014 2015 2016 2017 2018 2019 2020 2021 2022
Dollars Sold At Wholesale Forecast(Dollars Sold At Wholesale )
p.10p.10
Magazines, a former Power Category
Continues Single Copy Decline and Leaves a Big Void in Sales
• Forecasted data (2018-2022) calculated using AAA method of Exponential Smoothing (ETS)
algorithm based on historical data.
($ Billions) -1.8%
-9.1%
-7.6%
-10%
-7.6%-9%
-7.2%
-13%
Projections assumes a total collapse of the distribution channel does not occur
-9.6%
3 Year Forecasted Decline -45.9%
5 Year Forecasted Decline -76.2%
-11.2%
-17.9%-21.9%
-28%
-38.8%
-9.2%

35.0%
20.0%
16.6%
13.1%
7.3% 8.0%
33.9%
20.8%
17.7%
12.8%
7.0%7.7%
41.0%
20.1%
15.2%
9.3%
6.4%
8.0%
0.0%
5.0%
10.0%
15.0%
20.0%
25.0%
30.0%
35.0%
40.0%
45.0%
Beverages Candy Gum & Mints Magazines GM / HBC Snacks
2016 2017 2018
p.11p.11p.11
Change between 2016 and 2018 % Share
% Share of Total Checkout $ by Category
Source: IMC Checkout Update 2018
As Magazine Share Decline,
the Share of Edible Categories Grows
-3.8
+6.0

$0.00
$2.00
$4.00
$6.00
$8.00
$10.00
$12.00
Total Front End Beverages Candy Gum & Mints Magazines GM / HBC Snacks
$2.66
$6.08
$2.23$3.05
$0.96
$2.45$1.84
$0.84
$1.74
$0.75
$1.17
$0.25
$0.88
$0.52
$1.03
$2.25
$0.89
$1.34
$0.31
$1.09
$0.62
$ Sales Gross Profit Net Profit
p.12
Beverage and Edible
Continue to Deliver Highest Sales and Profits
$ Sales /Gross Profit/Net Profit per Sq. Inch
% Change in Sales / Sq. Inch between 2016 and 2018
+18%
Source: IMC Checkout Update 2018
Increase
reflects
increase in
Beverage $
Sales

0.0
5.0
10.0
15.0
20.0
25.0
Bottom Performing Retailer Average Performing Retailer Top Performing Retailer
12.7
16.6
20.7
p.13p.13
Total Checkout Unit Conversion (Units Sold per 100 Customers)
•Source: IMC Checkout Update 2018
•Top Performing Retailers – Top 6 retailers based on TTL Checkout units sold per 100 customers
•Bottom Performing Stores – Bottom 6 retailers based on TTL Checkout units sold per 100 customers
*Source: FMI Institute. Sales per Customer Transaction 2016
Top Performing Stores Out Perform Average Stores by 14%!Top Retailers Outperform Average Retailers by 25%

p.14
Capitalizing on Snacking / Balance is a Source for Growth
Source: “The Sweet Success of Snacking Across the Store” Nielsen October 2017
The individual snacking category reaches $33B in the US and while growth is happening across
all categories, snacking products
with healthful claims drive the
strongest uptick in sales

p.15
The Demand for Single Serve
“Grab and Go” Snacking Continues to Grow
• Annual household spending in individually packaged snacks increased 1.1% with almost every household (98%) purchasing at least once
• Busy households spend an average of $133 annually on individual snack items
• Large families purchase 16% more than the average family
Source: “The Sweet Success of Snacking Across the Store” Nielsen October 2017

p.16
Consumers Are Also Seeking Healthier Choices
Across Snacking Occasions is Also Growing
• Eighty percent of shoppers have purchased a BFY snack, such reduced salt, fat or calories
• Slightly fewer, 68%
have bought clean label snacks or are paying more attention to the recommended portion size (67%)
Source: SmartFood Choices; 210 Analytics; May 2018

p.17
The majority of shoppers still believe in indulgent snacking as well, with only 34 percent saying they stopped buying less
healthy snacks altogether
Even Still, Most Shoppers Desire the Choice to
Purchase an Occasional Treat
Source: SmartFood Choices; 210 Analytics; May 2018

p.18
Healthy Attributes Extend Across Shelf-Stable and Refrigerated Snacks and Beverages
Protein Snacking
Juices and Smoothies
Refrigerated Snacking
Nuts and Seeds
Healthy Salty
Yogurts / Dairy / Non-Dairy
Functional / Enhanced
Nutrition
Single Serve Fruit
Fruit Snacks
Shelf Stable Snacking
Waters
Meat Snacks
Cereal / Fruit Bars

Two Retail Pilots Evaluate the Impact of Adding
Additional Snacking Choices to Traditional Checkout Items
6 Test & 6 Control Stores
Healthy Cooler End-Cap & Shelf
Stable Lane Blocker
20 Weeks
6 Test & 6 Control Stores
Healthy Cooler & Shelf Stable
End-Caps
18 Weeks
Southwest Regional Chain Southeast Regional Chain

Both Retailers Showed Positive Results
Shopper Conversion Increased in Test Stores
0.0%
2.0%
4.0%
6.0%
8.0%
10.0%
12.0%
Test Store Control Stores % Change in Unit
Conversion (Test
Stores vs Control
Stores)
+11.6%
+7.9%
+3.7%
Total Healthier and Traditional Core Items
-1.0%
0.0%
1.0%
2.0%
3.0%
4.0%
5.0%
6.0%
Test Store Control Stores % Change in Unit
Conversion (Test
Stores vs Control
Stores)
4.7%
-0.6%
5.3%
Total Healthier and Traditional Core Items
Unit conversion is units sold per 100 shoppers. Charts represent increase in test store conversion change vs. control stores conversion
Southwest Regional Chain Southeast Regional Chain

-40.0%
-20.0%
0.0%
20.0%
40.0%
60.0%
80.0%
100.0%
100 Cal
Chocolate
Fruit
Snacks
Healthy
Salty
Meat Nutritional
Bars
Nuts /
Seeds
Healthier
Lane
Blocker
Total-21.3%
100.0%
4.2%
29.3%
9.8%
36.4%
% Change in Unit Conversion
(Test Stores vs Control Stores)
All Alternative Snacking Lane Blocker categories - other
than fruit snacks - increased conversion growth
Shelf Stable Items Increased Conversion by 36.4% in Test vs Control Stores in Southwest
Southwest Regional Chain

0.0%
10.0%
20.0%
30.0%
40.0%
50.0%
60.0%
70.0%
80.0%
90.0%
100.0%
Fruit Juices and
Teas
Meat /
Cheese
Milk Water Yogurt Healthier
Cooler
Total
23.4% 23.7%
37.7%
92.4%
38.9%
8.0%
21.4%
% Change in Unit Conversion
(Test Stores vs Control Stores)
Milk, Waters, and Protein Snacking contributed the
highest increases in customer conversion growth
Conversion for the Refrigerated Snacks and Drinks
Increased 21.4% in Test vs Control Stores - S.W.
Southwest Regional Chain

Shelf Stable Snacking Items Increased Conversion in Test vs Control at S.E. Chain
All Alternative Shelf Stable Snacking
categories had increased conversion
growth.
Alternative Shelf Stable Snacking
0.0%
200.0%
400.0%
600.0%
800.0%
1000.0%
1200.0%
1400.0%
1600.0%
1800.0%
Fruit
Snacks
Healthy
Salty
Meat Nutritional
Bars
Nuts /
Seeds
Alternative
Shelf
Stable
Snacking
Total
1799.3%
530.6%
28.6% 79.9% 16.1%102.2%
% Change in Unit Conversion
(Test Stores vs Control Stores)Southeast Regional Chain

All Alternative Cooler categories had
increased conversion growth.
Fruit Hummus Juices and
Teas
Meat /
Cheese
Milk Yogurt Alternative
Cooler
Total
18.3%
43.0%
34.3% 34.7%
64.8%
3.1%
22.2%
% Change in Unit Conversion
(Test Stores vs Control Stores)
Conversion for the Alternative Snacks and Drinks
Increased 22.1% in Test vs Control Stores at S.E. Chain
Southeast Regional Chain

p.25
The Addition of Informed Choices
Minimally Impacted Traditional Core Categories
Depending on the retailers’
merchandising and assortment
strategies, overall growth
can be achieved with both healthier and core items
Source: Impulse Marketing Co / NCA Continuum of Choice Test 2018
-6.0%
-4.0%
-2.0%
0.0%
2.0%
4.0%
6.0%
8.0%
10.0%
12.0%
14.0%
Beverages Candy Gum & Mints Snacks Total
-0.5% -1.3% -1.7%
8.7%
-1.2%
-3.2%
12.1%
-3.7%-4.2%
-0.2%
Traditional Core Items
Chain A Chain B

p.26
Unit conversion is units sold per 100 shoppers. Charts represent
increase in test store conversion change vs. control stores conversion
Results at Both Retailers was Encouraging
Shopper Conversion Up as Much as 5.3% in Test Stores
Source: Impulse Marketing Co / NCA Continuum of Choice Test 2018
-2.0%
0.0%
2.0%
4.0%
6.0%
8.0%
10.0%
12.0%
Chain A Chain B
4.7%
11.6%
-0.6%
7.9%
Total Checkout – Informed Choice and
Traditional Core Items
Test Stores Control Stores
+5.3%
+3.7%
p.27
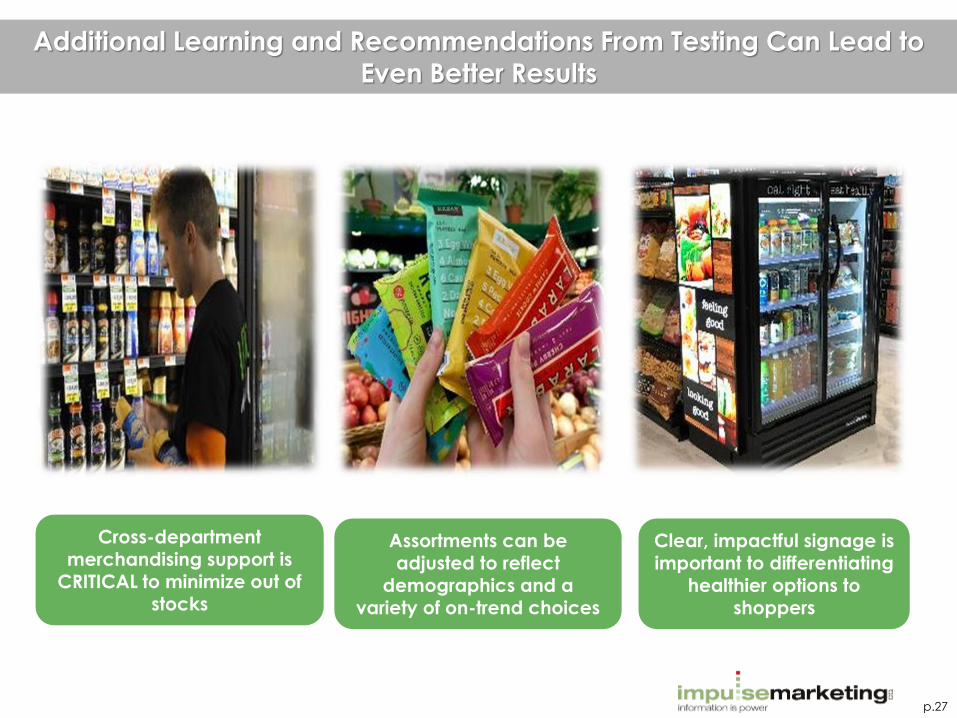
Cross-department merchandising support is
CRITICAL to minimize out of stocks
Assortments can be adjusted to reflect
demographics and a variety of on-trend choices
Clear, impactful signage is important to differentiating
healthier options to shoppers
Additional Learning and Recommendations From Testing Can Lead to
Even Better Results

p.28
Checkout Merchandising Principles Drive Conversion
at Top Performing Retailer
• Offering a Continuum of Choice Across Categories
• Implementing Appropriate Merchandising By Transaction Type
• Optimal Category Allocation, Location and Assortment
• Merchandising That Improves Shopper Experience and Maximizes Convenience
Total Checkout Unit Conversion (Units Sold per 100 Customers)
0.0
5.0
10.0
15.0
20.0
25.0
Bottom Performing
Retailer
Average
Performing Retailer
Top Performing
Retailer
12.7
16.6
20.7
Source: IMC Checkout Update 2018

p.29
Overall Checkout Summary
and Key Strategies For Merchandising

p.30
The Key to Success is To Make It Easier for Shoppers to
Solve Their Immediate Needs
Source: “6 Factors Driving Consumers Quest for Convenience” Nielsen August 2018
Shoppers’ me moment implies
retailers will “make it easy for me, make it
useful for me, and make it simple for
me”

“Continuum of Choice”
Fresh & Light Snacks
Functional Refreshment
Treating & Entertainment
Salty and Sweet
Personal &
Convenient
p.31
The Solution is to Offer A Continuum of Choice Across
Core and Healthy Categories that Meet Shoppers’ Need States

p.32
Address the Shopper’s Need State with an Informed Choice Merchandising Strategy at all Pay Points
Merchandise appropriately and consistently across all pay points - make it useful for me to have the item I
want wherever I checkout
Broaden choice and capitalize on trends with the right balance of indulgent
and healthier items – make it easy to find the snack I want
Create the right allocation, location, and signage for
checkout categories –make it simple to locate the
items I want on the day I want them

p.33
Best Results Are Achieved When Merchandising and Operations Departments Work Together
Transactional layouts need to be co-exist with merchandising
environments to optimize sales performance and
shopper satisfaction

p.34
Merchandising Designs Need to Reflect
Shopping Needs at all Pay Points
Traditional Lane
• Top sellers available in every lane – shoppers won’t switch lanes
• Customers will shop across end-caps so an alternation strategy can work in this locations
Self / Express Checkout
• Limited / browsing shopping time
• Focus on “grab and go” and edible Items
Self / Queue Line
• Browse time differs between location in queue
• “Grab and go” items closest to the registers

p.35
For Cashier Lanes, Merchandising Focus Should Be on Edibles with a Broad and Informed Choice Strategy
The key is in designing merchandising so that core top sellers are available close to every transaction point and healthier options are clearly highlighted
Candy
GM
Healthier Snacks and
Drinks
Healthier Snacks
GM and Seasonal
Salty Innovation
Magazine
Peg Candy
Meat Snacks
Snacks
Gum & Mints
GM
Customer Left View

p.36
Getting the Right Mix, However, is Challenging and
Needs to Be Balanced with End-Caps Playing Key Role
End-caps allow for innovation in key segments – such as Snacking and Beverage and / or allocate appropriate space for Magazines and GM
Candy
GM
Salty Innovation
Magazine
GM and Seasonal
Candy
SnacksBeverage
Customer Right View
Healthier Snacks
Healthier Snacks and
Drinks

p.37
Browse Time, Category Location, and Category Allocation
are Key Considerations in Maximizing Sales at Self-Checkout

p.38
Helping Meet On-The-Go Shopper Needs,
Maximizing Sales and Profits for Retailers and Brands
Cam Cloeter 908-310-8680