Embed Size (px)
Citation preview

Contaminants of Emerging Concern—An overview of the issue and new developments in environmental understanding, or… Edward T. Furlong National Water Quality Laboratory U.S. Geological Survey Denver Colorado
New Jersey Water Monitoring Council Meeting— January 21, 2016

What the heck are these “new” contaminants, and why should I care, really?

Outline - Background understanding on
contaminants of emerging concern (CECs).
- Highlights of recent USGS research on CECs, particularly on aspects connecting sources, transport, and distribution.

• Hormones • Neonicitinoid Insecticides • Phytoestrogens • Illicit drugs • Fire retardants • Algal toxins • Nanomaterials
• Pharmaceuticals • Disinfection BPs • Mycotoxins • Fragrances • Detergents • PFCs • Pathogens
What are CECs? “umbrella term”
1. We all contribute to CECs 2. Not currently regulated 3. Incomplete knowledge of fate or effects

For more than 15 years, pharmaceuticals have been of ongoing public interest…

0
50
100
150
200
250
300
2001 2002 2003 2004 2005 2006 2007 2008 2009 2010 2011 2012 2013 2014
Updated from Glassmeyer et. al. 2008
…and scientific interest: A
nnua
l # o
f Pha
rmac
euti
cal P
ublic
atio
ns

Are CECs entering our environment?
What CECs are entering our environment, and what are their effects?
Evolution of occurrence question:
3,899 citations

- Streams (1999-2000)
- Ground Water (2000)
- Sources of Drinking Water (2001)
- Streambed Sediment (2002)
Occurrence - National Recon Studies
ES&T; March 15, 2002 v. 36, no. 6, p. 1202-1211

>1500 Sites >400 Streams >1,000 Wells >75 WWTPs

What have we learned about CECs? § Present at sub-ppb concentrations in water.
- Streams and Groundwater
§ Present as complex mixtures.
§ Reflect a wide range of human activities.
§ Some compounds mobile and persistent.
§ Depend on the media (water, solids, tissue) sampled.
In terms of our currrent understanding, we are “midstream.”

Ongoing “Source-to-Receptor” research since 1998
Sources & Pathways
Transport & Fate
Methods Development
Eco Exposure & Effects
Human Exposure

Human and Animal Sources
Human • Wastewater treatment plants
(WWTPs)
• Combined sewer overflows • Onsite septic systems • Industrial Discharge • Landfills • Water Reuse
Animal § Waste lagoons, etc. § Land application § Processing plants § Aquaculture

Boulder Creek, CO; from Vajda et al., 2008
2.1
1.4
1.2
WWTPs: a significant CEC source
0
5
10
15
20
25
30
Reference Site
WWTP Effluent
Effluent Site
Tota
l Est
roge
n Eq
uiva
lenc
y
(in n
g L-1
17β
-Est
radi
ol)
Non-hormone EACs Estrone 17β-Estradiol 17α-Ethynylestradiol
Above Effluent Below

· Plant technology
· Kinds of Influent Received
· Temporal variability (e.g. diurnal, weekly)
· Hydrologic variability (e.g. events, CSOs)
· Population variability (e.g. tourism, college)
Factors Affecting WWTP Effluent Concentrations

Activated Sludge Trickling Filter
Wastewater Treatment – Critical Control Point
Barber et al., 2012, Environ. Sci. Technol. 46
2007 Upgrade

Boulder WWTP Post-Upgrade Results Infrastructure investment: - Improved the removal efficiencies of many CECs
- Decreased the estrogenicity of discharged effluent
- Reduced endocrine disruption relative to pre-upgrade conditions
Barber et al., 2012, ES&T

PMFs – Environmental Sources of CECs Phillips et al., 2010
Max Conc. (ug/L) 3,800 metaxalone 1,700 oxycodone >400 methadone 160 butalbital >40 phendimet. >40 carisoprodol 4 diazepam
http://toxics.usgs.gov/highlights/PMFs.html
Tota
l Con
cent
ratio
n (u
g/L)
Single sample from 23 WWTPs
35 samples per WWTP

Jiang et al., 2015 Department of Marine Environment and Engineering, National Sun Yat-sen University
Temporal pattern in illicit drugs/control substances in WWTP influent during music festival (~600,000 people)
Spring Scream (Taiwan)
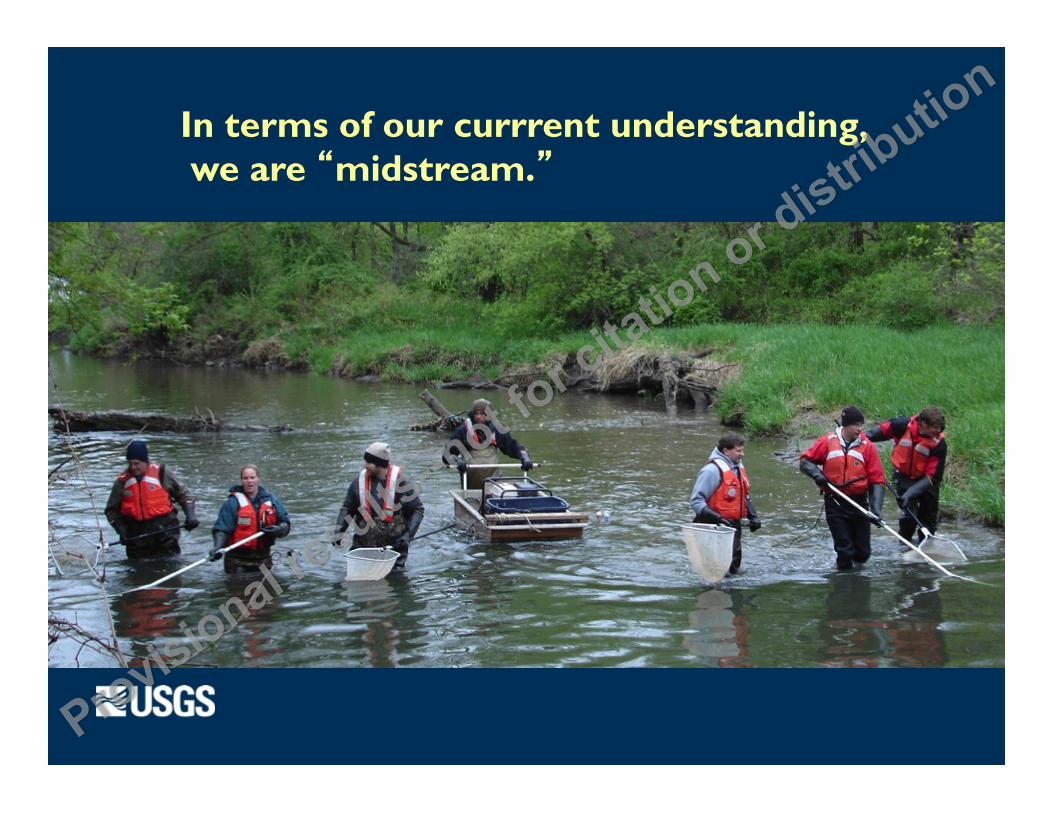
Fourmile Creek Field Lab: Lateral & Vertical Gradients

Fourmile Creek: Understanding the Hydrology
Barber et al., 2011

Ankeny WWTP Pre/Post-Closure Assessment: Effluent-Driven Lateral Hydraulic Gradients
• October 2012: • Effluent ~99% downstream flow • Diurnal pattern (63% dmQ):
• Morning & evening peaks • Overnight minimum
• No gradient reversals • Effluent drives local GW gradient
• December 2012: • Effluent ~71% downstream flow • Diurnal pattern (33% dmQ):
• Morning & evening peaks • Overnight minimum
• Gradient reversals • Effluent drives local GW gradient
• November 2013: • Ankeny WWTP Closed-no discharge

Effluent discharge focused downstream at ~45° angle toward opposite bank
Ankeny WWTP Pre-Closure Assessment: Lateral & Vertical Gradients

Ankeny WWTP Pre/Post-Closure Assessment: Carbamazepine Longitudinal & Lateral Gradient
- Effluent source--Eddy recirculation--Lateral infiltration
Bradley et al., 2014; Bradley et al. (submitted)
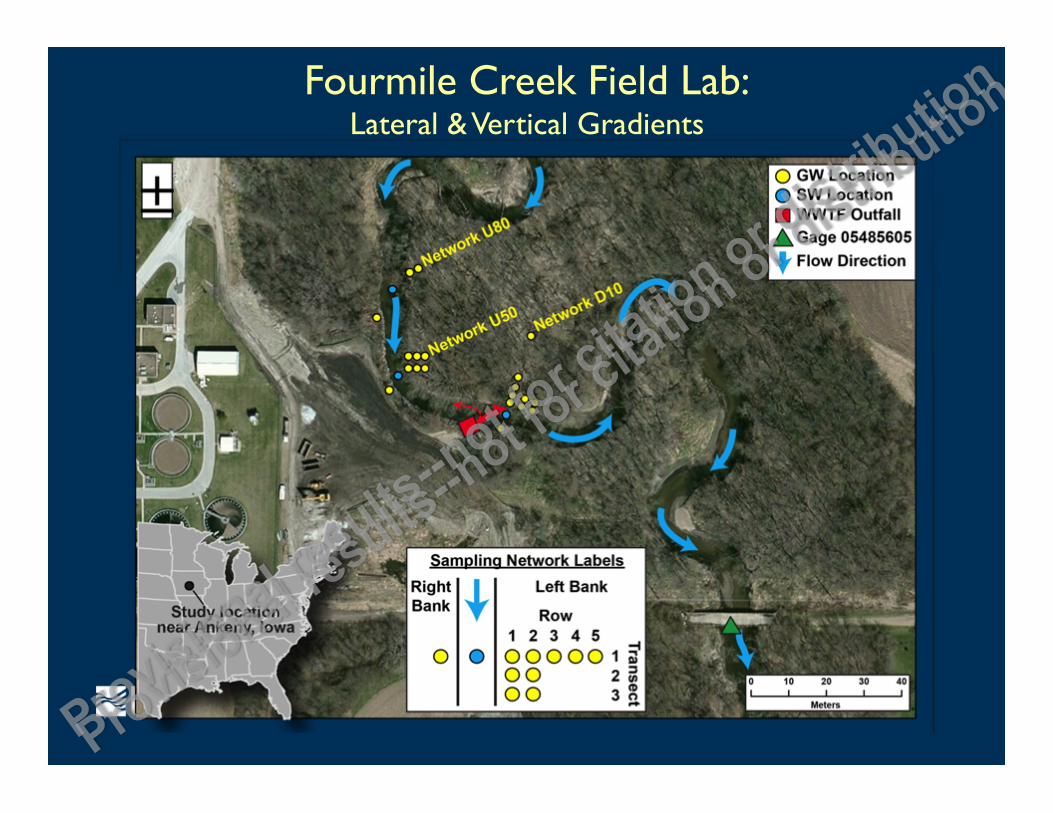
Ankeny WWTP Pre/Post-Closure Assessment: Sulfamethoxazole Longitudinal & Lateral Gradient
- Effluent source--Eddy recirculation--Lateral infiltration
Bradley et al., 2014; Bradley et al. (submitted)

Ankeny WWTP Pre-Closure Assessment: 109 Pharmaceuticals Lateral Gradient
• ~ 60% Attenuation (1 m) • 7-18 Pharms @ 20m:
• Σconc: • October = 476 ng L-1 • December = 136 ng L-1
• Analytes: • Acyclovir – anti-viral • Bupropion – anti-depressant • Caffeine – natural stimulant • Carbamazepine – anti-convulsant • Carisoprodol – muscle relaxant • Desvenlafaxine – anti-depressant • Fexofenadine – anti-histamine • Lidocaine – anesthetic • Metformin – anti-diabetic • Meprobamate – anti-anxiety • Methocarbamol – muscle relaxant • Methotrexate – cancer • Metoprolol – blood pressure • Nicotine – natural stimulant • Sulfamethoxazole – antibiotic • Temazepam – insomnia • Tramadol – analgesic • Warfarin – blood thinner
Bradley et al., 2014; Bradley et al. (submitted)

Removal in Treatment, NJ Facility
Stackelberg et al., 2004 & 2007
Raw Water
Perc
ent
Det
ecti
on
Finished Water
Pe
rcen
t D
etec
tion
Pharmaceutical/Antibiotic Flame retardant/Plasticizer Fragrance Pesticide Plant/Animal steroid Detergent metabolite PAHs Others

0
2
4
6
8
10
12
14
16
18
mepro
bamate
phen
ytoin
ateno
lol
carba
mazep
ine
gemfib
rozil
TCEP
DEETTC
PP
sulfa
methox
azole
fluox
etine
nony
lphen
ol
diaze
pam
triclos
an
bisph
enol
A
De
tect
ion
s in
18
Sa
mp
les
Benotti et al. 2008
Conducted by Southern Nevada Water Authority
Supported by AWWA Research Fnd. & WateReuse Fnd.
Pharm’s PCPs
42
19
18 18 2.1 470
93 510
3
0.82 100 0.33 1.2 25
15 Max. (ppt)
Det
ectio
ns
18 DW Facilities
CECs in Finished Drinking Water

U.S. Department of the Interior U.S. Geological Survey
Pharmaceuticals and Other Contaminants of Emerging Concern in Source and Treated Drinking Water—Results from a national study.

USGS-USEPA Interagency Project Collaborators, Contributors, and Co-Authors · Susan Glassmeyer · Edward Furlong · Dana Kolpin · Angela Batt · Bob Benson · Scott Boone · Octavia Conerly · Maura Donohue · Dawn King · Mitch Kostich · Heath Mash · Stacy Pfaller · Kathleen Schenck · Jane Ellen Simmons · Eunice Varughese · Stephen Vesper · Eric Villegas · Vickie Wilson
Acknowledgements:
· The participating drinking water treatment plants!
· NWQL Scientists: Mary Noriega, Laura Coffey (AS), Chris Kanagy (MRDP)
· Funded through IA DW14922330
· Additional project support from the USGS Toxic Substances Hydrology Program

"The best wine is the oldest, the best water the newest." —William Blake (1757-1827)
1980 USEPA survey found 20 communities (>7 million people) with drinking water source water containing 2.3-16% wastewater during average flow
(EPA-600/2-80-044)

32
• Multiyear Project (Interagency Agreement) between USGS and USEPA
• Source and treated drinking water pairs from 25 locations
• 247 chemical and microbial analytes
• Duplicate, laboratory fortified matrix (spike) and field blank collected at each location
• ~ 70% of analyses were QA/QC samples
• Bioassay for estrogenic activity
• Human health margin of exposure assessment
• Ecological margin of exposure assessment
CECs in Untreated and Treated Drinking Water

Project Sampling Design: · Paired untreated and treated water samples, collected
taking the residence time of the plant into account. · Locations sampled only once. · 249+ chemical analytes. · All samples preserved with ascorbic acid. · QC Samples: · A primary sample, replicate sample, and matrix spike sample
collected for each untreated and treated water · A field blank collected for each DWTP
S F D FC
QA/QC Samples- Organic Chemical Analyses
· Every location had 7-8 samples collected: · Primary sample for both source and treated samples
· Duplicate sample for both source and treated samples
· Laboratory Fortified Matrix (LFM aka matrix spike) for both source and treated samples
· Field Blank- 1 or 2 depending on method
· Laboratory Blank- every batch of 6-10 samples
· Laboratory Fortified Blank (LFB aka lab spike)- every batch of 6-10 samples
· Lowest Concentration Minimum Reporting Level (LCMRL)

Location Information
5
1
5
4 3 2
1 2
1
1
Number of Phase II sampling sites in each USEPA Region
0
1
2
3
4
5
6
Chlorine Chloramine Ozone + (Cl or NH2Cl)
UV + (Cl, NH2Cl or
ClO2)
Num
ber o
f DW
TPs
< 50 K 50K-500 K > 500 K
Popula'on

QA/QC Impacts to Organic Chemical Data
Performance Measure Action Number of Affected
Measurements Source Treated
Concentration less than LCMRL or RL Qualitative detection 299 159
Non-quantifiable detection Qualitative detection 9 7
Matrix spike associated with sample > 150% recovery Qualitative detection 71 41
Sample concentration does not exceed 3 × field and/or laboratory blank concentration Detection censored 244 290
Median recovery < 50% for the LFB, Source LFM and/or Treated LFM
Analyte censored (48 analytes) 15 6
LFB, Source LFM and/or Treated LFM Failure Frequency > 40% Analyte censored 0 0
RSD between all LFB, Source LFM or Treated LFM > 50% None 0 0
Qualified or censored detections 638 503 Quantified Organic Chemicals 416 294

Qualitative Frequency of Detection
37

Commonly Detected in Source Water
Pharmaceuticals sulfamethoxazole lithium carbamazepine metoprolol estrone aciclovir metformin methocarbamol meprobamate caffeine tramadol
PFCs PFOA PFBS PFOS PFHxA PFHpA PFNA PFBA PFPeA PFHxS PFDA PFUnDA
AWIs triclocarban triclosan benzotriazole methyl-1H DEET atrazine metolachlor galaxolide tri(2-butoxyethyl) phosphate tri(2-chloroethyl) phosphate
strontium barium calcium sodium sulfur magnesium silicon potassium total dissolved nitrogen fluoride nitrate aluminum zinc sulfate chloride iron manganese
phosphorus copper phosphate bromide lead uranium ammonia arsenic nitrite nickel vanadium tin
Inorganics Aspergillus fumigatus Giardia Adenovirus Aspergillus terreus
Microorganisms

Commonly Detected in Treated Water
Pharmaceuticals lithium metoprolol
PFCs PFOA PFBS PFHxA PFPeA PFOS PFHpA PFNA PFBA PFHxS PFDA PFUnDA
AWIs bromoform triclosan benzotriazole methyl-1H isophorone atrazine metolachlor tri(2-chloroethyl) phosphate
strontium barium calcium sodium sulfur magnesium silicon potassium total dissolved nitrogen fluoride nitrate aluminum zinc sulfate chloride iron manganese
phosphorus copper phosphate bromide chlorate uranium ammonia arsenic selenium nickel tin
Inorganics Microorganisms

Organic Chemical Concentration Bins
0
50
100
150
200
250
300
Qualitative 0 to 1 ng/L 1 to 10 ng/L 10 to 100 ng/L
> 100 ng/L
Num
ber o
f Det
ectio
ns
Concentration Bin
Source Treated
0
500
1000
1500
2000
2500
3000
3500
4000
4500
5000
Non-detects Concentration > 0
Num
ber o
f Mea
sure
men
ts
(n=
4825
)
Source Treated

Summed Conc. by Analyte Class

Lithiu
m (ug/L
)
Sulfam
ethox
azole
Metopro
lol
Carbam
azep
ine
Estron
e
Hydroc
hlorth
iazide
Buprop
ion
Pseud
oeph
ederi
ne
Desve
nlafax
ine
Tramad
ol
Trimeth
oprim
Caffein
e
Valsart
an
Fexofe
nadin
e
Lidoc
aine
Methoc
arbam
ol
Norvera
pamil
Venlaf
axine
Ibupro
fen
Cotinin
e
Diltiaze
m
Diltiaze
m-Des
methyl
Verapa
mil
Flucon
azole
Atenolo
l
1,7-D
imeth
ylxan
thine
Furose
mide
Meprob
amate
Ranitid
ine
Amitripty
line
Diphen
hydra
mine
Hydroc
odon
e
Sulfad
imeth
oxine
Cariso
prodo
l
Dht Oxim
ated
Testo
steron
e
Proges
teron
e
0.1
1
10
100
1,000
Con
cent
ratio
n, In
nan
ogra
ms
per l
iter
(14) (10) (8) (7) (6) (5) (5) (5) (4) (4) (4) (3) (3) (2) (2) (2) (2) (2) (2) (2) (2) (2) (1) (1) (1) (1) (1) (1) (1) (1) (1) (1) (1) (
Most Frequently Detected Pharmaceuticals: Source Water Samples

Most Frequently Detected Pharmaceuticals: Treated Water Samples
Lithium
Bupropion
Metoprolol
Carbamazepine
Cotinine
Propanolol
Pseudoephederin
e
Clofibric
Acid
Lamivu
dine
Verapamil
Norverapamil
Sulfamethoxa
zole
Diazepam
Progesterone
0.1
1
10
100
1,000
Conc
entra
tion,
In n
anog
ram
s per
liter
Pharmaceutical
(14) (3) (3) (2) (2) (2) (2) (1) (1) (1) (1) (1) (

Source vs. Treated Water—Pharmaceuticals :
Lithiu
mFe
xofen
adine
Sulfa
methox
azole
Caffe
ineVa
lsarta
nHy
droc
hlorth
iazide
Desv
enlaf
axine
Meto
prolo
lCa
rbam
azep
ineAt
enolo
lLid
ocain
eVe
nlafax
ineCo
tinine
Ibupr
ofen
Diph
enhy
dram
ineTr
imeth
oprim
Bupr
opion
Pseu
doep
hede
rine
Estro
nePr
oges
teron
eDi
azep
am
0.0
20
40
60
80
100
120
140
160
180
Conc
entra
tion,
in n
g/L,
exce
pt Li
thiu
m, in
ug/
L
DWTP 4 Source
DWTP 4 Treated

Lithiu
mFe
xofen
adine
Sulfa
methox
azole
Caffe
ineVa
lsarta
nHy
droc
hlorth
iazide
Desv
enlaf
axine
Meto
prolo
lCa
rbam
azep
ineAt
enolo
lLid
ocain
eVe
nlafax
ineCo
tinine
Ibupr
ofen
Diph
enhy
dram
ineTr
imeth
oprim
Bupr
opion
Pseu
doep
hede
rine
Estro
nePr
oges
teron
eDi
azep
am
0.1
1
10
100
200
Conc
entra
tion,
in n
g/L,
exce
pt Li
thiu
m, in
ug/
L
DWTP 4 Source
DWTP 4 Treated
Source vs. Treated Water—Pharmaceuticals:

Comparison between Source and Treated Samples:
�
�
��
�
�
�
�
�
�
�
�
�
�
�
�
�
�
�
�
��
�
�
�
�
�
0
5
10
15
20
25
30
35
40
45
50
0 5 10 15 20 25 30 35 40 45 50
Trea
ted
sam
ple
Conc
entra
tion
Source Sample Concentration
� Bupropion
� Carbamazepine
� Cotinine
� Lithium
� Metoprolol
� Norverapamil
� Progesterone
� Pseudoephederine
� Sulfamethoxazole
� Verapamil
Line of 1:1 Concentration

PFBAPFPeA
PFHxAPFHpA
PFOAPFNA
PFDA
PFUnDA
PFDoDA
PFTrDA
PFTeDA
PFHxDA
PFOcDA
PFBSPFHxS
PFOSPFDS
05
101520253035
Conc
entra
tion,
in n
g/lite
r
Perfluorochemical compound class
PFBAPFPeA
PFHxAPFHpA
PFOAPFNA
PFDA
PFUnDA
PFDoDA
PFTrDA
PFTeDA
PFHxDA
PFOcDA
PFBSPFHxS
PFOSPFDS
05
1015202530
Conc
entra
tion,
in n
g/lite
r
Perfluorochemical compound class
PFCs: Concentration Ranges by Homologue
(23) (23) (25) (24) (19) (24) (15) (8) (2) (0) (0) (0) (0) (24) (23) (22) (0)
(23) (24) (25) (23) (19) (21) (13) (4) (1) (0) (0) (0) (0) (24) (21) (20) (0)
Source Water
Treated Drinking Water
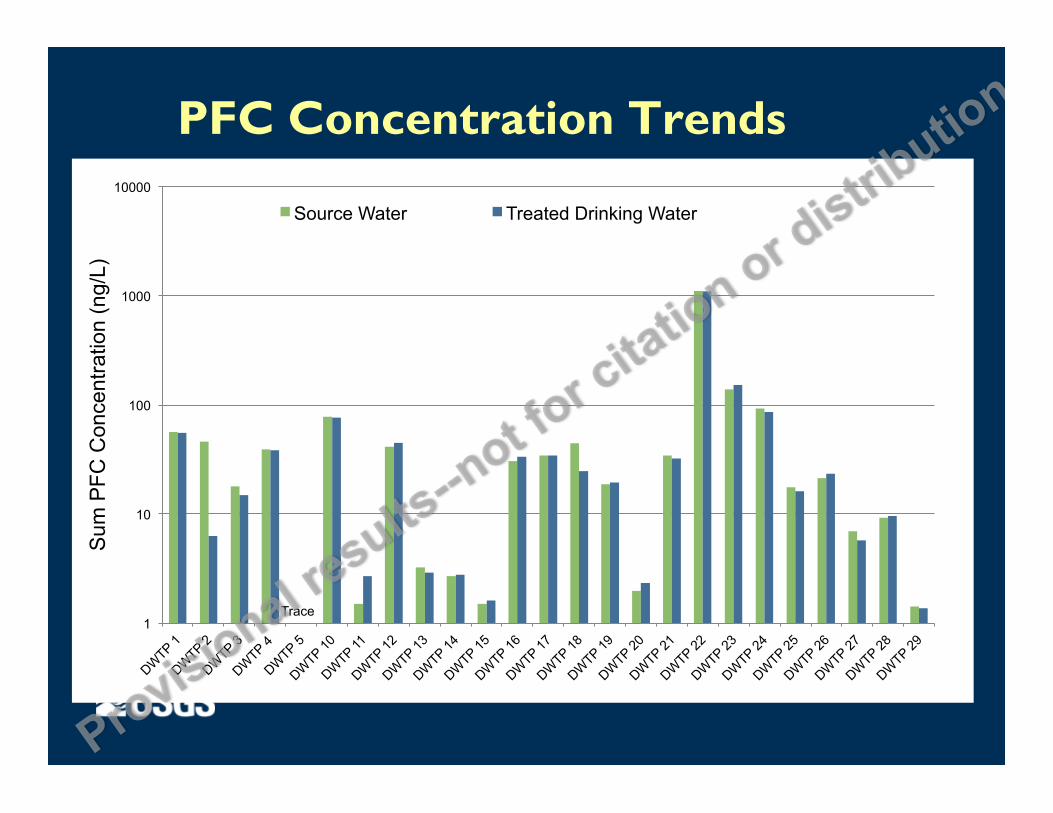
PFC Concentration Trends
1
10
100
1000
10000
Sum
PFC
Con
cent
ratio
n (n
g/L)
Source Water Treated Drinking Water
Trace
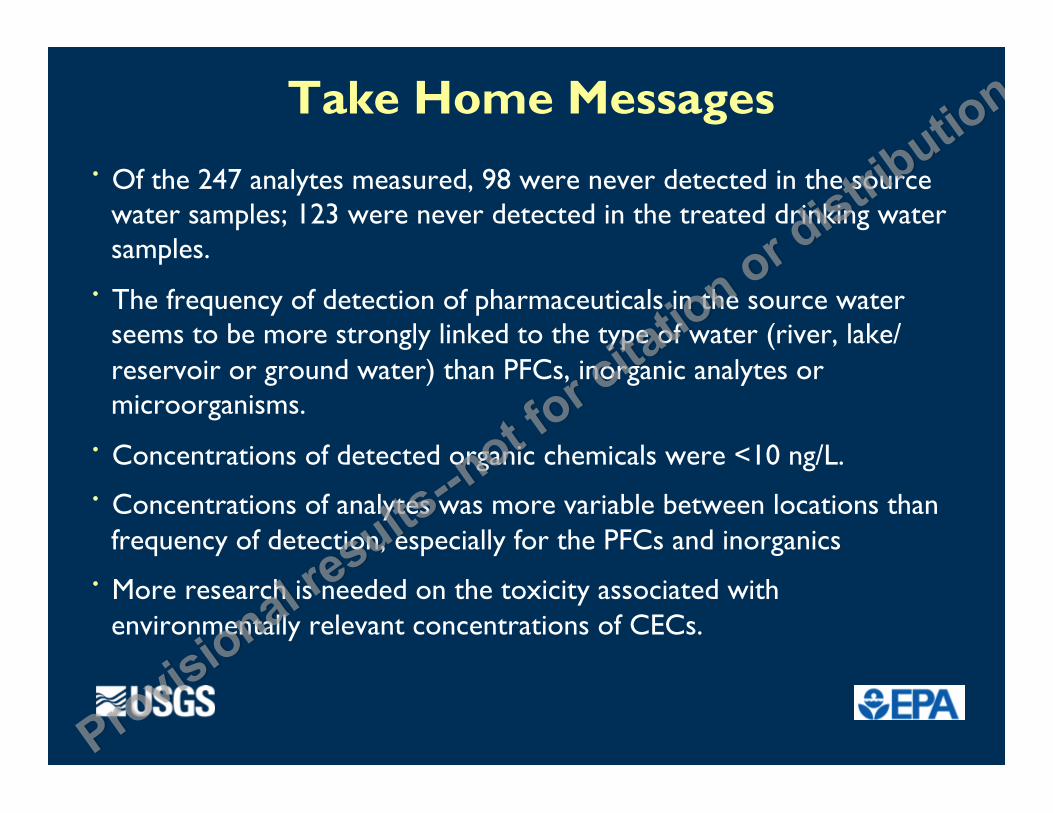
Take Home Messages
· Of the 247 analytes measured, 98 were never detected in the source water samples; 123 were never detected in the treated drinking water samples.
· The frequency of detection of pharmaceuticals in the source water seems to be more strongly linked to the type of water (river, lake/ reservoir or ground water) than PFCs, inorganic analytes or microorganisms.
· Concentrations of detected organic chemicals were <10 ng/L.
· Concentrations of analytes was more variable between locations than frequency of detection, especially for the PFCs and inorganics
· More research is needed on the toxicity associated with environmentally relevant concentrations of CECs.
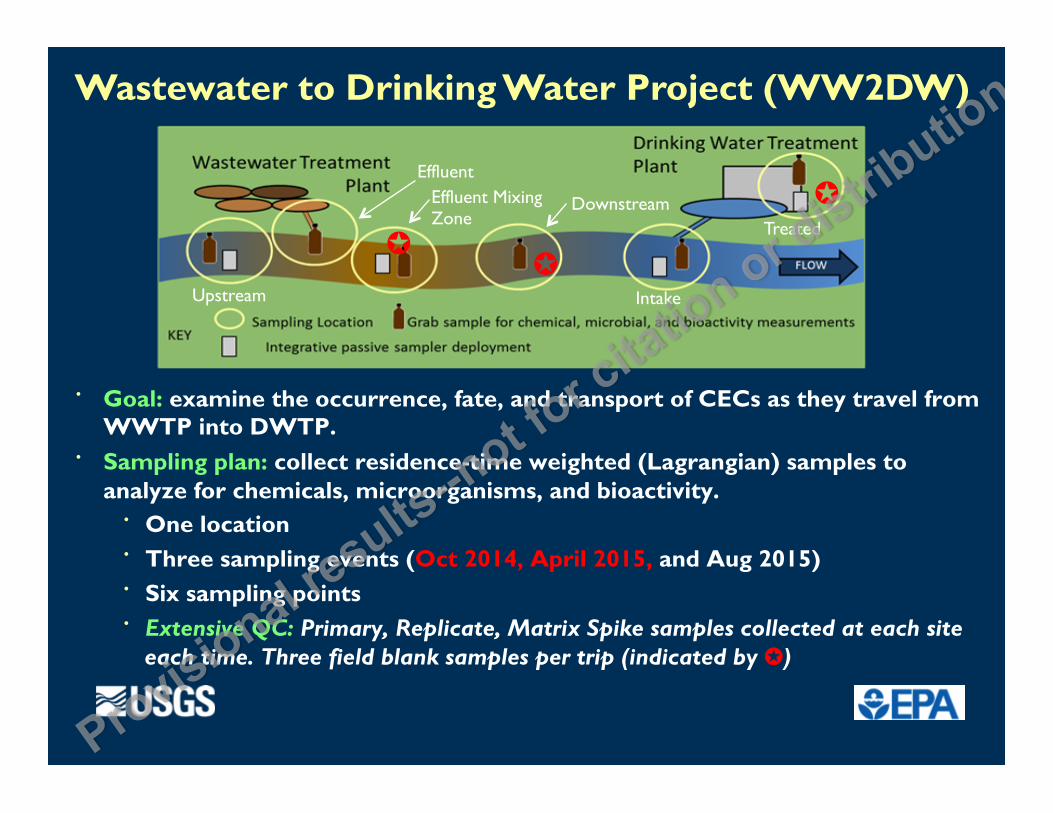
· Goal: examine the occurrence, fate, and transport of CECs as they travel from WWTP into DWTP. · Sampling plan: collect residence-time weighted (Lagrangian) samples to
analyze for chemicals, microorganisms, and bioactivity. · One location · Three sampling events (Oct 2014, April 2015, and Aug 2015) · Six sampling points · Extensive QC: Primary, Replicate, Matrix Spike samples collected at each site
each time. Three field blank samples per trip (indicated by ✪)
Upstream
Effluent Effluent Mixing Zone
Downstream
Intake
Treated
✪
✪ ✪
Wastewater to Drinking Water Project (WW2DW)

WW2DW Chemical Analytes ~200 · Pharmaceuticals · Hormones · Alkylphenols · PFCs · Sucralose · DBPs · 1,4-Dioxane · Metals and inorganics · Unknown Analysis
Bioassays: · Estrogens · Androgens · Glucocorticoids · Genotoxic Chemicals · Liver Cell Toxicology · Colonocyte Assays · Steriodogenesis · Gene Expression · Metabolite Profiling
And Microorganisms, too!!!

Summed Pharmaceutical Distribution
Ups
trea
m
Efflu
ent
Efflu
ent M
ixin
g Zo
ne
Dow
nstr
eam
Drin
king-
Wat
er In
take
Trea
ted
Drin
king W
ater
1
10
100
1,000
10,000
50,000
1
10
100
1,000
10,000
50,000
Sum
med
Pha
rmac
eutic
al C
once
ntra
tion,
in n
g/L
1035
247
3863
3
2411
9
1478
386 10
73
198
1037
153
12.1
1.31
Round 1-October 2014
Round 2-April 2015
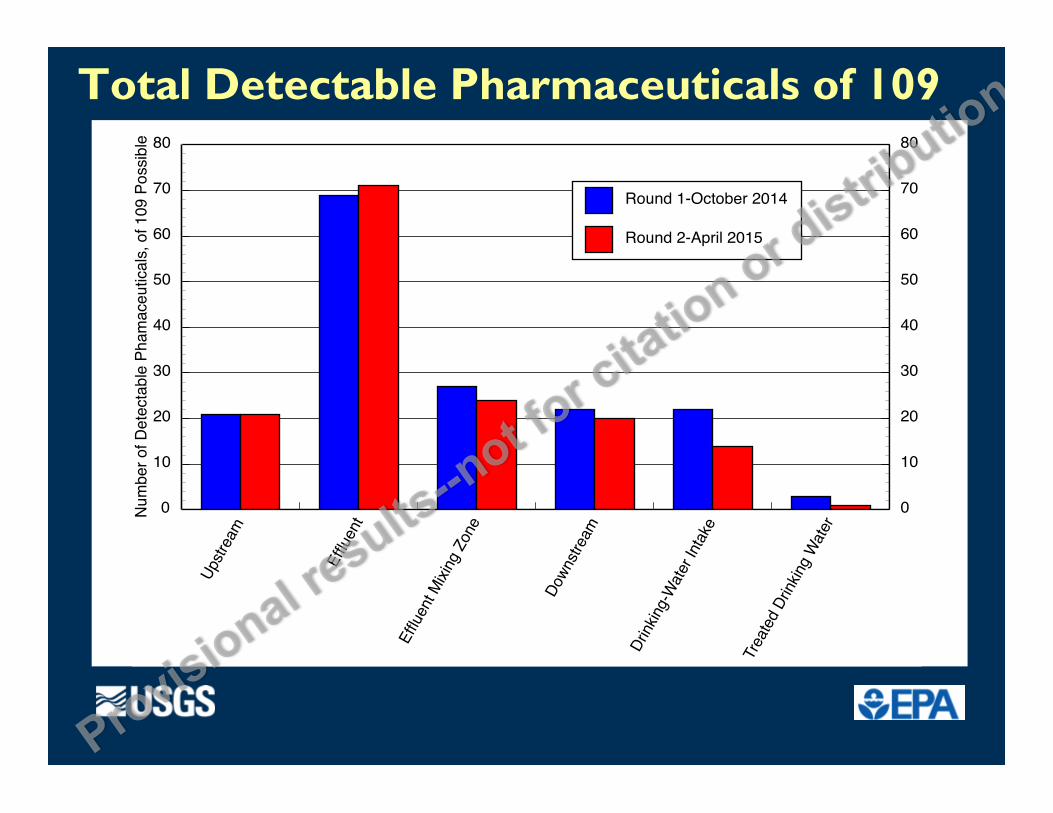
Total Detectable Pharmaceuticals of 109
Upstr
eam
Efflu
ent
Efflu
ent M
ixing
Zon
e
Down
strea
m
Drink
ing-W
ater I
ntake
Trea
ted D
rinkin
g Wate
r
0
10
20
30
40
50
60
70
80
0
10
20
30
40
50
60
70
80Nu
mbe
r of D
etec
tabl
e Ph
amac
eutic
als,
of 1
09 P
ossib
le
Round 1-October 2014
Round 2-April 2015

Roun
d 1-
Ups
trea
mRo
und
2-U
pstr
eam
Roun
d 1-
Efflu
ent
Roun
d 2-
Efflu
ent
Roun
d 1-
Efflu
ent M
ixin
g Zo
ne
Roun
d 2-
Efflu
ent M
ixin
g Zo
neRo
und
1-D
owns
trea
mRo
und
2-D
owns
trea
m
Roun
d 1-
Drin
king
Wat
er In
take
Roun
d 2-
Drin
king
wat
er In
take
Roun
d 1-
Trea
ted
Drin
king
Wat
er
Roun
d 2-
Trea
ted
Drin
king
Wat
er
-0
50
100
300
350
-0
50
100
300
350
Con
cent
ratio
n, in
nan
ogra
ms
per
liter
6.95
7 4.07
3.35
101
82.7
10.2
8.61
5.31
5.09
6.59 8.93
2.94
2.92 5.17 11.7
2.9
3.08
0.76 3.74
372
285
bupropion
cotinine

Roun
d 1-
Ups
trea
mRo
und
2-U
pstr
eam
Roun
d 1-
Efflu
ent
Roun
d 2-
Efflu
ent
Roun
d 1-
Efflu
ent M
ixin
g Zo
ne
Roun
d 2-
Efflu
ent M
ixin
g Zo
neRo
und
1-D
owns
trea
mRo
und
2-D
owns
trea
m
Roun
d 1-
Drin
king
Wat
er In
take
Roun
d 2-
Drin
king
wat
er In
take
Roun
d 1-
Trea
ted
Drin
king
Wat
er
Roun
d 2-
Trea
ted
Drin
king
Wat
er
-0
500
1,000
1,500
2,000
2,500
-0
500
1,000
1,500
2,000
2,500
Con
cent
ratio
n, in
nan
ogra
ms
per
liter
70.2
26.7
18 5.54
9435.8
24.9 10.1
63.6
23.6 11 5.44
52.5
20.8
10.8
4.27
2210
800
1390
501
desvenlafaxine
venlafaxine

Collaborators ORD/NERL · Glassmeyer · Batt · Biales · Kostich · Donohue · Pfaller · Villegas · Vesper · Lazorchak · Varughese · King · Jones-Lepp · Lindstrom · Ekman
ORD/NHEERL · Wilson · Simmons · Hartig · Villeneuve ORD/NRMRL · Mash · Mills · Schenck · Santo-Domingo
Region 8 · Benson
OW · Conerly · Sander
OSCPP · Boone
USGS · Furlong · Kolpin · Buxton · Focazio · Meyer · Hladik · Alvarez
Academia · Schultz✚
· Hoh · Gardinali
Questions?
Edward T. Furlong ([email protected])
“Mention of trade names is for illustrative purposes only and does not imply endorsement by the U.S. Geological Survey, the U.S. Environmental Protection Agency, or the United States Government.”