Embed Size (px)
Citation preview

International Journal of Information Technology and Business Management 29
th May 2015. Vol.37 No.1
© 2012- 2015 JITBM & ARF. All rights reserved
ISSN 2304-0777 www.jitbm.com
35
CONSUMERS’ INTENTION TO USE M-COMMERCE IN TOURISM INDUSTRY
1Hsio-Min Wang,
2Gereltsatsral Enkhbayar
1 Professor Hsio-Min Wang, Da-yeh University University, Taiwan
2 Gereltsatsral Enkhbayar, Business administration, MBA, Da-yeh University, Taiwan
Email : [email protected]
ABSTRACT:
The DeLone and McLean (D&M) model of Information Systems (IS) Success had been a commonly utilized and
significant model to be used to measure the organizational success in IS field.
This empirical paper evaluates the relative importance of IS success in building consumers’ intention to use mobile
commerce in tourism industry. Furthermore, this paper also acts as a platform to investigate the relationship
between DeLone and McLean model and consumers’ intention to use on mobile tourism.
The elements identified in the model are consists of service quality, information quality and system quality. To
examine the vital role of IS success in building consumers’ intention to use in mobile tourism, 274 questionnaire
surveys were distributed to customers who have experience in using mobile commerce on travel website.
In this research, descriptive statistics and inferential analysis will be conducted on the data. The managers in
tourism industry will be able to identify the key elements in IS success to achieve the organizational success by
implementing the correct and suitable IS in the development process of company’s website.
Keywords (Consumers’ intention to use, M-commerce, M-commerce in Tourism industry)
1. INTRODCUTION
The internet stands as one of the most vital
business innovations of our time. This colossal
technological development is barring unforeseen
promises of enterprise and businesses are already
using the internet to communicate with customers,
suppliers and partners, share product information,
buy and sell, and to conduct numerous daily business
functions . In addition, the internet grants a constant
reserve of new opportunities for tourism
organizations to offer new services and products that
increase the effectiveness of their business for a
lesser cost. It also improves services that cater for
tourists, such as access to information, bookings, as
well as communication and interaction between
existing service and customers. Particularly, the
rapid growth of internet users has led to the
emergence of a new enterprise called electronic
tourism or E-Tourism. In recent times,
commercialization of the Internet has driven E-
Tourism (ET) to become one of the most important
media for sharing business information within
organizations and between business partners.
E-tourism is essentially an application of
internet technology in the tourism sector.
Internet technology is particularly critical to this
sector as it adds new values in developing tourism
products and services. It also contributes to the
promotion of competitive advantages in tourism
firms. Internet technology also introduced novel
technologies such as mobile commerce (m-
commerce), which rapidly increased the use of
wireless handheld devices in accessing the internet.
The evolving success and ubiquity of mobile
communication precipitated a shift from e-
commerce (wired environment) to m- commerce
(wireless environment), whereby users of mobile
devices are now collectively considered to be the
International Journal of Information Technology and Business Management 29
th May 2015. Vol.37 No.1
© 2012- 2015 JITBM & ARF. All rights reserved
ISSN 2304-0777 www.jitbm.com
36
largest potential market. Mobile commerce (or m-
commerce) is functionally defined as distance
trading, in essence, which includes all marketing
and advertising activities as well as all buying and
selling activities using wireless handheld devices
such as smart phones. Concurrently, mobile
tourism‟s potential is on the rise owing to difficulties
in information access by tourists, and the failure of
tourism websites to meet the expectations and
aspirations of tourists.
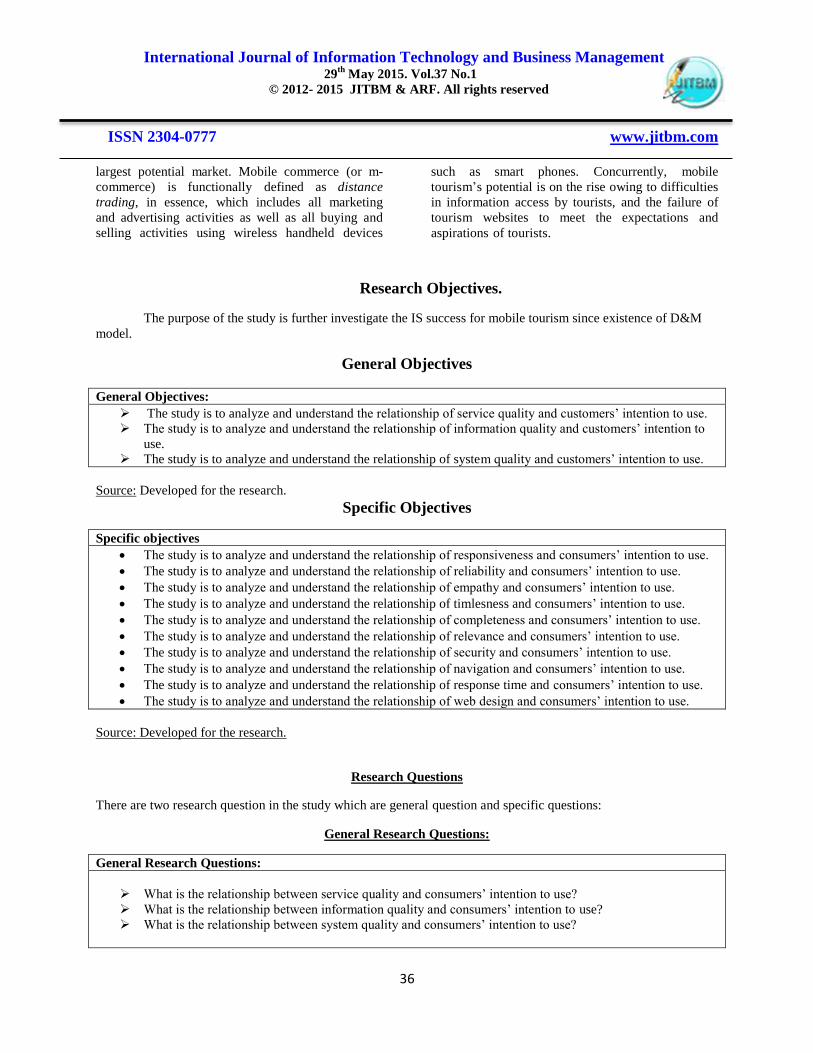
Research Objectives.
The purpose of the study is further investigate the IS success for mobile tourism since existence of D&M
model.
General Objectives
General Objectives:
The study is to analyze and understand the relationship of service quality and customers‟ intention to use.
The study is to analyze and understand the relationship of information quality and customers‟ intention to
use.
The study is to analyze and understand the relationship of system quality and customers‟ intention to use.
Source: Developed for the research.
Specific Objectives
Specific objectives
The study is to analyze and understand the relationship of responsiveness and consumers‟ intention to use.
The study is to analyze and understand the relationship of reliability and consumers‟ intention to use.
The study is to analyze and understand the relationship of empathy and consumers‟ intention to use.
The study is to analyze and understand the relationship of timlesness and consumers‟ intention to use.
The study is to analyze and understand the relationship of completeness and consumers‟ intention to use.
The study is to analyze and understand the relationship of relevance and consumers‟ intention to use.
The study is to analyze and understand the relationship of security and consumers‟ intention to use.
The study is to analyze and understand the relationship of navigation and consumers‟ intention to use.
The study is to analyze and understand the relationship of response time and consumers‟ intention to use.
The study is to analyze and understand the relationship of web design and consumers‟ intention to use.
Source: Developed for the research.
Research Questions
There are two research question in the study which are general question and specific questions:
General Research Questions:
General Research Questions:
What is the relationship between service quality and consumers‟ intention to use?
What is the relationship between information quality and consumers‟ intention to use?
What is the relationship between system quality and consumers‟ intention to use?

International Journal of Information Technology and Business Management 29
th May 2015. Vol.37 No.1
© 2012- 2015 JITBM & ARF. All rights reserved
ISSN 2304-0777 www.jitbm.com
37
Source: Developed for the research.
Specific Research Questions:
Specific research questions:
What is the relationship between responsiveness and consumers‟ intention to use?
What is the relationship between reliability and consumers‟ intention to use?
What is the relationship between empathy and consumers‟ intention to use?
What is the relationship between timeliness and consumers‟ intention to use?
What is the relationship between completeness and consumers‟ intention to use?
What is the relationship between relevance and consumers‟ intention to use?
What is the relationship between security and consumers‟ intention to use?
What is the relationship between navigation and consumers‟ intention to use?
What is the relationship between response time and consumers‟ intention to use?
What is the relationship between web design and consumers‟ intention to use?
Source: Developed for the research.
2. Literature Review.
One of the most significant and popular works on IS
success model is the D&M model developed in 1992.
Delone and Mclean (1992) stated that their model is “
an attempt to reflect the interdependent, process
nature of IS success” , intending to illustrate the IS
success concept and the considerations for the
success. It is and interactive model that
conceptualized IS success through six main
dimensions identified: system quality, information
quality, use, user satisfactions, individual impact, and
organizational impact (Delone&Mclean, 1992).
Many researchers are motivated to undertake
empirical investigations on, or develop the original
model, after called by DeLone and McLean for
validation of their model. Some Researcher focus on
the application and validation of the model ( Rai,
Lang & Welker, 2002). For instance, both system
quality and information quality are proven to have
significant relationships with user satisfaction and
individual impact on in the first validation test
conducted by Seddon and Kiew (1994).
D&M model is adapted in wide application areas to
indicate the user satisfaction and their intention to
use. It is used as research theory to identify whether
an IS success model which contributed bu
information system, and service quality effect the
user satisfaction and their intention to use. Many
researchers have used this model evaluate the field of
success in e-larning (Hosapple & Lee-Post, 2006),
online learning system (Lin, 2007), Knowledge
management system (Wu & Wang, 2006), Business –
to-Consumer (B2C) e-commerce (Delone &Mclean,
2003: Molla & Licker, 2001) and even m-commerce
(Toloie-Eshlaghy & Bayanati, 2012).
In this research, there are total four concepts in D&M
model can applied to identify the importance of IS
success in building consumers‟ intention to use on
tourism industry. Three concepts as independent
variable which are system quality, information
quality, and service quality are tested based on their
relationship with a dependent variable, user purchase
intention. The dimension for system quality
navigation (Molla & Licker, 2001), response time
(Delone and Mclean, 1992) and web design (Delone
&Mclean, 2003). The dimensions for information
quality are timeliness, completeness, relevance
(Delone &Mclean, 2003) and security. The
dimensions for service quality are responsiveness,
reliability (Parasuraman et al.1988), empathy and
follow up service (Liu & Arnet, 2000).

International Journal of Information Technology and Business Management 29
th May 2015. Vol.37 No.1
© 2012- 2015 JITBM & ARF. All rights reserved
ISSN 2304-0777 www.jitbm.com
38
Proposed Conceptual Framework / Research Model
Figure 2.5: Research Model Showing the Relationship of Information System Success and Consumers‟ Intention to
Use.
Adopted from: Wang & Pho (2009), Wen (2009), Chuang & Fan (2011), Lin (2007) and Elliot, Li
& Choi (2012)
3. Research Methodology
When conducting a research, one must
choose a research method between qualitative and
quantitative research. Qualitative research is often
seen as somewhat easier because it measures the
quality of something rather than its quantity.
It is reflective and experiential in nature.
Other characteristics of qualitative research are that it
usually has a small sample size and data collection
may be done using interviews or group discussions.
Because of the small sample size and the
unstructured techniques, the findings are not
conclusive and the conductor of the research has to
refrain from making any generalizations about the
population in question (Davies 2007).
Quantitative research uses mathematical
theories and statistics. The sample is bigger and data
collection may be done using a questionnaire. Unlike
with qualitative research, the findings in quantitative
research are conclusive to a specifiable probability
Info
rmati
on
syst
em S
ucce
ss
Service quality
Responsiveness
Reliability
Empathy
Information quality
Timeliness
Completeness
Relevance
Consumers’
Intention to use
System quality
Navigation
Response Time
Web Design

International Journal of Information Technology and Business Management 29
th May 2015. Vol.37 No.1
© 2012- 2015 JITBM & ARF. All rights reserved
ISSN 2304-0777 www.jitbm.com
39
(Davies 2007). The aim of quantitative research is to
determine the relationship between an independent
variable and a dependent or outcome variable in a
population (Hopkins, 2000).
The main method of data collection was the
quantitative survey. It consisted of a series of fixed
questions regarding respondents‟ background and
statements to which respondents were asked to
answer on the Likert scale depending on if they
agreed or disagreed.
Second hand information was retrieved from
various sources such as books, websites, online
magazines and relevant blogs. All information
sources are listed at the end of this thesis.
Primary data will collect from online
questionnaire.Tailored questionnaires will distribute
through the Internet to target respondents.
Constructs Measurement
Refer to Appendix 2.1 for the sources of the variables in Table 3.1.
Table 3.1: Measurement of Each Variable
Variables Measurement Scale of
Measurement
Demographic
profile
Gender Nominal -
Age Ordinal -
Marital status Nominal -
Highest education
completed
Ordinal -
Occupation Nominal -
Have you
travel before
Nominal -
Have you use mobile
commerce
before
Nominal -
Information
System Success
Responsiveness Interval 7-point Likert scale
Reliability Interval 7-point Likert scale
Empathy Interval 7-point Likert scale
Timeliness Interval 7-point Likert scale
Completeness Interval 7-point Likert scale
Relevance Interval 7-point Likert scale
Security Interval 7-point Likert scale
Navigation Interval 7-point Likert scale
Response time Interval 7-point Likert scale
Web-design Interval 7-point Likert scale
Consumers’
Intention to Use
Consumers‟ intention
to use
Interval
7-point Likert scale
Source: Developed for the research

International Journal of Information Technology and Business Management 29
th May 2015. Vol.37 No.1
© 2012- 2015 JITBM & ARF. All rights reserved
ISSN 2304-0777 www.jitbm.com
40
4. Data Analysis
Demographic Profile of the Respondents
Table 4.1: Survey Respondents‟ Demographic Profile and Information
N=274
Profile Categories Frequency Percentage
Gender Female
Male
99
175
36%
64%
Age Below 25 years
26 years-30 years
31 years-35 years
36 years and above
71
145
31
27
26%
53.2%
11.3%
9.9%
Marital Status Single
Married 189
85
69%
31%
Highest Education
Completed
Diploma
Bachelor Degree
Master Degree
PhD
Other
0
27
49
12
186
0%
9.9%
18%
4.4%
68%
Occupation
Student
Housewife
Employed
Unemployed
Other
88
3
154
4
25
32%
1.0%
56%
1.4%
9.1%
Have you ever travel
before?
Yes
No 100 100%
Have you ever use Mobile
commerce before?
Yes
No
100 100%
Source: Developed for the research
Table 4.1 presents the survey respondents‟
demographic information. Other than questions
regarding on the experience of travelling and using
mobile commerce, it also include gender, age, marital
status, highest education completed as well as
occupation of respondents. Out of total 274
respondents, there are 175 of male respondents and
99 of female respondents.
As for age range, the age of majority of respondents
amounting to 145 are respondent‟s age falls down 26
to 30 years old, below 25 years is 71. The age of the
rest 31 and 27 respondents is between 31 to 35 years
old and 36 years old and above respectively.
Marital statuses of 189 respondents are single and 85
respondents are married. The results of the survey
showed that there are half of the respondents holding
Other and 49 respondents holding Master Degree.
Moreover, the table also demonstrated that majority
of respondents which is 154 are employed while 88
respondents are students. There are only 3
respondents are housewife, followed by 4
unemployed respondents, and 25 other respondents.
5. Descriptive Statistic on Key
Variables
The table below shows the minimum,
maximum mean and standard deviation among items
in section II perception of service quality, section III
– Information Quality, section IV- System quality,
and section V Consumers‟ intention to use.

International Journal of Information Technology and Business Management 29
th May 2015. Vol.37 No.1
© 2012- 2015 JITBM & ARF. All rights reserved
ISSN 2304-0777 www.jitbm.com
41
The above table shows the mean and
standard deviation among variables. A broad picture
on the variables score- all variables scored higher
than neutral point of „4‟ in all table. The higher the
score indicates that respondents have more positive
ratings towards all the service quality, information
quality and system quality, and consumers‟ intention
to use.
Summarized result of Mean and Standard Deviation.
Summarized result of Mean and
Standard Deviation.
Mean Standard Deviation
Service Quality
Responsiveness 4.2847 – 4.5146 1.41136- 1.56477
Reliability 4.1752 – 4.5438 1.41130-1.61916
Empathy 4.3540 – 4.5547 1.30262-1.47589
Information Quality
Timeliness 4.2664 – 4.5766 1.35641-1.43931
Completeness 4.2956 – 4.3942 1.36621-1.50874
Relevance 4.3139 – 4.5657 1.28392-1.42068
Security 4.3723 – 4.5657 1.24229-1.34618
System Quality
Navigation 4.4161 – 4.5693 1.22427-1.34242
Response time 4.2847 – 4.6569 1.41136-1.56246
Web Design 4.1715– 4.5511 1.16251-1.62592
Consumers’ intention to use 4.3504 – 4.5584 1.30262-1.50153
Table 5.12 Summarized result of Mean and Standard Deviation.
Mean and standard deviation results were conducted
by using SPSS 20 Statistics. The results are presented
as Table 9 where the mean‟s range for each of the
results is listed as follows: responsiveness (4.2847 –
4.5146), reliability (4.1752 – 4.5438), empathy
(4.3540 – 4.5547), timeliness (4.2664 – 4.5766),
completeness (4.2956 – 4.3942), relevance (4.3139 –
4.5657), security (4.3723 – 4.5657), navigation
(4.4161 – 4.5693), response time (4.2847 – 4.6569),
web design (4.1715– 4.5511), and consumers'
intention to use (4.3504 – 4.5584).
The results of standard deviation for all the variables
are between the ranges of 1.16251 to 1.61916. The
lowest standard deviation value is the variable of
Web -Design (WD 1) while the highest standard
deviation value is Web Design (WD 2). Both of the
variables are sub-variables in System quality.
6. Reliability test
Reliability test was then used to test the reliability
and level of consistency among items of each
variable. When the Cronbach‟s alpha is greater than
0.70, it implies the tested items are highly consistent
within a variable, thereby such variable is reliable to
use for further analysis. Scaled items within a
variable were tested for its consistently. 11 test on
reliability were conducted as a result for the eleven
variables.

International Journal of Information Technology and Business Management 29
th May 2015. Vol.37 No.1
© 2012- 2015 JITBM & ARF. All rights reserved
ISSN 2304-0777 www.jitbm.com
42
Summarized result of Reliability test;
Below is the summary of all reliability test on respondent‟s service quality, Information quality, and system quality
and Consumers‟ intention to use.
Dimension Cronbach’s alpha No of Items
Service quality Responsiveness 0.726 4
Reliability .684 4
Empathy .783 4
Information
Quality
Timeliness .712 4
Completeness .745 4
Relevance .697 4
Security .763 4
System Quality Navigation .786 4
Response Time .724 4
Web Design .678 4
Consumers’ intention to use. .781
“Cronbach‟s alpha > .700 = highly consistent”
Table 7. Summarized result of Reliability test.
All eleven dependent variables- Service quality (
Responsiveness, Empathy) and Information Quality
( Timeliness, Completeness, Security), and System
Quality( Navigation, Response time) have reached
an acceptable value of Cronbach‟s alpha above 0.70,
which means a good estimate of internal consistency
reliability.
The service quality, and information quality and
System Quality, those have proven a high reliability.
Since the Cronbach‟s alpha value for Navigation
(System Quality) is 0.786, it has reached a highly
acceptable value. Thus all variables under this study
have achieved high reliability.
7. Liner Regression Analysis.
Summarized result of Coefficientsa
Model
Unstandardized Coefficients
Standardized
Coefficients
t-value
Sig.
Decision
B value Std. Error Beta
RP 0.000 .003 .000 -.152 .879 Not Supported
RL -.003 .004 -.003 -.807 .420 Not Supported
EM 997 .003 1.001 340.793 0.000 Supported
TL .232 .061 .232 3.815 .000 Supported
CP .335 .071 .326 4.729 .000 Supported

International Journal of Information Technology and Business Management 29
th May 2015. Vol.37 No.1
© 2012- 2015 JITBM & ARF. All rights reserved
ISSN 2304-0777 www.jitbm.com
43
RV .076 .086 .067 .876 .382 Not Supported
SC .199 .068 .196 2.924 .004 Supported
NV .268 .071 .243 3.751 .000 Supported
RT .237 .061 .239 3.869 .000 Supported
WD .327 .076 .297 4.307 .000 Supported
a. Depended Variable: IU Table 15. Summarized result all of Coefficients
Number
Hypothesis Sig Result
H1 There is not a positive relation between Service Quality and Consumer’s intention to use.
H1a:
There is not a positive
relation between
Responsiveness and
Consumers’ intention to
use.
0.879
Not Supported
H1b:
There is not a positive
relation between
Reliability and
Consumers’ intention to
use.
0.420
Not Supported
H1c:
There is a positive
relation between
Empathy and
Consumers’ intention to
use.
0.000
Supported
H2 There is a positive relation between Information Quality and Consumer’s intention to use.
H2a:
There is a positive
relation between
Timeliness and
Consumers’ intention
to use.
0.000
Supported
H2b:
There is a positive
relation between
Completeness and
Consumers’ intention
to use.
0.000
Supported
H2c:
There is not a positive
relation between
Relevance and
Consumers’ intention
to use.
0.382
Not Supported

International Journal of Information Technology and Business Management 29
th May 2015. Vol.37 No.1
© 2012- 2015 JITBM & ARF. All rights reserved
ISSN 2304-0777 www.jitbm.com
44
H2d:
There is not a positive
relation between
Security and
Consumers’ intention
to use.
0.004
Supported
H3 There is a positive relation between System Quality and Consumer’s intention to use.
H3a:
There is a positive
relation between
Navigation and
Consumers’ intention
to use.
0.000
Supported
H3b:
There is a positive
relation between
Response time and
Consumers’ intention
to use.
0.000
Supported
H3c:
There is a positive
relation between Web
Design and Consumer’s
intention to use.
0.000
Supported
8. Introduction
In Chapter 4, demographic profile of target
respondents and results of the data analysis are
interpreted in value. In this chapter, it is to provide a
major summary on all the statistical analysis as well
as discussion on the hypothesis. Limitation and
recommendation for future research would also be
explained in this chapter.
9. Summary of Statistical Analysis
For demographic profiles of 274
respondents, male and female respondents are held
64%% and 36% respectively. Majority of the
respondents belong to the age group of 26 years - 30
years old (53.2%) and they are commonly single
(69%) and that majority of respondents which is 56%
are employed, either in Other (68%) or Master
Degree (18%). Besides, all respondents in this survey
have experienced in travelling and have used mobile
commerce.
The results conducted by using SPSS 20 Statistics
have revealed that the mean for all variables are
between ranges of 4.1715 to 4.6569 while the
standard deviations for all variables are below
1.6000.
Throughout the Multiple Regression
analysis, there are six independent variables which
are Empathy, Completeness, Security and
Navigation, and Response time and Wed design
significantly affecting the customers‟ intention to use
mobile commerce in tourism industry. In general, two
out of three main independent variables which refer
to information quality and system quality have
significantly affecting the customers‟ intention to use
mobile commerce.
In general, two out of three main independent
variables which refer to information quality and
system quality have significantly affecting the
consumers‟ intention to use mobile commerce.
10. Discussions of Major Findings
In this study, there are three main
independent variables which are service quality,
information quality and system quality. The variables
are tested on the relationship with the dependent
variable which is customers‟ intention to use mobile
commerce in tourism industry. Service quality is

International Journal of Information Technology and Business Management 29
th May 2015. Vol.37 No.1
© 2012- 2015 JITBM & ARF. All rights reserved
ISSN 2304-0777 www.jitbm.com
45
consisting of sub independent variables such as
responsiveness, reliability, and empathy. Information
quality is consisting of timeliness, completeness,
relevance, and security while system quality is
consisting of navigation, response time and web
design.
Meanwhile for significant relationship of information
quality, Lin (2007) had stated where high-quality
information will fulfil the customer‟s needs enables
customers to reduce the costs of information
searching and processing. Several past studies also
indicate positive correlation between the qualities
(information and system) and customers‟ intention to
use which are Kim et al., 2012; Wang & Pho, 2009
and Pai & Huang, 2011.
As for the sub independent variables, three
variables are significantly affecting the consumers‟
intention to use mobile commerce in tourism industry
which are Empathy (p = 0.0169), Timeliness
(p=0.000) Completeness (p = 0.1614) Security
(p=0.004) and Navigation (p = 0.001) Response time
(p=0.000), Web design (p=0.000). Navigation,
Response time, Web design of system quality are
significantly affect the consumers‟ intention as it tend
to be one of the credible factors which present the
competence and expertise of websites (Chuang &
Fan, 2011).
Past study such as Wang and Pho (2009) had
also stated Timeliness, Completeness and Security of
information quality are among the variables which
significantly affect consumers‟ intention to use
mobile commerce. The finding may be implied where
Timeliness and Completeness, information are
preferable for Mongolian consumer on visiting the
websites as it is not timely. Security in the
information quality is also one of the variables which
significantly affect the consumers‟ intention as
employing secure modes for online transactions tend
to helps increase the levels of customer satisfaction,
which resulting in increased customer retention
(Lin,2007).
11. Implications of the Study
and Managerial Implications
In this study, the result showed that two
main independent variables instead of three main
independent variables are significantly affecting the
consumers‟ intention to use mobile commerce in
tourism industry. The two main independent
variables are information quality and system quality
which have significant effect on the consumers‟
intention to use in mobile commerce. Information
quality components consist of four variables but
Timeliness, Completeness and Security have
significant relationship with the consumers‟ intention
to use. For system quality, it consists of three
variables, however, there are all Navigation and
Response time, and Web design have significant
relationship with consumers‟ intention to use.
The analysis result in Multiple Linear
Regression showing that there is significant positive
relationship between information security and
consumers‟ intention to use mobile commerce
dealing with travelling. This shows that the
customers do take into account of the security of their
personal information provided in the travel website.
Consumers‟ intention to use mobile commerce might
fade if they feel insecure or lack of confidence
towards the travel‟s website security system. Thus,
the website should establish adequate security
features to effectively safeguard customers‟ private
and confidential information. Indeed, consumers‟
information should be well protected from the
unauthorization of third parties. For example, travel
website should partner with VeriSign to protect
information privacy by encrypting that information
into human unreadable form.
Based on the results generated, the variables
of Timeliness, Completeness and Security have a
significant positive relationship with the consumers‟
intention to use. It can be suggested that Timeliness,
Completeness and Security are three of the
component which may add value towards the
information system of a company‟s website. As
variable of relevance refers to the content and
information of a website, customers would prefer
understandable, meaningful and logical information
provided to them. By focusing on the content and
information of a website, visitation of customers on
the website of a company may increase. The travel
website should avoid or eliminate in providing
irrelevant and repetitive information.
The other hypothesis assuming that there are
significant positive relationship between Navigation,
Response time and Web design of travel website and
consumers‟ intention to use have been proven. This
reflects that customers pay more attention on the

International Journal of Information Technology and Business Management 29
th May 2015. Vol.37 No.1
© 2012- 2015 JITBM & ARF. All rights reserved
ISSN 2304-0777 www.jitbm.com
46
website‟s response and transaction processing speed.
Travel companies should have their own IT admins
for the maintenance services for the webpage‟s
network server. This may boost the response of
website and allow smooth information processing
even under the heavy web traffic situation.
Customers will then not feel frustrate when they are
browsing the travel website.
12. Limitations and
Recommendations of the Study Due to the constraint of financial resources
and time available, the researchers were restricted to
cover wider research area. The research survey has
only been took by capital city of Mongolia
respondents. The future researchers should conduct
the research in whole Mongolia in order to have
clearer and more accurate indication in analyzing the
consumers‟ intention to use entirely. Other than
mainly focus in Mongolia tourism‟s website, future
researchers could be conducted in different country
as the result might be slightly different if this study is
performed in other countries.
In addition, this study is only tested three or
four sub-variables under each independent variable.
As this study did not incorporate the complete
information system success variables into the
proposed research model, it might cause the result to
be less reliable and does not significantly affect the
dependent variable. Hence, future researcher could be
perform further testing by including more sub-
variables under the complete information system
success variables to obtain a more reliable results.
Apart from that, the time horizon of this
study employed cross-sectional approach, which only
provided the snapshot of respondents‟ characteristics
confined to specific point of time. Since one‟s
characteristic would change as time passed by,
longitudinal approach which measures individual and
same variables repetitively to reflect the actual
situation is more suitable. In future studies, the
researchers should conduct the pre-exposed and post-
exposed survey in the longitudinal time horizon to
test out an individual intention to use m-commerce in
tourism industry before and after he or she
experienced the m-commerce in tourism industry.
Besides, the target respondents of this study
are lack of awareness as we do not know whether
they understand the questionnaire or not. Therefore in
future studies, researchers could try to choose two or
more target respondents and interview with them.
The questionnaires can be translated into more types
of languages such as Mongolia, and English to
enhance respondents‟ comprehensive ability when
answering the questionnaires.
Moreover, the result of survey questionnaire
showed biases in this study. The result showed that
the target respondents almost answer the
questionnaire in “agree” or “mostly agree”. Thus,
future researchers should try to include positive and
negative question structure in the survey
questionnaires in order to eliminate the target
respondents‟ biases.
13. Conclusion This study proves that information quality
and system quality are among the variables which
have significant and positive relationship with
customers‟ intention to use mobile commerce in
tourism industry. Although service quality has a
positive relationship with consumers‟ intention to use
but the relationship is not significant. This study also
concludes that system quality is the strongest
determinant of information system success for
consumers‟ intention to use among all the
Independent Variables.
References
1. Ahn, T., Ryu, S., & Han, I. (2004). The impact of
the online and offline features on the user
acceptance of internet shopping malls. Electronic
Commerce Research and Applications, 3, 405
420.
2. Ahn, T., Ryu, S., & Han, I. (2007). The impact of
web quality and playfulness on user acceptance
of online retailing. Information & Management,
44, 263-275.
3. Ajzen, I., & Fishbein, M. (1980). Understanding
attitudes and predicting social behavior.
Englewood Cliffs, NJ: Prentice-Hall.
4. Bae, H. (2012). The Influencing Factors of
Logistics Integration and Customer Service
Performance for Value Creation of Port Logistics
Firms. The Asian Journal of Shipping and
Logistics, 28 (3), 345-368.
5. Baroudi, J. J., Olson, M. H., & Ives, P. (1986).
An Empirical Study of the Impact of User

International Journal of Information Technology and Business Management 29
th May 2015. Vol.37 No.1
© 2012- 2015 JITBM & ARF. All rights reserved
ISSN 2304-0777 www.jitbm.com
47
Involvement on System Usage and Information
Satisfaction. Communications of the ACM, 29
(3), 232-238.
6. Bassiono, H. A., Hassan, T. M., & Price, A. D. F.
(2008). Evaluation and analysis of criteria and
sub-criteria of a construction excellence model.
Engineering, Construction and Architectural
Management, 15 (1), 21-41.
7. Brown, B., & Chalmers, M. (2003). Tourism and
mobile technology. In Proceedings of the eighth
European conference on computer supported
cooperative work. Helsinki, Finland: Kluwer
Academic Press.
8. Brown, I., & Jayakody, R. (2008). B2C e-
commerce success: A test and validation of a
revised conceptual model. The Electronic Journal
Information Systems Evaluation, 11 (3), 167-184.
9. Chen, H. J., & Kao, C. H. (2012). Empirical
validation of the importance of employees‟
learning motivation for workplace e-learning in
Taiwanese organizations. Australasian Journal of
Educational Technology, 28 (4), 580-598.
10. Chuang, H. M., & Fan, C. J. (2011). The
mediating role of trust in the relationship between
e-retailer quality and customer intention of online
shopping. African Journal of Business
Management, 5(22), 9522-9529.
11. Čisar, P. & Čisar, S. M. (2010). Skewness and
Kurtosis in Function of Selection of Network
Traffic Distribution. Acta Polytechnica
Hungarica, 7 (2), 95- 106.
12. Clemens, B., Cata, T., & Hackbarth, G. (2012).
Mobile device considerations for supply chain
and ERP. Communications of the IBIMA, 2012,
78.
13. Corigliano, M. A., & Baggio, R. (2004). Mobile
technologies diffusion in tourism: modeling a
critical mass of adopters in Italy. In Proceedings
of the 11th International Conference on
Information Technology and Travel and Tourism,
Cairo, Egypt, 16-26.
14. Coursaris, C., & Hassanein, K. (2002).
Understanding m-commerce. Quarterly Journal
of Electronic Commerce, 3(3), 247-271.
15. Cronin, J. J., Brady, M., & Hult, G. T. M. (2000).
Assessing the effects of quality, value and
customer satisfaction on consumer behavioral
intentions in service environments. Journal of
Retailing, 76(2), 193–218.
16. DeLone, W. H., & McLean, E. R. (1992).
Information systems success: The quest for the
dependent variable. Information Systems
Research, 3(1), 60-95.
17. DeLone, W. H., & McLean, E. R. (2003). The
DeLone and McLean model of information
systems success: A ten year update. Journal of
Management Information Systems, 19(4), 9-30.
18. DeLone, W. H., & McLean, E. R. (2004).
Measuring e-commerce success: Applying the
DeLone & McLean information systems success
model. International Journal of Electronic
Commerce, 9(1), 31-47.
19. Devaraj, S., & Kohli, R. (2003). Performance
Impacts of Information Technology: Is Actual
Usage the Missing Link. Management Science,
49 (3), 273-289.
20. DeVellis, R. F. (2003). Scale development:
Theory and applications (2nd ed.). Thousand
Oaks, CA: Sage Publications.
21. Elliot, S., Li, G., & Choi, C. (2012).
Understanding service quality in a virtual travel
community environment.Journal of Business
Research.
22. Fassnacht, M., & Koese, I. (2006). Quality of
electronic services: Conceptualizing and testing a
hierarchical model. Journal of Service Research,
9(1), 19-37.
23. Fugen, C., Westphal, M., Schneider, M., Schultz,
T., & Waibel, A. (2001). LingWear: A mobile
tourist information system. In Proceedings of the
Human Language Technology Conference (HLT),
San Diego, California, March. NIST.
24. Gartner. (2012). Gartner says worldwide it
spending to grow 3.7 percent in 2012. Retrieved
January 5, 2012, from
http://www.gartner.com/it/page.jsp?id=1888514
25. Garrity, E. J., & Sanders, G. L. (1998).
Dimensions of information systems success.
Information Systems Success Measurement, 1,
13-45.
26. Gelderman, M. (1998). The Relation between
User Satisfaction, Usage of Information Systems

International Journal of Information Technology and Business Management 29
th May 2015. Vol.37 No.1
© 2012- 2015 JITBM & ARF. All rights reserved
ISSN 2304-0777 www.jitbm.com
48
and Performance. Information & management, 34
(1), 11-18.
27. Grandon, E., & Pearson, J. (2004). Electronic
commerce adoption: An empirical study of small
and medium US businesses. Information &
Management, 42, 197-216.
28. Hair, J. F., Anderson, R. E., Tatham, R. L., &
Black, W. C. (1998). Multivariate data analysis
(5th ed.). Englewood Cliffs, NJ: Prentice Hall.
29. Hair, J. F., Black, W. C., Babin, B. J., Anderson,
R. E., & Tatham, R. L. (2006). Multivariate data
analysis (6th ed.). New Jersey: Pearson
Education International.
30. Hair, Jr., J.F., Black, W.C., Babin, B.J., and
Anderson, R.E. (2010). Multivariate Data
Analysis with Readings. Upper Saddle River,
New Jersey, USA: Prentice Hall.
31. Hoffmann, J. P. (2010). Linear Regression
Analysis: Applications and Assumptions 2nd ed.
America: Brigham Young University.
32. Holsapple, C. W., & Lee-Post, A. (2006).
Defining, assessing, and promoting e-learning
success: an information systems perspective.
Decision Sciences Journal of Innovative
Education, 4(1), 67-85.
33. Jeong, M., Oh, H., & Gregoire, M. (2003).
Conceptualizing web site quality and its
consequences in the lodging industry.
International Journal of Hospitality
Management, 22(2), 161-175.
34. Jiang, J., & Klein, G. (1999). Risk to different
aspects of system success. Information and
Management, 36 (5), 263-271.
35. Kim, C., Galliers, R. D., Shin, N., Ryoo, J. H., &
Kim, J. (2012). Factors influencing internet
shopping value and customer repurchase
intention. Electronic Commerce Research and
Applications, 11(4), 374-387.
36. Keen, P., & Mackintosh, R. (2001). The freedom
economy: Gaining the mcommerce edge in the
era of the wireless internet. Berkeley, CA:
Osborne/McGraw-Hill.
37. Kelly, K., Clark, B., Brown, V., & Sitzia, J.
(2003). Good practice in the conduct and
reporting of survey research. International
Journal for Quality in Health Care, 15(3), 261-
266.
38. Kolter, P. (2000). Marketing Management,
International Edition. Prentice-Hall, Englewood
Cliffs, NJ.
39. Kline, R. B. (2005). Principle and practice of
structural equation modeling. New York:
Guilford.
40. Kuan, H. H., Bock, G. W., & Vathanophas, V.
(2008). Comparing the effects of website quality
on customer initial purchase and continued
purchase at ecommerce websites. Behaviour &
Information Technology, 27, 3-16.
41. Kumar, S., & Zahn, C. (2003). Mobile
communications: Evolution and impact on
business operations. Technovation, 23(6), 515-
520.
42. Landrum, H., Prybutok, V., Zhang, X., & Peak,
D. (2009). Measuring IS system service quality
with SERVQUAL: Users‟ perceptions of relative
importance of the five SERVPERF dimensions.
The International Journal of an Emerging
Transdiscipline, 12, 17-35.
43. Law, C., & Ngai, E. (2007). Erp Systems
Adoption: An Exploratory Study of the
Organizational Factors and Impacts of Erp
Success. Information & Management, 44 (4),
418-432.
44. Leclercq, A. (2007). The Perceptual Evaluation
of Information Systems Using the Construct of
User Satisfaction: Case Study of Large French
Group. ACM SIGMIS Database, 38 (2), 60.
45. Lee, K. C., & Chung, N. (2009). Understanding
factors affecting trust in and satisfaction with
mobile banking in Korea: A modified DeLone
and McLean‟s model perspective. Interacting
with Computers, 21, 385-392.
46. Lee, Y., Strong, D., Kahn, B., & Wang, R.
(2002). AIMQ: A methodology for information
quality assessment. Information & Management,
40, 133-146.
47. Lim, Y. M., Yap, C. S., & Lee, T. H. (2011).
Intention to shop online: A study of Malaysian
baby boomers. African Journal of Business
Management, 5(5),1711-1717.
International Journal of Information Technology and Business Management 29
th May 2015. Vol.37 No.1
© 2012- 2015 JITBM & ARF. All rights reserved
ISSN 2304-0777 www.jitbm.com
49
48. Lin, H. F. (2007). Measuring online learning
systems success: Applying the updated DeLone
and McLean model. CyberPsychology&
Behavior, 10(6), 817-820.
49. Liu, C., Arnett, K. P., & Litecky, C. (2000),
Design quality of Web Sites for Electronic
Commerce: Fortune 1000 Webmasters‟
Evaluations. International Journal of Electronic
commerce & Business Media, 10 (2), 120 – 129.
50. MacKenzie, S. B., Podsakoff, P. M., &
Podsakoff, N. P. (2011). Construct Measurement
and Validation Procedures in MIS and Behavioral
Research: Integrating New and Existing
Techniques. MIS Quarterly, 35(2), 293-334.
51. Maiyaki, A. A., & Moktar, S. S. M. (2011).
Influence of Service Quality, Corporate Image
and Perceived Value on Customer Behavioural
Responses in the Nigerian Banks: Data Screening
and Preliminary Analysis. International
Conference on Management (ICM 2011)
Proceeding, 547-568.
52. Malhorta, N. K. (2004). Marketing research: An
applied orientation (4th ed.). United State:
Pearson Education, Inc.
53. Malhotra, N. K. (2005). Basic marketing
research (2nd ed.). United State: Pearcon
Education, Inc.
54. Molla, A., & Licker, P. (2001). E-commerce
systems success: An attempt to extend and
respecify the Deloneand Mclean model of IS
success. Journal of Electronic Commerce
Research, 2(4), 131- 141.
55. Negasha, S., Ryan, T., & Igbaria, M. (2003).
Quality and effectiveness in web based customer
support systems. Information & Management, 40,
757-768.
56. Pai, F. Y., & Huang, K. I. (2011). Applying the
technology acceptance model to the introduction
of healthcare information systems. Journal of
Technological Forecasting and Social Change,
78, 650-660.
57. Parasuraman, A., Zeithaml, V. A. & Berry, L. L.
(1985). A conceptual model of service quality
and its implication. Journal of Marketing, 49, 41-
50.
58. Park, H. M. (2002). Univariate Analysis and
Normality Test Using SAS, Stata, and SPSS. The
Trustees of Indiana University.
59. Perez-Mira, B. (2010). Validity of DeLone and
McLean‟s model of information systems success
at the website level of analysis: A dissertation.