Embed Size (px)
Citation preview

University of Arkansas, FayettevilleScholarWorks@UARK
Theses and Dissertations
5-2016
Consumer Willingness to Pay for GeneticallyEngineered EdamameElijah John WolfeUniversity of Arkansas, Fayetteville
Follow this and additional works at: http://scholarworks.uark.edu/etd
Part of the Agricultural Economics Commons, Agronomy and Crop Sciences Commons, and thePlant Breeding and Genetics Commons
This Thesis is brought to you for free and open access by ScholarWorks@UARK. It has been accepted for inclusion in Theses and Dissertations by anauthorized administrator of ScholarWorks@UARK. For more information, please contact [email protected], [email protected].
Recommended CitationWolfe, Elijah John, "Consumer Willingness to Pay for Genetically Engineered Edamame" (2016). Theses and Dissertations. 1588.http://scholarworks.uark.edu/etd/1588

Consumer Willingness to Pay for Genetically Engineered Edamame
A thesis submitted in partial fulfillment of the requirements for the degree of
Master of Science in Agriculture Economics
by
Elijah J. Wolfe. University of Arkansas
Bachelor of Science in Agricultural, Food & Life Science, 2014
May 2016 University of Arkansas
This thesis is approved for recommendation to the Graduate Council.
Dr. Michael P. Popp Thesis Director
Dr. Jennie S. Popp Committee Member
Dr. Rodolfo N. Nayga, Jr. Committee Member
Dr. Han-Seok Seo Committee Member
Dr. Pengyin Chen Committee Member

Abstract
This study examined the effect of GM labeling on consumer willingness to pay (WTP) for
edamame. It also investigated how people reacted to different messages and whether the order
of receiving positive or negative information about GM technology impacted their willingness
to pay (WTP). The study had three components: (1) a sensory test of GM and non-GM labeled
products; (2) a non-hypothetical experimental auction to assess WTP for GM, non-GM and
unlabeled products; and (3) a questionnaire to collect demographics and other information from
the participants. Results of the sensory evaluation revealed no statistically significant difference
between GM and non-GM edamame in terms of aroma, taste, appearance, texture and overall
impression with GM edamame rated slightly higher in three of the five sensory categories.
Despite no differences in these sensory attributes between GM and non-GM edamame, there
was a statistically significant and large premium for non-GM edamame over the GM and
unlabeled edamame products. Further, WTP for unlabeled and GM edamame were similar
suggesting existence of preconceived negative notions about GM edamame. The estimated
discounts for GM edamame therefore do not support GM breeding efforts for edamame at this
time. Overwhelmingly, negative information about GM technology had a large negative,
statistically significant impact on WTP that could not be reversed with smaller positive GM
technology information effects on WTP regardless of order of information provided. However,
modifying the opinion about GM technology also had a large statistically significant effect on
WTP. With responses on knowledge about GM technology suggesting a poor understanding of
GM technology, it may well be fruitful to educate consumers to sway their opinion toward
greater GM acceptability. Targeting this message to female and younger population
demographics was supported as WTP for GM edamame by women was statistically

significantly lower than WTP for GM edamame by men. By the same token WTP for GM
edamame declined statistically significantly with age suggesting that younger consumers may
be more accepting of GM technology than older buyers.

Acknowledgements
First, I would like to thank my thesis advisor, Dr. Michael Popp, for seeing the potential in me
as an undergraduate. As his student, he recruited, advised, and motivated me to pursue my
master’s degree. Without him I would have never considered continuing my education.
Next, I would like to thank Dr. Han-Seok Seo, Dr. Jennie Popp, Dr. Rodolfo M. Nayga, Jr., and
Dr. Pengyin Chen for serving on my thesis committee. Each of these committee members
provided their expertise that was needed to complete the project.
I thank Diana Danforth and Dr. Claudia Bazzani for helping me throughout the experimental
design and statistical work. At times, they probably thought I would never understand what
they were telling me about statistics.
I want to thank David Mosely, Mike Davis, and Tonya Tokar for assisting me with the crop
harvesting, product production, and sensory testing.
I would also like to thank my classmates and lifetime friends: Egzon Bajrami, Rafael Soares,
Nick Kinard, Ryan Napier, Fahad Alzahrani, Francis Tsiboe, and Frank Udouj. They were all
very important factors that volunteered to help with no reward.
Alicia Minden was of great help to me with editing my thesis and making sure my paperwork
was always done right and on time.
Lastly, I would like to thank all of the faculty and staff of the Agricultural Economics
Department at the University of Arkansas for giving me such a great opportunity.

Dedication
This thesis is dedicated parents and siblings for their support they have shown me throughout
my life. They have always believed in me and I will always appreciate their support.
I would like to also dedicate this thesis in memory of my grandfather, Jake Evan Clements.

Table of Contents
Chapter 1 ......................................................................................................................................1
I. Introduction .......................................................................................................................... 1
Overview .......................................................................................................................... 1
Edamame .......................................................................................................................... 2
Genetically Engineered Labeling ..................................................................................... 3
Literature Review ............................................................................................................. 4
Purpose of the study ......................................................................................................... 5
References ........................................................................................................................ 7
Figure 1. Edamame at various stages of processing at the Arkansas Research and Extension Center in Fayetteville, AR. .............................................................................. 9
Chapter 2 ....................................................................................................................................10
II. Consumer Willingness to Pay for Edamame with a Genetically Modified Label ............. 11
Abstract ............................................................................................................................... 11
Highlights: .......................................................................................................................... 12
Introduction ........................................................................................................................ 13
Materials and Methods ....................................................................................................... 16
Participants ..................................................................................................................... 16
Edamame sample and preparation .................................................................................. 16
Valuation measure .......................................................................................................... 17
Procedure ........................................................................................................................ 18
Follow-up survey ............................................................................................................ 19
Data analysis ................................................................................................................... 20
Effect of Consumption Frequency on WTP ................................................................... 21
Effect of Overall Impression on WTP ............................................................................ 22
Results ................................................................................................................................ 22
Participant demographics ............................................................................................... 22
Comparisons in hedonic impression for edamame samples ........................................... 23
Effects of gender, education and income level on WTP for GM labeled edamame ...... 24
Effect of edamame consumption level on WTP for GM labeled edamame ................... 25
The effect of overall impression on WTP ...................................................................... 25
Discussion ........................................................................................................................... 26
Conclusion .......................................................................................................................... 27
References .......................................................................................................................... 29

Table 1. Comparisons of three auctions types, BDM, Vickery’s Second Price Auction, and Random nth Price Auction. ................................................................................................ 32
Table 2. Question used to form knowledge variable towards GM technology. ................. 33
Table 3. Question used to form opinion variable towards GM technology. ...................... 34
Table 4. Summary of variables for all responses vs. high (> 10 times per quarter) and low (<= 10 times) edamame consumption. ............................................................................... 35
Table 5. Average marginal effects of the TOBIT model by consumption frequency. All responses vs. high (> 10 times per quarter) and low (<= 10 times) edamame consumption. ............................................................................................................................................ 36
Table 6. Average marginal effects of the TOBIT model by Genetically Modified (GM) and non-GM product including overall impression obtained in the sensory test. .............. 37
Figure 1. Mean comparison of hedonic impression for the two edamame samples labeled with genetically modified (GM) edamame and non-GM edamame. .................................. 38
Figure 2. Mean comparisons of willingness to pay for edamame samples with three different label conditions with respect to demographics such as gender, education, and income level. Error bars represent the standard error of the means. .................................. 39
Chapter 3 ....................................................................................................................................40
II. Willingness to Pay for Edamame: GM Technology, Message Type and Order Effects ... 41
Abstract ............................................................................................................................... 41
Introduction ........................................................................................................................ 42
Materials and Methods ....................................................................................................... 45
Participants ..................................................................................................................... 45
Edamame sample and preparation .................................................................................. 45
Valuation measure .......................................................................................................... 45
Procedure ........................................................................................................................ 46
Follow-up survey ............................................................................................................ 48
Data analysis ................................................................................................................... 48
Results ................................................................................................................................ 48
Participant demographics ............................................................................................... 50
Effects of information on non-parametric average WTP by product ............................. 51
Unlabeled ........................................................................................................................ 51
Parametric Information Effects on WTP by order of information ................................. 53
Effects of demographic and other explanatory variables by order of information subsamples ...................................................................................................................... 54
Discussion ........................................................................................................................... 55
Conclusion .......................................................................................................................... 56
References .......................................................................................................................... 58

Table 1. Socio-demographic characteristics of the sample. ............................................... 61
Table 2. Comparisons of three auctions types, BDM, Vickery’s Second Price Auction, and Random nth Price Auction. ................................................................................................. 62
Table 3. Information treatments ......................................................................................... 63
Table 4. Question used to form knowledge variable towards GM technology. ................. 64
Table 5. Question used to form opinion variable towards GM technology. ...................... 65
Table 6. Random effects Tobit analysis of three edamame products (Unlabeled, Non-GM, and GM) when positive information was provided first. ................................................... 66
Table 7. Random effects Tobit analysis of three edamame products (Unlabeled, Non-GM, and GM) when negative information was provided first. ................................................... 67
Notes for Table 6 and Table 7: ........................................................................................... 68
Figure 1. Mean comparisons of willingness to pay for edamame samples for unlabeled, Non-GM, and GM samples between positive first and negative first treatments including or excluding zero bids. ..................................................................................................... 69
Chapter 4 ....................................................................................................................................70
IV. Conclusion ........................................................................................................................ 70
Limitations ...................................................................................................................... 71
Future Research .............................................................................................................. 71
Appendix ....................................................................................................................................73
Appendix 1. Informed Consent e-mail and Screening Survey ........................................... 74
Appendix 2. Questionnaire ................................................................................................. 79
Appendix 3. IRB Approval Form ....................................................................................... 84

1
Chapter 1
I. Introduction
Overview
Soybeans (Glycine max (L). Merr) have occupied the largest percent of crop acreage among
principle competing crops of corn (zea mays), cotton (gossypium hirsutum) and rice (oryza
sativa) in Arkansas for decades. Further, Arkansas ranks among the top 10 soybean producing
states in the US with 2.8 to 3.6 million acres grown annually between 1995 and 2015 (NASS,
2016). In 41 of Arkansas’s 75 counties, soybeans are produced with average yields around 50
bushels per acre. The most concentrated Arkansas soybean production occurs in the Grand
Prairie region of Eastern Arkansas which is made up of Arkansas, Prairie, Lonoke, and Monroe
counties. Other notable areas that grow soybeans are the Western Arkansas River Valley
(Crawford, Sebastian, Logan, Johnson, Yell, Pope, Perry counties) and the Southwest Red
River Valley (Little River, Miller, Hempstead, Lafayette counties). Soybeans are the world’s
largest source of animal protein feed (meal) and the second largest source of vegetable oil
(ERS, 2012). Soybeans are used for human consumption in the forms of cooking oils, soy
milk, tofu, and edamame. Genetically engineered soybeans are an increasing trend with 17%
of US soybean acreage being herbicide-tolerant as of 1997 to 94% having the genetically
engineered trait of herbicide-tolerance in 2014 (ERS, 2015). Soybeans grown in Arkansas and
the United States are genetically modified (GM) because the use of herbicide-tolerant crops
allow farmers to reduce hours controlling weeds and to decrease cost of production although
herbicide drift may have forced the hand of producers with respect to this technology adoption.
Since the first Round-up Ready soybean seeds were introduced in 1996, weeds have become
more herbicide-resistant, and this has some farmers interested in returning to conventional

2
soybeans and different weed control protocols. Consumer awareness of genetically modified
products has also increased and many have lobbied for stricter controls on the cultivation of
GM crops as well as products manufactured from these crops. Research results about
consumer decision-making processes regarding genetically engineered products remain mixed
and inconclusive about willingness to purchase GM foods (Salazar-Ordonez, Rodriguez-
Entrena, and Becerra-Alonso, 2014). Legal developments for GM labeling are most common
at the state level and could potentially alter demand with labels such as “Genetically
Engineered” as a requirement on packaging. With the growing demand of soy foods in the
United States and the potential for mandatory GM labeling, conventional soybeans may regain
popularity among producers if domestic consumers are willing to pay higher prices for non-GM
products.
This study aims to find consumer maximum willingness to pay (WTP) for an edible soybean
product (edamame), to explore product labeling effects and taste differences in “genetically
engineered” and Non-GMO verified food products.
Edamame
Soybeans are primarily harvested to be crushed to extract oils and meal for animal feed.
Another type of edible soybean called edamame has been a popular dish in East Asia that dates
back to 1300s. It is harvested green and produces a nutritious bean that is a great source of
fiber, omega-3 fatty acids, micronutrients, and is low in calories (Konovsky, Lumpkin, &
McClary, 1994) (See Figure 1). Edamame has seen growing sales in the US from 2004 to 2007
of 40% (Roseboro, 2012). In 2010 to 2011 the Soyfoods Association of North America
reported frozen edamame sales grew 4.3%. According to an interview on CBSnews,
Americans consumed between 25,000 to 30,000 tons of the frozen bean in 2012 (CBSnews,

3
2014). According to Kerry Clark, a soybean breeder at the University of Missouri, 97% of the
edamame sold to frozen food markets have been imported from China and other Asian nations
(Roseboro, 2012). In Mulberry, Arkansas, a new edamame company called American
Vegetable Soybean and Edamame Inc., has been created. The company was created in 2012 to
mass produce US edamame to be sold to Americans, rather than importing edamame from
Asian countries like China (Magsam, 2012). Farmers in Arkansas, and other states like
California, Minnesota and Ohio, are growing edamame to supply the demands from Asian
restaurants and American supermarket chains like Costco, Whole Foods, and Sam’s Clubs
(Roelich, 2013). Mulberry, Arkansas farmers such as Mark Schluterman have seen the
potential in Arkansas. Schluterman increased the 40 acres of edamame planted in 2012 to 400
acres in 2013, earning an estimated 1,000 US dollars per acre on the edamame fields
(McBryde, 2014).
Genetically Engineered Labeling
There are over 50 countries in the world that require GM labeling. Neither the US nor Canada
have adopted this policy and still do not require labeling. However, individual states in the US,
like Connecticut, Maine, and Vermont have already voted to have GM labeling in the future.
Oregon, California, and Washington proposed legislation for GM labeling (Pifer, 2014).
Oregon was the first state in the US to propose “Genetically Engineered” legislation on the
ballet under Measure No. 27 during their November 2002 election. The measure lost by a
margin of 70-30 in favor of not requiring mandatory labeling. The US Food and Drug
Administration (FDA) supports “voluntary labeling whether foods have or have not been
developed through genetic engineering, provided that such labeling is truthful and not
misleading” (FDA, 2015). The FDA has recognized that US consumers are interested in

4
knowing if their food was produced using genetically modified breeding techniques. The
arguments against labeling are the increased cost, government bureaucracy, no health or safety
benefits, and special interest exemptions. Lucht (2015) argued that since the label would not
give any relevant information about the product, there should not be mandatory labeling.
Literature Review
In studies like Delwaide (2014), countries in the European Union (EU) have voiced strong
opinions about GM foods. EU countries have adopted policy to slow down the adoption
process of biotech crops. GM crops are viewed as having a negative impact on human health
and the environment (Salazar-Ordonez, Rodriguez-Entrena, & Becerra-Alonso, 2014). The US
has very different views on GM crops and has adopted biotech crops of corn, soybeans, and
cotton. Since GM foods are known as a new technology, many consumers assume the long-
term effects are unknown. Consumers may believe that adding a GM label may not be of use
when making decisions to purchase (Roe & Teisl, 2007). One study used an edible soy food,
tofu, in a hypothetical choice experiment with face-to-face survey of consumers in Taiwan.
The study found that GM labelling was helpful to Taiwanese tofu consumers and that
preference or antipathy towards GM tofu were split (Jan, Fu, & Huang, 2006).
Eliciting consumer values for products and services in hypothetical and non-hypothetical
auctions is common (Lusk & Shogren, 2007). The random nth price auction allows bids to be
placed by bidders without them knowing if their bid will become binding. If someone wants to
act irrationally and bid a higher than usual price, they could potentially have to pay a price that
is not what they are willing to pay (Lusk & Hudson, 2003). As such, the random nth price
auction offers advantages over other auctions in the sense that it is discourages over- or under
bidding and allows auctioning of multiple products as only a single product becomes binding.

5
This reduces the wealth effect or impact of budgetary constraints that may results among
participants bidding on multiple products.
Information attributes and a sensory test were added to the non-hypothetical auction so
consumer views not only on GM labeling, but taste and information would become testable. In
Nalley, Hudson, and Parkhurst (2006), consumer valuations with different information
treatments influenced their decision to repeat purchase sweet potatoes products. Consumers
preferred GM foods produced domestically to GM foods imported from foreign countries (Xie,
Kim, & House, 2013). Individuals with information on consumer benefits, producer benfits,
and environmental benefits were willing to pay more than individuals without information
(Xie, Kim, & House, 2013). Soy foods have emerged in recent years as a major functional
food. Non-soy users or infrequent soy users accept soy foods more readly when positive
information is given with soy food purchasing decisions (Moon, Balasubramaniam, & Rimal,
2011).
Purpose of the study
The objectives of this protocol are to find consumer maximum willingness to pay (WTP) for an
edible soybean product (edamame), to explore product labeling effects and taste differences in
“genetically engineered” and non-GM food products. To do this, participants were asked to
complete a taste test of edamame, and participate in a non-hypothetical auction, where repeated
bidding (with different sets of information) allowed elicitation of maximum WTP for edamame
that came from “genetically engineered” or non-GM plants grown at the Fayetteville
Agricultural Experiment Station. After the auction was over, one product was randomly
selected as the binding product that participants had to purchase. This study will add
information about taste differences between GM and non-GM edamame products and then

6
value what they taste. Information effects on consumer WTP for biotech crops will be tested
by giving the participants negative and postitive information. The information was randomly
assigned to analyze order of information effects. Pending the outcome of the study, GM
edamame breeding efforts may either be encouraged or discouraged for producers in Arkansas.
If labeling is found to have an effect on consumer WTP it will influence the decision to grow
these varieties as labeling policies as lobbied by various organizations may require GM
labeling or consumers may become suspicious of unlabeled product.
The objectives of Chapter 2 were to i) compare sensory aspects between GM and non-GM
edamame; ii) estimate consumer WTP for edamame products that are labeled as GM and non-
GM or without a label; iii) compare consumer mean WTP across demographic factors,
opinions, and knowledge of GM technology; iv) determine what explanatory factors drive
WTP; and v) examine the effect of an overall impression sensory rating on WTP for GM and
non-GM edamame.
The objectives of Chapter 3 are to i) examine label effects on WTP (Unlabeled, GM, and non-
GM); ii) to determine how the positive and negative information provided influenced consumer
WTP after receiving no information; iii) compare consumer mean WTP across two treatments
that vary in order of information given; and iv) determine what explanatory factors drive WTP
when comparing the order of information treatments.
The appendix provides information about informed consent procedures including the screening
survey. The appendix also summarizes questionnaire responses of the participants of the
edamame auction.

7
References
Delwaide, A. C., Nalley, L. L., Dixon, B. L., Danforth, D. M., Nayga Jr, R. M., Van Loo, E. J., & Verbeke, W. (2015). Revisiting GMOs: Are There Differences in European Consumers’ Acceptance and Valuation for Cisgenically vs Transgenically Bred Rice? Plos one, 10, 1-16.
Edamame Production Goes from Asia to Arkansas. Interview by Manuel Bojorquez. CBSNews. CBS Interactive, 08 Jan. 2014. Web. http://www.cbsnews.com/news/asias-edamame-business-is-coming-to-us-soil/. Accessed Feb 3, 2016.
Jan, M. S., Fu, T. T., & Huang, C. L. (2007). A Conjoint/Logi Analysis of Consumers' Responses to Genetially Modified Tofu in Taiwan. Journal of Agricultural Economics, 58, 330-347
Konovsky, J., Lumpkin, T. A., & Mcclary, D. (1994). Edamame : The vegetable soybean. Understanding the Japanese Food and Agrimarket: A Multifaceted Opportunity, 1988, 173-181.
Lucht, J. M. (2015). Public Acceptance of Plant Biotechnology and GM Crops. Viruses, 4254-4281.
Lusk, J. L., & Hudson, D. (2003). Using Experimental Auctions for Marketing Applications: A Discussion. Journal of Agricultural and Applied Economics, 35, 349-360.
Lusk, J. L., & Shogren, J. F. (2007). Experimental Auctions: Methods and Applications in
Economic and Marketing Research. United Kingdom: Cambridge Univeristy Press.
Magsam, J. (2012) Mulberry Processing Plant Set to Be Edamame Pioneer. Arkansas Online, 18 Nov. 2012. <http://www.arkansasonline.com/news/2012/nov/18/mulberry-processing-plant-set-be-edamame--20121118> Accessed Feb 16, 2016.
McBryde, J. (2014). Arkansas First State to Grow Edamame Commercially. Farm Flavor. Arkansas Agriculture Department, <http://farmflavor.com/us-ag/7rkansas/top-crops-arkansas/snacking-on-soy-arkansas-grows-edamame-commercially> Accessed Feb 4, 2016.
Moon, W., Balasubramaniam, S. K., & Rimal, A. (2011). Health Claims and consumers' behavioral intentions: The case of soy-based food. Food Policy, 36, 480-489.
Nalley, L. L., Hudson, D., & Parkhurst, G. (2006). Consistency of Consumer Valuation Under Different Information Sets: An Experimental Auction with Sweet Potatoes. Journal of
Food Distribution Research, 37, 60-71.
Pifer, R. (Producer). (2014). Mandatory GMO Labeling Laws: Overview and Status of Current
Legal Issues. [Powerpoint Slides & Video webinar]. retrieved from http://nationalaglawcenter.org/consortium/gmolabelingwebinar/
Roe, B., & Teisl, M. F. (2007). Genetically modified food labeling: The impacts of message and messenger on consumer perceptions of labels and products. Food Policy, 32, 49-66.

8
Roelich, J. 2013. Arkansas Aims To Make Edamame As American As Apple Pie. NPR. NPR, 16 Oct. 2013. Web. http://www.npr.org/sections/thesalt/2013/10/16/234764120/arkansas-aims-to-make-edamame-as-american-as-apple-pie Accessed Feb 3, 2016
Roseboro, K. 2012. Edamame offers good non-GMO opportunities for US farmers. The Organic and Non-GMO Report available at http://www.non-gmoreport.com/articles/april2012/edamame-non-gmo-us-farmers.php. Accessed Jan 29, 2016.
Salazar-Ordonez, M., Rodriguez-Entrena, M., & Becerra-Alonso, D. (2014). Willingess to purchase Genetically Modified Food: an analysis applying artificial Neural Networks. In 2014 International Congress, August 26-29, 2014, Ljubljana, Slovenia (No. 182937).
European Association of Agricultural Economists.
United States Department of Agriculture, Economic Research Service. (2015). Adoption of Genetically Engineered Crops in the U.S., Recent Trends in GE Adoption. Available at http://www.ers.usda.gov/data-products/adoption-of-genetically-engineered-crops-in-the-us/recent-trends-in-ge-adoption.aspx. Accessed Feb 3, 2016.
United States Department of Agriculture, Economic Research Service. (2012). Soybeans and Oil Crops. Overview. Available at http://www.ers.usda.gov/topics/crops/soybeans-oil-crops.aspx. Accessed Feb 3, 2016.
United States Department of Agriculture, National Agricultural Statistics Service. (2016). Quick Stats. Harvested Soybean Acres 1995-2015. Available at http://quickstats.nass.usda.gov Accessed Jan 29, 2016.
United States Food and Drug Administration. Food from Genetically Engineered Plants. N.p., 19 Nov. 2015. Web. http://www.fda.gov/Food/FoodScienceResearch/GEPlants/default.htm Accessed Feb 3, 2016.
Xie, J., Kim, H., & House, L. (2013). Valuing Information on GM foods in the presence of Country-of-Orgin Labels. International Journal on Food System Dynamics, 4, 170-183.

9
Figure 1. Edamame at various stages of processing at the Arkansas Research and Extension Center in Fayetteville, AR.

10
Chapter 2
Consumer Willingness to Pay for Edamame with a Genetically Modified Label
By
Elijah Wolfe, Michael Popp, Claudia Bazzani, Rodolfo M. Nayga, Jr., Diana Danforth,
Jennie Popp, Pengyin Chen, and Han-Seok Seo

11
II. Consumer Willingness to Pay for Edamame with a Genetically Modified Label
Abstract
Soybean (Glycine max (L.) Merr.) production in the US is predominantly genetically modified
(GM) given economic and production advantages compared to conventional soybean.
Edamame, green immature soybean bred specifically for harvest at the end of the pod filling
stage, has experienced demand growth in the US. Although the technology is available to grow
GM edamame, anticipated consumer resistance and labeling requirements for GM foods might
have influenced the industry not to invest in GM edamame. This study examined the effect of
GM labeling on consumer willingness to pay (WTP) for edamame. The study had three
components: (1) a sensory test of labeled products, (2) a non-hypothetical experimental auction
to assess WTP for GM, non-GM and unlabeled products, and (3) a questionnaire-based survey
to collect demographics and other information from the participants. Results showed that
participants expressed greater WTP for non-GM labeled edamame compared to unlabeled and
GM labeled edamame. The latter two received similar bids suggesting that participants had a
preconceived notion that the unlabeled product is likely to be GM. This is noteworthy since
there was no difference in sensory acceptability between GM and non-GM edamame.
Participants who consume edamame more often bid higher for the products than participants
who consume edamame less often. Responses on knowledge and opinion questions suggested
that consumer education could be an option to enhance GM acceptability. The estimated
discounts for GM edamame, however, do not support GM breeding efforts for edamame at this
time.
Keywords: Edamame soybean; Non-hypothetical auction; genetically modified (GM); GM
labeling; willingness to pay (WTP); sensory evaluation

12
Highlights:
• Edamame soybean has experienced a recent demand growth in the US.
• Producers potentially interested in genetically engineered edamame to save on cost of production or enhance yield need information about consumer acceptance of GM edamame.
• WTP for non-GM edamame is significantly higher in comparison to unlabeled and GM labeled edamame in the absence of significant differences in sensory evaluations of GM and non-GM edamame.
• GM and unlabeled edamame led to similar WTP suggesting preconceived negative notions about GM among the participants.
• GM breeding efforts in edamame are not justified at this time but consumer education about GM technology may lead to enhanced GM acceptability.

13
Introduction
Genetically modified (GM) or genetically engineered crops are crops that have had their DNA
altered in a way that does not naturally occur by reproduction (WHO, 2014). There are over 50
countries in the world that require GM labeling but neither the US nor Canada have adopted
this policy. However, discussion about GM food labeling legislation is currently ongoing in the
US. A number of states in the US, including Connecticut, Maine, and Vermont, have already
voted to have GM labeling in the future (Pifer, 2014). The US Food and Drug Administration
(FDA) supports “voluntary labeling whether foods have or have not been developed through
genetic engineering, provided that such labeling is truthful and not misleading” (FDA, 2015).
The FDA has recognized that US consumers are interested in knowing if their food is produced
using GM breeding techniques. The arguments against labeling are the increased cost of labels,
government bureaucracy, no health or safety benefits, and special interest exemptions. For
example, the FDA believes that GM crops have no difference in composition to non-GM crops.
Ronald (2011) also indicated that GM crops pose just as big a risk to human health and the
environment as crops grown under conventional breeding techniques (European Commission
Directorate-General for Research and Innovation 2010). Lucht (2015) argued however that
since the label would not give any relevant information about the product, there should not be
mandatory labeling. The FDA only requires labeling if GM food has a different nutritional
property or allergen (Du, 2014). Mandatory “genetically engineered” labels could change the
way that consumers value products at grocery stores.
To examine these GM labeling issues, this study focuses on edamame which is soybean
(Glycine max (L.) Merr.) harvested near the end of the pod filling stage (Mozzoni, Morawicki,
& Chen, 2009) and intended for human consumption as a vegetable. It is harvested green, and

14
produces a nutritious bean that is a great source of fiber, omega-3 fatty acids, micronutrients,
and is low in calories (Konovsky, Lumpkin, & McClary, 1994). Edamame has also been found
to have anti-diabetic effects (Zang, Sato, & Igarashi, 2011). Given these nutritional properties,
the demand for edamame has been increasing in recent years. It is a popular product in East
Asia, and has experienced rapid sales growth of 40% in the US from 2004 to 2007 (Roseboro,
2012).
Given increasing demand for edamame, there is an incentive to produce more edamame for the
US market. For example, the American Vegetable Soybean and Edamame Inc. (AVS), opened
the first ever edamame processing plant in the US in 2012 to commercially produce “made in
the US” edamame (McBryde, 2014). Currently, all edamame sold in the US market are non-
GM. However, the soybean market for feed and oil in the US is dominated by GM soybeans.
Given the increasing demand for edamame in the US, there would be an incentive to develop
higher yielding soybeans that could be developed through GM to produce edamame. An
interesting and important question, however, is whether there would be a market for GM
edamame or whether labeling non-GM edamame as “non-GM” could command a premium in
the market. This question can be answered by assessing consumer willingness to pay (WTP) for
GM edamame and non-GM edamame. While there have been a number of studies that
examined consumer preferences and WTP for various GM food products, no other study has
examined this specific issue about edamame to our knowledge. This topic is also interesting
given the recent past and current debate about GM labeling regulations in a number of states in
the US.
A non-hypothetical auction was used in this study to determine whether consumers would
discount edamame produced using GM seed in comparison to an unlabeled or conventionally

15
bred, non-GM edamame. The non-hypothetical approach was employed for two main reasons.
In comparison to hypothetical valuation methods 1) the products being auctioned were
available for winners to physically purchase; and 2) there is well-known hypothetical bias that
could arise in the use of hypothetical valuation methods, e.g., stated preference methods
(Carlsson & Martinsson, 2001; Carpenter, Harrison, & List, 2005; Murphy et al., 2005; Silva et
al., 2011).
A number of GM foods have been studied to test consumer willingness to pay (WTP). For
example, Huffman et al. (2003) demonstrated that there was a 14% premium for non-GM
vegetable oil, tortilla chips, and potatoes compared to their GM labeled counterparts. Lusk et al.
(2001) also showed that 20% of respondents were willing to pay 25 cents per ounce more for
the non-GM product. However they also found that 70% were not willing to pay a difference
between GM corn chips over non-GM corn chips. Furthermore, people who believe GM foods
have a positive effect on food quality and safety were more likely to approve of GM foods
(Baker & Burnham, 2001).
Given the mixed signals on GM technology presented above, the objectives of this study were
to 1) compare sensory aspects between GM and non-GM edamame; 2) estimate consumer WTP
for edamame products that are labeled as GM and non-GM or without a label; 3) compare
consumer mean WTP across demographic factors, opinions, and knowledge of GM technology;
4) determine what explanatory factors drive WTP; and 5) examine the effect of an overall
impression sensory rating on WTP for GM and non-GM edamame. The study is original in the
sense that both a sensory test and an experimental auction were performed on edamame using
GM and non-GM soybean consumed as a vegetable rather than as a processed food such as
soybean oil, tofu or meat from animals fed with soybean meal.

16
Materials and Methods
This study was conducted according to the Declaration of Helsinki for studies on human
subjects. The protocol was approved by the Institutional Review Board of a major land grant
university in the US. The experimental procedure was explained to all participants and a
written informed consent was obtained prior to participation. Each participant was given a $25
gift card as payment for the opportunity cost associated with spending time on the experiment.
Participants
A total of 117 volunteers participated in both a sensory test and a non-hypothetical auction.
Participants were recruited through the consumer profile database of the university’s sensory
service center. The consumer profile database contains approximately 6,200 area residents.
The participants reported that they had no soy allergies and demographics of the participants
are described below.
Edamame sample and preparation
Soybean grown for intended end use as feed and oil using both a GM and a non-GM cultivar
were harvested at the edamame stage. Blanching and packaging took place at the university’s
research center located within walking distance of the soybean field. Blanching was done at
100ºC for 90s to sufficiently inactivate lipoxygenase activity before packaging (Mozzoni,
Morawicki, & Chen, 2009). This step is important for the edamame pods to keep their
desirable green color and textural attributes. The packages used were clear 8 oz. (237 mL) bags
that were vacuum sealed after being cooled from the blanching. After sealing, the packages
were labeled as GM, non-GM, and unlabeled (randomly GM or non-GM) and frozen until the
auction.

17
Valuation measure
Applied economists are using incentive compatible experimental auctions because real world
simulation requires that real money and real products are used (Lusk, Feldkamp & Schroeder,
2004; Cummings, Harrison, & Rutström, 1995; Fox et al., 1998.; List & Shogren, 1998). There
are many types of non-hypothetical auctions, such as Vickrey’s second-price auction, the
Becker-DeGroot-Marschak (BDM) mechanism, and random nth price auctions (see Table 1)
(Lusk & Shogren, 2007). The random nth price auction was chosen over the other methods
because of its ability to keep off-margin bidders engaged. An off-margin bidder is any bidder
who does not feel that he/she has a chance of winning the auction (Shogren et al., 2001b). A
random nth price auction is an auction that allows all bids to influence the results of the auction
as the second lowest bid could become binding and thereby lead to a large percentage of
participants purchasing product in the auction (Lusk, 2003). In this type of auction, all
participants submit a bid and these are then ranked from the highest to lowest. The auction can
be multiple rounds with a variety of products for sale. A random number (n) is selected by the
experimenter, from 2 to the total number of bidders in the auction. The nth highest price
becomes the market price. The market price (i.e., nth highest bid) is the price that anyone who
bids above the nth highest bid has to pay. Therefore, there are (n-1) winners in this auction. If
there are multiple rounds and products, then a randomly selected round and a single product
can be chosen to remove wealth effects (Shogren et al., 2001a). Wealth effects would occur
when participants have the potential to buy multiple products. This could make them stop
bidding their true WTP given a budget constraint.

18
Procedure
Participants were first asked to complete a sensory test so that they had an actual experience of
tasting GM and non-GM edamame before making a purchasing decision. The participants were
shown the label of the two edamame samples, “GM” or “non-GM”, prior to tasting the
products. Similar to Wszelaki et al.’s study (2005), all participants received the two edamame
samples served in a sequential monadic fashion in individual sensory testing booths. Each
sample was served on a tray identified by a 3-digit randomized code. Participants were asked
to rate their hedonic impression for each sample with respect to appearance, aroma, flavor, and
textural attributes on a 9-point hedonic scale ranging from 1 (dislike extremely) to 9 (like
extremely). Participants were also asked to provide an overall impression for each sample
using the same 9-point hedonic scale. Finally, participants were asked to provide any
additional comments on the samples tasted during the sensory test. Data were collected using
Compusense® five (Release 5.6, Compusense Inc., Guelph, ON, Canada) software.
After completing the sensory test, the participants were asked to take part in a non-hypothetical
auction to determine their WTP for edamame. The random nth price auction, as described
above, was used to compare and contrast WTP across the three types of edamame products:
GM, non-GM, and unlabeled. The random nth price auction allowed participants to provide
incentive compatible bids as bidding above their true WTP would increase the likelihood of
purchasing the product at an inflated price and underbidding would increase the likelihood of
not obtaining the product at a profitable price (Capra, Lainer, & Meer, 2010). The auction
included three rounds of bidding. In the first round, participants were told only the label of the
three products. In the next two rounds, participants either received positive or negative
information about GM food prior to placing their bids. The order of information was randomly

19
assigned to the session the participants were in. After all bids were submitted, one of the three
products was randomly selected as the binding product, and one of the three rounds was
randomly selected as the binding round to remove wealth effects discussed above. Next, the
bids were ranked from highest to lowest for the binding product. Last, a number, n, was
randomly chosen between 2 and the number of participants in the session. The top n-1 bidders
of the binding product in the binding round were the winners. The auction winners took home
the binding edamame product and paid the nth highest bid price for this product in the binding
round. Again, this study aimed to explain the effect of labels on the bids. Since the focus of
this paper is the effect of labeling on WTP, only the first round bids were used to explain the
label’s effect on consumer evaluations of the edamame products. No information about the
products was given in the first round. Therefore, data from the second and third round bids
were not examined in this paper because of expected influenced of positive and negative
information.
Before the auction, a practice candy bar auction and quiz ensured that the auction procedures
were clearly understood by all participants. The practice candy bar auction was the same
format as the edamame auction. The only difference was that the candy bar auction was
hypothetical. The quiz asked simple questions about the rules of the auction since it is
important that all participants understand the procedure and provide accurate results. The (real)
non-hypothetical auction required participants to actually pay for the binding product chosen at
the market price determined in the auction.
Follow-up survey
Following the auction, participants were asked to fill out a questionnaire that contained
questions about their opinions and knowledge about GM food as well as their typical level of

20
edamame consumption. A knowledge rating was assigned to each participant according to how
they answered four true/false questions (Table 2). An opinion score was calculated for each
participant based on how they answered six questions on GM foods (Table 3). Demographic
questions regarding age, gender, household size, and income level were also included in the
survey as shown in Table 4.
Data analysis
Ratings of the two edamame samples labeled GM and non-GM were compared on appearance,
aroma, flavor, texture, and overall impression. A two-way analysis of variance (ANOVA) was
conducted with “Edamame sample” included as a fixed effect and “consumer panel” as a
random effect. The analysis was conducted using JMP 12 software (SAS Institute, Cary, NC)
using a statistical significance level of p < 0.05.
The auction produced multiple bids from one individual. Bids with a value of zero were
common either because the participant did not want the product, or the participant was not
interested in paying for the product during the auction. A Tobit model was used given the data
was truncated at zero. The model was designed to test for statistical significance of explanatory
factors and estimated marginal effects of individual factors (Canavari & Nayga, 2009; Schott &
Bernard, 2015). The �� denoted the bid for each participant i = 1, 2, 3…, N:
�� = ���∗ �� �∗ > 00 �� �∗ ≤ 0
and ��∗ is the latent bid where observed values were greater than 0.
(1) ��∗ = �� + �� , ��~�(0, ��)
where ��∗ or WTP was a function of �� or variables hypothesized to influence WTP. The ’s
were the coefficients of each variable and were converted into marginal effects indicating the

21
effect of a one unit change in X on WTP using STATA (StataIC v.13, StataCorp LP. College
Station, TX).
Alternatively, Eq. 1 was represented as follows:
(2) WTP = β0 + β1 FEMALE + β2 AGE + β3 EDUC BA + β4 EDUC MS + β5 INC MID + β6
INC HIGH + β7 CHILD + β8 KNOW + β9 OPINION + β10 HHS + β11 CONSUMP HIGH
+ β12 GM + β13 NOGM + u
where WTP is the latent bid or willingness to pay for an 8 oz. package of frozen edamame,
FEMALE, EDUC BA, EDUC MS, INC MID, INC HIGH, and CHILD are demographic binary
0/1 variables on gender, education level, income level, and presence or absence of children in
the household, respectively. AGE, KNOW, OPINION, and HHS are continuous variables
measuring participant age, knowledge (Table 2), opinion score (Table 3), and household size,
respectively, while CONSUMP HIGH, GM, and NOGM are binary 0/1 variables concerning
frequency of consumption as well as labeled presence or absence of GM and u is the error term.
These variables are further described in Table 4.
Effect of Consumption Frequency on WTP
To analyze impacts of consumption frequency on WTP, the model was estimated using the
whole sample and two sub-samples on the basis of frequency of edamame consumption. In the
questionnaire, respondents were asked to choose among five levels of consumption frequency
in the past three months (Never, 1-5, 6-10, 11-15, 16 times or more). Hence, Eq. 2 was
estimated using: 1) all responses; 2) a sub-sample of respondents who indicated up to 10 eating
events over the past three months for the low frequency model specification (CONSUMP
HIGH = 0); and 3) a sub-sample of respondents consuming edamame more than 10 times per
quarter (CONSUMP HIGH = 1).

22
Effect of Overall Impression on WTP
The last two Tobit models were estimated using results of the sensory test to determine whether
overall impression would impact marginal effects on WTP. Since the sensory test was only
done for GM and Non-GM edamame, the WTP data on unlabeled edamame were omitted from
these analyses. With the sessions, already at approximately 35 minutes, sensory testing of
unlabeled product would have taken twice as long and was therefore not conducted. Similar to
Eq. 2, two Tobit models were constructed to separately estimate WTP for each of the products
as follows:
(3) GMWTP = γ0 + γ1 FEMALE + γ2 AGE + γ3 EDUC BA + γ4 EDUC MS + γ5 INC MID +
γ6 INC HIGH + γ7 CHILD + γ8 KNOW + γ9 OPINION + γ10 HHS + γ11 CONSUMP
HIGH + γ12 GMLIKE + ε
(4) NOGMWTP = ρ0 + ρ1 FEMALE + ρ2 AGE + ρ3 EDUC BA + ρ4 EDUC MS + ρ5 INC
MID + ρ6 INC HIGH + ρ7 CHILD + ρ8 KNOW + ρ9 OPINION + ρ10 HHS + ρ11
CONSUMP HIGH + ρ12 NOGMLIKE + λ
The independent variables were the bids for the GM product in Eq. 3 and Non-GM bids
in Eq. 4, respectively. In addition to the explanatory variables already described in Eq. 2,
overall impression scores for the GM (GMLIKE) and the Non-GM (NOGMLIKE) edamame
were added to Eq. 3 and Eq. 4, respectively.
Results
Participant demographics
Table 4 summarizes participant demographic profiles. The minimum age of the participants
was 25 and the maximum age was 54, with an average age of 39. About half of the participants
had children in the household. The participants were comprised of 75% women and 25% men.

23
Approximately 50% of the participants had less than a Bachelor’s degree, while 25% had a
Bachelor’s degree, and 25% had a Graduate degree. The largest household size was 7, while
the average household size was 2.79. Monthly income of the participants was divided into
three groups, INC HIGH (more than $6,000), INC MID ($3,000-$5,999), and the baseline (less
than $2,999). Consumption frequencies showed 57% of participants consuming more than 10
servings per quarter with the remainder consuming less.
The demographics of the high consumption and low consumption groups were similar except
that the education level of infrequent edamame consumers was skewed toward higher education
compared to participants who ate edamame more often (Table 4). Higher frequency edamame
consumers also had higher income when compared to the low consumption subsample.
Finally, high frequency of consumption was more common in larger families with children.
Comparisons in hedonic impression for edamame samples
Hedonic impressions of the two edamame samples, labeled GM and non-GM edamame, were
compared with respect to appearance, aroma, flavor, texture, and overall impression. As shown
in Figure 1, the responses to the two edamame samples appeared quite similar. The hedonic
ratings did not significantly differ in terms of appearance (p = 1.00), aroma (p = 0.15), flavor (p
= 0.72), texture (p = 0.21), as well as overall impression (p = 0.26). In sum, there was no
statistically significant effect of GM label claims on hedonic impression for edamame samples.
Answers to the open-ended question regarding sensory preference revealed similar results.
Most of the respondents seemed to be indifferent to choosing one product over the other as
revealed in responses such as: “I felt that both are same in taste,” “They both had the same
flavor to me,” and “Both samples seemed the same to me.” However, some participants may
have made a decision based on preconceived opinions about GM foods. For example, one

24
participant typed “While I don't like the IDEA of GM, I do like the product a little better.”
Another respondent who chose non-GM stated, “I believe it said the first sample was non-GM
so I would prefer that.” Nonetheless, the majority concluded that the products were similar in
all product attribute categories.
Effects of gender, education and income level on WTP for GM labeled edamame
Figure 2 presents the empirical means of WTP for the three products. Participants were
generally willing to pay significantly more for non-GM than unlabeled product (at least 42
cents based on marginal effects) (Table 5). The unlabeled and GM products were very similar
in terms of empirical WTP means (Figure 2) and marginal effects from the regression model
(Table 5). The empirical mean difference between non-GM and GM products was 49 cents.
The empirical mean difference between unlabeled and GM products was 5 cents. Men had a
higher WTP for the three products than women (Figure 2).
Figure 2 revealed higher empirical WTP means for the non-GM product in the low education
sub-group. With a MS degree level education or higher, WTP bids were lower for all three
products when compared to the two lesser educated participant categories. Low-, middle-, and
high- income groups all had higher mean bids for the non-GM edamame compared to the
unlabeled or GM product (Figure 2). The middle income group had the highest mean bids for
all three products when compared to low and high income groups.
The results suggest that consumers would value a non-GM labeled edamame product more than
a GM labeled or unlabeled edamame product. Interestingly, not labeling the product led to
nearly the same discount as GM relative to non-GM, even though unlabeled product could be
either GM or non-GM in this study. Labeling is thus in the interest of the producer as currently
all US produced edamame sold in the US market is non-GM.

25
Effect of edamame consumption level on WTP for GM labeled edamame
Table 5 shows the three TOBIT models (All, High Consumption, and Low Consumption) that
were estimated to evaluate whether results would vary across participants with low vs. high
consumption frequency. Estimating Eq. 2 using subgroups as indicated above would test for a
possible interaction between consumption levels and the other explanatory variables. Results
suggest that both groups of participants were generally willing to pay significantly more for a
non-GM product than the unlabeled product (at least 44 and 42 cents based on marginal effects)
(Table 5). Marginal effect values for unlabeled and GM products were not significantly
different among the three models specified. However, there was statistical significance among
the high frequency consumption respondents in the income groups. More specifically, a high
frequency consumer of edamame that is in the middle income group is willing to pay 68 cents
more than a participant in the low income group, and a participant in the high income group is
willing to pay 82 cents more than a participant in the low income group (Table 5) indicating a
positive income effect for high frequency consumers that was not statistically significant in the
model using all observations. Also, for each additional member of the household, a high
frequency consumer of edamame is willing to pay 40 cents less for edamame. Participants that
frequently consume edamame were thus possibly looking for quantity discounts. Participants
in the low frequency consumption group with high knowledge of GM foods bid 18 cents more
per correctly answered question based on the marginal effects. Providing consumer education
about GM technology may therefore lead to positive WTP effects.
The effect of overall impression on WTP
The overall impression of the two products in the sensory test was added to Eq. 2 to evaluate
the impact of sensory aspects on WTP. Table 6 shows the results of the two models estimated.

26
The GM edamame model had four statistically significant marginal effects: 1) household size
negatively affected bids suggesting again that participants looked for quantity discounts; 2) the
presence of children in the household, however, resulted in an increase in bids which may be a
result of participant awareness about health effects of edamame or participants being more
interested in buying edamame as their children like the product; 3) as expected, the opinion
rating about GM technology negatively impacted bids in the sense that those with a less
favorable attitude toward GM technology bid less that those with a more favorable inclination
toward GM products; and 4) the overall impression of the GM edamame in the sensory test had
a positive effect on WTP, was statistically significant at the p < 0.01 level and large. This may
suggest that participants were surprised that the GM product was similar in taste to the non-GM
product.
For the second model evaluating overall impression ratings on non-GM edamame, the
coefficient estimate on the NOGMLIKE was not statistically significant, of the anticipated sign
and much smaller than for GMLIKE, the GM counterpart. This result strengthens the claim that
participants may have had a preconceived notion about non-GM edamame in the sense that
overall impression did not impact WTP. Consumer acceptance of edamame as revealed in the
statistically significant premium for those consumers eating edamame on a frequent basis may
have absorbed the effect of overall impression on WTP.
Discussion
To determine the effects of GM labeling, a sensory test, followed by a non-hypothetical auction
and a questionnaire, were used to elicit effects on WTP for edamame. The results showed that
in the presence of labeled non-GM product, an unlabeled product would be valued similarly as
a GM labeled product. It is therefore in the interest of the producer to label edamame, as all US

27
produced edamame sold in the US is non-GM. This holds as long as the premium is higher
than the labeling cost (easily so in this case). Further, the findings of a non-GM premium were
the same across all subgroups tested (e.g., all vs. high consumption vs. low consumption as
well as participant groups separated by gender, education and income level). This finding has
significant implications for GM labeling policy since presence of credible non-GM labeling
would generally mean that an unlabeled or GM product counterpart would be significantly
discounted in the market. This finding is similar to Huffman et al. (2003) were a 14% premium
for non-GM vegetable oil, tortilla chips and potatoes was found compared to the GM labeled
products. Likewise, in Lusk et al. (2001) a 25 cent per ounce premium was found for non-GM
corn chips.
Melton et al. (1996) showed that taste can positively influence participant preferences and bids.
Similar highly statistically significant results of large magnitude, albeit using overall
impression ratings, were found in this study for the GM edamame. For non-GM edamame,
however, the effect was much smaller and not statistically significant. Hypothesized
preconceived negative notions about consumer opinion on safety or nutrition associated with
GM are similar to findings of Lusk and Briggeman (2009) who suggest that GM labeling
effects had a more important impact on WTP than taste.
Conclusion
Given the significantly higher WTP values observed for non-GM labeled edamame compared
to GM-labeled edamame, producers may be advised to label edamame as non-GM, especially
since no GM edamame is currently available in the US market. At the same time, the added
non-GM labeling could command a premium for the product as higher prices can be attached to
the product without modifying the product. Interestingly, additional results suggest that

28
knowledge of and opinions about GM products showed weak statistically significant effects in
a direction that could lead to greater eventual acceptance of GM foods. Consumer education
about GM foods could thus potentially help lessen the negative WTP effects associated with
GM and unlabeled edamame in comparison to non-GM edamame.
Future work on this project will determine what type of information (positive or negative)
about GM edamame will influence consumer WTP across the three product categories. The
robustness of the findings could be improved with replication of the procedures in other areas
of the US, different countries, or over the course of time. A future study could also include a
group that did not participate in the sensory test. This would allow comparison of results to
determine if the sensory test had an impact on WTP.
Finally, with estimated retail price discounts for GM products, yield improvement with GM
edamame and likely, to a lesser extent, production cost savings in comparison to non-GM
edamame, are not expected to be large enough to justify GM edamame breeding efforts at this
time.

29
References
Baker, G. A., & Burnham T. A.. (2001). Consumer response to genetically modified foods: market segment analysis and implications for producers and policy makers. Journal of
Agricultural and Resource Economics, 26, 387-403.
Canavari, M., & Nayga, R. M. (2009). On consumers’ willingness to purchase nutritionally enhanced genetically modified food. Applied Economics, 41, 125–137.
Capra, C. M., Lanier M. F., & Meer, S. (2010). The effects of induced mood on bidding in random nth-price auctions. Journal of Economic Behavior and Organization, 75, 223–234.
Carlsson, F., & Martinsson, P. (2001). Do hypothetical and actual marginal willingness to pay differ in choice experiments? - Application to the valuation of the environment. Journal
of Environmental Economics and Management, 41, 179-192.
Carpenter, J. P., Harrison, G. W., & List J. A. (2005). Field experiments in economics: an introduction, Research in Experimental Economics. 10, 1-16.
Compusense® five Release 5.6., Compusense Inc., Guelph, ON, Canada. 2016.
Cummings, R. G., Harrison, G. W., & Rutström, E. E. (1995). Homegrown values and hypothetical surveys: Is the dichotomous choice approach incentive-compatible? American Economic Review, 85, 51-62.
Du, L. (2014). GMO labelling and the consumer’s right to know: a comparative review of the legal bases for the consumer’s right to genetically modified food labelling. McGill J.
Law Health, 8, 1–42.
European Commission Directorate-General for Research, (2010). EUR 24473 – A decade of EU-funded GMO research 2001-2010. European Commisssion, Communication Unit, Brussels, Belgium.
Fox, J. A., Shogren, J. F., Hayes, D. J., & Kliebenstein, J. B. (1998). CVM-X: Calibrating contingent values with experimental auction markets. American Journal of Agricultural
Economics, 80, 455-65.
Huffman, W. E., Shogren, J. F., Rousu, M., & Tengen, A. (2003). The value of consumers of genetically modified food labels in a market with diverse information: Evidence from experimental auctions. Journal of Agricultural and Resource Economics, 28, 481-502.
JMP®, Version 12. SAS Institute Inc., Cary, NC, 1989-2007.
Konovsky, J., Lumpkin, T. A., & Mcclary, D. (1994). Edamame : The vegetable soybean. Understanding the Japanese Food and Agrimarket: A Multifaceted Opportunity, 1988, 173 –181.
List, J. A., & Shogren, J. F. (1998). Calibration of the differences between actual and hypothetical valuations in a field experiment. Jounal of Ecoomic Behavior
Organization, 37, 193-205.

30
Lucht, J. M. (2015). Public acceptance of plant biotechnology and GM crops. Viruses, 7, 4254–4281.
Lusk, J. L. (2003). Using experimental auctions for marketing application: A discussion. Journal of Agricultural and Applied Economics, 35, 349-360.
Lusk, J. L., & Briggeman, B. C. (2009). Food values. American Journal of Agricultural
Economics, 91. 184-196.
Lusk, J. L., Daniel, M. S., Mark, D. R., & Lusk, C. L. (2001). Alternative calibration and auction institutions for predicting consumer willingness to pay for nongenetically modified corn chips. Journal of Agricultural and Resource Economics, 26, 40-57.
Lusk, J. L., Feldkamp, T., & Schroeder, T. C. (2004). Experimental auction procedure: Impact on valuation of quality differentiated goods. American Journal of Agricultural
Economics, 86, 389-405.
Lusk, J. L., & Shogren, J. F. (2007). Experimental auctions. Methods and Applications in
Economic and Marketing Research. United Kingdom: Cambridge Univeristy Press.
McBryde, J. (2014). Arkansas first state to grow edamame commercially. Farm Flavor. Arkansas Agriculture Department, <http://farmflavor.com/us-ag/30rkansas/top-crops-arkansas/snacking-on-soy-arkansas-grows-edamame-commercially> Accessed Feb 4, 2016.
Melton, B. E., Huffman, W. E., Shogren. J. F., & Fox. J. A. (1996). Consumer preferences for fresh food items with multiple quality attributes: Evidence from an experimental auction of pork chops. American Journal of Agricultural Economics, 78, 916-923.
Mozzoni, L. A., Morawicki, R., & Chen, P. (2009). Canning of vegetable soybean: Procedures and quality evaluations. International Journal of Food Science and Technology, 44, 1125–1130.
Murphy, J. J., Allen, P. G., Stevens, T. H., & Weatherhead, D. (2005). A meta-analysis of hypothetical bias in stated preference valuation. Environmental and Resource
Economics, 30, 313-325.
Nalley, L., Popp M., Niederman, Z., & Thompson, J. (2012). Greenhouse gas emissions labelling for produce: The case of biotech and conventional sweet corn. Journal of
Food Distribution Research, 43, 43-60.
Norsworthy, J. K., Riar, D., Jha, P., & Scott, R. C. (2011). Confirmation, control, and physiology of glyphosate-resistant giant ragweed (Ambrosia trifida) in Arkansas. Weed
Technology, 25, 430-455.
Pifer, R. (Producer). (2014). Mandatory GMO Labeling Laws: Overview and Status of Current
Legal Issues. [Powerpoint Slides & Video webinar]. retrieved from http://nationalaglawcenter.org/consortium/gmolabelingwebinar/
Riar, S. D., Norsworthy, J. K., Johnson, D. B., Scott, R. C., & Bagavathiannan, M. (2011). Glyphosate resistance in a johnsongrass (Sorghum halepense) biotype from Arkansas. Weed Science, 59, 299-304.

31
Ronald, P. (2011). Plant genetics, sustainable agriculture and global food security. Genetics, 188, 11–20.
Roseboro, K. (2012). Edamame offers good non-GMO opportunities for U.S. farmers. The organic and non-GMO Report. <http://www.non-gmoreport.com/articles/april2012/edamame-non-gmo-us-farmers.php.> . Accessed Jan 29, 2016.
Schott, L., & Bernard, J. C. (2015). Comparing consumer’s willingness to pay for conventional, non- certified organic and organic milk from small and large farms, Journal of Food
Distribution Research, 46, 186–205.
Shogren, J. F., Cho, S., Koo, C., List, J., Park, C., Polo, P., & Wilhelmi, R. (2001a). Auction mechanisms and the measurement of WTP and WTA. Resource and Energy Economics, 23, 97–109.
Shogren, J. F., Margolis, M, Koo, C., & List, J. A. (2001b). A random nth-price auction. Journal of Economic Behavior and Organization, 46, 409–421.
Silva, A., Nayga, R. M., Campbell, B. L., & Park, J. L. (2011). Revisiting cheap talk with new evidence from a field experiment. Journal of Agricultural and Resource Economics, 36, 280–291.
Spector, P.E. (1992). Summated rating scale construction: An Introduction. Newbury Park, California: SAGE Publications.
StataCorp. (2013). Stata Statistical Software: Release 13. College Station, TX: StataCorp LP.
United States Food and Drug Administration (FDA). (Nov. 2015). Food from genetically engineered plants. <http://www.fda.gov/Food/FoodScienceResearch/GEPlants/default.htm> Accessed Feb 3, 2016.
World Health Organization (WHO), (2014). Frequently asked questions on genetically modified foods. <http://www.who.int/foodsafety/areas_work/food-technology/faq-genetically-modified-food/en/>. Accessed Feb 20, 2016.
Wszelaki, A. L., Delwiche, J. F., Walker, S. D., Liggett, R. E., Miller, S. A., & Kleinhenz, M. D., (2005). Consumer liking and descriptive analysis of six varieties of organically grown edamame-type soybean. Food Quality and Preference, 16, 651–658.
Zang, Y., Sato, H., & Igarashi, K. (2011). Anti-diabetic effects of a kaempferol glycoside-rich fraction from unripe soybean (Edamame, Glycine max L. Merrill. “Jindai”) Leaves on KK-Ay Mice. Bioscience, Biotechnology, and Biochemistry, 75, 1677–1684.

32
Table 1. Comparisons of three auctions types, BDM, Vickery’s Second Price Auction, and Random nth Price Auction.
Auction Type BDM Vickery’s Second-
Price
Random nth Price
Procedures: Individual participants
submit a bid. If bid > market price, pay market price
Simultaneous bids are collected from each participant. Highest bidder pays market price
Simultaneous bids are collected from each participant, if bid > market price, pay market price
Market Price: Price is randomly selected
Second highest bid. Random n is chosen, the nth highest bid is the market price
Winners: Each individual has an opportunity to win
1 n - 1
Strengths Ability to test consumer’s in natural settings (grocery stores)
Preparation for experiment is easy with only one product needed per session
Any bidder can influence the results of the auction. Everyone should feel engaged
Weaknesses Individuals do not get the opportunity to compete against each other
Low bidders know they will not influence the results
Very complex and take longer to sort bids. Amount of product needed is random.
Sources: Lusk and Shogren (2007) and Lusk (2003)

33
Table 2. Question used to form knowledge variable towards GM technology.
Question Truea False Not Sure
Planting RoundUp Ready® soybean allows farms to
grow soybean and spray RoundUp® herbicide to
control weeds without killing soybean whereas using
RoundUp® herbicide on conventional (Non-genetically
engineered soybean) would not only kill weeds but also
the conventional soybean.
● 1 o 0 o 0
Some soybean oil sold in the U.S. is derived from
Roundup Ready® soybean. ● 1 o 0 o 0
In addition to Roundup Ready® soybean, other
genetically engineered crops are currently grown in the
U.S. ● 1 o 0 o 0
Chemicals in RoundUp® herbicide remain effective for
weed control in the soil forever. o 0 ● 1 o 0
Notes: a The knowledge rating is the sum of correct answers. (4 being all correct and 0 being all
wrong).

34
Table 3. Question used to form opinion variable towards GM technology.
Questiona
Strongly
Agreeb
Somewhat
Agree
Somewhat
Disagree
Strongly
Disagree
Genetically engineered food such as
Roundup Ready® Soybeans present no
danger for future generations. o 1 ● 2 o 3 o 4
I think it is safe for me to eat genetically
engineered food. o 1 o 2 ● 3 o 4
Physical harm to mankind is bound to
happen as a result of genetically
engineered foods. o 4 o 3 ● 2 o 1
Growing genetically engineered crops will
be harmful to the environment. ● 4 o 3 o 2 o 1
There are benefits to developing
genetically engineered foods such as
higher yields and a more sustainable food
source.
o 1 o 2 ● 3 o 4
Small-scale farmers are negatively
impacted by the development of
genetically engineered foods as the cost of
seed will be higher.
o 4 o 2 o 3 ● 1
Notes: a Information about the knowledge statements was sourced from Riar et al. (2011),
Norsworthy et al. (2011) and Nalley et al. (2012). b The opinion score is the average of values assigned to each of the agreement levels for each
statement. The score represents a summary of all rankings for each statement. Note that some statements are reverse scored to reflect a consistent estimate of concerns over genetically engineered food (Spector, 1992). Participants with an average opinion score of 1 are in favor of genetically engineered food whereas a score of 4 reveals the opposite.

35
Table 4. Summary of variables for all responses vs. high (> 10 times per quarter) and low (<= 10 times) edamame consumption.
All High Consumption Low Consumption
Variable Definition Mean Range Mean Range Mean Range
Gender (FEMALE) 1 if female, 0 if male 0.748 0.714 0.773 Age (AGE) Age in years 38.59 25-54 39.38 28-54 38.02 25-54
Less than Bachelor’s Degree Baseline 0.496 0.510 0.485 Bachelor’s Degree
(EDUC BA)
1 if Bachelor’s Degree earned; 0 otherwise 0.252 0.286 0.227
Graduate Degree
(EDUC MS)
1 if MS Degree or higher; 0 otherwise 0.252 0.204 0.288
Up to $2,999 per month Baseline 0.396 0.240 0.500 $3,000-$5,999 (INC MID) 1 if $3,000-$5,999; 0 otherwise 0.421 0.480 0.375
More than $6,000
(INC HIGH)
1 if More than $6,000; 0 otherwise
0.193 0.280 0.125
Children
(CHILD)
1 if children < 18 years old living at home; 0 otherwise
0.496 0.592 0.424
Knowledge (KNOW) See Table 2 2.27 0-4 2.28 0-4 2.27 0-4
Opinion (OPINION) See Table 3 2.58 1.3-4 2.61 1.7–4 2.55 1.3-3.7
Number in Household (HHS) # of people living in house 2.79 1-7 3.20 1-7 2.49 1-5
Consumption Frequency
(CONSUMP HIGH)
1 if more than 10 servings per quarter; 0 otherwise .427 0 1
Overall Impression
(GMLIKE)
(NOGMLIKE)
1 if dislike extremely to 9 like extremely
6.26 6.07
2-9 2-9 na na
Number of observations 117 50 67

36
Table 5. Average marginal effects of the TOBIT model by consumption frequency. All responses vs. high (> 10 times per quarter) and low (<= 10 times) edamame consumption.
All
(N = 117) High Consumption
(N = 50) Low Consumption
(N = 67)
Variablesa MEb
(dy/dx) p-value ME
(dy/dx) p-value ME
(dy/dx) p-value
FEMALE -0.030 0.892 -0.069 0.831 0.039 0.885 AGE -0.005 0.701 -0.008 0.702 0.006 0.659
EDUC BA 0.004 0.988 -0.588 0.085* 0.589 0.112
EDUC MS -0.213 0.371 -0.422 0.290 -0.161 0.566
INC MID 0.218 0.341 0.683 0.035** -0.090 0.749
INC HIGH 0.064 0.823 0.824 0.029** -0.631 0.047**
CHILD 0.307 0.249 0.816 0.071* -0.017 0.954
KNOWc 0.043 0.596 -0.178 0.159 0.187 0.073*
OPINIONc -0.177 0.379 0.049 0.872 -0.117 0.664
HHS -0.173 0.101 -0.406 0.012** 0.005 0.971
CONSUMP HIGH 0.329 0.103
GM 0.003 0.962 -0.165 0.107 0.119 0.162
NOGM 0.427 0.000***,
d 0.442 0.000*** 0.428 0.000***
Notes: a See Table 4 for variable descriptions b Marginal effects are the partial derivative of WTP with respect to X from Eq. 2. c See Tables 2 and 3 for knowledge and opinion variables. d *, ** and *** represent statistical significance at p < 0.10, p < 0.05, and p < 0.01,
respectively.

37
Table 6. Average marginal effects of the TOBIT model by Genetically Modified (GM) and non-GM product including overall impression obtained in the sensory test.
GM Edamame
(N = 117) Non-GM Edamame
(N = 117)
Variablesa MEb
(dy/dx) p-value ME
(dy/dx) p-value
FEMALE 0.090 0.680 -0.095 0.706 AGE -0.003 0.828 -0.010 0.483
EDUC BA 0.115 0.657 -0.083 0.775 EDUC MS -0.321 0.244 -0.321 0.247
INC MID 0.072 0.753 0.216 0.418
INC HIGH 0.126 0.676 0.070 0.837
CHILD 0.525 0.053* 0.077 0.802
KNOWc 0.049 0.552 0.033 0.729
OPINIONc -0.355 0.078*, d 0.083 0.722
HHS -0.177 0.100* -0.140 0.248
CONSUMP HIGH -0.045 0.823 0.425 0.064*
GMLIKE 0.257 0.000*** na na NOGMLIKE na na 0.030 0.700
Notes: a See Table 4 for variable descriptions b Marginal effects are the partial derivative of WTP with respect to X from Eq. 2. c See Tables 2 and 3 for knowledge and opinion variables. d *, ** and *** represent statistical significance at p < 0.10, p < 0.05, and p < 0.01,
respectively.

38
Figure 1. Mean comparison of hedonic impression for the two edamame samples labeled with genetically modified (GM) edamame and non-GM edamame.
4.5
5
5.5
6
6.5Appearance
Aroma
TextureFlavor
Overall
Impression
GM
non-GM
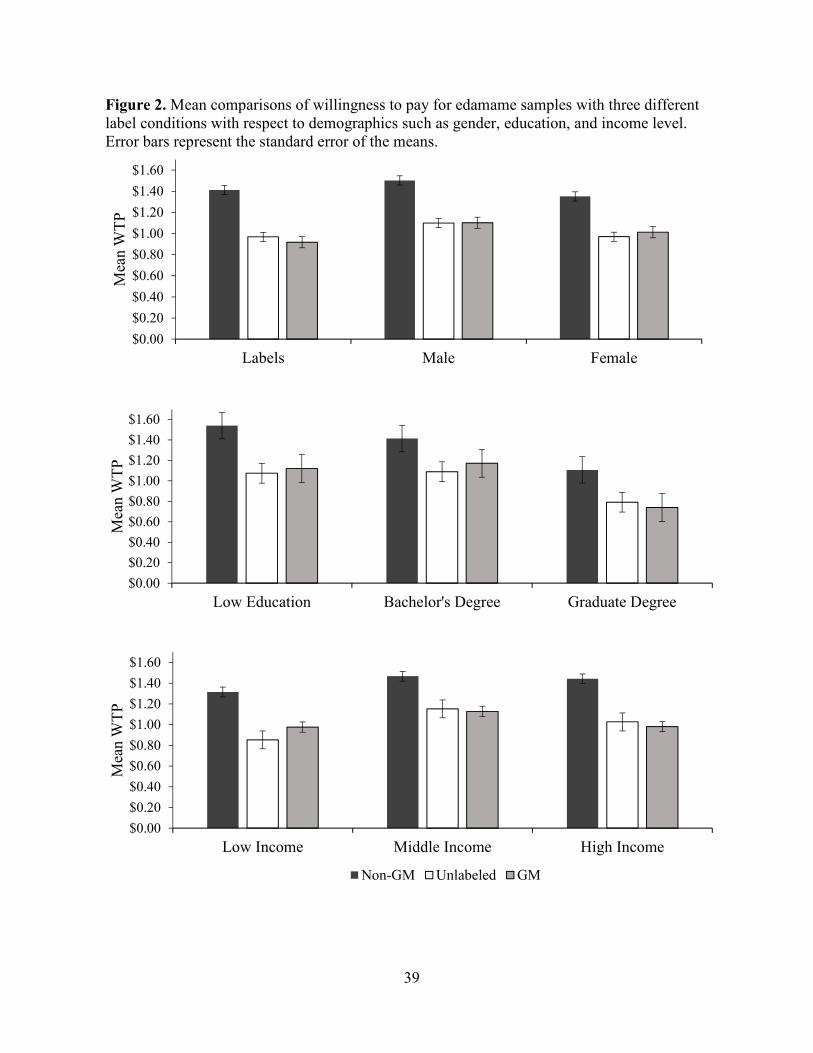
39
Figure 2. Mean comparisons of willingness to pay for edamame samples with three different label conditions with respect to demographics such as gender, education, and income level. Error bars represent the standard error of the means.
$0.00
$0.20
$0.40
$0.60
$0.80
$1.00
$1.20
$1.40
$1.60
Labels Male Female
Mea
n W
TP
$0.00
$0.20
$0.40
$0.60
$0.80
$1.00
$1.20
$1.40
$1.60
Low Education Bachelor's Degree Graduate Degree
Mea
n W
TP
$0.00
$0.20
$0.40
$0.60
$0.80
$1.00
$1.20
$1.40
$1.60
Low Income Middle Income High Income
Mea
n W
TP
Non-GM Unlabeled GM

40
Chapter 3
Willingness to Pay for Edamame: GM Technology, Message Type and Order Effects
By
Elijah Wolfe, Michael Popp, Claudia Bazzani, Rodolfo M. Nayga, Jr., Diana Danforth,
Jennie Popp, Pengyin Chen, and Han-Seok Seo

41
II. Willingness to Pay for Edamame: GM Technology, Message Type and Order Effects
Abstract
With debate over mandatory genetically modified (GM)-labeling intensifying, decision makers
need information on how people will react to different messages and whether the order of
receiving positive or negative information on GM technology impacts their willingness to pay
(WTP). In this study, WTP for GM, non-GM and unlabeled edamame are compared to
examine this issue using a non-hypothetical, random nth price auction. Participants in the study
were randomly assigned to two treatments: one where the positive information is presented
before the negative information and another where the negative information is presented before
the positive information. The WTP for edamame with a non-GM label was not statistically
significantly influenced by the positive or negative information concerning GM technology.
However, the WTP for both unlabeled and GM-labeled products declined with negative
information about GM that outweighed any positive information. A large marginal effect of
consumer opinion toward GM technology suggested that educational efforts on GM technology
is needed and may be targeted toward women and younger target audiences.

42
Introduction
Information about new and existing technologies can influence consumer viewpoints and their
purchasing behavior. Currently, there are a lot of negative messages about genetically
modified (GM) foods in the popular press and positive messages from agricultural biotech
stakeholders. When introducing new products in such an environment, the question of whether
one should i) avoid a controversial issue in a product attribute and react to potential negative
backlash later or ii) confront the issue by providing positive information first and potentially
drawing negative attention to the issue, is often a difficult decision. Hence, information about
the impact of the order in which positive or negative messages is received can be helpful for
product managers facing this issue as it is uncertain how consumers will react to negative or
positive information. To that point, this study focuses on edamame, which is soybean
harvested at the pod filling stage and consumed as a vegetable either as the seed or served as
the whole pod. Edamame has been experiencing recent sales growth in the US and is being
commercially processed in the US using exclusively non-GM edamame cultivars. Breeding
efforts toward GM edamame, to lower cost of production, increase yield, or enhance other
desirable product characteristics, have not led to GM edamame sales in the US as breeders,
processors, and retailers may be worried about potential GM backlash.
Wolfe et al. (2016) performed sensory analyses, a non-hypothetical, random nth price auction
and a follow up survey using 117 study participants to show that willingness to pay (WTP)
indeed declined for GM labeled and unlabeled edamame in comparison to non-GM labeled
edamame. They concluded that the price discount for GM labeled and unlabeled edamame was
large enough to discourage GM breeding efforts even though sensory evaluation of the GM and
non-GM edamame revealed no statistically significantly different results. With this GM label

43
effect present and consumers interested in knowing if their food was produced using GM
breeding techniques, the question then of whether to mandate GM labeling in the US is
controversial. Given that the FDA supports “voluntary labeling whether foods have or have
not been developed through genetic engineering, provided that such labeling is truthful and not
misleading” (FDA, 2015), the labeling issue for edamame is interesting as i) currently there are
no GM edamame varieties and adding a non-GM label would lead to needlessly higher prices
for consumers, at least in the short run; and ii) the product is a relatively newly introduced
vegetable product for US consumers. Wolfe et al.’s (2016) findings are consistent with other
GM label studies (Baker & Burnham, 2001; Huffman et al. 2003; Lusk et al. 2001) and hence,
the question of how information about GM technology could be used to i) alter WTP or ii)
reverse negative information effects on WTP by providing positive information about GM
technology, is an interesting issue.
Using a large scale US survey, the Pew Initiative on Food and Biotechnology (2001) found that
over half of the respondents had little experience talking about GM foods or biotechnology.
Findings such as this have influenced economists to conduct valuation experiments to test
whether consumer WTP values are influenced by information about GM technology given
during WTP experiments (e.g., Rousu et al. 2002; Lusk et al. 2004b; and Xie, Kim, and House,
2013). For example, Rousu et al. (2002) used different sets of positive information, negative
information, and both types of information to elicit WTP values for GM labeled oil, chips,
potatoes, and their unlabeled counterparts using a random nth price auction. The positive
message for GM technology created a small premium of less than 1% for the three GM labeled
products compared to the unlabeled products. GM labeled foods were discounted by 35%
relative to the unlabeled products when negative information was provided, however. The

44
combined information of positive and negative information decreased the discount for GM
labeled product from 35% to 22% (Rousu et al. 2004). Lusk et al. (2004b) also tested different
categories of positive information about GM technology with consumers in the US, UK, and
France. In their willingness to accept (WTA) study, the minimum amount of money needed for
participants to trade a non-GM cookie for a GM cookie was elicited. They found that in the
US, consumers from Texas, California, and Florida would trade their non-GM cookie for less
money after they received positive information than when they had not yet received the
information. For example, Texas participants decreased their WTA by 4% when given
information about the increase of food supply with GM technology. When presented with
environmental and health benefits of GM technology, the mean WTA for US participants
decreased by 46% and 40%, respectively. Likewise, an experiment about consumer, producer,
and environmental benefits on WTP for GM apples in a choice experiment (Xie, Kim, and
House, 2013) led to increases of $0.24, $0.88, and $1.21 per pound of apples, respectively,
when compared to uninformed bids.
In this study, the effect of positive and negative information about GM technology and the
order in which the information is presented is analyzed using participant bids for GM and non-
GM edamame. The objectives are i) to examine label effects on WTP (Unlabeled, GM, and
non-GM); ii) to determine how the positive and negative information provided influenced
consumer WTP after receiving no information; iii) compare consumer mean WTP across two
treatments that vary in order of information given; and iv) determine what explanatory factors
drive WTP when comparing the order of information treatments.

45
Materials and Methods
Before the experiment started, instructions were explained and participants were required to
sign an informed consent form. Once the experiment was completed, each participant was
given a $25 gift card as payment for the opportunity cost associated with spending time on the
experiment.
Participants
Participants were randomly recruited from a relatively large consumer profile database. The
only requirement for participants was that they have no soy allergies. A sensory test, the
auction and a follow-up survey were completed by 117 participants. Table 1 shows the
demographic profiles of the participants across the two information treatment groups in this
study.
Edamame sample and preparation
GM and non-GM soybeans, using cultivars exhibiting similar pod and seed size at the end of
the pod filling stage, were grown near the land grant university’s sensory research center and
were harvested at the edamame stage. Once harvested, the edamame was i) blanched at 100ºC
for 90 seconds to sufficiently inactivate lipoxygenase activity before packaging to keep the
edamame pods’ desirable green color and textural attributes (Mozzoni, Morawicki, & Chen
2009); ii) packaged in clear, 8 oz. (237 mL) bags containing approximately 40-50 pods; and iii)
vacuum sealed. The packages were then frozen and labeled as GM, non-GM, and unlabeled.
Unlabeled product was randomly filled with GM or non-GM edamame.
Valuation measure
Non-hypothetical auctions are now one of the most popular valuation methods used by applied
economists. These non-hypothetical auctions are often called incentive compatible and have

46
been studied in many experiments (Lusk, Feldkamp & Schroeder, 2004a; Cummings, Harrison,
& Rutström, 1995; Fox et al., 1998.; List & Shogren, 1998). In this study, we use the random
nth price auction because of its ability to keep off-margin bidders engaged (see Table 2). A
participant who does not feel that they have a chance of winning the auction is considered an
off-margin bidder (Shogren et al., 2001b). In a random nth price auction, everyone participating
places a confidential bid on the item or items being auctioned. The bids are then ranked from
highest to lowest. A random number (n) is selected by the experimenter, from 2 to the total
number of bidders in the auction. The nth highest price becomes the market price that anyone
who bids above it has to pay. Therefore, there are (n-1) winners. Further, if there are multiple
rounds and products in the auction, a binding round and a binding product can be selected to
keep participants from having to buy multiple products during multiple rounds. This broadens
the array of comparisons that can be performed and lessens wealth or demand reduction effects
associated with having to buy many products (Shogren et al. 2001a).
Procedure
A short summary of the experimental procedures was read aloud to the participants in each
session. Using a framework similar to Wszelaki et al.’s study (2005), the sensory test was
conducted first to allow each participant to taste the GM and non-GM edamame. All
participants received the two products individually in a sensory testing booth. Each sample
was served on a tray identified by a 3-digit randomized code with the “GM” or “non-GM” label
on the computer monitor in front of the participant. A hedonic impression was created for each
sample with respect to appearance, aroma, flavor, and textural attributes as well as an overall
impression rating on a 9-point hedonic scale ranging from 9 (like extremely) to 1 (dislike
extremely). A GM PREF variable was created by subtracting the non-GM overall impression

47
score from the GM overall impression rating (see Table 1) to include sensory information as an
explanatory variable for WTP.
Following the sensory test, a hypothetical candy bar auction and quiz were used as teaching
instruments before the random nth price auction of the unlabeled, non-GM, and GM edamame
products to make sure that all participants clearly understood the auction mechanism and
procedures. A candy bar auction, of the same format as the eventual edamame auction aside
from actual payment for and distribution of the candy bars, was used to help the participants
understand the procedures to enhance the likelihood of collecting accurate bids for the
edamame auction.
As depicted in Table 3, the participants were randomly assigned to two treatments. The random
nth price auction contained three rounds. Three products were simultaneously auctioned in each
round: unlabeled edamame, non-GM labeled edamame, and GM labeled edamame. In the first
treatment, no information was given in the first round (i.e., participants only were shown the
three products with no information provided), then positive information was given in the
second round, and then negative information was given in the third round. In the second
treatment, no information was given in the first round, then negative information was given in
the second round, and then positive information was given in the third round.. To avoid wealth
effects, one of the three products was randomly chosen as the binding product after the three
auction rounds. Similarly, one of the three rounds was randomly chosen as the binding round.
Hence, only the winners of the binding product in the binding round received and paid for the
binding product. As mentioned earlier, the price paid by the winners is the randomly chosen nth
highest bid for the binding product. This price was incentive compatible as the procedure
discouraged paying more than what a participant was willing to pay when bidding truthfully,

48
and, likewise, underbidding could lead to not obtaining the product at a profitable price (Capra,
Lainer, & Meet, 2010). While winners were only selected for one product and one round, all
bids were used as data for the WTP study. Since participants received positive or negative
information in the second and third rounds, the bids were expected to be influenced by
information effects. The effects of the information on WTP and the order of the information on
WTP were thus testable.
Follow-up survey
Demographic questions about gender, age, education level, presence of children in the
household, knowledge of GM foods, opinion on GM foods, number of people in the household,
and frequency of quarterly edamame consumption were collected after the auction was
complete using a paper survey. The questions used to measure knowledge of and opinions
about GM food are exhibited in Tables 4 and 5.
Data analysis
The auction produced a total of nine bids (3 products in 3 rounds) from each participant. Bids
with a value of zero were common either because the participant did not want the product, or
the participant was not interested in paying for the product during the auction. A random
effects Tobit model was used given the data were truncated at zero and of panel data in nature.
The model was designed to jointly test for statistical significance of the information between
the two information treatments (positive first and negative first) and impact of other
explanatory variables that were hypothesized to impact WTP. The �� denoted the bid for each
participant i = 1, 2, 3…, N:
�� = ���∗ �� �∗ > 00 �� �∗ ≤ 0

49
and ��∗ is the latent bid where observed values were greater than 0. Latent bids were regressed
against explanatory variables �� to measure their effect on bids
(1) ��∗ = �� + �� , ��~�(0, ��)
which can be expressed alternatively as follows for each of the three products:
(2) NOLABEL WTP = β0 + β1 POSITIVE + β2 NEGATIVE + β3 FEMALE + β4 AGE
+ β5 EDUC BA + β6 EDUC MS + β7 INC MID + β8 INC HIGH + β9 CHILD + β10
KNOW + β11 OPINION + β12 HHS + β13 CONSUMP HIGH + β14 GM PREF + ζ
(3) NO GM WTP = γ0 + γ1 POSITIVE + γ2 NEGATIVE + γ3 FEMALE + γ4 AGE
+ γ5 EDUC BA + γ6 EDUC MS + γ7 INC MID + γ8 INC HIGH + γ9 CHILD + γ10 KNOW
+ γ11 OPINION + γ12 HHS + γ13 CONSUMP HIGH + γ 14 GM PREF + ε
(4) GM WTP = ρ0 + ρ1 POSITIVE + ρ2 NEGATIVE + ρ3 FEMALE + ρ4 AGE + ρ5 EDUC
BA + ρ6 EDUC MS + ρ7 INC MID + ρ8 INC HIGH + ρ9 CHILD + ρ10 KNOW + ρ11
OPINION + ρ12 HHS + ρ13 CONSUMP HIGH + ρ14 GM PREF + λ
The ’s, γ’s, and ρ’s or the coefficients of the independent variables were converted into
marginal effects indicating the effect of a one unit change in X on WTP using STATA (StataIC
v.13, StataCorp LP. College Station, TX). Further, NOLABEL WTP, NO GM WTP, or GM
WTP were the latent bids or WTP for an 8 oz. package of frozen edamame which was

50
unlabeled or labeled non-GM and GM, respectively. The information treatment effect was
captured using binary variables of POSITVE and NEGATIVE as shown in Table 3.
Demographic variables, FEMALE, EDUC BA, EDUC MS, INC MID, INC HIGH, and CHILD
were binary 0/1 variables on gender, education level, income level, and presence or absence of
children in the household, respectively. Participant age, knowledge, opinion and household
size were measured using continuous variables AGE, KNOW (Table 4), OPINION (Table 5),
and HHS, respectively, while CONSUMP HIGH is a binary 0/1 variable concerning frequency
of consumption in the past three months, and GM PREF is a measure of differential overall
impression from the sensory test with positive/negative values indicating a preference for
GM/non-GM edamame, respectively. Error terms for each equation were ζ, ε, and λ.
Information about the explanatory variables is summarized in Table 1. Bids from each
treatment (positive first or negative first) were divided into their own models so a comparison
could be made across treatments. Hence, results of Eqs. 2 to 4 were separately summarized by
order of information to make comparisons across information treatment.
Results
Participant demographics
Statistical comparisons of subsamples of participants randomly assigned to the positive first or
negative first information treatments showed the subsamples to have the same characteristics
(Table 1) at p < 0.05. Hence, the randomization procedure appears to have successfully
balanced the observable covariates across the two treatments.

51
Effects of information on non-parametric average WTP by product
As mentioned above, the two treatments differed only in the order of information given before
the second and third rounds (Table 3). The unlabeled, non-GM labeled, and GM labeled
edamame product mean bids, with and without the zero bids, are reported in Figure 1.
Unlabeled
The unlabeled product had very irregular results as the positive information first treatment lead
to a reduction in WTP from 89 to 87 cents and increased back to 94 cents after negative
information was provided (Figure 1 including zero bids). For the negative information first
treatment, however, results were as expected and reduced WTP by 12 cents with negative
information. Subsequently adding positive information subtracted 2 cents (Figure 1 including
zero bids). These results are not unexpected as the participants did not know whether the
edamame in the package was in fact GM or non-GM. Similar irregular trends were observed
when zero bids were excluded. There were a total 135 zero bids across all rounds for unlabeled
edamame or approximately 38.5% of zero bids.
Non-GM
The non-GM edamame bids were the highest among the three products (Figure 1 both
including and excluding zero bids). Further, information about GM technology led to small
changes in mean bids. For example, in the negative information first treatment, the negative
information about GM technology led to only a 2 cent increase in WTP for non-GM labeled
edamame after the no information first round. The ensuing positive information in the third
round decreased bids by an average of 3 cents (Figure 1 including zero bids). For the positive
information first treatment, positive information about GM decreased WTP for non-GM
edamame by 5 cents whereas negative information led to a larger increase. The direction of

52
change was as expected as negative information about GM technology is expected to heighten
WTP for non-GM products. Information effects were larger in absolute terms for negative
information than for positive information. There were a total of 67 zero bids for non-GM
edamame or 19% of non-GM edamame bids, the lowest of the three products, signaling greater
acceptance of non-GM edamame compared to unlabeled and GM edamame.
GM
For GM edamame, the negative information reduced WTP by 26 and 20 cents for the negative
and positive information treatments, respectively (Figure 1 including zero bids). Hearing
negative news first thus had a greater impact than hearing it second. Positive information after
negative information added a 3 cent increase. Releasing positive information about GM
technology heightens awareness toward the GM technology attribute which may explain why 2
cent lower WTP bids were obtained for GM edamame after positive information was provided
compared to the no information first round (Figure 1 including zero bids). The following
negative information still lowered WTP. The total WTP reaction to information (after all 3
rounds of bidding) was a negative 23 cents for the negative information first treatment and 22
cents for the positive information first treatment suggesting that release of positive information
about a controversial issue marginally lessens the overall impact and that negative information
effects are difficult to reverse. Figure 1 excluding zero bids shows findings that were similar
and somewhat more consistent with a priori expectations with respect to the effect of positive
information first. There were a total of 148 zero bids for GM edamame or 42% of GM
edamame bids, the most of the three products, suggesting that participants were least
comfortable to bid on GM edamame.

53
Parametric Information Effects on WTP by order of information
The random effects Tobit analysis was used to determine the marginal effects of positive and
negative information treatments in different order of presentation. The signs of the marginal
effects and their statistical significance allowed the analysis of additive effects in comparison to
the no information first round bids..
Positive first
Positive information first treatment effects are shown in Table 6 and reveal no statistically
significant impacts of positive information across any of the products. The same held true for
negative information when provided for unlabeled and non-GM products. Negative
information did, however, statistically significantly lower GM edamame bids by 16 cents. This
suggests that participants may have had relatively strong a priori opinions about GM
technology, that the positive information was not strong enough to lead to anticipated results or
that negative information has a greater impact than positive information.
Negative first
Negative information first treatment effects are summarized in Table 7 and revealed more
statistically significant information treatment effects than the results in Table 6 with leading
positive information. Negative information had larger marginal effects that were statistically
significant for both unlabeled and GM edamame in comparison to Table 6 results. Positive
information effects were also statistically significant. While positive information dampened the
effects of negative information on GM edamame (the difference in WTP bids after information
are only 4.2 cents apart), adding GM technology information may have heightened the
awareness about GM issues and thereby led to declines in WTP. Lesser marginal information
effects for non-GM and unlabeled products are likely a function of GM technology not directly

54
affecting non-GM products and uncertainty about what kind of edamame product was in the
unlabeled package. Negative information about GM technology did boost the non-GM WTP
although not to a large degree and not statistically significantly so. The overall effect of adding
information about GM technology was more negative when negative information is provided
first.
Effects of demographic and other explanatory variables by order of information subsamples
Positive first
The presence of children in the household consistently increased WTP of unlabeled, non-GM,
and GM edamame, by $0.60, $0.48, and $0.62, respectively (Table 6). This suggests that
edamame is a product that children enjoy or that families with children in the household
perceive edamame to have good product attributes for their children. For unlabeled product,
household size had a negative impact on WTP which may be a function of budgetary
implications where participants are in search of a quantity discount. For GM edamame, female
participants bid significantly less than their male counterparts with similar signs on marginal
effects, albeit insignificant, for the other two products. This suggests that women are more
sensitive to the issue of GM technology than men when bidding on GM product. A similar
trend was observed for the AGE variable suggesting that marketing efforts toward edamame
may be more fruitful with a younger target audience. Finally, the strong statistically significant
and sizable effect on the OPINION variable (Tables 5 and 7) for GM edamame provides
justification that positive information about GM technology is needed to sway public opinion
toward greater acceptance of GM products if GM products are to gain traction with consumers
or marketers who are interested in selling GM product at a lesser discount to non-GM product.

55
Negative first
The OPINION variable again had the expected negative sign for unlabeled and GM edamame
and strengthens the contention that consumer information about GM technology may be needed
as relatively poor knowledge about GM technology was evident with participants answering
approximately 57% of questions correctly (Table 1). High frequency of consumption (over 10
servings per 3 months) reflects greater familiarity with edamame and thereby leads to increased
WTP. It may be that the CONSUMP HIGH variable captured most of the effect of overall
impression as the GM PREF variable did not lead to statistically significant findings.
Discussion
To determine the effects of order of information on GM labeling, a non-hypothetical auction
was conducted with three rounds of bidding with two order of information treatments. The
WTP data collected from the auction led to the conclusion that negative information about GM
technology had larger effects than positive information. Negative information has been found
by psychologists to have a greater influence on the human brain than positive information of
larger or equal magnitude (Ito et al. 1998) and hence the results reported herein are consistent
with this effect. Further, negative information led to price discounts where positive
information was insufficient to return bids to the point when they had not received any
information (Figure 1 and Table 7). Similar to multiple WTP studies of GM products, this
study also supports the contention that consumers will pay more money for a non-GM product
than a GM product (Baker & Burnham, 2001; Huffman et al., 2003; Lusk et al., 2001; Wolfe et
al., 2016; Xie, Kim, and House, 2013). Similar to these studies, non-GM labeled edamame was
valued higher than the unlabeled and GM labeled edamame products. Information about GM
technology bore no statistically significant effects on non-GM WTP although one of the

56
reasons consumers would prefer non-GM product over GM product is the absence of GM
technology.
Unlike Lusk et al. (2004b) and Rousu et al. (2004), the positive information used in this
experiment did not influence GM edamame WTP. In all positive information treatments in
Lusk et al. (2004b), the willingness to accept a GM cookie over a non-GM cookie was
increased by informing participants about either environmental, health, or third world benefits.
While negative information was not used in Lusk et al.’s (2004b) experiments, positive
information in this study did not statistically significantly increase WTP for GM edamame even
when positive information was provided first.
Positive marginal effects of consumer opinion on WTP regardless of product suggested that
swaying consumer opinion toward GM technology would be of interest as general know how
about the technology was modest. Aside from educational efforts toward informing consumers
about GM technology, the analysis also revealed gender and age effects. Female respondents
exhibited lesser WTP for GM edamame than males and younger participants revealed greater
WTP for GM edamame.
Level of education, income and overall impression score differences had no statistically
significant impact on WTP. These findings are similar to those reported by Wolfe et al. (2016)
who reported no significant differences in participant sensory evaluation of GM and non-GM
edamame.
Conclusion
An important finding in this analysis is the strength of negative information on consumer WTP.
Whether well founded or not, positive information about a controversial product attribute was
less powerful regardless of order of presentation. Product managers interested in finding an

57
answer on the order of information release, faced with marketing new products with a
potentially controversial product attribute, thereby face no easy solution. Informative and
positive, from a GM product manager’s perspective, is the positive and large effect of opinion
toward GM technology on WTP and the generally modest level of knowledge reflected in the
participant answers about GM technology. Research on how to modify consumer opinion
toward greater acceptance of GM, perhaps best targeted at a younger and female demographic,
could therefore bear fruit for product managers interested in selling GM foods.
Additional research is needed on the use of stronger emotional messages to convey positive and
negative information. The information provided in this experiment was targeted at production
and environmental effects of GM technology for edamame growers. It could have been
interesting to also test the effect of positive information that more directly involves consumers.
For example, it would be interesting for future studies to test the effect of a message about third
world countries’ yield improvements to aid world hunger and health benefits of nutritional
additions similar to golden rice (beta-carotene) that could reduce incidence of disease.

58
References
Baker, G. A., & Burnham T. A. (2001). Consumer response to genetically modified foods: market segment analysis and implications for producers and policy makers. Journal of
Agricultural and Resource Economics, 26, 387-403.
Capra, C. M., Lanier M. F., & Meer, S. (2010). The effects of induced mood on bidding in random nth-price auctions. Journal of Economic Behavior and Organization, 75, 223–234.
Cummings, R. G., Harrison, G. W., & Rutström, E. E. (1995). Homegrown values and hypothetical surveys: Is the dichotomous choice approach incentive-compatible? American Economic Review, 85, 51-62.
Fox, J. A., Shogren, J. F., Hayes, D. J., & Kliebenstein, J. B. (1998). CVM-X: Calibrating contingent values with experimental auction markets. American Journal of Agricultural
Economics, 80, 455-65.
Huffman, W. E., Shogren, J. F., Rousu, M., & Tengen, A. (2003). The value of consumers of genetically modified food labels in a market with diverse information: Evidence from experimental auctions. Journal of Agricultural and Resource Economics, 28, 481-502.
Ito, T. A., Larsen, J. T., Smith, N. K., & Cacioppo, J. T. (1998). Negative information weighs more heavily on the brain: The negativity bias in evaluative categorizations. Journal of
personality and social psychology, 75, 887.
Konovsky, J., Lumpkin, T. A., & Mcclary, D. (1994). Edamame : The vegetable soybean. Understanding the Japanese Food and Agrimarket: A Multifaceted Opportunity, 1988, 173 –181.
List, J. A., & Shogren, J. F. (1998). Calibration of the differences between actual and hypothetical valuations in a field experiment. Jounal of Ecoomic Behavior
Organization, 37, 193-205.
Lusk, J. L. (2003). Using experimental auctions for marketing application: A discussion. Journal of Agricultural and Applied Economics, 35, 349-360.
Lusk, J. L., Daniel, M. S., Mark, D. R., & Lusk, C. L. (2001). Alternative calibration and auction institutions for predicting consumer willingness to pay for nongenetically modified corn chips. Journal of Agricultural and Resource Economics, 26, 40-57.
Lusk, J. L., Feldkamp, T., & Schroeder, T. C. (2004a). Experimental auction procedure: Impact on valuation of quality differentiated goods. American Journal of Agricultural
Economics, 86, 389-405.
Lusk, J. L., House, L. O., Valli, C., Jaeger, S. R., Moore, M., Morrow, B., Morrow, J. L., & Traill, W. B. (2004b). Effect of information about benefits of biotechnology on consumer acceptance of genetically modified food: Evidence from experimental auctions in United States, England, and France. European Review of Agricultural
Economics, 31, 179-204.

59
Lusk, J. L., & Shogren, J. F. (2007). Experimental auctions: Methods and Applications in
Economic and Marketing Research. United Kingdom: Cambridge Univeristy Press.
Mozzoni, L. A., Morawicki, R., & Chen, P. (2009). Canning of vegetable soybean: Procedures and quality evaluations. International Journal of Food Science and Technology, 44, 1125–1130.
Nalley, L., Popp, M., Niederman, Z., & Thompson, J. (2012). Greenhouse gas emissions labeling for produce: The case of biotech and conventional sweet corn. Journal of
Food Distribution Research, 43, 43-60.
Norsworthy, J. K., Riar, D., Jha, P., & Scott, R. C. (2011). Confirmation, control, and physiology of glyphosate-resistant giant ragweed (Ambrosia trifida) in Arkansas. Weed
Technology, 25, 430-455.
Pew Initiative on Food and Biotechnology (2001). Pew Initiative on Food and Biotechnology finds public opinion about genetically modified foods ‘up for grabs’. March, 2001. Available at www.pewtrusts.com.
Pifer, R. (Producer). (2014). Mandatory GMO Labeling Laws: Overview and Status of Current
Legal Issues. [Powerpoint Slides & Video webinar]. Retrieved from http://nationalaglawcenter.org/consortium/gmolabelingwebinar/
Riar, S. D., Norsworthy, J. K., Johnson, D. B., Scott, R. C., & Bagavathiannan, M. (2011). Glyphosate resistance in a johnsongrass (Sorghum halepense) biotype from Arkansas. Weed Science, 59, 299-304.
Rousu, M., Huffman, W. E., Shogren, J. F., & Tegene, A. (2002). The value of verifiable information in a controversial market: evidence from lab auctions of geeically modified foods. Department of Economics Series, Working Paper 02003, Ames, IA: Iowa State University.
Shogren, J. F., Margolis, M, Koo, C., & List, J. A. (2001b). A random nth-price auction. Journal of Economic Behavior and Organization, 46, 409–421.
Shogren, J. F., Cho, S., Koo, C., List, J., Park, C., Polo, P., & Wilhelmi, R. (2001a). Auction mechanisms and the measurement of WTP and WTA. Resource and Energy Economics, 23, 97–109.
StataCorp. (2013). Stata Statistical Software: Release 13. College Station, TX: StataCorp LP.
United States Food and Drug Administration (FDA). (Nov. 2015). Food from Genetically Engineered Plants. <http://www.fda.gov/Food/FoodScienceResearch/GEPlants/default.htm> Accessed Feb 3, 2016.
Wolfe, E., Popp, M., Bazzani, C., Nayga Jr., R. M., Popp, J., Seo, H., & Chen, P. (2016). Consumer willingness to pay for edamame with a genetically modified label. Journal
of International Consumer Studies. Under review.

60
Wszelaki, A. L., Delwiche, J. F., Walker, S. D., Liggett, R. E., Miller, S. A., & Kleinhenz, M. D., (2005). Consumer liking and descriptive analysis of six varieties of organically grown edamame-type soybean. Food Quality and Preference, 16, 651–658.
Xie, J., Kim, H., & House, L. (2013). Valuing Information on GM foods in the presence of Country-of-Orgin Labels. International Journal on Food System Dynamics, 4. 170-183

61
Table 1. Socio-demographic characteristics of the sample.
Positive
Treatment Negative Treatment Statistics
Gender (FEMALE)
Male (0) 20% 30% Pearson χ2 (1) = 1.522
Female (1) 80% 70% p-value = 0.217
Age (AGE) t-value = 0.1094
Mean Age 38.63 38.54 p-value = 0.475
Education (1 if true, 0 otherwise)
Less than Bachelor’s degree 52% 47% Pearson χ2 (2) = 0.844
Bachelor's degree (EDUC BA) 27% 24% p-value = 0.656 Master's degree or higher (EDUC MS)
22% 29%
Income (1 if true, 0 otherwise)
Less than $2,999 per month 33% 44% Pearson χ2 (2) = 2.023
$3,000 - $5,999 (INC MID) 43% 41% p-value = 0.364
More than $6,000 (INC HIGH) 23% 15%
Children (CHILD) Pearson χ2 (1) = 1.482 Presence of < 18 year old in the household (yes = 1, no = 0) 43% 55% p-value = 0..223
Knowledge Ratinga (KNOW) Pearson χ2 (4) = 7.245 True/False mean score (0 - 4) 2.32 2.23 p-value = 0.123
Opinion Ratinga (OPINION) Pearson χ2 (14) = 12.935 Rating from 1 to 4 (low score = GM friendly) 2.54 2.61 p-value = 0.532
Household Size (HHS) Pearson χ2 (5) = 5.855
Number of people living in house 2.71 2.87 p-value = 0.321
Consumption (CONSUMP HIGH)
>10 servings per quarter (1) 39% 47% Pearson χ2 (1) = 0.778
<=10 servings per quarter (0) 61% 53% p-value = 0.378
GM Preference (GM PREF) Pearson χ2 (10) = 14.737 Mean of GM minus non-GM overall impression rating
-0.09 0.45 p-value = 0.142
Notes: a See Table 4 and 5 for knowledge and opinion variables

62
Table 2. Comparisons of three auctions types, BDM, Vickery’s Second Price Auction, and Random nth Price Auction.
Auction Type BDM Vickery’s Second-
Price
Random nth Price
Procedures: Individual participants
submit a bid. If bid > market price, pay market price
Simultaneous bids are collected from each participant. Highest bidder pays market price
Simultaneous bids are collected from each participant, if bid > market price, pay market price
Market Price: Price is randomly selected
Second highest bid. Random n is chosen, the nth highest bid is the market price
Winners: Each individual has an opportunity to win
1 n - 1
Strengths Ability to test consumer’s in natural settings (grocery stores)
Preparation for experiment is easy with only one product needed per session
Any bidder can influence the results of the auction. Everyone should feel engaged
Weaknesses Individuals do not get the opportunity to compete against each other
Low bidders know they will not influence the results
Very complex and take longer to sort bids. Amount of product needed is random.
Sources: Lusk and Shogren (2007) and Lusk (2003)

63
Table 3. Information treatments
Treatment 1 – Positive First
� Round 1 – No information � Round 2 – Positive information � Round 3 – Negative information
Treatment 2 – Negative First
� Round 1 – No information � Round 2 – Negative information � Round 3 – Positive information
Positive Information a – POSITIVE
Genetically engineered soybean food products are cheaper to produce as more effective herbicides can be sprayed over a larger window of time. This leads to higher yields and greater producer flexibility in managing production. It also lessens the amount of resources needed per amount of edible food as fewer inputs are needed. This helps lower the carbon footprint of edamame.
Negative Information b – NEGATIVE
Today’s use of genetically engineered seed allows producers to apply herbicides to control weeds that would normally also kill soybeans. An unintended side effect of this technology has been the growing weed tolerance to these herbicides as well. As a result, farmers now use more herbicide and also pay higher prices for biotech seed causing their profit margins to decline.
Sources: a (Nalley et al. 2012) b (Norsworthy et al. 2011: Riar et al. 2011)

64
Table 4. Question used to form knowledge variable towards GM technology.
Question Truea False Not Sure
Planting RoundUp Ready® soybean allows farms to
grow soybean and spray RoundUp® herbicide to
control weeds without killing soybean whereas using
RoundUp® herbicide on conventional (Non-genetically
engineered soybean) would not only kill weeds but also
the conventional soybean.
● 1 o 0 o 0
Some soybean oil sold in the U.S. is derived from
Roundup Ready® soybean. ● 1 o 0 o 0
In addition to Roundup Ready® soybean, other
genetically engineered crops are currently grown in the
U.S.
● 1 o 0 o 0
Chemicals in RoundUp® herbicide remain effective for
weed control in the soil forever. o 0 ● 1 o 0
Notes: a The knowledge rating is the sum of correct answers. (4 being all correct and 0 being all
wrong).

65
Table 5. Question used to form opinion variable towards GM technology.
Questiona
Strongly
Agreeb
Somewhat
Agree
Somewhat
Disagree
Strongly
Disagree
Genetically engineered food such as
Roundup Ready® Soybeans present no
danger for future generations. o 1 ● 2 o 3 o 4
I think it is safe for me to eat genetically
engineered food. o 1 o 2 ● 3 o 4
Physical harm to mankind is bound to
happen as a result of genetically
engineered foods. o 4 o 3 ● 2 o 1
Growing genetically engineered crops will
be harmful to the environment. ● 4 o 3 o 2 o 1
There are benefits to developing
genetically engineered foods such as higher
yields and a more sustainable food source. o 1 o 2 ● 3 o 4
Small-scale farmers are negatively
impacted by the development of
genetically engineered foods as the cost of
seed will be higher.
o 4 o 2 o 3 ● 1
Notes: a Information about the knowledge statements was sourced from Riar et al. (2011),
Norsworthy et al. (2011) and Nalley et al. (2012). b The opinion score is the average of values assigned to each of the agreement levels for each
statement. The score represents a summary of all rankings for each statement. Note that some statements are reverse scored to reflect a consistent estimate of concerns over genetically engineered food (Spector, 1992). Participants with an average opinion score of 1 are in favor of genetically engineered food whereas a score of 4 reveals the opposite.

66
Table 6. Random effects Tobit analysis of three edamame products (Unlabeled, Non-GM, and GM) when positive information was provided first.
Explanatory Factora
Unlabeled Non-GM GM
ME (dy/dx)b p-value ME (dy/dx) p-value ME
(dy/dx) p-value
POSITIVE -0.057 0.249 -0.081 0.117 -0.057 0.302
NEGATIVE 0.053 0.294 0.015 0.777 -0.164***,c 0.003
FEMALE -0.183 0.604 -0.403 0.203 -0.593* 0.089
AGE -0.006 0.735 -0.009 0.623 -0.042** 0.011
EDUC BA -0.161 0.593 -0.126 0.728 -0.248 0.468
EDUC MS 0.008 0.982 -0.085 0.822 -0.383 0.201
INC MID 0.413 0.164 0.225 0.423 -0.194 0.579
INC HIGH -0.179 0.705 0.065 0.878 -0.302 0.453
CHILD 0.595** 0.034 0.477* 0.086 0.616* 0.068
KNOW 0.047 0.743 0.010 0.944 0.067 0.609
OPINION -0.052 0.840 -0.010 0.969 -0.617** 0.022
HHS -0.208* 0.093 -0.138 0.251 -0.002 0.989
CONSUMP HIGH 0.090 0.725 0.079 0.751 -0.370 0.183
GM PREF 0.056 0.500 -0.025 0.777 0.132 0.104
Notes found on following page

67
Table 7. Random effects Tobit analysis of three edamame products (Unlabeled, Non-GM, and GM) when negative information was provided first.
Explanatory Factor
Unlabeled Non-GM GM
ME (dy/dx) a p-value ME (dy/dx) p-value ME (dy/dx) p-value
NEGATIVE -0.124** 0.020 0.023 0.667 -0.270*** 0.001
POSITIVE -0.151***,b 0.005 -0.017 0.752 -0.228*** 0.004
FEMALE 0.014 0.965 -0.052 0.869 0.136 0.633
AGE 0.021 0.203 -0.002 0.908 0.019 0.234
EDUC BA 0.002 0.996 -0.142 0.698 -0.108 0.707
EDUC MS -0.179 0.591 -0.487 0.162 0.097 0.773
INC MID 0.315 0.322 0.113 0.699 0.266 0.341
INC HIGH 0.013 0.972 -0.084 0.813 0.046 0.893
CHILD -0.023 0.953 -0.331 0.396 -0.103 0.761
KNOW c 0.079 0.448 0.090 0.374 0.015 0.875
OPINION d -0.656** 0.014 -0.012 0.961 -0.548** 0.032
HHS -0.088 0.576 -0.040 0.813 -0.157 0.262
CONSUMP HIGH 0.786*** 0.004 0.483* 0.065 0.607** 0.016
GM PREF -0.106 0.137 -0.008 0.917 -0.032 0.639
Notes found on following page

68
Notes for Table 6 and Table 7:
a See variable descriptions in Tables 1 to 4. POSITIVE and NEGATIVE are order of information effects compared to the first round bids without information. FEMALE, AGE, EDUC, INC and CHID variables relate to participant gender, age, level of education, household income and presence or absence of children in the house, respectively. KNOW is the participant knowledge level about GM technology with a higher KNOW score reflecting greater knowledge. OPINION is the participant’s attitude score toward GM technology with a low value favoring GM technology and a high value reflecting anti-GM sentiment. HHS is the household size in number of consumers. CONSUMP HIGH reflects >10 servings of consumption per quarter and thereby familiarity and taste preference for edamame. GM
PREF is positive if the participant provided a higher overall impression score for GM than non-GM edamame and negative for the opposite case. b Marginal effects are the partial derivative of WTP with respect to X from Eqs. 2 to 4 using the 60 participants that received negative information first. c *, ** and *** represent statistical significance at p < 0.10, p < 0.05, and p < 0.01, respectively.

69
Figure 1. Mean comparisons of willingness to pay for edamame samples for unlabeled, Non-GM, and GM samples between positive first and negative first treatments including or excluding zero bids.
1.1
2
1.0
0
0.9
8
1.6
0
1.5
4
1.5
4
0.8
9
0.8
7
0.9
4
1.4
9
1.5
5
1.7
3
-$0.15
$0.35
$0.85
$1.35
$1.85
$2.35
Mea
n W
TP
Unlabeled
1 2 3 1 2 3
Including zero bids Excluding zero bids
1.5
2
1.5
4
1.5
1
1.8
2
1.8
5
1.8
4
1.2
8
1.2
3
1.3
8
1.6
2
1.5
6
1.7
4
$0.00
$0.50
$1.00
$1.50
$2.00
$2.50
$3.00
Mea
n W
TP
Non-GM
1 2 3 1 2 3
1.0
8
0.8
2
0.8
5
1.6
1
1.4
9
1.4
6
1.0
0
0.9
8
0.7
8
1.6
8
1.7
4
1.5
4
-$0.25
$0.25
$0.75
$1.25
$1.75
$2.25
$2.75
Mea
n W
TP
Bidding Rounds
Information Order Treatment Effect:
GM
Negative First Positive First
1 2 3 1 2 3

70
Chapter 4
IV. Conclusion
In Chapter 2, higher statistically significant WTP values were observed for non-GM labeled
edamame compared to GM-labeled edamame and unlabeled edamame. It is advised that
labeling edamame non-GM will allow producers to charge a premium over unlabeled and
potential GM edamame in US markets if study results are generalizable to the US population.
Consumer education about GM foods could potentially lessen the negative WTP effects
associated with GM and unlabeled edamame in comparison to non-GM edamame. Further,
results in Chapter 2 suggest that knowledge of and opinions about GM products showed weak
statistically significant effects in a direction that could lead to greater eventual acceptance of
GM foods. This finding was consistent with the literature and Chapter 3 that focused its
attention to the effects of information and order of information on the three differently labeled
edamame products. Finally, with estimated retail price discounts for GM products, yield
improvement with GM edamame and likely, to a lesser extent, production cost savings in
comparison to non-GM edamame, are not expected to be large enough to justify GM edamame
breeding efforts at this time.
Chapter 3 analyzed different information shocks in the positive and negative direction in two
different orders. Negative information was found to be the stronger based on the WTP
analysis. A controversial topic of GM technology attracted negative information to influence
the bids more than the positive information. A product manager that is looking for ways to
market GM foods is faces difficult circumstances because of the negative information’s effect
on WTP for GM products. Nonetheless, modifying opinion toward GM with information had

71
the desired effect on WTP and as such research to examine ways to best provide that
information is another research venue to pursue.
Limitations
The major limitation of this experiment was the size of the edamame pods. Restated from the
introduction, GM edamame is currently not grown in the market. However, GM and non-GM
field soybeans were harvested at the same time edamame should have been harvested. The two
products compared were identical except for the breeding techniques. If GM edamame was
actually grown and compared to non-GM edamame, one could make an assumption that similar
results would occur.
Another limitation to the experiment were the small sample size of 117 participants. A larger
sample in different areas could have resulted in a more thorough representation of consumer
WTP. Budget and time were the limitation.
Specifically in Chapter 2, doubling the sample size and adding a second non-sensory group
would allow analysis of the sensory test on WTP. Likewise in Chapter 3, different types of
messages could have been used. For example, a message about third world countries’ yield
improvements to aid world hunger and health benefits of nutritional additions similar to golden
rice (beta-carotene) that could reduce incidence of disease may lead to larger WTP effects
Future Research
This experiment added to the current literature by incorporating a sensory taste testing to an
non-hypothetical random nth price auction and survey to elicit WTP effects of GM labeling
jointly with information effects on an edible soybean product. The topic can be expanded
further with more types of information treatments and adding a non-tasting group to be
compared with the participants who tasted the products. Different labels could be investigated

72
in addition to GM and non-GM labels. Expanding the experiment to different food products
could potentially yield different results. Results may also differ if the study were conducted in
another geographic region using a different sample of participants. Should similar findings
result, the study results would be more generalizable to a great population of potential
edamame consumers.

73
Appendix
Appendix 1 – Informed Consent e-mail and Screening Survey
Appendix 2 – Edamame Questionnaire
Appendix 3 – IRB Approval Form

74
Appendix 1. Informed Consent e-mail and Screening Survey
Information Letter
Emailed to Food Science Database using Survey Monkey
Dear potential participants, The Sensory Science Laboratory (Department of Food Science) is conducting a research project on a food product.
The experiment will take 30 to 45 minutes. After completing both sensory testing and auction, you will receive a Wal-Mart gift card ($25). For the auction, you will be asked to bring some cash to buy a frozen food product for later in-home consumption. Please bring some cash and change (< $10).
Participation is voluntary. Even if you decide to participate, you may withdraw from the project at any time without giving a reason and without any academic penalty. Your decision to withdraw will have no negative consequences.
If you are interested in this study, please follow the link http://xxxxxx/xx/xx to register for a set of time slots for the sensory evalutaion and auction. You will be selected on a first-come first-serve basis for a particiaption time on August 20 or 21. If you have questions, please contact me at ([email protected]).
Thank you for considering this invitation, Elijah Wolfe AEAB Research Assistant
IRB #15-04-704 Approved: 07/31/2015 Expires: 06/08/2016

75
Recruitment Survey
Please complete all questions on this form.
1. Gender: □ Male □ Female 2. Age: ______________ years old 3. Ethnic background:
□ White / Caucasian □ Asian
□ Black / African American □ Native American
□ Hispanic / Latin American □ Others (Specify: ____________)
4. Food Allergy: Do you have any known allergies to foods or odors?
□ No
□ Yes (Specify:________________________).
5. Please select products you would not be willing to consume (check all that apply).
□ Tofu □ Bell Peppers
□ Chocolate □ Carrots
□ Edamame □ Milk
6. Are you unfamiliar with any of these products? Only select products that you have never
heard of.
□ Tofu □ Bell Peppers
□ Chocolate □ Carrots
□ Edamame □ Milk
7. Are you allergic to any of these products? Only select product you are allergic to.
□ Tofu □ Bell Peppers
□ Chocolate □ Carrots
□ Edamame □ Milk
8. Would you be available for the following time slots? (dates can be changed)
Thursday, August 20, 2015 Friday, August 21, 2015 □ 08:00 a.m. - 9:00 a.m. □ 09:00 a.m. - 10:00 a.m.
□ 10:00 a.m. - 11:00 a.m. □ 10:00 a.m. - 11:00 a.m. □ 11:00 a.m. - 12:00 p.m. □ 11:00 a.m. - 12:00 p.m. □ 12:00 p.m. - 1:00 p.m. □ 12:00 p.m. - 01:00 p.m.
□ 1:30 p.m. - 02:30 p.m.

76
Willingness to Pay for Edamame Soybean grown using different technology
Consent to Participate in a Research Study
Principal Researcher: Elijah Wolfe Faculty Advisor: Michael Popp
INVITATION TO PARTICIPATE
You are invited to participate in a research study about Edamame soybean. You are being asked to participate in this study because you have indicated no food allergies to Edamame or soy products
WHAT YOU SHOULD KNOW ABOUT THE RESEARCH STUDY
Who is the Principal Researcher? Elijah Wolfe. Graduate Research Assistant. Department of Agricultural Economics and Agribusiness. Who is the Faculty Advisor? Michael Popp. Professor. Department of Agricultural Economics and Agribusiness. What is the purpose of this research study?
The purpose of this study is to perform a sensory evaluation involving taste, smell, touch, sight and overall impression of Edamame soybean grown using different technology and determine associated willingness to pay for the Edamame products. Who will participate in this study?
120 panelist will be pre-screened through Survey Monkey to: i) attend an Edamame sensory evaluation; ii) actually bid on Edamame; and iii) fill out a survey. Participants will be screened to gain access to participants that have previously eaten Edamame products. Participants are adults 18 years or older and will be selected on a first-come, first-serve basis. What am I being asked to do?
Your participation will require the following:
• Sensory evaluation of three Edamame products.
• Cash auction bids on these three Edamame products (only randomly selected participants will actually pay for their bids).
What are the possible risks or discomforts?
Risk includes food allergies of the edible soybean food product Edamame. Participants will be asked to bid for Edamame, but can choose to bid zero if they do not want to pay for the Edamame. Participants have also been prescreened for Edamame allergies. What are the possible benefits of this study?
Results of this study will be used to assess the market for Edamame products.

77
How long will the study last? All sensory evaluations and auction experiments are scheduled for the period of Aug. 20 to 21, 2015 and will last approx. 30 minutes per group of participants. Will I receive compensation for my time and inconvenience if I choose to participate in this
study?
Using survey monkey the participants will chose a time slot of their choosing and receive a $25 Wal-Mart gift card at the completion of their sensory evaluation, survey completion and bidding process. Will I have to pay for anything?
An experimental auction will take place during your participation. Bids for three Edamame products will occur in three rounds. One of the rounds and one of the products will be selected as the binding product. Of the 15 prices bid, one of them will be randomly selected by a random Nth number. The Nth bid will become the market price for the Edamame. All participants who bid more than the market price will pay the market price for the binding Edamame product. Not everyone is guaranteed to walk out with an Edamame product. Only bidders who bid more than the randomly drawn market price for the binding product. No price ceiling will be included; however, at any time, you may choose to bid a zero amount if you truly do not wish to purchase the product at any price, so you will not be required to pay for anything unless you want to. However, even if you bid a price and it is not high enough, you will not receive Edamame and also not have to pay. What are the options if I do not want to be in the study?
If you do not wish to be in the study, you are free to leave. How will my confidentiality be protected?
All information will be kept confidential to the extent allowed by applicable State and Federal law. ID#’s of participants will be distributed at random at the onset of the experiment and records linking ID#’s to individual participants will not be kept except to record whether participants appeared for their assigned time slot. Will I know the results of the study? At the conclusion of the study you will have the right to request feedback about the results. You may contact the faculty advisor, Michael Popp. What do I do if I have questions about the research study?
You have the right to contact the Principal Researcher or Faculty Advisor as listed below for any concerns that you may have. Elijah Wolfe. Graduate Research Assistant. Department of Agricultural Economics and Agribusiness. [email protected]. Michael Popp. Professor. Department of Agricultural Economics and Agribusiness. [email protected].

78
You may also contact the University of Arkansas Research Compliance office listed below if you have questions about your rights as a participant, or to discuss any concerns about, or problems with the research. Ro Windwalker, CIP Institutional Review Board Coordinator, Research Compliance E-mail: [email protected] I have read the above statement and have been able to ask questions and express concerns, which have been satisfactorily responded to by the investigator. I understand the purpose of the study as well as the potential benefits and risks that are involved. I understand that participation is voluntary. I understand that significant new findings developed during this research will be shared with the participant. I understand that no rights have been waived by signing the consent form. I have been given a copy of the consent form. Signed: ____________________________ Date:_____________________
IRB #15-04-704 Approved: 07/31/2015
Expires: 06/08/2016

79
Appendix 2. Questionnaire
All of your responses will be kept confidential. Please circle the number to the left of the answer, if one is provided.
Edamame Consumption
Please circle the appropriate number (choose one) next to the response below: A1. How often did you eat edamame in the PAST THREE MONTHS?
0. Never 1. 1-5 times
2. 6-10 times 3. 11-15 times 4. 16 times or more
A2. How often did you buy edamame to prepare meals for your household in the PAST
THREE MONTHS (e.g. grocery store, farmer’s market)? 0. Never 1. 1-5 times
2. 6-10 times 3. 11-15 times 4. 16 times or more
A3. How many servings of edamame did you buy away-from-home for your household in
the PAST THREE MONTHS (e.g. restaurant)? 0. Never 1. 1-5 times
2. 6-10 times 3. 11-15 times
4. 16 times or more
Opinions about Genetically Engineered Food
Please circle the appropriate number (choose one) next to the response below: B1. Regarding genetically engineered food production technology used on farms, how
informed do you consider yourself? 0. Extremely well-informed 1. Well-informed
2. Somewhat informed 3. Not very informed 4. Not informed at all

80
B2. Regarding genetically engineered foods, how informed do you consider yourself? 0. Extremely well-informed 1. Well-informed
2. Somewhat informed 3. Not very informed 4. Not informed at all
B3. Planting RoundUp Ready® soybean allows farms to grow soybean and spray RoundUp®
herbicide to control weeds without killing soybean whereas using RoundUp® herbicide on conventional (non-genetically engineered soybean) would not only kill weeds but also the conventional soybean.
0. True 1. False 2. Not sure
B4. Some soybean oil sold in the U.S. is derived from Roundup Ready® soybean.
0. True 1. False 2. Not sure B5. In addition to Roundup Ready® soybean, other genetically engineered crops are currently
grown in the U.S.
0. True 1. False 2. Not sure B6. Chemicals in RoundUp® herbicide remain effective for weed control in the soil forever.
0. True 1. False 2. Not sure B7. Do you think you have eaten genetically engineered food in the past month? (don’t count today’s study)
1. Yes 2. No
B8. How much would you say you’ve heard or read about genetically engineered foods?
1. Nothing at all 2. Not much 3. Some 4. A great deal
B9. How often have you discussed genetically engineered foods?
1. Frequently (typically once or more often per week over the last year) 2. Occasionally (no more than once a month in the last year) 3. Only once or twice over the last year 4. Never

81
Question
Strongly
Agree
Somewhat
Agree
Somewhat
Disagree
Strongly
Disagree
B10. Genetically engineered food such as Roundup Ready® Soybeans present no danger for future generations.
o o o o
B11. I think it is safe for me to eat genetically engineered food.
o o o o
B12. Physical harm to mankind is bound to happen as a result of genetically engineered foods.
o o o o
B13. Growing genetically engineered crops will be harmful to the environment.
o o o o
B14. There are benefits to developing genetically engineered foods such as higher yields and a more sustainable food source.
o o o o
B15. Small-scale farmers are negatively impacted by the development of genetically engineered foods as the cost of seed will be higher.
o o o o
B16. Who would you trust the most to provide you information about genetically engineered
crops (Please circle THREE)? 1. Research institutions 2. Seed Technology Companies 3. FDA 4. Universities 5. Religious Groups 6. Media (Fox, CNN, etc) 7. Farmer groups 8. Non-GMO Project Groups 9. Social Media (Facebook, etc) 10. USDA 12. Friends and Family 11. Others (please specify) __________________________________
Your Information
C1. What is your gender? 0. Male 1. Female
C2. How old are you?
____ years old

82
C3. Are you a current University of Arkansas student? 0. No 1. Yes
C4. What is the highest education level you have completed?
0. Less than high school 1. High school/GED 2. Some college/2 year associate degree 3. Bachelor’s degree
4. Master’s degree 5. PhD 6. Other ______________
C5. What is your current employment status?
1. Employed part time (fewer than 40 hours per week) 2. Employed full time (40 or more hours per week) 3. Retired 4. Other (please specify): __________
Your Household Information
Depending on your situation, we would like you to think of your household as the person or persons who you are financially responsible for, including yourself, even if you are not a wage earner. C6. How many people, including yourself, are in the following age categories in your household?
Age 5 and younger ____ Age 6 to 17 ____ Age 18 to 39 ____ Age 40 to 54 ____ Age 55 and above ____
C7. How much money do you typically spend on groceries per week for your household?
0. None 1. $1-$50 per week 2. $51-$100 per week 3. $101-$200 per week 4. $201 or more per week
C8. How much do you typically spend on away-from-home food per week for your
household? 0. None 1. $1-$50 per week 2. $51-$100 per week 3. $101-$200 per week 4. $201 or more per week

83
C9. What is your total household monthly allowance and/or income before taxes from all
sources, including family or other sources of economic support that is used to support your household)?
0. Less than $999 5. $5,000 - $5,999 1. $1,000 - $1,999 6. $6,000 - $6,999 2. $2,000 - $2,999 7. $7,000 - $7,999 3. $3,000 - $3,999 8. More than $8,000 4. $4,000 - $4,999
C10. What percentage (%) of your total grocery purchase dollars are spent at the following stores?
____ Wal-Mart Supercenter ____ Harps/Price Cutter ____ Ozark Natural Foods ____ Sam’s Club ____ ALDI ____ Marvin’s Savers Club ____ Wal-Mart Neighborhood Market ____ Farmer’s Markets ____ List Others ____________
100%
C11. Please select how important each factor is to you in making a grocery purchase.
Factors
Not at all
Important
Slightly
Important
Moderately
Important
Very
Important
Extremely
Important
Appearance o o o o o
Brand o o o o o
Price o o o o o
Expiration Date o o o o o
Organic production o o o o o
Non GMO production o o o o o
Eco packaging/Recyclable o o o o o
Package Size o o o o o
Locally produced o o o o o

84
Appendix 3. IRB Approval Form