Embed Size (px)
Citation preview

Warsaw School of Economics
Consumer testing of pre-contractual and periodic ESG financial product information
November 2020
Marianna Cicirko Marcin Kawiński Janina Petelczyc

2
Contents Summary ............................................................................................................................................. 3
Introduction ......................................................................................................................................... 5
PART I - FOCUS GROUP INTERVIEW .................................................................................................... 6
Method ............................................................................................................................................ 6
Conclusions from the focus group................................................................................................... 6
Feedback on the mock-up of template B without a dashboard...................................................... 7
Feedback on the mock-up of template B with a dashboard ......................................................... 10
Feedback on the mock-up of template A ...................................................................................... 10
Part II - ON-LINE SURVEY ................................................................................................................... 12
Response ....................................................................................................................................... 12
Document A – Mock-up of pre-contractual template A ............................................................... 14
Document B – Mock-up of pre-contractual template B ................................................................ 18
Document C – Mock-up of periodic template B ............................................................................ 23
ANNEXES ............................................................................................................................................ 28
Document A – Mock-up of pre-contractual template A ............................................................... 29
Document B – Mock-up of pre-contractual template B ................................................................ 35
Document C – Mock-up of periodic template B............................................................................. 39
Document D – Mock-up of pre-contractual template B with dashboard ...................................... 43
Document E – On-line survey ........................................................................................................ 48

3
Summary
The present consumer testing of pre-contractual and periodic ESG financial product information was conducted by the Warsaw School of Economics in Poland in October 2020 and was the second study in this area conducted by the European Supervisory Authorities. It was contracted by EIOPA in order to widening the geographic scope (Poland) of the research conducted in September 2020 in the Netherlands by the European Supervisory Authorities in cooperation with the Netherlands Authority for the Financial Markets (AFM).
The consumer testing aimed at testing the draft pre-contractual and periodic templates developed for the draft Regulatory Technical Standards under article 8 and article 11 of the Sustainable Finance Disclosure Regulation.
The consumer testing focused on young people. The chosen group are students of the economic university, at a different level of education level (bachelor, master, doctoral). The research team decided to add a focus group interview, to deepen the perception of the examined documents, in addition to the on-line questionnaire, which was similar to the questionnaire conducted in the Netherlands, but in Polish and English (for international students).
The illustrative mock-ups used in the consumer testing are the filled in pre-contractual and periodic disclosure templates of products promoting Environmental and/or Social (E/S) characteristics (under Article 8 and Article 11 of the SFDR). The templates for the disclosure of products with a sustainable investment objective (Article 9) are very similar to those for the products promoting E/S characteristics and have not been included in the on-line survey.
The content displayed consisted of two different mock-ups of the pre-contractual and periodic templates developed for the Regulatory Technical Standards under article 8 and 11 of the Sustainable Finance Disclosure Regulation. Those mock-ups were updated versions from the ones used in the Netherlands, in which the feedback from the mock-ups tested in the Netherlands was taken into account and the complexity of the product had been increased. Two types of mock-ups were presented, mock-up A and mock-up B. In addition, the focus group also commented on mock-up B with a dashboard added at the beginning of the document.
The mock-ups presented an exchange traded fund (ETF) that invested in corporates with excellent Environmental, Social and Governance ratings while excluding issuers producing nuclear power, owning fossil fuel reserves, producing tobacco or military weapons as well as any company from the gambling sector. The product features from the mock-up presented at the consumer testing conducted in the Netherlands were amended. The former disclosed information for an exchange traded fund (ETF) that only excluded issuers that own solid fossil fuel reserves, while the mock-ups of the product used for this consumer testing excluded issuers from diverse sectors and in addition held the same securities in the same proportions as a certain stock market index.
With regards participation, 7 respondents participated in the focus group interview and 98 respondents replied to the on-line questionnaires. The documents presented are annexed to the Report.
The respondents of the focus group interviews generally did not know the concept of ESG before reading the documents. After reading the instructions, they understood what ESG stands for, which means that the introduction to the focus groups was well-written. With regards the feedback received on the mock-ups, some information seems difficult to be found by respondents in the documents due to sub-optimal visual clarity of the mock-ups. Icons are legible and were received positively, however not all of them evoke the planned connotations. Respondents recommended to use colours throughout the documents. The assets allocation chart is clear, but the table below the chart requires more precision. Sentences not closely related to economic and investment expressions are easy to

4
understand. However, the sentences that closely describe the investment rules are written in a language that requires higher economic knowledge. The explanatory notes are clear and are helpful to understand the text. The idea of adding a Layer 1 to the templates as a dashboard is perceived positively, but it needs to be more informative and transparent. Nonetheless the version of the mock-up with a dashboard presented to the focus group did not have an impact on respondents’ comprehension of the document.
Respondents of the survey had a generally positive impression of the templates, especially when it comes to the utility to take financial decisions (easy to understand) and get information on the environmental, social and governance aspects of the product. However, knowledge tests revealed relatively low scores, especially for the pre-contractual information. Respondents perceived the pre-contractual documents as too long and detailed. Icons are not clear and should be updated to be better understood. There are relatively considerable differences in perception between particular parts of documents.
With regards the choice between the two designs presented (mock-up A and mock-up B), respondents preferred template B, however they preferred the icons used in template A, as these seem more understandable and to better fit the sections, especially the icons for the Do Not Significant Harm section.
Both the qualitative and quantitative studies conducted show the room for substantial improvements, especially in the pre-contractual document. The consumer perspective is specific and retail investors require well-tailored information.

5
Introduction
The consumer testing of pre-contractual and periodic ESG financial product information was the second study in this area conducted for the assessment of the European Supervisory Authorities’ draft Regulatory Technical Standards under article 8, article 9 and article 11 of the Sustainable Finance Disclosure Regulation. The consumer testing was carried out by the Warsaw School of Economics (SGH) and was contracted by EIOPA. The Dutch financial supervisory authority [Netherlands Authority for the Financial Markets (AFM)] conducted the first study that provided much valuable information. After the first study, some changes were incorporated into the pre-contractual and periodic ESG financial product templates to improve them and address the comments received during the consumer testing in the Netherlands.
This second study aimed at widening the geographic scope (Poland) of the research and to focus on young people as target group. At the same time, the chosen group are students of the economic university, at a different level of education level (bachelor, master, doctoral). The research team decided to start the project with a focus study, in order to improve the survey questionnaire, but also to understand better the approach of respondents to ESG investments and their perception on the examined documents. One focus group study was hold, followed by an on-line survey, which were conducted using questionnaires delivered by EIOPA in two language versions; in Polish and English (for international students)1. The sample was under control in respect of different products information (assumed quota were 20% for pre-contractual template A, 40% for pre-contractual template B, and 40% periodic template B). In total, 98 respondents completed the on-line questionnaire (not completed responses were not counted).
The methodology of the research was prepared by the SGH team. The focus study was moderated by Janina Petelczyc. The survey description was provided by Marianna Cicirko. The project was coordinated by Marcin Kawiński ([email protected]).
1 There are around 12 000 students at Warsaw School of Economics.

6
PART I - FOCUS GROUP INTERVIEW
Method
The focus study was conducted on the 26th of October of 2020 on a group of 7 students of the Warsaw School of Economics (SGH). The focus research was conducted on-line, via MS Teams platform, due to the second wave of the covid-19 pandemic. The focus was recorded (with the consent of the participants) in order to facilitate later analysis. The level of economic knowledge of the students participating in the research differed because the group included both people who started their studies at SGH 4 weeks ago and students of the 2nd and 3rd year.
The focus was conducted in Polish, based on three versions of the mock-ups of the pre-contractual templates that are included in the Annex, translated into Polish, with Polish-speaking students:
• Mock-up of template B without dashboard (included as document B in the Annex)
• Mock-up of template B with dashboard and (included as document D in the Annex)
• Mock-up of template A (included as document A in the Annex)
The focus consisted of the following parts:
• The mock-up of template B (without dashboard) was presented. After reading its content, the students were asked to comment on its graphic design. The next questions concerned the icons. The research then focused on the comprehensibility of the text and the ability to quickly find specific information in it. Finally, the students were asked about the clarity of the definitions presented in the template.
• The next stage of the research was the presentation of mock-up of template B with a dashboard - the following discussion concerned only the dashboard.
• Finally, the mock-up of template A was presented to students. They were asked to evaluate the graphic design and the icons (including in comparison to the mock-up of template B).
Conclusions from the focus group
The respondents did not know the concept of ESG before reading the documents, after reading they already knew what it was about, which means that the introduction is well-written
• Mock-up of Template B without a dasboard: o It is too uniform graphically, packed into too wide blocks, readers can get lost o Some information seems difficult to find due to the lack of graphical clarity, clearer
sectioning and clearer separation of parts with explanatory notes. o Icons are legible and received positively, however it is recommended to change the icon
with a skull, as it might evoke different connotations than those intended. o If a colour was considered, it should be a slightly green colour, associated with
sustainable investment issues. The uniform grey colour makes the readers confused o The asset allocation chart is clear to respondents. o The table below the chart requires more clarity – adding edges would help and a better
indication of the unit used. o Sentences not closely related to economic and investment expressions are easy to
understand. However, the sentences that closely describe the investment rules are written in a language that requires higher economic knowledge.
o The explanatory notes are clear and are helpful to understand the text.
• Mock-up of Template B with a dashboard

7
o The idea of an introduction in the form of a dashboard is perceived positively. However, it needs to be more informative and transparent. Otherwise (like this one in its present form) it has no impact.
• Mock-up of Template A o The yellow colour was totally disapproved. A green colour associated with sustainability
issues would be better; the margin on the right should not be all in grey, but only those parts of it where the text is placed.
o It is clearer, sectioned, easier to find the information one is looking for. However its general aesthetic is not perceived positively.
o Icons are better, but their colours should be changed into green/grey
Please find below the details of the feedback provided by the focus group.
Feedback on the mock-up of template B without a dashboard
1. Graphic design
• Do you like the graphic design?
According to most of the respondents, the graphic design needs to be refined; the tables and paragraphs sometimes seem too large. Sometimes the answer fields (e.g. YES/NO questions) seem shifted. Because of the dispersion of the different elements of the document respondents don't always know where to start – whether by analysing a graphic or reading a table next to it. The majority of respondents indicated a general impression of disorder of the document. Comments given:
"graphics are not synchronised"
"I felt lost reading it, I do not know from which part to start with, there is no chronology"
• Can the graphs be considered to be clear? Is this document easy to read (in terms of graphic design)?
In general, the graphs were considered to be pleasant and aesthetic, and the text is well arranged (although one can get lost between tables, graphics and the main text). Students find it too black and white, a colour (preferably green) could be added to the icons. Respondents also added that although the scheme and graphs themselves seem to be quite clear (numbering helps), the fact that the information is repeated many times makes the reader feel lost despite the good graphs. Comments given:
"Graphics are pleasant and aesthetic, it looks good"
"well-arranged when it comes to the scheme, although maybe too black and white, difficult to track, the information repeats after 5-7 times, and it is no longer known at what stage the reader is"
"Colours could help to distinguish different parts"
"Green colour could be very useful, especially for the icons"
• Can you find the information easily?

8
Respondents were asked to assess whether they thought it would be easy for them to find information based on the graphs of the whole document (it was not a question of searching for specific information). Most found that the graphic design makes this task difficult, and the document looks like a uniform monotonous block of text. There are no underlines, no bold text that would make it easier to move around in the text. Comments given:
"The layout makes it difficult it is a uniform, monotonous, one large block of texts"
"Uniform block, no bold text or underlining"
• What would you change in the layout of this document?
The answers to this question were related to the previous ones. Students highlighted the need to increase the transparency of the text, to divide it into different structures, group it into sectors. Many people suggested adding a colour, especially green, which is associated with ESG. One person believed that more graphs could be included to better present the information. The text should be more intelligible.
2. Icons
Respondents were asked how they interpret the icons and whether the icons are helpful. Should the icons be changed or deleted?
The participants, in general, liked the icons, they said that the icons attract the attention of the reader, are aesthetic and minimalistic. Every person answering this question pointed out that icons should be part of the template; however, there is a need for colour.
"At the end, you don't pay so much attention to them, you don't want to follow them, the colour would be good to attract attention of the reader"
"They are too black and white"
"I would give colours to them to make them perfectly correspond to the sections"
"Everything is ok, only colours should be added"
The only icon that aroused consternation was the icon of a skull. According to the respondents, it should be replaced by a factory or other icon presenting industry, because the skull is associated more with toxic, highly poisonous substances. Comments given:
"a factory with chimneys would be better than the skull associated with nuclear weapons"
"a skull id something related to toxic substances it does not connect with the text"
3. Comprehensibility of the text
• The chart
The analysis began with a question about the asset allocation chart. According to respondents, the graph is transparent and understandable. Comments given:
"It's okay, it's a fairly simple distinction, consistent"
"Understandable, little data so ok"
"Easy to read and clear"
• The table

9
The participants of the focus group were asked how they interpret the table below the chart, and whether the chart allows to better understand the table. The table seemed generally understandable and consistent with the chart, although some graphical changes have been suggested: especially widening it, and introducing edges so that its individual elements do not merge. Respondents pointed out also that the entity (i.e. the percentage) is under-exposed. Comments given:
"the table would look better if it were wider and had percentages at each value as well as and edges so that the elements do not merge
" edges are needed"
"the table is compatible with the chart, it is missing percentages"
• Quick information finding
Participants were asked to find as quickly as possible the information about the "UE taxonomy" (example from the explanatory notes). They had slight problems with that. Comments given:
"At first glance, I do not see, I remember reading, but I read it 3 times and cannot find"
"It is lost in the text"
While asked to find information about principal adverse impacts on sustainability factors, they did not have any problem with that. Comments given:
"It is easy, this section is seen in a bold text"
"I do not have any problem to find it"
• Semantics
Few sentences from template B were presented to participants of the focus group, asking them to explain their meaning to see if they understood the following sentences:
• Highest ESG ratings making up 25% of the market capitalisation in each sector and region of the parent index
• The index is a capitalisation-weighted index that limits company concentration by constraining the maximum weight of a company to 5%.
• The production of electricity from solar Photovoltaic did not substantially undermine climate change mitigation.
• The exclusion of issuers producing nuclear power, owning fossil fuel reserves, producing tobacco or military weapons as well as any company from the gambling sector is another binding element.
The respondents had significant problems understanding the first two sentences. Only one person could explain what it was about and how to understand it, however, this student has high knowledge in the field of economics and investments. The rest of the focus group members only more or less knew what the sentence might be about or did not understand it at all.
The third sentence did not raise any doubts and was well explained by respondents.
The fourth sentence was rather understandable. One person did not know what it is excluded "from the index or the whole investment". Several people pointed out that this sentence is repeated a few times in the text.
• Explanatory notes

10
At the end of this part of the research, respondents were asked about the explanatory notes. Participants were asked whether the explanatory notes are clear enough, understandable or need to use a more straightforward language. The members of the focus group indicated that the explanatory notes are written in an understandable way; however, they suggested to make the keywords bold.
"They are good, they make it easier to follow the content, the form is also good, key words could be in bold text"
Feedback on the mock-up of template B with a dashboard
The second part of the study concerned the presentation of the mock-up of template B with a dashboard. The participants were asked whether the template with a dashboard is better and helps to clarify what the template is about. Respondents agreed that the table in its current form does not extend the knowledge about the issue and seems unnecessary. However, the idea to prepare a more extended brief/table at the beginning was approved by respondents.
"It does not increase the knowledge about the document"
"At first it catches the eye, but the knowledge does not expand"
"I do not understand the meaning of the dashboard, it does not fit the document
"It is an interesting and good idea to do a brief, with more information, outline, adding colour"
Feedback on the mock-up of template A
The last document presented to the members of the focus group was the mock-up of template A. Respondents discussed only the graphic design and the icons, especially in comparison to the mock-up of template B.
1. General impression
The first thing that respondents notices was the use of colours. Respondents did not like the dominant yellow colour in the document under review, and the grey colour along the entire length of the margin.
"The dominant yellow colour, instead of attracting the reader's attention, distracts the reader. The data are presented in this document less aesthetically that in the previous one"
"I do not like the yellow colour of this document"
" Unnecessary grey colour along the entire length of the margin, it would be better if only the part with text was on a grey background"
"the gray margin on the right side – seems to indicate that the text in this part is not important and s not worth paying attention to"
"there is a lot of text in one block of the margin, it would be nicer to divide it with white spaces"
"the grey margin should be green, as this colour is well associated in the context of sustainable and environmentally-friendly investments"
"the first document was more elegant"

11
Despite the unfavourable reception of colour and aesthetics, some respondents found this document to be more readable than template B. Visible, separated paragraphs, make it easier to find the information you are looking for.
"It is better than the previous document, but I do not like yellow and too rectangular blocks; the icons are better, but the margin should be grey only in the part of the text and not in all the rest of the margin"
"Better sections, clearer, although numbering of sections is needed"
Respondents preferred the charts and graphics of assets investment from the previous document. In template A the chart are too small, difficult to read. The graph is also not clear.
"Data presentation: the chart, and the tree graph – with the asset allocation is too small, it is not legible"
"On the graph with sectors there is a lack of value, even in the relevant parts; It is unclear"
2. Icons
With regards the icons, students preferred those from template A. They seem more understandable and better fit to the sections, especially the factory instead of the skull which was in template B.
"They are needed, instead; of a skull, there is a factory, which fits and is neutral"
"They are ok, but the colours of the whole documents should be changed. I would prefer green icons."
"icons should be in delicate green, more associated with ecology"

12
Part II - ON-LINE SURVEY
The on-line survey was conducted by the Warsaw School of Economics using the Microsoft Forms tool among the students of the university, of all types of studies. The SGH Panel is not a representative sample of the Poland population; they are more economically educated and younger. It is a group from the generation that will soon create the reality of the financial market. The survey was available in two language versions (Polish and English) via the link: https://forms.office.com/Pages/ResponsePage.aspx?id=DhtOFuXIqUGbu29-1A7vBGYwZabCMyxAnMWoLcVXzG5UQllIV0gwQVQwUlJLSFJJR1lERE5JMDhJRi4u and https://gazeta.sgh.waw.pl/?q=komunikaty/biznes-vs-esg-kolejne-obowiazki-ujawnien-na-europejskim-rynku-finansowym Students were assigned a document for analysis randomly, based on the last digit of their student card number. No personal data were collected in the survey, and the last digit of the student card was not subject to the survey analysis. Before reading the assigned document, an introduction on the product presented was displayed. The research was carried out between the 28th of October 2020 and the 6th of November 2020. The questionnaire consisted of 3 parts. The first concerned the general impression of a given document, the visual impression and the intelligibility of the text. The second part "Knowledge" was about icons. Three of them were selected and the respondents were asked to answer the question "Please rate your agreement with the following statement "Icon is understandable"". Additionally, for the first icon, the respondents were asked to write what they thought the icon meant. In the third part, the interviewers answered a set of knowledge questions. .
Response
The analysis takes into account all submitted questionnaires that were fully completed by the respondents. A total of N=98 respondents answered the questionnaire, and it is a number above the established adopted minimum of n=50. It took, on average, 65 minutes to complete the survey. 7 respondents returned the questionnaire after more than 1.5 hours, the longest time was 13 hours and 4 minutes. Most likely, this is due to the fact that the survey start time began with the opening of the survey link in the web browser, and the interviewer returned to it after a long time, hence the average time to complete the survey for the entire panel was over an hour. Without these 7 respondents, for the group n = 91 the average time to complete the questionnaire was less than 14 minutes. The estimated time for completing the questionnaire was set at 15 minutes.

13
Composition of respondents:
Man Woman Total
Polish 39 (40%) 43 (44%) 82 (84%)
English 10 (10%) 6 (6%) 16 (16%)
Total 49 (50%) 49 (50%) 98 (100%)
Bachelor Masters PhD Total
Polish 55 (56%) 20 (20%) 7 (7%) 82 (84%)
English 14 (14%) 2 (2%) 0 (0%) 16 (16%)
Total 69 (70%) 22 (22%) 7 (7%) 98 (100%)
Document Polish English Total
A Precontractual template A 15 (15%) 0 (0%) 15 (15%)*
B Precontractual template B 36 (37%) 6 (6%) 42 (43%)*
C Periodic template B 31 (32%) 10 (10%) 41 (42%)*
98 (100%)
*Assumed proportion were as follow Precontractual template A – 20%, Precontractual template B – 40%, Periodic template B – 40%.

14
Document A – Mock-up of pre-contractual template A
Respondents could react to relevant statements on a 5-point scale ranging from “completely disagree” to “completely agree”.
Only 7 % of respondents disagrees with the statement that they understand the information in the
disclosure, 13 % are neutral and 80% say they understand the information. The information is helpful
for 80% in understanding how sustainable a financial product is, 14% disagrees with this statement.
47 % found the document to be attractive, only 13 % found the document to be unattractive.
37% agrees that the information is too detailed, 27% does not find the information too detailed.
73% rate the document as useful, a 7% don’t perceive the disclosure to be useful.
The graphs below show the answers to more specific questions about the readability and appearance of the document.
13%
7%
7%
33%
13%
20%
7%
67%
40%
33%
40%
67%
53%
20%
13%
40%
33%
20%
7%
20%
53%
7%
13%
27%
7%
7%
7%
13%
7%
7%
0% 10% 20% 30% 40% 50% 60% 70% 80% 90% 100%
I understand the information in the document
The information document is attractive
The information document is too detailed
It's good that the information is provided in the form ofquestions and answers
Information document helps me to understand the extentto which environmental and social aspects are taken into
account
The information document is useful when making afinancial decision
The icons help me understand the content of each section
Statements on disclosure - Document A
I totally agree I agree I neither agree nor disagree I disagree I totally disagree

15
33%
47%
20%
How easy is it to understand the document?
Easy Neither easy nor difficult Difficult
67%13%
20%
How do you rate the appearance of the document?
Good Neither bad nor good Bad
53%47%
[How do you rate the length of the text in the document?
Text too long The text is just right Text too short
73%
27%
How do you rate the readability of the text in a document?
Not understandable Partially understandable Understandable
33%
60%
7%
How do you rate the readability of the text in a document?
Not enough space and discouraging readingJust fineToo much white space
40%
60%
0%
How do you rate the font size in the document?
Too small Just fine Too big

16
Knowledge questions
Question Correct
answer
Response
Q1. The following explanation appears at the beginning of the document. Please indicate which product has a more ambitious objective in terms of contributing to the environmental or social objective. This product:
c) "Promotes environmental and/or social aspects" is less important for sustainable development than "has a sustainable goal"
50% of the respondents, who were analysing the Precontractual template A answered correctly.
Q2. Does this product rely on derivatives?
b) No
Almost 50% % of the respondents, who were analysing the pre-contractual template A answered correctly.
Q3. This chart is located in the section titled "What is the minimum asset allocation for this product?" and completes the asset description. Please indicate which asset category is greener, i.e. that it has a more ambitious objective of contributing to the environmental or social objective.
c) "Other investments promoting environmental and social aspects" are less green than "sustainable investments"
43% of the respondents, who were analysing the pre-contractual template A answered correctly.
Q4. Approximately what percentage is invested in sustainable investments?
b) 15%
53% % of the respondents, who were analysing the Precontractual template A answered correctly.
Q5. Please complete the sentence. Most of the investments are allocated to...:
a) …Information technology, manufacturing of pharmaceuticals, financial activities and other [CORRECT]
b) …Water supply and Production of Electricity from Solar energy
c) …Treasury bills and real estate d) I don't know
a) Information technology, manufacturing of pharmaceuticals, financial activities and other
60 % of the respondents, who were analysing the Precontractual template A answered correctly.
Has an ESG objective Promotes E/S characteristics
Investments
#1 Aligned with E/S
characteristics
#1A Sustainable: environmental
#1B Other E/S characteristics: environmental
#2 Other

17
Icons
Please rate your
agreement with the
following statement "Icon
is understandable" I totally agree 13% 20% 13%
I agree 7% 40% 40%
I neither agree nor
disagree
33% 20% 20%
I disagree 47% 13% 27%
I totally disagree 0% 7% 0%
The first icon was rated the most negatively, 47% respondents found it incomprehensible. The second icon was the most understandable, in total 60% (20% + 40%) agreed.
What do you think icon means? Answers given:
Something with plans?
Several different goals, one specific goal will lead to the desired results.
signature
action strategies
Choosing the right solution
a list of 'for' and 'against'
I can't really associate it with anything. For example, a chess piece would be more understandable to me.
Supplementing the documentation
Avoiding bad decisions and choosing the good ones
tactic / strategy evokes a natural association with the strategy presented by the team sports coach.
Action plan
strategy
The icon presented concerned information on the product's investment strategy. Most of the answers agreed with the actual meaning of the icon. Respondents compared it with a strategy, action plan or tactic. The icon was understandable to most of the respondents.

18
Document B – Mock-up of pre-contractual template B
Respondents could react to relevant statements on a 5-point scale ranging from “completely disagree” to “completely agree”.
No respondents disagreed with the statement that they understand the information in the
disclosure, 26 % are neutral and 74% say they understand the information. The information is helpful
for 76 % in understanding how sustainable a financial product is, 2% disagrees with this statement.
55 % found the document to be attractive, only 19 % found the document to be unattractive.
40% agrees that the information is too detailed, 33% does not find the information too detailed.
64% rate the document as useful, 19% don’t perceive the disclosure to be useful.
The graphs below show the answers to more specific questions about the readability and appearance of the document.
17%
12%
31%
12%
7%
12%
57%
43%
40%
52%
64%
57%
55%
26%
26%
26%
10%
21%
17%
24%
19%
31%
7%
2%
14%
10%
2%
5%
0% 10% 20% 30% 40% 50% 60% 70% 80% 90% 100%
I understand the information in the document
The information document is attractive
The information document is too detailed
It's good that the information is provided in the form ofquestions and answers
Information document helps me to understand the extent towhich environmental and social aspects are taken into
account
The information document is useful when making a financialdecision
The icons help me understand the content of each section
Statements on disclosure - Document B
I totally agree I agree I neither agree nor disagree I disagree I totally disagree

19
7%
40%
40%
12%
How easy is it to understand the document?
Very easy Easy Neither easy nor difficult Difficult
7%
67%
19%
7%
How do you rate the appearance of document?
Very good Good Neither bad nor good Bad
52%45%
2%
How do you rate the length of the text in the document?
Text too long The text is just right Text too short
60%
40%
How do you rate the readability of the text in a document?
Partially understandable Understandable
33%
60%
7%
How do you rate the layout of the text in the document ?
Not enough space and discouraging reading
Just fine
Too much white space
24%
76%
How do you rate the font size in the document?
Too small Just fine

20
Knowledge questions
Question Correct
answer
Response
Q1. The following explanation appears at the beginning of the document. Please indicate which product has a more ambitious objective in terms of contributing to the environmental or social objective. This product:
c) "Promotes environmental and/or social aspects" is less important for sustainable development than "has a sustainable goal"
38% of the respondents, who were analysing the pre-contractual template B answered correctly.
Q2. Does this product rely on derivatives?
b) No
33% of the respondents, who were analysing the pre-contractual template B answered correctly.
Q3. This chart is located in the section titled "What is the minimum asset allocation for this product?" and completes the asset description. Please indicate which asset category is greener, i.e. that it has a more ambitious objective of contributing to the environmental or social objective.
c) "Other investments promoting environmental and social aspects" are less green than "sustainable investments"
29% of the respondents, who were analysing the pre-contractual template B answered correctly.
Q4. Approximately what percentage is invested in sustainable investments?
b) 15%
76% of the respondents, who were analysing the pre-contractual template B answered correctly.
Q5. Please complete the sentence. Most of the investments are allocated to...:
e) …Information technology, manufacturing of pharmaceuticals, financial activities and other [CORRECT]
f) …Water supply and Production of Electricity from Solar energy
g) …Treasury bills and real estate h) I don't know
b) Information technology, manufacturing of pharmaceuticals, financial activities and other
50% of the respondents, who were analysing the pre-contractual template B answered correctly.
Has an ESG objective Promotes E/S characteristics
Investments
#1 Aligned with E/S
characteristics
#1A Sustainable: environmental
#1B Other E/S characteristics: environmental
#2 Other

21
Icons
Please rate your
agreement with the
following statement "Icon
is understandable"
I totally agree 12% 0% 7%
I agree 43% 52% 57%
I neither agree nor
disagree
12% 21% 14%
I disagree 26% 21% 19%
I totally disagree 7% 5% 2%
The first icon was rated the most negatively, 33% in total ( 26% + 7%) respondents found it incomprehensible. The third icon was the most understandable, in total 64% (7% + 57%) agreed.
What do you think icon
means? Answers given:
Enviromental Protection
Probably some kind of prohibition of toxic substances
Toxicity
harmful
unharmful
That something is harmful
Environmentally friendly product / process
The use of corrosive substances is prohibited
environmental aspects
Damage / Harmful
No threat to the environment
no ecological danger
Damages
Harmful impact on the environment
No entry for skeletons
a ban on dangerous practices
The icon refers to environmental protection. The text contains information about the effects of certain factors on the climate. The symbol of the crossed skull means that mortality is reduced by taking care of nature.
toxic / harmful to people, too strong a message compared to the content of the paragraph
Death
It's hard to say. At the same time, the "prohibit / cross" sign combined with the skull creates mixed feelings. At first glance, before getting lost, I took it as a threat.
It means prohibiting / refraining from harmful activities symbolised by the skull
Prohibition of activities harmful to the ecosystem.
investments that will not cause significant harm to the other sustainable investment objectives during the reference period
The given actions can lead to large losses
It means prohibiting / refraining from harmful activities symbolised by the skull
22
Danger, but it is not known whether it is about human life or, for example, about a threat to the environment.
Dangerous substances, life-threatening
No threat to the environment
dangerous terrain
Danger, death, danger, prohibition
Poisoning the environment
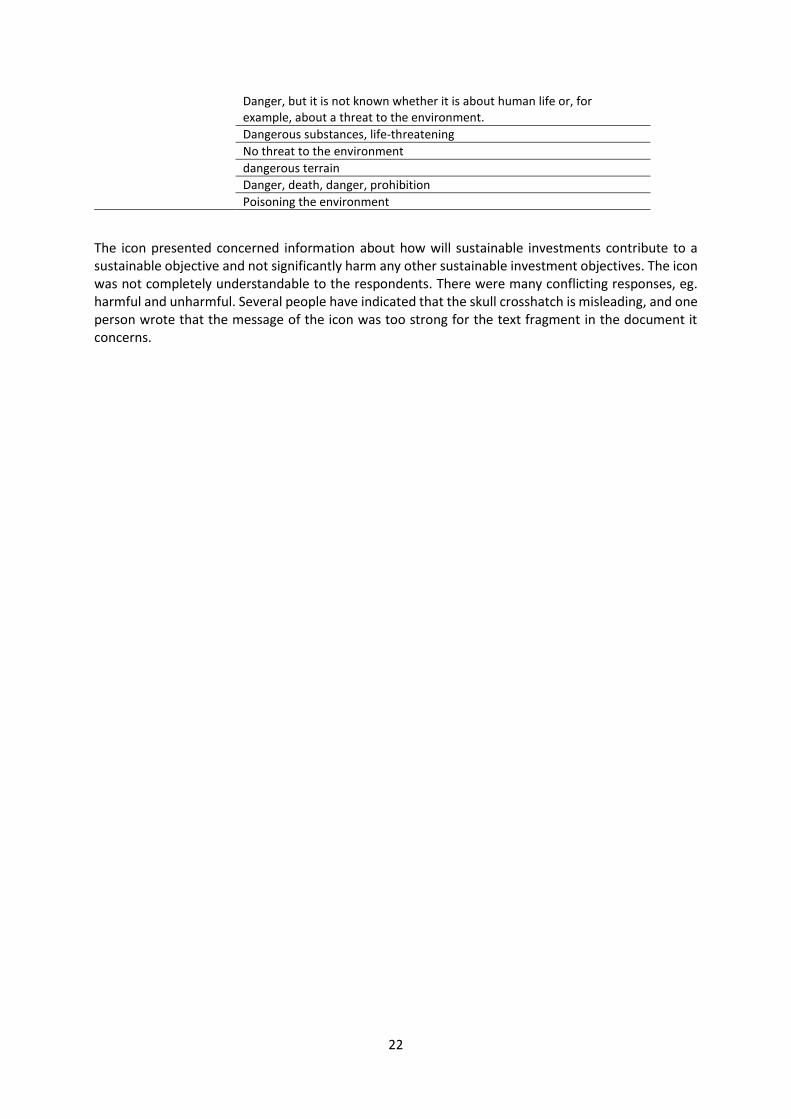
The icon presented concerned information about how will sustainable investments contribute to a sustainable objective and not significantly harm any other sustainable investment objectives. The icon was not completely understandable to the respondents. There were many conflicting responses, eg. harmful and unharmful. Several people have indicated that the skull crosshatch is misleading, and one person wrote that the message of the icon was too strong for the text fragment in the document it concerns.

23
Document C – Mock-up of periodic template B
Respondents could react to relevant statements on a 5-point scale ranging from “completely disagree” to “completely agree”.
17 % of respondents disagrees with the statement that they understand the information in the
disclosure, 12 % are neutral and 71% say they understand the information. The information is helpful
for 68% in understanding how sustainable a financial product is, 10% disagrees with this statement.
59 % found the document to be attractive, only 12 % found the document to be unattractive.
25% agrees that the information is too detailed, 39% does not find the information too detailed.
56% rate the document as useful, a 17% don’t perceive the disclosure to be useful.
The graphs below show the answers to more specific questions about the readability and appearance of the document.
22%
10%
10%
32%
7%
12%
20%
56%
49%
15%
51%
61%
44%
51%
17%
29%
37%
15%
22%
27%
12%
5%
7%
32%
2%
10%
15%
15%
5%
7%
2%
2%
0% 20% 40% 60% 80% 100% 120%
I understand the information in the document
The information document is attractive
The information document is too detailed
It's good that the information is provided in the form ofquestions and answers
Information document helps me to understand theextent to which environmental and social aspects are
taken into account
The information document is useful when making afinancial decision
The icons help me understand the content of eachsection
Statements onn disclosure - Document C
I totally agree I agree I neither agree nor disagree I disagree I totally disagree

24
1.
5%
61%
34%
0%0%
How easy is it to understand the document?
Very easy Easy
Neither easy nor difficult Difficult
Very difficult
22%
51%
17%
10% 0%
[How do you rate the appearance of document?
Very good Good Neither bad nor good Bad Very bad
22%
68%
10%
How do you rate the length of the text in the document?
Text too long The text is just right Text too short
0%
51%49%
How do you rate the readability of the text in a document ?
Not understandable Partially understandable Understandable
34%
61%
5%
How do you rate the layout of the text in the document?
Not enough space and discouraging reading
Just fine
Too much white space
22%
78%
0%
How do you rate the font size in the document?
Too small Just fine Too big

25
Knowledge questions
Question Correct
answer
Response
Q1. The following explanation appears at the beginning of the document. Please indicate which product has a more ambitious objective in terms of contributing to the environmental or social objective. This product:
c) "Promotes environmental and/or social aspects" is less important for sustainable development than "has a sustainable goal"
56% of the respondents, who were analysing the Periodic template B answered correctly.
Q2. Does this product rely on derivatives?
b) No
Only 12% of the
respondents, who were
analysing the Periodic
template B answered
correctly.
Q3. This chart is located in the section titled "What is the minimum asset allocation for this product?" and completes the asset description. Please indicate which asset category is greener, i.e. that it has a more ambitious objective of contributing to the environmental or social objective.
c) "Other investments promoting environmental and social aspects" are less green than "sustainable investments"
59% of the respondents, who were analysing the Periodic template B answered correctly.
Q4. Approximately what percentage is invested in sustainable investments?
b) 15%
61% of the respondents, who were analysing the Periodic template B answered correctly.
Q5. Please complete the sentence. Most of the investments are allocated to...:
i) …Information technology, manufacturing of pharmaceuticals, financial activities and other [CORRECT]
j) …Water supply and Production of Electricity from Solar energy
k) …Treasury bills and real estate l) I don't know
c) Information technology, manufacturing of pharmaceuticals, financial activities and other
78% of the respondents, who were analysing the Periodic template B answered correctly.
Has an ESG objective Promotes E/S characteristics
Investments
#1 Aligned with E/S
characteristics
#1A Sustainable: environmental
#1B Other E/S characteristics: environmental
#2 Other
26
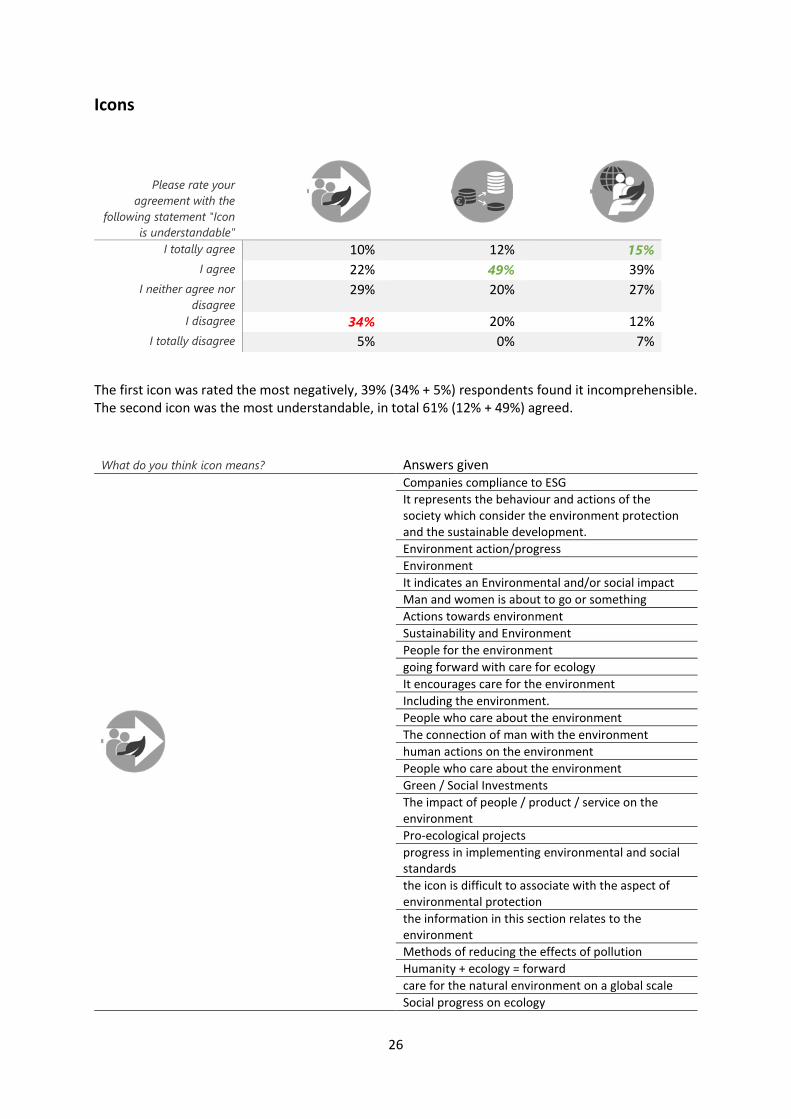
Icons
Please rate your
agreement with the
following statement "Icon
is understandable"
I totally agree 10% 12% 15%
I agree 22% 49% 39%
I neither agree nor
disagree
29% 20% 27%
I disagree 34% 20% 12%
I totally disagree 5% 0% 7%
The first icon was rated the most negatively, 39% (34% + 5%) respondents found it incomprehensible. The second icon was the most understandable, in total 61% (12% + 49%) agreed.
What do you think icon means? Answers given
Companies compliance to ESG
It represents the behaviour and actions of the society which consider the environment protection and the sustainable development.
Environment action/progress
Environment
It indicates an Environmental and/or social impact
Man and women is about to go or something
Аctions towards environment
Sustainability and Environment
People for the environment
going forward with care for ecology
It encourages care for the environment
Including the environment.
People who care about the environment
The connection of man with the environment
human actions on the environment
People who care about the environment
Green / Social Investments
The impact of people / product / service on the environment
Pro-ecological projects
progress in implementing environmental and social standards
the icon is difficult to associate with the aspect of environmental protection
the information in this section relates to the environment
Methods of reducing the effects of pollution
Humanity + ecology = forward
care for the natural environment on a global scale
Social progress on ecology

27
people and the environment
Care - world - nature - human
Ecological activities
The icon presented concerned information about how the environmental and/or social characteristics are promoted by the financial product. The icon was well understood by the respondents. Almost everyone linked it to social and environmental activities.

28
ANNEXES
This Annex includes the following documents that were used in Part I and Part II of the consumer
testing, in English (the translations to Polish have not been annexed):
A. Mock-up of pre-contractual template A
B. Mock-up of pre-contractual template B
C. Mock-up of periodic template B (without dashboard)
D. Mock-up of pre-contractual template B with dashboard, which has been tested only in the
focus group
E. On-line questionnaire

Document A – Mock-up of pre-contractual template A
Environmental and/or social characteristics
This product:
Has an ESG objective Promotes E/S characteristics
This financial product promotes environmental or social characteristics, but does not have as its objective a
sustainable investment. It might invest partially in assets that have a sustainable objective, for instance
qualified as sustainable according to the EU classification.
What environmental and/or social characteristics are promoted
by this financial product?
The characteristics promoted by this financial product consist of
investing in corporates with excellent Environmental, Social and
Governance ratings while excluding issuers producing nuclear
power, owning fossil fuel reserves, producing tobacco or military
weapons as well as any company from the gambling sector.
This product is passively managed. Its objective is to track the
performance of the TRXI World 5% Issuer Capped ESG Index, and
to limit to max. 1% the tracking error between the net asset value
of the product and the performance of the Index
What investment strategy does this financial product follow?
What investment strategy does this financial product follow to
meet the E/S characteristics?
The investment strategy aims at tracking the TRXI World 5% Issuer
Capped ESG Index.
The TRXI World 5% Issuer Capped ESG Index applies a max 5%
weight to the largest holdings of the TRXI World ESG Index. The
latter captures companies with excellent Environmental, Socialand
Governance ratings, following a best-in-class investment strategy,
while excluding issuers producing nuclear power, owning fossil
fuel reserves, producing or selling tobacco or military weapons as
well as any company from the gambling sector.
Both the TRXI World 5% Issuer Capped ESG Index and the TRXI
World ESG Index serve as a potential replacement for current TRXI
World index exposure for investors interested in selecting
corporates with the best ESG ratings while eliminating companies
An investment
strategy is what
guides the decision
on what to invest in
based on e.g.
investment goals,
risk tolerance and
future needs for
liquidity.
E/S stands for
“environmental
and/or social”

30
that have a negative impact on certain sustainability factors from
their portfolio.
What are the binding elements for the investment selection?
This product is aligned with the TRXI World 5% Issuer Capped ESG
Index at 95%.
The TRXI World 5% Issuer Capped ESG Index, tracked by this
product, targets securities of companies with the highest ESG
ratings making up 25% of the market capitalization in each sector
and region of the parent index. Companies must have an RTT ESG
rating above 'BBB' and the RTT ESG Controversies score greater
than 4 to be eligible for the TRXI ESG Index. The Index applies a
maximum 5% weight to the largest holdings.
The exclusion of issuers producing nuclear power, owning fossil
fuel reserves, producing tobacco or military weapons as well as
any company from the gambling sector is another binding
element.
How is the strategy implemented in the investment process on
a continuous basis?
The investment seeks to provide investment results that, before
fees and expenses, correspond generally to the total return
performance of the TRXI World 5% Issuer Capped ESG Index. The
fund generally invests substantially all, but at least 95%, of its total
assets in the securities comprising the index. In addition, it may
invest in equity securities that are not included in the index, cash
and cash equivalents or money market instruments. The fund is
non-diversified.
Compliance with the characteristics is monitored on a regular
basis.
Is there an amount of potential investments excluded, as a
result of the implementation of the selection criteria?
No
Yes, the implementation of the selection criteria leads to the
exclusion of at least 50% of potential investments.
What is the policy to assess good governance practices of the
investee companies?
The investee companies are rated for governance aspects using
the RTT ESG Ratings (www.RTT-ESG-Rating.com).
Governance is
about a company’s
leadership,
remuneration of
staff (incl.
executives), audits,
internal controls,
shareholder rights,
tax compliance and
its relations to other
stakeholders.
What is the minimum asset allocation planned for this product?
The fund invests in direct holdings. In order to meet the
environmental or social characteristics promoted, the fund
generally invests at least 95% of its total assets in the securities
comprising the TRXI World 5% Issuer Capped ESG Index. Hence,
95% of the investments are aligned with the environmental
Asset Allocation is
one element of the
implementation of
the investment
strategy, it
describes which

31
characteristics. This includes 15% of the
total investments that are qualified as
sustainable, some of which are
classified as environmental investments
under the EU framework to facilitate
sustainable investment). 5% of the total
investments do not incorporate any
environmental or social characteristic.
In which economic sectors are the
investments made?
The fund is mostly exposed to the
Information Technology and Health
Care sectors.
Does this financial product make use of derivatives?
Yes.
If yes, how is the use of derivatives aligned with the
E/S characteristics?
No
What investments are included under “#2 Remainder”?
The fund may invest in equity securities that are not included in
the index, cash and cash equivalents or money market
instruments.
percentage of your
investments goes
into what type of
assets.
The category #1
Aligned with E/S
characteristics
includes any
investment that is
aligned with the
characteristic:
- The Subcategory
#1A covers
investments that are
qualified as
sustainable. A
sustainable
investment means
an investment in an
economic activity
that contributes to
an environmental or
social objective.
- The sub-category
#1B Other E/S
characteristics
covers investments
aligned with the
environmental or
social characteristics
that do not meet the
criteria of
‘sustainable
investment’.
- #2Remainder
includes
investments which
are not aligned with
the E/S
characteristics, nor
are qualified as
sustainable.
Derivatives are
financial
instruments whose
value derives from
the value of an
underlying asset,
but is not equal to
an actual investment
in the underlying
asset.
How will sustainable investments contribute to a sustainable objective and not
significantly harm any other sustainable investment objectives during the
reference period?
This section only
concerns the portion
of sustainable
0
20
40
60
80
100
#1A #1B #2
Sectoral exposure Real estate
Treasury bonds
Production electricity solar
Water supply
Other
Financial and insuranceactivitiesManufact.: Wholesalehousehold goodsManufact.: Pharmaceuticals
Information andcommunication
Investments
#1 Aligned with E/S
characteristics
#1A Sustainable: environmental
#1B Other E/S characteristics: environmental
#2 Other

32
How will sustainable investments of the financial product
contribute to a sustainable objective?
Investments in solar photovoltaic energy production are
considered as significantly contributing to climate change
mitigation under the EU Taxonomy. The investments in companies
supplying water contribute to climate change adaptation. The
activity of the company supplying water has a substantial
contribution to GHG emissions savings through low specific
energy consumption in the water supply system measured in kWh
per cubic meter of water. Nonetheless, all of the selected
companies supplying water might not be compliant with EU
Taxonomy energy consumption thresholds for substantial
contribution to climate change adaptation. Our applied threshold
is that of 1 kWh per cubic meter of water, instead of 0.5 kWh as
per the EU Taxonomy.
How are principal adverse impacts on sustainability factors
taken into account?
Upon investment and over the life of the product, we assess and
monitor indicators that are deemed to indicate the presence of a
principal adverse impact as per EU law, except for all biodiversity-
related indicators, for which we are unable to collect data. More
details can be found under the prospectus section on Adverse
Impact.
We address adverse impacts by engaging with investee companies.
We use research from proxy voting companies to help us decide
how to vote.
How are investments excluded that significantly harm
sustainable investment objectives?
All investments qualifying as sustainable (15%) are screened
against all significant harm indicators relevant to solar
photovoltaic energy production and water supply under the EU
Taxonomy, with the exception of biodiversity-related indicators.
Environmental Impact Assessment have been completed were
relevant.
The implementation of site-level biodiversity management plan
complies with the IFC Performance Standard 6: Biodiversity
Conservation and Sustainable Management of Living Natural
Resources.
The production of electricity from solar Photovoltaic did not
substantially undermine climate change mitigation.
investments
illustrated above
(#1A Sustainable),
and not the other
E/S characteristics
part, nor the
remainder
An investment that
contributes to an
environmental or
social objective can
only be considered
“sustainable” where
it demonstrates a
contribution to an
environmental or
social objective, and
it does not
significantly harm
any (other)
sustainability
objective.
Principal adverse
impacts are the
biggest negative
impact of the
investments on
sustainability factors
(environmental,
social and employee
matters, respect for
human rights, anti‐corruption and anti‐bribery matters.)
The EU Taxonomy
is a classification of
environmental
activities approved
by the European
Union.
What sustainability indicators are used to assess the E/S
characteristics of this product?
The indicators used are:
• Highest ESG ratings making up 25% of the market
capitalisation in each sector and region of the parent
index. Companies must have an RTT ESG rating above 'BBB'
and the RTT ESG Controversies score greater than 4 to be
Sustainability
indicators are used
to measure the
attainment of each
of the E/S
characteristics
promoted by the
financial product.

33
eligible for the TRXI ESG Index. The Index applies a
maximum 5% weight to the largest holdings.
• No economic activity of production of nuclear power, no
ownership of fossil fuel reserves, no involvement in
production or sale of tobacco or military weapons as well
absence of activities in the gambling sector. As regards
the 15% of investments qualifying as sustainable, indicators
used are the one described in the relevant section above.
Can I find on-line more product-specific information?
You can find more information about the data sources and
methodologies used at: www.investorYX/5%CappedESG -ETF-
fund.com
You can read about our assessment of the principal adverse
impacts of our entity on sustainability factors at:
www.investorYX/sustainability/adverse_impact_statement
Is a specific index designated as a reference benchmark to
determine whether this product is sustainable?
No
Yes, however the reference benchmark is not aligned with
all of the environmental or social characteristics promoted.
Details:
This product is 95% aligned with the TRXI World 5% Issuer
Capped ESG Index. The Index is a capitalisation weighted
index that limits company concentration by constraining
the maximum weight of a company to 5%. It is a capped
version of the TRXI World ESG Index which provides
exposure to corporates across the world with excellent
Environmental, Social and Governance (ESG) ratings and
excludes companies which are producing nuclear power,
owning fossil fuel reserves, producing tobacco or military
weapons as well as any company from the gambling sector.
The TRXI World ESG Index is designed for investors seeking
a diversified sustainable benchmark comprised of
companies with strong sustainability profiles while
avoiding companies incompatible with values screens.
The TRXI World ESG Index is constructed in the following
way. First issuers producing nuclear power, owning fossil
fuel reserves, producing tobacco or military weapons as
well as any company from the gambling sector is excluded
from the TRXI World Index. Then, a best in‐class selection
process is applied to the remaining universe of securities in
the parent index.
A reference
sustainable
benchmark is an
index against
which it can be
measured whether
the financial
product is
meeting its
sustainable
investment
objective

34
Yes, the reference benchmark is aligned with each of the
environmental or social characteristics promoted by the
financial product. Details:

Document B – Mock-up of pre-contractual template B
Environmental and/or social
characteristics
This product: Promotes E/S characteristics, but does not have a sustainable objective
Has a sustainable objective – which means that it demonstrates a contribution to an environmental or social objective, and it does not significantly harm any (other) sustainability objective
What environmental and/or social characteristics are promoted by this financial product?
The characteristics promoted by this financial product consist of investing in corporates with excellent Environmental, Social and Governance ratings while excluding issuers producing nuclear power, owning fossil fuel reserves, producing tobacco or military weapons as well as any company from the gambling sector.
This product is passively managed. Its objective is to track the performance of the TRXI World 5% Issuer Capped ESG Index, and to limit to max. 1% the tracking error between the net asset value of the product and the performance of the Index
What investment strategy does this financial product follow?
What investment strategy does this financial product follow to meet the E/S characteristics?
The investment strategy aims at tracking the TRXI World 5% Issuer Capped ESG Index.
The TRXI World 5% Issuer Capped ESG Index applies a max 5% weight to the largest holdings of the TRXI World ESG Index. The latter captures companies with excellent Environmental, Social and Governance ratings, following a best-in-class investment strategy, while excluding issuers producing nuclear power, owning fossil fuel reserves, producing or selling tobacco or military weapons as well as any company from the gambling sector.
Both the TRXI World 5% Issuer Capped ESG Index and the TRXI World ESG Index serve as a potential replacement for current TRXI World index exposure for investors interested in selecting corporates with the best ESG ratings while eliminating companies that have a negative impact on certain sustainability factors from their portfolio.
What are the binding elements for the investment selection?
This product is aligned with the TRXI World 5% Issuer Capped ESG Index at 95%.
The TRXI World 5% Issuer Capped ESG Index, tracked by this product, targets securities of companies with the highest ESG ratings making up 25% of the market capitalization in each sector and region of the parent index. Companies must have an RTT ESG rating above 'BBB' and the RTT ESG Controversies score greater than 4 to be eligible for the TRXI ESG Index. The Index applies a maximum 5% weight to the largest holdings.
The exclusion of issuers producing nuclear power, owning fossil fuel reserves, producing tobacco or military weapons as well as any company from the gambling sector is another binding element.
How is the strategy implemented in the investment process on a continuous basis?
An investment strategy is what guides the decision on what to invest in based on e.g. investment goals, risk tolerance and future needs for liquidity.
E/S stands for “environmental and/or social”
This financial product promotes environmental or social characteristics, but does not have as its objective a sustainable investment. It might invest partially in assets that have a sustainable objective, for instance qualified as sustainable according to the EU classification (Taxonomy).

36
The investment seeks to provide investment results that, before fees and expenses, correspond generally to the total return performance of the TRXI World 5% Issuer Capped ESG Index. The fund generally invests substantially all, but at least 95%, of its total assets in the securities comprising the index. In addition, it may invest in equity securities that are not included in the index, cash and cash equivalents or money market instruments. The fund is non-diversified.
Compliance with the characteristics is monitored on a regular basis.
Is there an amount of potential investments excluded, as a result of the implementation of the selection criteria?
No Yes, the implementation of the selection criteria leads to the exclusion of at least 50% of potential investments.
What is the policy to assess good governance practices of the investee companies?
The investee companies are rated for governance aspects using the RTT ESG Ratings (www.RTT-ESG-Rating.com).
What is the minimum asset allocation planned for this product?
The fund invests in direct holdings. In order to meet the environmental or social characteristics promoted, the fund generally invests at least 95% of its total assets in the securities comprising the TRXI World 5% Issuer
Capped ESG Index. Hence, 95% of the investments are aligned with the environmental characteristics. This includes 15% of the total investments that are qualified as sustainable, some of which are classified as environmental investments under the EU framework to facilitate sustainable investment). 5% of the total investments do not incorporate any environmental or social characteristic.
In which economic sectors are the investments made?
The fund is mostly exposed to the Information Technology and Health Care sectors.
Investments
#1 Aligned with E/S
characteristics
#1A Sustainable:
environmental
#1B Other E/S characteristics: environmental
#2 Other
Asset Allocation is one element of the implementation of the investment strategy, it describes which percentage of your investments goes into what type of assets.
The category #1 Aligned with E/S characteristics includes any investment that is aligned with the characteristic:
- The Subcategory #1A covers investments that are qualified as sustainable. A sustainable investment means an investment in an economic activity that contributes to an environmental objective, measured for example by key resource efficiency indicators such as CO2 emissions, or the use of water, or an investment that contributes to a social objective, such as tackling inequality or that fosters social cohesion.
- The sub-category #1B Other E/S characteristics covers investments aligned with the environmental or social characteristics that do not meet the criteria of ‘sustainable investment’.
- #2Remainder includes investments which are not aligned with the E/S characteristics, nor are qualified as sustainable.
Governance is about a company’s leadership, remuneration of staff (incl. executives), audits, internal controls, shareholder rights, tax compliance and its relations to other stakeholders.

37
Does this financial product make use of derivatives?
Yes No
If yes, how is the use of derivatives aligned with the E/S characteristics?
What investments are included under “#2 Remainder”?
The fund may invest in equity securities that are not included in the index, cash and cash equivalents or money market instruments.
How will sustainable investments contribute to a sustainable objective and not significantly harm any other sustainable investment objectives during the reference period?
How will sustainable investments of the financial product contribute to a sustainable objective?
Investments in solar photovoltaic energy production are considered as significantly contributing to climate change mitigation under the EU Taxonomy. The investments in companies supplying water contribute to climate change adaptation. The activity of the company supplying water has a substantial contribution to GHG emissions savings through low specific energy consumption in the water supply system measured in kWh per cubic meter of water. Nonetheless, all of the selected companies supplying water might not be compliant with EU Taxonomy energy consumption thresholds for substantial contribution to climate change adaptation. Our applied threshold is that of 1 kWh per cubic meter of water, instead of 0.5 kWh as per the EU Taxonomy.
How are principal adverse impacts on sustainability factors taken into account?
Upon investment and over the life of the product, we assess and monitor indicators that are deemed to indicate the presence of a principal adverse impact as per EU law, except for all biodiversity-related indicators, for which we are unable to collect data. More details can be found under the prospectus section on Adverse Impact.
We address adverse impacts by engaging with investee companies. We use research from proxy voting companies to help us decide how to vote.
How are investments excluded that significantly harm sustainable investment objectives?
All investments qualifying as sustainable (15%) are screened against all significant harm indicators relevant to solar photovoltaic energy production and water supply under the EU
Sector exposure (%) #1A #1B #2 Total
Production electricity solar 15
Water supply
Other 17.6
Financial and insurance services 10.31
Manufacturing:Wholesale household goods 11.07
Manufacturing: Pharmaceuticals 14.86
Information & communication 36.16
Real estate 2
Treasury bonds 3
Total 15 80 5 100
This section only concerns the portion of sustainable investments illustrated above (#1A Sustainable), and not the other E/S characteristics part, nor the remainder
An investment that contributes to an environmental or social objective can only be considered “sustainable” where it demonstrates a contribution to an environmental or social objective, and it does not significantly harm any (other) sustainability objective.
Principal adverse impacts are the biggest negative impact of the investments on sustainability factors (environmental, social and employee matters, respect for human rights, anti‐corruption and anti‐bribery matters.)
The EU Taxonomy is a classification of environmental
activities approved by the European Union.
Derivatives are financial instruments whose value derives from the value of an underlying asset, but is not equal to an actual investment in the underlying

38
Taxonomy, with the exception of biodiversity-related indicators. Environmental Impact Assessment have been completed were relevant.
The implementation of site-level biodiversity management plan complies with the IFC Performance Standard 6: Biodiversity Conservation and Sustainable Management of Living Natural Resources.
The production of electricity from solar Photovoltaic did not substantially undermine climate change mitigation.
What sustainability indicators are used to assess the E/S characteristics of this product?
The indicators used are:
• Highest ESG ratings making up 25% of the market capitalisation in each sector and region of the parent index. Companies must have an RTT ESG rating above 'BBB' and the RTT ESG Controversies score greater than 4 to be eligible for the TRXI ESG Index. The Index applies a maximum 5% weight to the largest holdings.
• No economic activity of production of nuclear power, no ownership of fossil fuel reserves, no involvement in production or sale of tobacco or military weapons as well absence of activities in the gambling sector. As regards the 15% of investments qualifying as sustainable, indicators used are the one described in the relevant section above.
Can I find on-line more product-specific information?
You can find more information about the data sources and methodologies used at: www.investorYX/5%CappedESG -ETF-fund.com
You can read about our assessment of the principal adverse impacts of our entity on sustainability factors at: www.investorYX/sustainability/adverse_impact_statement
Is a specific index designated as a reference benchmark to determine whether this product is sustainable?
No
Yes, however the reference benchmark is not aligned with all of the environmental or social characteristics promoted. Details:
This product is 95% aligned with the TRXI World 5% Issuer Capped ESG Index. The Index is a capitalisation weighted index that limits company concentration by constraining the maximum weight of a company to 5%. It is a capped version of the TRXI World ESG Index which provides exposure to corporates across the world with excellent Environmental, Social and Governance (ESG) ratings and excludes companies which are producing nuclear power, owning fossil fuel reserves, producing tobacco or military weapons as well as any company from the gambling sector.
The TRXI World ESG Index is designed for investors seeking a diversified sustainable benchmark comprised of companies with strong sustainability profiles while avoiding companies incompatible with values screens.
The TRXI World ESG Index is constructed in the following way. First issuers producing nuclear power, owning fossil fuel reserves, producing tobacco or military weapons as well as any company from the gambling sector is excluded from the TRXI World Index. Then, a best in‐class selection process is applied to the remaining universe of securities in the parent index.
Yes, the reference benchmark is aligned with each of the environmental or social characteristics promoted by the financial product. Details
Sustainability indicators are used to measure the attainment of each of the E/S characteristics promoted by the financial product
A reference sustainable benchmark is an index against which it can be measured whether the financial product is meeting its sustainable investment objective

Document C – Mock-up of periodic template B
Environmental and/or social characteristics
This product has: An ESG objective
ESG characteristics
To what extent were the environmental and/or social characteristics promoted by this financial product met?
How did the investments contribute to the sustainable characteristics and how did the sustainability indicators perform?
During the reporting period from 31 March 2022 to 31 March 2023, this financial product was 95% invested in international securities of companies with the highest ESG ratings per sector, excluding at the same time issuers producing nuclear power, owning fossil fuel reserves, producing tobacco or military weapons as well as any company from the gambling sector.
Insufficient data to assess 5% of the assets against the indicators.
Historical Comparison
During the reporting period from 31 March 2022 to 31 March 2023, this financial product was 95% invested in international securities of companies with the highest ESG ratings per sector, excluding at the same time issuers producing nuclear power, owning fossil fuel reserves, producing tobacco or military weapons as well as any company from the gambling sector.
REFERENCE PERIOD HIGHEST ESG RATINGS EXCLUSIONS
31 MARCH 2022 - 31 MARCH 2023 95% 95%
31 MARCH 2021 - 31 MARCH 2022 97% 95%
31 MARCH 2020 - 31 MARCH 2021 96% 95%
The table shows the percentage of the portfolio that is aligned with the composition of the TRXI World 5% Issuer Capped ESG Index, which is a capped version of the TRXI World ESG Index that limits company concentration by constraining the maximum
weight of a company to 5%. The latter selects the 25% of securities with highest ESG scores of the 30 most developed economies, following a best-in-class methodology, from the TRXI World Index.
The Exclusions indicator covers: nuclear power, fossil fuel reserves, tobacco, military weapons and gambling.
What were the top 25 investments of this financial product?
Largest 25 investments Sector % Assets Country Company A Information technology 10.2% USA Company B Information technology 7% China Company C Information technology 6% USA Company D Manufacture of motor vehicles 5% Japan Company E Manufactur. of pharmaceuticals 5% France Company F Information technology 5% USA Company G Manufactur. food and beverages 5% Switzerland Company H Financial activities 4% USA Company K Manufactur. pharmaceuticals 5% Switzerland Company L Manufactur. of pharmaceuticals 5% Switzerland Company M Financial activities 4% USA Company N Information technology 1.5% USA
The reference period is 31 March 2019 to 31 March 2020
Sustainability indicators are used to measure the attainment of each of the E/S characteristics promoted by the financial product
The list includes the 25 investments constituting on average the greatest proportion of investments of the financial product during the reference period

40
What was the proportion of sustainability-related investments?
What was the asset allocation?
Most investments are direct holdings. 95% of the investments met the characteristics. This, includes 15% of total investments that are considered sustainable, some of which is qualified as such under the EU framework to facilitate sustainable investment. A remainder of investments of 5% does not incorporate any environmental or social characteristics (see the graph below).
In which economic sectors were the investments made?
The fund has been mostly exposed to the information technology and health care sectors, as well as the financial and to manufacturing of household goods sectors.
Company O Manufactur. of pharmaceuticals 1.2% Denmark Company P Information technology 1.2% USA Company Q Financial activities 1.2% USA Company R Information technology 1.2% Germany Company S Manufacture of chemical products 1.2% USA Company T Wholesale of household goods 1.2% USA Company U Manufacture of computer, electronic and
optical products 1.2% USA
Company V Manufacture of pharmaceutical products 1.2% Germany Company W Financial activities 1.2% USA Company X Wholesale of household goods 1.2% France Company Y Manufacturing 1.2% Germany Company Z Financial activities 1.2% Germany Company ZY Electricity supply 1.2% Spain
Sector Exposure (%) #1A #1B #2 Manufacturing: Aluminium 10
Water supply 5
Other 12.6
Financial and insurance services 5.31
Manufacturing:Wholesale household goods
11.07
Manufacturing: Pharmaceuticals 14.86
Information & communication 36.16
Real estate 2
Treasury bonds 3
Investments
#1 Aligned with E/S characteristics
#1A Sustainable: environmental
#1B Other E/S characteristics: environmental
#2 Other
- The category #1 Aligned with E/S characteristics includes any investment that is aligned with the characteristic:
The Subcategory #1A covers investments that are qualified as sustainable. A ‘sustainable investment’ means an investment in an economic activity that contributes to an environmental objective, or an investment that contributes to a social objective
- The sub-category #1B Other investments aligned with E/S characteristics covers investments aligned with the environmental or social characteristics that do not meet the criteria of ‘sustainable investment’.
- #2Remainder includes investments which are not aligned with the E/S characteristics, nor are qualified as sustainable.

41
What investments were included under “remainder”?
During the reference period, the fund was invested in some equity securities lacking sufficient data to assess against the product’s characteristics, cash and cash equivalents and money market instruments.
How did sustainable investments contribute a sustainable objective and did not significantly harm any other sustainable investment objectives?
How did the sustainable investments of the product contribute to a sustainable objective?
The investments in companies producing supplying water contributed to climate change adaptation and had a substantial contribution to GHG emissions savings through low specific energy consumption in the water supply system measured in kWh per cubic meter of water. Nonetheless, all of the selected companies supplying water might not be compliant with EU Taxonomy energy consumption thresholds for substantial contribution to climate change adaptation. Our applied threshold is that of 1 kWh per cubic meter of water, instead of 0.5 kWh as per the EU Taxonomy.
The activity of the company manufacturing aluminium relied on low carbon electricity and complied with the ASI Performance Standard.
How were principal adverse impacts taken into account?
Over the life of the product, we assess and monitor indicators that are deemed to indicate the presence of a principal adverse impact as per EU law, except for all biodiversity-related indicators, for which we are unable to collect data.
We addressed adverse impacts by tracking direct emissions of aluminium manufacturing and making sure they comply with the ASI Performance Standard. More details can be found under the Annual Report’s section on Adverse Impact.
Were any investments excluded due to their significant harm to sustainable investment objectives?
No. All investments qualifying as sustainable (15%) are screened against all significant harm indicators relevant water supply under the EU Taxonomy, with the exception of biodiversity-related indicators (e.g. the existence and implementation of site-level biodiversity management plan in alignment with the IFC Performance Standard 6: Biodiversity Conservation and Sustainable Management of Living Natural Resources).
Direct emission for primary aluminium production was below the value of the related EU-ETS benchmark.
How did this financial product perform compared to the reference sustainable benchmark?
How does the reference benchmark differ from a broad market index?
This product is 95% aligned with the TRXI World 5% Issuer Capped ESG Index. The Index is a capitalisation weighted index that limits company concentration by constraining the maximum weight of a company to 5%. It is a capped version of the TRXI World ESG Index which provides exposure to corporates across the world with excellent Environmental, Social and Governance (ESG) ratings and excludes companies which are producing nuclear power, owning fossil fuel reserves, producing tobacco or military weapons as well as any company from the gambling sector.
The TRXI World ESG Index is designed for investors seeking a diversified sustainable benchmark comprised of companies with strong sustainability profiles while avoiding companies incompatible with values screens. The RXI World ESG Index is constructed in the following way. First issuers producing nuclear power, owning fossil fuel reserves, producing tobacco or military weapons as well as any company from the gambling sector is excluded from the TRXI World Index. Then, a best in‐class selection process is applied to the remaining universe of securities in the parent index.
This section only concerns the portion of #1A sustainable investments illustrated above, and not the other E/S characteristics part.
An investment pursuing an environmental or social objective can only be considered “sustainable” where it does not significantly harm any (other) sustainability objective (i.e. it needs to be sustainable in all aspects and not just one).
Principal adverse impacts are the biggest negative impact of the investments on sustainability factors (environmental, social and employee matters, respect for human rights, anti‐corruption and anti‐bribery matters.)
A reference sustainable benchmark is an index against which it can be measured whether the financial product is meeting its environmental characteristics, or, where applicable, sustainable investment objective.

42
How did this financial product perform compared with the reference and broad market benchmarks?
This product is 95% aligned with the TRXI World 5% Issuer Capped ESG Index. The product excluded at least 70% of the TRXI World Index.
What actions have been taken to meet the environmental and/or social characteristics d uring the reference period?
Monitoring business activities of investee companies to ensure that the criterion of no ownership of fossil fuel reserves has been met.

43
Document D – Mock-up of pre-contractual template B with dashboard
Environmental and/or social characteristics
This product: Promotes E/S characteristics, but does not have a
sustainable objective
Has a sustainable objective – which means that it demonstrates a
contribution to an environmental or social objective, and it does not
significantly harm any (other) sustainability objective
What environmental and/or social characteristics are promoted by this financial
product?
The characteristics promoted by this financial product consist of investing in corporates with excellent
Environmental, Social and Governance ratings while excluding issuers producing nuclear power, owning fossil
fuel reserves, producing tobacco or military weapons as well as any company from the gambling sector.
This product is passively managed. Its objective is to track the performance of the TRXI World 5% Issuer Capped
ESG Index, and to limit to max. 1% the tracking error between the net asset value of the product and the
performance of the Index
What investment strategy does this financial product follow?
What investment strategy does this financial product follow to meet the E/S
characteristics?
The investment strategy aims at tracking the TRXI World 5% Issuer Capped ESG Index.
The TRXI World 5% Issuer Capped ESG Index applies a max 5% weight to the largest holdings
of the TRXI World ESG Index. The latter captures companies with excellent Environmental,
Socialand Governance ratings, following a best-in-class investment strategy, while excluding
issuers producing nuclear power, owning fossil fuel reserves, producing or selling tobacco or
military weapons as well as any company from the gambling sector.
Both the TRXI World 5% Issuer Capped ESG Index and the TRXI World ESG Index serve as a potential
replacement for current TRXI World index exposure for investors interested in selecting corporates with the
best ESG ratings while eliminating companies that have a negative impact on certain sustainability factors from
their portfolio.
At a glance
What is the investment strategy
ESG best-in-class approach and
exclusion
Use of benchmark?
Yes
An investment strategy is what guides the decision on what to invest in based on e.g. investment goals, risk tolerance and future needs for liquidity.
E/S stands for “environmental and/or social”
This financial product promotes environmental or social characteristics, but does not have as its objective a sustainable investment. It might invest partially in assets that have a sustainable objective, for instance qualified as sustainable according to the EU classification (Taxonomy).

44
What are the binding elements for the investment selection?
This product is aligned with the TRXI World 5% Issuer Capped ESG Index at 95%.
The TRXI World 5% Issuer Capped ESG Index, tracked by this product, targets securities of
companies with the highest ESG ratings making up 25% of the market capitalization in each
sector and region of the parent index. Companies must have an RTT ESG rating above 'BBB'
and the RTT ESG Controversies score greater than 4 to be eligible for the TRXI ESG Index.
The Index applies a maximum 5% weight to the largest holdings.
The exclusion of issuers producing nuclear power, owning fossil fuel reserves, producing
tobacco or military weapons as well as any company from the gambling sector is another binding element.
How is the strategy implemented in the investment process on a continuous basis?
The investment seeks to provide investment results that, before fees and expenses, correspond generally to the
total return performance of the TRXI World 5% Issuer Capped ESG Index. The fund generally invests
substantially all, but at least 95%, of its total assets in the securities comprising the index. In addition, it may
invest in equity securities that are not included in the index, cash and cash equivalents or money market
instruments. The fund is non-diversified.
Compliance with the characteristics is monitored on a regular basis.
Is there an amount of potential investments excluded, as a result of the implementation of the
selection criteria?
No
Yes, the implementation of the selection criteria leads to the exclusion of at least 50% of potential investments.
What is the policy to assess good governance practices of the investee companies?
The investee companies are rated for governance aspects using the RTT ESG Ratings (www.RTT-ESG-
Rating.com).
What is the minimum asset allocation planned for
this product?
The fund invests in direct holdings. In order to meet the
environmental or social characteristics promoted, the fund generally
invests at least 95% of its total assets in the securities comprising the
TRXI World 5% Issuer Capped ESG Index. Hence, 95% of the
investments are aligned with the environmental characteristics. This
includes 15% of the total investments that are qualified as
Investments
#1 Aligned with E/S
characteristics
#1A Sustainable: environmental
#1B Other E/S characteristics: environmental
#2 Other
Asset Allocation is one element of the implementation of the investment strategy, it describes which percentage of your investments goes into what type of assets.
The category #1 Aligned with E/S characteristics includes any investment that is aligned with the characteristic:
- The Subcategory #1A covers investments that are qualified as sustainable. A sustainable investment means an investment in an economic activity that contributes to an environmental objective, measured for example by key resource efficiency indicators such as CO2 emissions, or the use of water, or an investment that contributes to a social objective, such as tackling inequality or that fosters social cohesion.
- The sub-category #1B Other E/S characteristics covers investments aligned with the environmental or social characteristics that do not meet the criteria of ‘sustainable investment’.
- #2Remainder includes investments which are not aligned with the E/S characteristics, nor are qualified as sustainable.
Derivatives are financial instruments whose value derives from the value of an underlying asset, but is not equal to an actual investment in the underlying
Governance is about a company’s leadership, remuneration of staff (incl. executives), audits, internal controls, shareholder rights, tax compliance and its relations to other stakeholders.

45
sustainable, some of which are classified as environmental investments under the EU framework to facilitate
sustainable investment). 5% of the total investments do not incorporate any environmental or social
characteristic.
In which economic sectors are the investments made?
The fund is mostly exposed to the Information Technology and Health Care sectors.
Does this financial product make use of derivatives?
Yes No
If yes, how is the use of derivatives aligned with the
E/S characteristics?
What investments are included under “#2 Remainder”?
The fund may invest in equity securities that are not included in
the index, cash and cash equivalents or money market instruments.
How will sustainable investments contribute to a
sustainable objective and not significantly harm
any other sustainable investment objectives
during the reference period?
How will sustainable investments of the financial product
contribute to a sustainable objective?
Investments in solar photovoltaic energy production are considered
as significantly contributing to climate change mitigation under the
EU Taxonomy. The investments in companies supplying water
contribute to climate change adaptation. The activity of the
company supplying water has a substantial contribution to GHG emissions savings through low specific energy
consumption in the water supply system measured in kWh per cubic meter of water. Nonetheless, all of the
selected companies supplying water might not be compliant with EU Taxonomy energy consumption thresholds
for substantial contribution to climate change adaptation. Our applied threshold is that of 1 kWh per cubic
meter of water, instead of 0.5 kWh as per the EU Taxonomy.
How are principal adverse impacts on sustainability factors taken into account?
Sector exposure (%) #1A #1B #2 Total
Production electricity solar 15
Water supply 5
Other 17.6
Financial and insurance services 10.31
Manufacturing:Wholesale household goods 11.07
Manufacturing: Pharmaceuticals 14.86
Information & communication 36.16
Real estate 2
Treasury bonds 3
Total 20 75 5 100
This section only concerns the portion of sustainable investments illustrated above (#1A Sustainable), and not the other E/S characteristics part, nor the remainder
An investment that contributes to an environmental or social objective can only be considered “sustainable” where it demonstrates a contribution to an environmental or social objective, and it does not significantly harm any (other) sustainability objective.
Principal adverse impacts are the biggest negative impact of the investments on sustainability factors (environmental, social and employee matters, respect for human rights, anti‐corruption and anti‐bribery matters.)
The EU Taxonomy is a classification of environmental activities approved by the European Union.
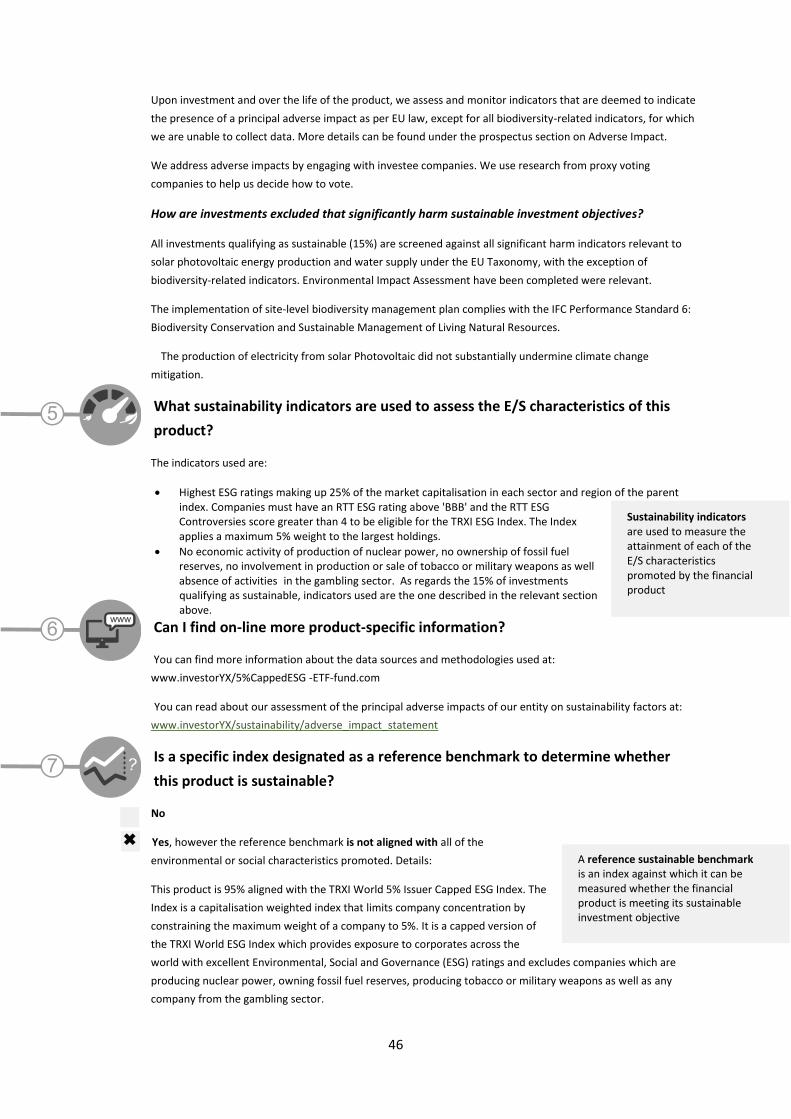
46
Upon investment and over the life of the product, we assess and monitor indicators that are deemed to indicate
the presence of a principal adverse impact as per EU law, except for all biodiversity-related indicators, for which
we are unable to collect data. More details can be found under the prospectus section on Adverse Impact.
We address adverse impacts by engaging with investee companies. We use research from proxy voting
companies to help us decide how to vote.
How are investments excluded that significantly harm sustainable investment objectives?
All investments qualifying as sustainable (15%) are screened against all significant harm indicators relevant to
solar photovoltaic energy production and water supply under the EU Taxonomy, with the exception of
biodiversity-related indicators. Environmental Impact Assessment have been completed were relevant.
The implementation of site-level biodiversity management plan complies with the IFC Performance Standard 6:
Biodiversity Conservation and Sustainable Management of Living Natural Resources.
The production of electricity from solar Photovoltaic did not substantially undermine climate change
mitigation.
What sustainability indicators are used to assess the E/S characteristics of this
product?
The indicators used are:
• Highest ESG ratings making up 25% of the market capitalisation in each sector and region of the parent index. Companies must have an RTT ESG rating above 'BBB' and the RTT ESG Controversies score greater than 4 to be eligible for the TRXI ESG Index. The Index applies a maximum 5% weight to the largest holdings.
• No economic activity of production of nuclear power, no ownership of fossil fuel reserves, no involvement in production or sale of tobacco or military weapons as well absence of activities in the gambling sector. As regards the 15% of investments qualifying as sustainable, indicators used are the one described in the relevant section above.
Can I find on-line more product-specific information?
You can find more information about the data sources and methodologies used at:
www.investorYX/5%CappedESG -ETF-fund.com
You can read about our assessment of the principal adverse impacts of our entity on sustainability factors at:
www.investorYX/sustainability/adverse_impact_statement
Is a specific index designated as a reference benchmark to determine whether
this product is sustainable?
No
Yes, however the reference benchmark is not aligned with all of the
environmental or social characteristics promoted. Details:
This product is 95% aligned with the TRXI World 5% Issuer Capped ESG Index. The
Index is a capitalisation weighted index that limits company concentration by
constraining the maximum weight of a company to 5%. It is a capped version of
the TRXI World ESG Index which provides exposure to corporates across the
world with excellent Environmental, Social and Governance (ESG) ratings and excludes companies which are
producing nuclear power, owning fossil fuel reserves, producing tobacco or military weapons as well as any
company from the gambling sector.
Sustainability indicators are used to measure the attainment of each of the E/S characteristics promoted by the financial product
A reference sustainable benchmark is an index against which it can be measured whether the financial product is meeting its sustainable investment objective

47
The TRXI World ESG Index is designed for investors seeking a diversified sustainable benchmark comprised of
companies with strong sustainability profiles while avoiding companies incompatible with values screens.
The TRXI World ESG Index is constructed in the following way. First issuers producing nuclear power, owning
fossil fuel reserves, producing tobacco or military weapons as well as any company from the gambling sector is
excluded from the TRXI World Index. Then, a best in‐class selection process is applied to the remaining universe
of securities in the parent index.
Yes, the reference benchmark is aligned with each of the environmental or social characteristics promoted by
the financial product. Details:

48
Document E – On-line survey
Consumer testing on disclosures for products promoting Environmental or Social characteristics
The survey is conducted by the Warsaw School of Economics (SGH) for EIOPA.
Three randomly assigned groups will be generated and each will be managed by a different 4 A4
disclosure document:
A. Mock-up of pre-contractual information A
B. Mock-up of pre-contractual information B
C. Mock-up of periodic Information B
Introduction to participants
New European regulation is developed about standardised information for financial products that
promote Environmental or Social characteristics or have a sustainable objective. The rules apply to
different types of products such as investment funds or pension products offered by insurers, banks,
asset managers and pension funds across the European Union.
We conduct this research to improve these mandated information documents.
We will show you a documents for an exchange traded fund (ETF). Most ETFs are index funds, this
means that they hold the same securities in the same proportions as a certain stock market index.
This product replicates a fictitious index, called TRXI World Fossil Fuel Free Index, which replicates the
total market index TRXI World Index, but excludes from it companies that own solid fossil fuel
reserves. This ETF (the fund) replicates only 95% of the TRXI World Fossil Fuel Free Index.
This document is part of the [group A/B: prospectus, group C: annual report] of the ETF.

49
Material and questions
<<Click here to start reading>>
Show relevant document
A. Mock-up pre-contractual disclosure with icons [33% of sample]
B. Mock-up pre-contractual disclosure without icons [33% of sample]
C. Mock-up periodic disclosure with icons [33% of sample]
<< Click here when you are done reading>>
Q2 Please indicate in what extent you agree or disagree with the following statements
[Statements are shown in random order]
All statements can be rated on a 5-point scale; completely agree-agree-neither agree nor disagree –
disagree – completely disagree
1. I understand the information in the document
2. The information document is attractive
3. The information document is too detailed
4. It is a good thing that the information is provided in the form of questions and answers
5. The information document helps me understand how sustainable the financial product is
6. [only Group A and B] The information document is useful to make a financial decision
7. [only Group C] The information document is useful
8. [only Group C] the list of 25 top investments is too long
9. [only Group A] the icons help me understand the content of each section
Q3 Please indicate how do you rate:
• The length of the text: text too long/just all right/too short
• Comprehensibility of the text: incomprehensible/partially understandable/comprehensible content
• Text layout: not enough space, discouraging reading/just allright/too much white space
• Font size: too small/ just right / too big
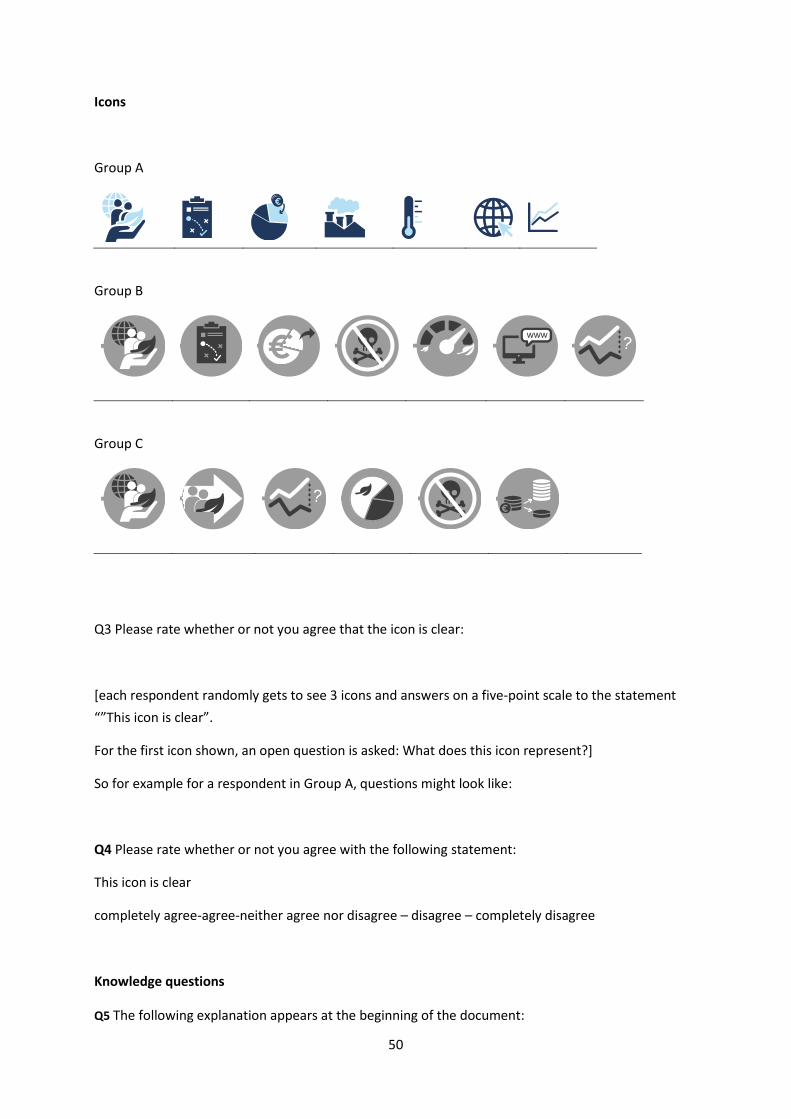
50
Icons
Group A
Group B
Group C
Q3 Please rate whether or not you agree that the icon is clear:
[each respondent randomly gets to see 3 icons and answers on a five-point scale to the statement
“”This icon is clear”.
For the first icon shown, an open question is asked: What does this icon represent?]
So for example for a respondent in Group A, questions might look like:
Q4 Please rate whether or not you agree with the following statement:
This icon is clear
completely agree-agree-neither agree nor disagree – disagree – completely disagree
Knowledge questions
Q5 The following explanation appears at the beginning of the document:

51
This product:
Has an ESG objective Promotes E/S characteristics
Please indicate which product has a more ambitious objective in terms of contributing to the environmental or social objective:
• 'Promotes environmental and/or social aspects' contributes more to sustainable development than 'has a sustainable objective'
• "Promotes environmental and/or social aspects" contributes equally to sustainable development as "has a sustainable purpose"
• "Promotes environmental and/or social aspects" is less important for sustainable development than "has a sustainable goal" [CORRECT]
[Group A and B] Q6 Does this product rely on derivatives?
• Yes
• No [CORRECT]
• I don’t know Q7 This chart is located in the section titled "What is the minimum asset allocation for this product?"
and completes the asset description.
Please indicate which asset category is greener, i.e. that it has a more ambitious objective of
contributing to the environmental or social objective:
Investments
#1 Aligned with E/S
characteristics
#1A Sustainable: environmental
#1B Other E/S characteristics: environmental
#2 Other

52
• "Other investments promoting environmental and social aspects" have a more ambitious objective
than "sustainable investments"
• 'Other investments promoting environmental and social aspects' are equally ambitious in terms of
sustainability as 'sustainable investments'
• "Other investments promoting environmental and social aspects" are less green than "sustainable
investments" [CORRECT]
Q8 Approximately what percentage is invested in sustainable investments?
• 95%
• 15% [CORRECT]
• 5%
Q9 Proszę zakończyć zdanie. Większość inwestycji jest przeznaczona na...:
Please complete the sentence. Most of the investments are allocated to...:
a) …Information technology, manufacturing of pharmaceuticals, financial activities and other [CORRECT]
b) …Water supply and Production of Electricity from Solar energy c) …Treasury bills and real estate d) I don’t know