Embed Size (px)
Citation preview

Consumer Store Choice Dynamics: An Analysisof the Competitive Market Structure forGrocery Stores
PETER T. L. POPKOWSKI LESZCZYCUniversity of Alberta
ASHISH SINHAUniversity of Waikato
HARRY J. P. TIMMERMANSEindhoven University of Technology
This study aims at formulating and testing a model of store choice dynamics to measure theeffects of consumer characteristics on consumer grocery store choice and switching behavior.A dynamic hazard model is estimated to obtain an understanding of the componentsinfluencing consumer purchase timing, store choice, and the competitive dynamics of retailcompetition. The hazard model is combined with an internal market structure analysisusing a generalized factor analytic structure. We estimate a latent structure that is bothstore and store chain specific. This allows us to study store competition at the store chainlevel such as competition based on price such as EDLP versus a Hi-Lo pricing strategy andcompetition specific to a store due to differences in location.
Competition in the retailing industry has reached dramatic dimensions. New retailingformats appear in the market increasingly more rapidly. A focus on a particular aspect ofthe retail mix (e.g., service or price) means that retailers can compete on highly diversedimensions. Scrambled merchandising and similar developments have implied that par-ticular retailers are now competing against retailers they did not compete with in the past.
Peter T. L. Popkowski Leszczyc is Associate Professor of Marketing, University of Alberta, Department ofMarketing, Business Economics and Law, 4–30F Faculty of Business Building, Edmonton, Alberta, CanadaT6G 2R6 (e-mail: [email protected]). Ashish Sinha is Assistant Professor of Marketing, Universityof Waikato, Department of Marketing and International Management, Private Bag 3105, Hamilton, New Zealand(e-mail: [email protected]). Harry J. P. Timmermans is Professor of Urban Planning and Director EuropeanInstitute of Retailing and Services Studies, Eindhoven University of Technology, Faculty of Architecture,Building and Planning, P.O. Box 513, 5600 MB Eindhoven, The Netherlands (e-mail: [email protected]).
Journal of Retailing, Volume 76(3) pp. 323–345, ISSN: 0022-4359Copyright © 2000 by New York University. All rights of reproduction in any form reserved.
323

These trends can be observed in all segments of the retailing industry including thegrocery industry, albeit perhaps in different form and intensity.
As a result of these developments, consumers face a retail environment in constant flux.They continuously must decide to stay loyal, try out new formats, or use the completesystem to obtain benefit from discounts on specific days or for specific items. Previousresearch has reported low store loyalty and significant store switching for grocery storepurchases (Kau and Ehrenberg, 1984; Uncles and Hammond, 1995; Popkowski Leszczycand Timmermans, 1997). Given these findings, it is important to incorporate the storeswitching behavior in the study of consumer store choice. Furthermore, consumer reac-tions to a rapidly changing retail environment will additionally depend upon idiosyncraticpreferences and socio-economic characteristics that either allow or restrain them frompursuing some of the options. For example, active search requires a substantial amount oftime that households working long hours may not have.
For the retailer, the problem is how to cope with the increased competition in light ofthe dynamics of consumer shopping behavior. Should retailers invest in loyal consumersand not worry too much about the customer who is cherry-picking the market? Or, shouldone try to aggressively attract new customers? Or perhaps should they try to capture asubstantial share of the switching population of shoppers?
To make better informed decisions on this issue, retailers need to know more about thetiming of shopping trips, store choice, and switching behavior of consumers, together withthose factors that influence this relationship, to develop appropriate strategies. Hence,according to this framework, it is pertinent to know the magnitude of store loyal/storeswitching behavior, the nature of the competitive structure in their market and how it ischanging, and to be aware of any differences in these regards between consumer segments.
The dynamic store choice decision can be conceptualised as a problem of deciding whereand when to shop. The first decision is the traditional store location choice problem. Thesecond is the shopping trip incidence problem relating to the timing of shopping trips andimplies information about intershopping trip times. Information on a sequence of shopping tripevents yields information about the number or percentage of consumers choosing the samestore on subsequent shopping trips (repeat shopping or store loyalty). Transitions betweenstores on successive shopping trips provide measures of store-switching behavior.
These two choice processes are, of course, interrelated. Store choice is dependent on thetiming of shopping trips, as consumers may go to a smaller local store for short ‘fill-in’trips and go to a larger store for regular shopping trips (Kahn and Schmittlein, 1989). Also,store choice and shopping trip timing decisions tend to differ for individuals and house-holds as a result of personal differences, household composition, and activity patterns(Popkowski Leszczyc and Timmermans, 1997; Kim and Park, 1997).
Most previous research has focused only on the timing or the store choice decision.Furthermore, the majority of research studying store choice behavior has applied cross-sectional data. To the extent that prior research has considered the dynamics of storechoice, it has been limited by the assumptions made. For example, the dynamic Markovmodel (Burnett, 1973) is based on the assumptions that the average number of shoppingtrips is the same in each successive, equal-length time period, and that the transitionmatrix is time-invariant. Hence, store choice probabilities are constant over time. TheNBD and Dirichlet models, which have been applied to store choice (see, e.g., Kau and
324 Journal of Retailing Vol. 76, No. 3 2000

Ehrenberg, 1984; Wrigley and Dunn, 1984, 1985) combine purchase timing and storechoice. However, they employ the assumption that shopping trips are made in equal timeperiods, and that the number of purchases at a particular store by a single consumer orhousehold in successive equal time periods is independent. This research further limitedconsideration of shopping trips toseparateproduct classes. Shopping trips for all otherpurchases are not included in the analysis.
To overcome the shortcomings of previous research, we propose a dynamic model ofstore choice, a hazard model, where store choice is dependent on the timing of shoppingtrips. The hazard model is a Semi-Markov or Markov Renewal process (Howard, 1964).Store choice is modeled by a discrete-state space consisting of the choice set of stores, andintershopping time is incorporated by allowing the time between shopping trips (thetransition rates) to be a random variable after some distribution function. Hazard ortransition rates are estimated for transitions between all stores, including repeat shoppingtrips and switching between different stores (e.g., Kalbfleisch and Prentice, 1980).
In terms of modeling consumer store choice dynamics, the use of hazard functions isappropriate in the sense that the hazard rate, defined in this context as the rate at whicha new shopping trip is made at some timet, given that the consumer has not shopped untiltime t, can be linked to covariates that indicate how and to what degree these influenceconsumer store choice dynamics and the competitive structure of the retail market. Inparticular, hazard models allow one to derive the effects of explanatory variables onintershopping timing and store choice from scanner panel data. This model specificationhas been used to study brand switching behavior (Vilcassim and Jain, 1991; Go¨nul andSrinivasan, 1993; Popkowski Leszczyc and Bass, 1998; and Chintagunta, 1998), butapplications to store choice are lacking.
We employ this hazard model to estimate competition both at the store and store chainlevel by combining it with an internal market structure analysis. We estimate a generalizedfactor analytic structure model (Sinha, 2000). This has a latent structure with an idiosyn-cratic component that is store chain specific and a common factor that is both store andstore-chain specific. This structure allows us to study store competition at the store-chainlevel (e.g., competition based on price, such as EDLP vs. a Hi-Lo pricing strategy) andcompetition specific to a store (e.g., due to differences in location). Furthermore, theidiosyncratic component estimates the unique unobserved components of store chains.This is an extension of the model by Chintagunta (1998). Different from Chintagunta(1998), we specify a factor analytic structure on the self-transitions and the shapeparameters of the hazard model. This provides a more general and parsimonious model.
We begin by discussing the relevant literature on store choice dynamics. Next, wediscuss the methodology and our model’s properties. Then, the data are briefly discussed,followed by a general summary of estimation results. Finally, we provide conclusions andareas of future research.
LITERATURE REVIEW
Dynamic models of store choice behavior have received relatively limited attention in theliterature. There are a number of articles that have usedaggregate levelsupermarket
Consumer Store Choice Dynamics 325
scanners to study the effectiveness of marketing mix variables on store sales and storesubstitution. Normally, weekly sales levels for brands within specificproduct categoriesare related to marketing mix variables. For example, Hoch et al. (1994), Wittink et al.(1987), Kumar and Leone (1988), and Blattberg and Wisniewski (1987) have investigatedthe efficacy of individual brand promotions on store choice and store sales. Although thesestudies provide valuable information about the effects of marketing mix variables on storesales, aggregate store data do not reveal individual store switching behavior. To studystore switching behavior, we need individual level data.
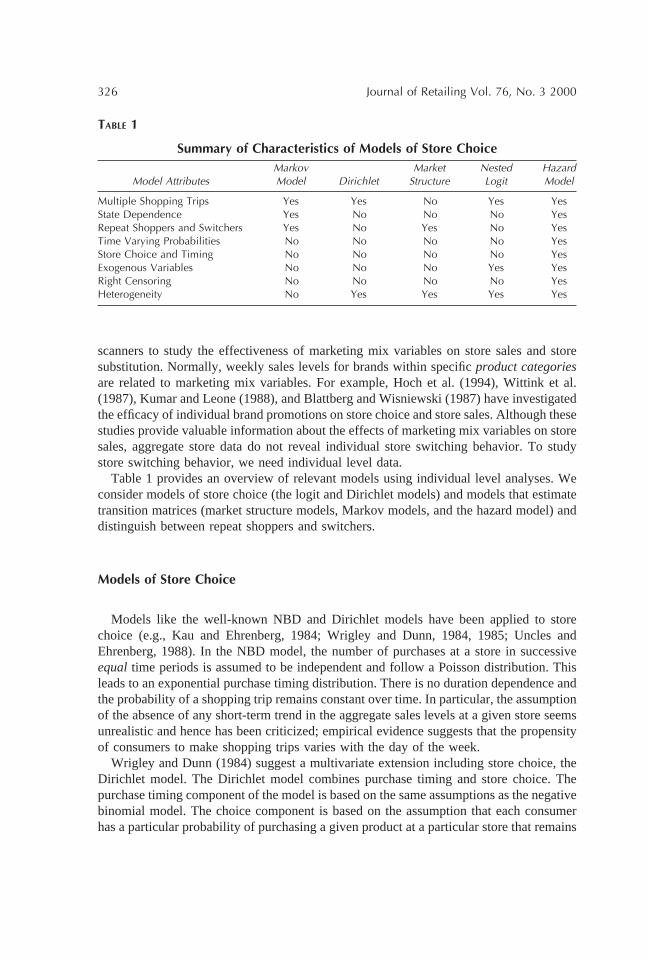
Table 1 provides an overview of relevant models using individual level analyses. Weconsider models of store choice (the logit and Dirichlet models) and models that estimatetransition matrices (market structure models, Markov models, and the hazard model) anddistinguish between repeat shoppers and switchers.
Models of Store Choice
Models like the well-known NBD and Dirichlet models have been applied to storechoice (e.g., Kau and Ehrenberg, 1984; Wrigley and Dunn, 1984, 1985; Uncles andEhrenberg, 1988). In the NBD model, the number of purchases at a store in successiveequal time periods is assumed to be independent and follow a Poisson distribution. Thisleads to an exponential purchase timing distribution. There is no duration dependence andthe probability of a shopping trip remains constant over time. In particular, the assumptionof the absence of any short-term trend in the aggregate sales levels at a given store seemsunrealistic and hence has been criticized; empirical evidence suggests that the propensityof consumers to make shopping trips varies with the day of the week.
Wrigley and Dunn (1984) suggest a multivariate extension including store choice, theDirichlet model. The Dirichlet model combines purchase timing and store choice. Thepurchase timing component of the model is based on the same assumptions as the negativebinomial model. The choice component is based on the assumption that each consumerhas a particular probability of purchasing a given product at a particular store that remains
TABLE 1
Summary of Characteristics of Models of Store Choice
Model AttributesMarkovModel Dirichlet
MarketStructure
NestedLogit
HazardModel
Multiple Shopping Trips Yes Yes No Yes YesState Dependence Yes No No No YesRepeat Shoppers and Switchers Yes No Yes No YesTime Varying Probabilities No No No No YesStore Choice and Timing No No No No YesExogenous Variables No No No Yes YesRight Censoring No No No No YesHeterogeneity No Yes Yes Yes Yes
326 Journal of Retailing Vol. 76, No. 3 2000

the same over the periods analyzed. The probabilities for a given store follow a betadistribution, whereas they are assumed to follow a Dirichlet distribution for all stores. Thefinal and most limiting assumption is that the store choice and purchase timing compo-nents are independent. Again, this is a very limiting assumption. One would expect thatthe choice behavior of heavy users is different from that of light users and that differenceswould be expected between regular versus ‘fill-in’ trips.
Although the NBD and Dirichlet models provide good descriptions of market behaviorunder equilibrium conditions, they do not provide information about the underlying causalvariables explaining shopping behavior.1 The logit model has been used to study theeffects of exogenous variables on store choice (Bell and Lattin, 1998; Fotheringham,1988). Bell and Lattin (1998) have studied consumer shopping behavior and the effect ofpricing format (Hi-Lo vs. EDLP) on store choice. They estimated a simple logit model forstore choice, where choice is a function of distance, whether a purchase has been made ata store during the initialization period, of feature advertising for a store, and of thehousehold expectations about basket attractiveness at stores. The expected basket attrac-tiveness, conditional on small versus large basket size shoppers, is calibrated using anested logit model of brand choice and purchase incidence.2 They concluded that largebasket shoppers prefer EDLP stores, whereas small basket shoppers prefer to shop atstores using a Hi-Lo pricing strategy.
Sinha (2000) estimated a factor analytic nested logit model that combines spatialinteraction models with internal market structure analysis. Store choice is estimated as atwo-stage process where consumers first select a region or suburb and next select a storewithin this region. Although this model provides information concerning the competitiveretail market structure, it only utilizes information concerning the share of householdshopping trips to different stores. Data are obtained through a mail survey, askinghouseholds the percentage of times they visited different stores.
There are two major disadvantages to the models of store choice discussed above: (1)the actual timing of shopping trips is not included, and store choice and timing of shoppingtrips are independent; and (2) they ignore the switching behavior by households that mayprovide important information about the competitive market structure.
Estimating Switching Patterns and Transition Matrices
Other research has focused on switching and repeat purchasing behavior utilizinginformation from the transition matrix. Market structure models have been applied tobrand choice (Grover and Srinivasan, 1987), or purchase timing (Grover and Rao, 1988).These generally aggregate purchases to form a switching matrix that is used to estimateloyal and switching segments. For example, Grover and Srinivasan (1987) used only tworandomly selected purchase occasions as consumer purchases are assumed to follow azero-order process. Hence, these models do not incorporate state dependence and do notincorporate the effects of exogenous variables.3
The Markov model has been applied to studies of dynamic store choice (e.g., Burnett,1973). In this model, the transition matrix is derived from observed choice patterns/
Consumer Store Choice Dynamics 327

switching behavior at successive shopping time periods allowing for state dependence,consumers are homogeneous, and unlike most models, includes the effects of exogenousvariables. Because the timing of shopping trips is distributed uniformly (the averagenumber of trips is the same in each successive, equal length time period), choiceprobabilities are not time varying. That is, it assumes that the probability of choosing aparticular storei at time t, given that storej was chosen att-1, is constant over time.Consequently, the probability that a store will be chosen at timet is dependent upon thechoice of store at timet-1, but is independent from the time that has passed since theprevious shopping trip.4
Effect of Exogenous Variables on Store Choice
Ideally, one could argue that the data required to derive better informed decisions aboutpossible retail strategies are collected in the context of fieldwork through local, consumerpanels. Panelist behavior is recorded over time and modeled as a function of householdcharacteristics, store location and layout, and store marketing mix variables. However,such data have not typically been made widely available (yet) by members of the foodindustry. At best, scanner panel data provide the pattern of consecutive purchase occa-sions. As a result, although many of the more underlying, structural relationships andmechanisms can be identified, the specific effects of store marketing strategies onconsumer behavior cannot be modeled.5
The value of this last information lies in providing an opportunity to make better-informed decisions about strategic positioning and advertising as opposed to specificoperational decisions for different consumer segments. In this study we include householddemographics such as the number of family members in a household, total householdincome, number of weekly hours worked by a household, amount spent in a store duringa shopping trip.
METHODOLOGY
Household grocery store shopping behavior consists of three decision processes, thetiming of the shopping trip, store choice, and the amount to spend. A customer firstdetermines whether there is a need to go shopping or not. Next, the shopper may decidewhat purchases need to be made (the amount to spend) and based on this, choose aparticular store. If just a few items are needed, for example, the shopper may go to a storenearby. Alternatively, a shopper may first select a store and then determine how much tospend. Here, the selection of the store may impact the amount spent, as the shopper maymake impulse purchases related to the store environment, such as in-store specials anddisplays. Because the amounts to spend and store choice decisions are interrelated, it isdifficult to model both separately. Therefore, store choice and timing decisions aremodeled endogenously, whereas the amount to spend is specified exogenously.
328 Journal of Retailing Vol. 76, No. 3 2000

To overcome the shortcomings of the models briefly discussed in this literature review,we develop a comprehensive model of store choice behavior that incorporates all com-ponents specified in Table 1. We employ a hazard model that simultaneously incorporatesthe store choice and the interpurchase timing decisions, assuming dependence between thetwo processes. The hazard model further incorporates state dependence, duration depen-dence, and the effects of exogenous variables on the decision processes. In the followingsections, we discuss the conceptual underpinnings of the model, its properties. We thenfollow with an empirical illustration using scanner panel data for grocery shopping.
Modeling Dependence of Store Choice and Shopping Trip Timing
As noted, we expect store choice and timing of a shopping trip to be correlated becauseconsumers may go to a neighborhood store for fill-in trips and to a larger store for regularweekly shopping trips (Kahn and Schmittlein, 1989, 1992). In addition, heavy and lightshoppers tend to differ in their shopping patterns. Households who shop less often tend tobe more store loyal and spend more to take better advantage of each shopping trip.Frequent shoppers tend to switch more often, possibly to take advantage of price specials(Kim and Park, 1997; Popkowski Leszczyc and Timmermans, 1997). Therefore, it isimportant to incorporate the dependence between store choice and shopping trip timing aswell as state dependence. This is because store choice may be dependent on the type ofshopping trip made and, hence, the previous store selected.
We capture the dependence between store choice and timing of shopping trips by useof a Semi-Markov model. Store choice is modeled by a discrete state space consisting ofthe choice set of stores, and intershopping time is incorporated by allowing the timebetween shopping trips (transition rate) to be a random variable after some distributionfunction. Transitions between stores are made according to the transition probabilitymatrix of a Markov process, but the time between these transitions can be any randomvariable that depends on the transitions. We incorporate state dependence by estimating acompeting risk model that derives hazard or transition rates for different transitions amongstores. This is the most general specification and it assumes that the transitions areconditional upon the store last visited. To test for possible bias, we compare our hazardmodel with a logit model for store choice.
Models like the Dirichlet model assume duration independence, implying the proba-bility of making a shopping trip remains constant over time. We expect this assumptionto be violated, as consumers are less likely to go to a store just after a shopping trip hasbeen made. The hazard model allows for duration dependence, as one can incorporatevarious distribution functions that drive a dependence structure. To test for durationdependence, we compare model fit with the exponential distribution, which has a constanthazard function implying duration independence, with other distribution functions. Basedon the shape of the hazard function, we can study acceleration of shopping trips.
Researchers ignore these dependencies at their peril as they may lead to biased resultsand different implications for retail strategies. The failure to estimate the dependencebetween store choice and shopping trip timing may also lead to a misspecified model
Consumer Store Choice Dynamics 329

(Chintagunta, 1998), whereas ignoring state dependence may lead to badly biased results(Heckman, 1981; Elrod and Keane, 1995). The hazard model allows us to model thesedependencies and provides additional insights not available from other models.
For example, the hazard model provides insights into the timing of household shoppingpatterns and the forces that influence them. Furthermore, we can identify differentsegments of shoppers based on household characteristics or behavioral variables. Includ-ing state dependence allows for the estimation of hazard functions for transitions amongstores. These estimates provide a picture of store choice and switching behavior and allowus to distinguish between repeat shoppers and switchers. Duration dependence providesinformation about the patterns of shopping trips over time, and influences these andpossible answers to the following questions. Who are the frequent shoppers? How oftendo they shop? What strategies can successfully be used to accelerate shopping trips?
The Hazard Model
To specify the hazard model, we require a separate set of assumptions or sub modelsconcerning the (1) transition probabilities (pjl) that predict the probability that a particularstore l will be chosen at timet, given that storej was chosen at the previous shoppingevent; (2) the distribution of intershopping trip times, which relates to assumptions aboutduration dependence; and (3) heterogeneity in consumer choice behavior.
Let T be a nonnegative random variable that denotes the duration in a state (the timeuntil a shopping trip) of a sample of households, and defineg(t) as the hazard function ofT. To examine loyalty and switching behavior, we need to incorporate the choice set in themodel. This is known as thecompeting riskmodel. Let j and l be the running indicesdistinguishing stores. Then, we need to define a hazard rate function for (i) each transitionbetween storej and storel, which represents store switching behavior; and (ii) repeat tripsto the same store (j 5 1,2, . . . ,J). Let P(tn(l)) be the probability that thenth shopping tripis made to storel at timet1Dt, when a shopping trip was made to storej at timet. Thenthe hazard function can be expressed as:
gjl (t) 5 limDt30
P(tn(l) # Tn(l) , tn(l) 1 Dt(l)uTn(l) $ tn(l))
Dt(1)
This hazard rate thus gives the unobserved rate of making a shopping trip at timet to storek, given that no shopping trips were made up to timet, within some time period. Thehazard function can also be specified as follows:
gjl (t) 5 fjl (t)/Sj(t) (2)
where,gjl(t) is the hazard rate for a switch from storej to storel;fjl(t) is the probability density function of the duration, which is the likelihood of a
shopping trip to storek given a previous trip to storej at time t;Sj(t) is called the survival function, or the likelihood that a household has not gone to
a store until timet, after a shopping trip to storej.
330 Journal of Retailing Vol. 76, No. 3 2000

The Intershopping Time Distribution
Next we need to specify the distribution of the baseline hazard function. Unfortunately,little theory and empirical evidence is available to support the decision about the shape ofthe intershopping time distribution.6 Therefore, to overcome misspecification bias, wecompare several different distributions. These distributions are continuous because con-sumers can shop at any time. In particular, we estimate models incorporating exponential,Weibull, log-logistic, and Gamma intershopping time distributions (details of thesedistributions can be found in Lawless, 1982).
The exponential distribution has a constant hazard function. Hence, the chance ofmaking a shopping trip over a specified short period of time is the same regardless of whenthe last shopping trip was made. The hazard function of the Weibull distribution ismonotonically increasing if the shape parameter is larger than 1, and monotonicallydecreasing if the shape parameter is smaller than 1, and hence is a more likely candidateto examine store choice dynamics. The log-logistic distribution is more flexible andresembles the Weibull distribution if the shape parameter is smaller than one, andresembles the lognormal distribution if the shape parameter is larger than one. The gammadistribution is the most flexible distribution, and the exponential and Weibull distributionsare limited cases of the gamma distribution.
Finally, we include heterogeneity, because omitting heterogeneity may lead to biasedparameter estimates and spurious state dependence (e.g., Vilcassim and Jain, 1991, Go¨nuland Srinivasan, 1993). Within the empirical Bayes methodology, there are three differentapproaches that have been used to incorporate heterogeneity: (1) numerical integration(Elrod, 1988); (2) a semiparametric approach (Chintagunta, 1994); and, (3) Monte-Carlosimulation techniques (Erdem, 1996). As discussed in Sinha (2000), each of these methodshas its own merits and demerits. Due to lack of space, we do not describe the advantagesand disadvantages of these different methodologies. Interested readers are referred toSinha (2000). For the purpose of this article, we use a latent class approach (Kamakuraand Russell, 1989; Chintagunta, 1994) for specifying and estimating heterogeneity. In thismethod, the heterogeneity distribution is approximated by a discrete distribution with afinite number of support points.
Model Formulation
Having specified the subcomponents of the model, we next specify our model formu-lation. In this section we will only discuss in detail the log-logistic distribution asempirical analyses have shown that this is the preferred specification, although this modelcan easily be applied to other distributions without loss of generality.
The hazard function for segments at timet for a switch from thej-th store of chaink,to the l-th store of chainm, is given as follows:
lsj(k)l(m) 5ksl(m)*{ rsj(k)l(m)
ksl(m) }t (ksl(m)21)
11{ rsj(k)l(m)ksl(m) }t ksl(m)
, (3)
Consumer Store Choice Dynamics 331

where,k is the shape parameter,r is the scale parameter of the log-logistic distribution,ands is the number of latent segments.
Making the exogenous variables a function of the scale parameter, we re-expressk andr as follows:
ksl(m) 5 exp(hosl(m)), and, (4)
rsj(k)l(m) 5 exp(h1sl(m)j(k) 1 Spxip * gps),
where,hosl(m), h1sl(m)j(k) andg are parameters to be estimated, x are demographic variablesfor the i-th household, and p is the number of variables.
This specification leads to an accelerated failure time model as the exogenous variablesdirectly impact the failure times (e.g., Gupta, 1991; Cox and Oakes, 1988).7 The totalnumber of parameters that need to be estimated for the unconstrained hazard model isgiven by (d2 1d) * s, whered is the number of stores ands is the total number ofsegments. For our empirical analysis with 21 stores, this would require 924 parameters fora two-segment solution. Apart from computational intractability, these estimates wouldalso suffer from lack of interpretability. To alleviate these problems, we use a factoranalytic structure (for a more in-depth discussion see Elrod and Keane, 1995; Erdem,1996). This allows us to capture store competition using a parsimonious specificationwithout loss of generality whereas estimating only a small fraction of the total number ofparameters of the unconstrained model.
The factor analytic model assumes that competition among a set of stores or chains isrepresented by anN (usually 2 or 3) dimensional market structure map. The dimensionsare latent constructs on which stores/chains differ; these are the common factors describ-ing all stores. The model estimates the location of the stores-chains in the consumers’perceptual space and the weights they attach to these. These relative store positions havedirect implications for store competition (Elrod, 1991). In addition, there are certain latentattributes that are unique to each store-chain, or so called idiosyncratic variables (Sinha,2000).
We next show how the factor analytic structure provides a parsimonious way ofestimating the parameters for the switching matrix. We simplify Equation (3) by imposinga factor structure on the shape of the hazard function, assuming that the shape parameterdepends upon the underlying characteristics of the store. This is a realistic assumption aswe expect that consumers who, for example, prefer an EDLP store chain are less likely toswitch (have a lower hazard rate) to a Hi-Lo store, and vice versa. In addition, consumerswith a higher utility for leisure time will have higher rates of shopping for stores that arein a suburb closer to their home or work. We first specify the shape parameters of thehazard function as follows:
hosl(m) 5 al(m)*wsst 1 am*ws
c 1 m, (5)
where,a l (m) denotes the location of thel-th store for chain m along the store dimension,
332 Journal of Retailing Vol. 76, No. 3 2000

am denotes the location of them-th chain along the store chain dimension,ws
st, wsc are the importance weights that consumers in segmentSattatch to store (ws
st) andstore chain (ws
c) characteristics, andm is an intercept term that captures the average shapeparameter across stores, store chains, and segments.Equation (5) specifies how the shape parameter of the hazard function is impacted by theunobserved attributes common to stores and chains.m is an estimate of the average shapeparameter, andal(m)* ws
st captures the extent to which the shape parameter for each storedeviates from the grand mean. Next, we apply a factor analytic structure to the interceptterm of the transition parameter. For better exposition, we rewrite the intercept term forthe transition parameter as follows:
hsj(k)l(m) 5 lsl(m) 1 wsj(k)l(m), (6)
where,al (m) are parameters for self transitions (or the diagonal of the switching matrix) in whichconsumers choose the same store in two consecutive time periods, and,wsj(k)l(m) charac-terizes the transition from store j(k) - l(m).
This equation specifies the parameter that characterizes a transition from thej-th storeof chaink to thel-th store of chainm. In all, there ared s parameters for repeat shoppingtrips (the diagonal of the switching matrix), andd (d-1) sparameters for switches betweenstores (the off-diagonals of the switching matrix). We assume that the relative rate of ahousehold visiting the same store and store chain is common across stores within a storechain. Hence,lsl(m)5 am, wheream is a parameter that characterizes the diagonal of theswitching matrix. Therefore, we only need to estimatem chain specific parameters tocharacterize the diagonal of the switching matrix. We also estimated a model with storespecific parameters, but rejected the fit of this model in favor of the model with chainspecific parameters.
The switching parameters or the off-diagonals of the switching matrix can also berepresented by the following factor analytic structure (Chintagunta, 1998; Erdem, 1996):
wsj(k)l(m) 5 bsst*dst 1 bs
c*dc, (7)
where, dst 5 (aj(k) 2 al(m))2, and dc 5 (ak 2 am)2.
The rationale behind Equation (7) is that a switch from thej-th store of chaink to thel-th store of chainm is dependent upon the perceptual distance between the two stores (jand l) and the two store chains (k andm). Both bst andbc measure the extent to which asegment consists of store loyals or switchers and store chain loyals or switchers respec-tively. The perceptual distance between two stores or chains (given bydst and dc), isexpected to be positive (negative) for switching (loyal) segments, as the likelihood ofswitching decreases (increases) when the perceptual distance between two stores increases(decreases).
Equation (7) provides a parsimonious way of incorporating all possible transitions.Transitions between two stores are represented byj(k)-l(m), meaning that a household
Consumer Store Choice Dynamics 333

switches from thej-th store of chaink to the l-th store of chainm. There are threepossibilities: (1) a household chooses the same store and same chain, represented byj(k)-j(k); (2) a household chooses a different store within the same chain, represented byj(k)-l(k); and, (3) a household selects a different store and different chains, represented byj(k)-l(m). For a repeat trip to a store, bothdst 5 0 anddc 5 0; if a household chooses adifferent store within the same chain, thendst . 0 anddc 5 0, and if a household choosesa different stores in a different chain, thendst . 0 anddc . 0.
Estimation
Let the set of parameters that need to be estimated be given byQ and the demographicvariables be given byX, and all sets of transition (including self transitions) are given by{ j(k),l(m)},then the likelihood for thei-th individual is given as follows:
Li(QuX) 5 F Pj(k)2l(m)
lij(k)l(m)(tuX, Q)*Sij(k)l(m)(tuX, Q)G*Sij(k)l(m)(tuX, Q), (8)
where the survivor is given by:
Sij(k)l(m)(tuX, Q) 5 exp(2E0
t
lij(k)l(m)(u)du)
The term in the square brackets represents the likelihood of switching fromj(k) to l(m),whereas the last term in Equation (8) accounts for the right censoring of the data.
Finally, summing Equation (8) over all households and incorporating heterogeneity, weobtain the likelihood function:
L(QuX) 5 Pi { SsL(QsuX)ps} (9)
where,s 5 the number of segments.As mentioned previously, heterogeneity in parameter estimates is approximated by a
discrete distribution with a finite number of support points (Chintagunta, 1998). Theparameters are estimated by Maximum Likelihood estimation using the Gauss softwarepackage.
Model Identification
The model described in its current form in the section above is overidentified, that is,it has several solutions and requires certain parameters to be constrained to obtain uniqueresults. All factor analytic models suffer from four indeterminacies: (1) rotational equiv-
334 Journal of Retailing Vol. 76, No. 3 2000

alence, (2) translational equivalence, (3) reflection equivalence, and (4) scaling (seeErdem, 1996; Sinha, 2000 for further details). Therefore, the following assumptions aremade to identify the model:
1. For translational equivalence, one of the store locations is fixed to zero.2. For rotational equivalence, one of the stores is made to lie along one of the two
axes.3. For reflection equivalence and for scale equivalence, bothwsst andwsc for one of
the segments is fixed to a value of 1. The choice of segment is arbitrary andinconsequential to the final result.
In addition, there are constraints on the maximum number of parameters that can beestimated for each of the three subcomponents of the hazard models. For the shapeparameter, a maximum ofds parameters are estimable; for self transitions, a maximum ofds parameters andd*(d-1)*s parameters for store switching are estimable.
DATA ANALYSIS AND RESULTS
The data used in the present study are scanner panel data provided by A.C. Nielsen, Inc.The data consist of all shopping trips for 1438 consumers at 21 groceries stores from fivedifferent store chains in Springfield Missouri. Data are available for a period of close to3 years (1986–1988). The first 52 weeks are used to calibrate the shopping frequencyvariable (total number of shopping trips), indicating whether a household is more of a‘heavy or light’ shopper. Those households with incorrect or incomplete data weredeleted, leaving 169,661 shopping occasions for 1367 consumers. From these, we selecteda random sample of 167 households consisting of 29,743 shopping trips that is used forestimation purposes. Store choice data are available for all households, including theactual store visited, the week of the store visit, amount spent, shopping frequency, andconsumer demographics. Table 2 provides summary statistics of the exogenous variablesincluded in the study. ‘Family income’ is the total, combined income for a family, ‘Hoursworked’ is the number of hours worked per week (for both males and females combined),
TABLE 2
Summary statistics of exogenous variablesVariable Mean Standard Deviation
Household Size 2.69 1.26Family Income $28,647 17259Shopping Frequency 76.69 39.48Hours Worked 43.38 32.48Amount Spent Per Trip $20.09 20.93N 169,661
Consumer Store Choice Dynamics 335

and ‘Amount spent’ is the total dollar expenditure per shopping trip including productswith and without bar codes.
Results from the Hazard Model
The four different, continuous intershopping time distributions specified in Table 3were estimated. All the models were tested using the BIC criterion and the results showthat the log-logistics distribution provides the best fit. Therefore, we only report the resultsof the heterogeneous log-logistic hazard model. Table 4 provides the estimates for atwo-segment model that has the best fit. Overall results reveal considerable switchingbetween stores and store chains (as indicated by parameters 29 and 30,bst, andbc). Theb parameter is a measure of state dependence: forb , 0 it measures household inertia orrepeat shopping, forb . 0 it measures household switching or “variety-seeking” tendency(Chintagunta, 1998), and whenb 5 0, shopping behavior is zero-order.
The magnitude of the switching parameter is greater for store chains, but this is to beexpected as these numbers are relative to the latent store attributes (the al(m) and amparameters, discussed below), which have a significantly larger spread for the store data.Segment one can be characterized as store and chain switchers or “variety-seekers,”whereas segment two consists of households that are store chain switchers, but choosestores randomly (i.e., store choice itself is a zero order process). The difference in storechoice between the two segments is that for segment one, there is state dependence in storechoice and consumers switch in predictable ways by making regular trips to larger storesand fill-in trips to small neighborhood stores.
The first 21 parameters are the location of the different stores on the market structuremap (or the latent store attributes). The first column with estimates represents the storedimension (the al(m) parameters) and reflects household perceptual differences amongstores. The second column reflects the differences between store chains (the am parame-ters). Figure 1 shows the market structure map that provides an overview of the interstore(and store chain) competition. The dimensions of this graph need to be inferred from thedata. The first dimension appears to represent the spatial competition between stores. Weinfer this from the store switching matrix, as stores located in the same geographicalregion tend to be closer competitors and the perceptual differences are quite consistent
TABLE 3
Model Fit of Different Interpurchase Shopping Time Distributions(no heterogeneity)
Distributions Likelihood No of Parameters BIC
Gamma 53737.38 35 107113.8Log-Logistic 52221.20 35 104081.6Weibull 55764.0 35 111167.2Exponential 62402.8 34 124453.9
336 Journal of Retailing Vol. 76, No. 3 2000

TABLE 4
Results for Factor-Analytic Log-Logistic Model (2 Segment Solution)
Parameters
Log-Logistic Hazard Model Heterogeneous Logit Model
Estimate (s.e.) Estimate (s.e.) Estimate (s.e.) Estimate (s.e.)Common Factors Common Factors
StoreDimension
ChainDimension
StoreDimension
ChainDimension
1 Chain 1: (Store 11) 2.195 (.015) 2.056 (.027) 2.589 (.015) 2.106 (.009)2 a (Store 21) .074 (.057) 2.056 (.027) .722 (.015) 2.106 (.009)3 a (Store 31) .147 (.034) 2.056 (.027) 1.837 (.026) 2.106 (.009)4 a (Store 41) .326 (.036) 2.056 (.027) 2.629 (.019) 2.106 (.009)5 a (Store 51) 2.939 (.036) 2.056 (.027) 2.182 (.009) 2.106 (.009)6 a (Store 61) .584 (.035) 2.056 (.027) 22.162 (.027) 2.106 (.009)7 a (Store 71) 2.588 (.041) 2.056(.027) 21.082 (.017) 2.106 (.009)8 a (Store 81) 2.421 (.068) 2.056 (.027) .796 (.018) 2.106 (.009)9 a (Store 91) 2.242 (.036) 2.056 (.027) 2.583 (.016) 2.106 (.009)10 Chain 2: a (Store 12) 2.235 (.024) .177 (.018) .522 (.016) .575 (.009)11 a (Store 22) 2.308 (.034) .177 (.018) .039 (.016) .575 (.009)12 a (Store 32) .206 (.040) .177 (.018) 21.586 (.017) .575 (.009)13 Chain 3: a (Store 13) 2.511 (.021) 2.118 (.028) .405 (.012) .176 (.013)14 a (Store 23) 2.862 (.052) 2.118 (.028) .082 (.016) .176 (.013)15 a (Store 33) .075 (.011) 2.118 (.028) .608 (.027) .176 (.013)16 a (Store 43) 2.247 (.013) 2.118 (.028) 2.551 (.009) .176 (.013)17 a (Store 53) .198 (.043) 2.118 (.028) 21.687 (.023) .176 (.013)18 Chain 4: a (Store 14) 2.057 (.014) 2.042 (.026) 2.461 (.012) 2.628 (.009)19 a (Store 24) .257 (.033) 2.042 (.026) 21.086 (.015) 2.628 (.009)20 a (Store 34) 0a 2.042 (.026) 0a 2.628 (.009)21 Chain 5: a (Store 15) 0a 0a 0a 0a
gsl(m) Self Transitions Chain Specific Intercepts22 Chain 1 2.988 (.041) 2.193 (.011)23 Chain 2 2.949 (.062) .146 (.011)24 Chain 3 2.962 (.091) 2.998 (.08)25 Chain 4 21.106 (.061) .782 (.015)26 Chain 5 2.933 (.011) 0a
Segment 1 Segment 2 Segment 1 Segment 227 wst 2.257 (.038) 1a 2.581 (.013) 128 wc 1a 2.224 (.043) 1 2.412 (.027)29 bst .208 (.023) 2.017 (.024) 2.704 (.019) 2.623 (.019)30 bc .882 (.011) .977 (.093) 21.50 (.025) 2.704 (.022)31 Hours Worked 2.126 (.057) .078 (.006) .694 (.015) 21.327 (.019)32 Income 2.011 (.052)ns .026 (.063)ns 2.032 (.011) .762 (.223)33 Total .249 (.004) .371 (.005) 2.189 (.019) 2.095 (.010)34 Amount 2.133 (.005) 2.117 (.006) .299 (.014) .268 (.008)35 Household Size .026 (.056)ns .135 (.005) .360 (.011) .427 (.016)36 m 3.391 (.018) n.e. n.e.37 Mass .47 .53 .48 .52
211 512738 71005.2BIC 103475.4 141556.81
aParameter constrained for identification.
Consumer Store Choice Dynamics 337

with the switching patterns between the different stores. Note that this is an importantadvantage of our model, as data on the distance between stores is not always available.
The second dimension measures differences in store chains and is consistent with thepricing strategy (i.e., EDLP vs. Hi-Lo) used by the store-chain. This we inferred from theprice data available for five different product categories. Chain 1 consists of nine medium
FIGURE 1
a. Competitive Market Structure Map of Grocery Stores (Hazard Model 1).b. Competitive Market Structure Map for Grocery Stores (Logit Model).
338 Journal of Retailing Vol. 76, No. 3 2000

and smaller-sized stores with above average prices; Chain 2 comprises three largesupermarkets that have the lowest prices; Chain 3 is made up of five smaller stores withthe highest prices; Chain 4 consists of medium-sized stores with medium level prices; andChain 5 is a single larger supermarket with competitive prices. As can be seen from Figure1, stores of a chain are spread across the distance dimension. In particular note Store61,Store51, and Store23, which are located away from other stores; these are smaller neigh-borhood stores with very low sales.
Parameters 22 through 26 in Table 4 are estimates for repeat shopping trips. Thenegative coefficients indicate that repeat shoppers tend to shop less often (consistent withKim and Park, 1997; Popkowski Leszczyc and Timmermans, 1997). These estimates aresimilar for the different chains. The next two parameterswst andwc are the importanceweights the two segments attach to the latent attributes of the map in Figure 1. Forsegment one, dimension one has a negative weight and dimension two a positive weight.The positive weight for the chain dimension (wc * ac
11) indicates that households insegment one tend to shop at Chain 2, and are willing to travel farther to go to larger storeswith lower prices. Segment two’s shoppers mostly shop at the other chains that tend to besmaller, more expensive neighborhood stores.
The results for the household demographic variables show all variables to be significantwith the exception of income. The number of hours worked by a household decreases thelikelihood of making a shopping trip for segment one, but increases the likelihood forsegment two. It seems that segment two consists of more single earner families with astay-at-home spouse who may have more time to go shopping. The total number ofshopping trips made by a household during the calibration period increases the transitionprobability, meaning that the hazard rates for heavy shoppers are different from lightshoppers. The acceleration in the rate of shopping due to heavy shoppers is greatest forsegment two. Households that spend more per shopping trip tend to shop less often;particularly for households in segment one. Household size has a positive effect on thelikelihood of a shopping trip. This effect is the strongest for segment two, wherehouseholds tend to shop at smaller neighborhood stores.
We also estimated a model with chain specific demographic parameters, but it did notoutperform the model above based on the BIC criterion. This is not to say that demographicvariables have no differential effect on transitions between store-chains. These differences arenot significant after adjusting for the differences between the two segments. Transitions arestill impacted in a different way by demographic variables because the two segments shop atstores with different rates. This is discussed under the results for intershopping timing.
The last two columns in Table 4 provide the results of a heterogeneous logit model toprovide a comparison with a store choice model that does not incorporate interpurchasetiming. The logit model estimated here is a latent class factor analytic store choice model.The fit statistics of the logit and the hazard model are not directly comparable and fit forthe hazard model is generally lower as one needs to predict the store choice as well as thetiming of shopping trips (Popkowski Leszczyc, 1992). Parameter estimates for the twomodels are expected to be different due to the addition of timing of shopping trips in thehazard model. However, it is important to note that the hazard model is superior ontheoretical grounds, and we have empirically illustrated that store choice and the timingof shopping trips are dependent.
Consumer Store Choice Dynamics 339

Finally, we compare the results of the market structure analysis, as these have importantmanagerial implications. The estimates of the location of the latent attributes in perceptualspace (parameters 1 through 21) differ substantially (the correlation between these pointsis only 20.33). More importantly, the interpretation of the dimensions of the marketstructure map is less clear for the logit model (e.g., for chains, the latent attribute is notconsistent with the chain’s pricing strategy).
Results of Intershopping Timing
The log-logistics distribution was used to model intershopping timing. Figure 2 shows
FIGURE 2.
340 Journal of Retailing Vol. 76, No. 3 2000

the intershopping time distributions for the different stores. All hazard functions arenonmonotonic implying that the likelihood of a shopping trip first increases, reaches amaximum around 3 days, and decreases after the heavy shoppers made their shoppingtrips. Figures 2a-f show the distributions for repeat shopping trips for different stores bysegment. We only present a small selection of the graphs, and summarize the overallresults below. Figure 2a, shows that segment two has a considerably higher likelihood ofmaking a repeat trip to S11 (Store 1 of Chain 1), than segment 1 does. The differencesbetween the repeat trips for the two segments is considerably smaller for S21 (Store 2 ofChain 1, see Figure 2b), whereas for S51, a small store located away from other stores,segment two has a very low probability of making repeat trips (see Figure 2c). In contrast,Figure 2d shows that segment one has a higher likelihood of making a repeat trip to S12.Figures 2e and f show the repeat trips for stores S13 and S15, respectively. Figures 2g-jshow switching trips between S12 and S34, and between S12 and S81. These stores aremajor competitors as indicated by the location on the market structure map in Figure 1a(based on the distance dimension). Figure 2g and 2h show the switching trips between S12
FIGURE 2
Continued
Consumer Store Choice Dynamics 341

and S34, for segments one and two, respectively. For segment one, households are morelikely to switch from S12 to S34 than from S34 to S12, indicating that store S12 is losinghouseholds (of segment 1) to store S34. However, the opposite is true for segment two. Forswitching between S12 and S81, Figures 2i and 2j illustrate that store S81 is losingcustomers to store S12 from both segments.
In general, we observed a considerable difference in intershopping time for the differentstores and segments for both repeat and switch trips. Segment one had a higher likelihoodof making repeat trips to stores of Chains 1, 3, 4, and 5, whereas segment two makes morerepeat trips to stores of Chain 2. The difference in the repeat shopping for the segmentswas influenced by the location on the perceptual space in Figure 1, as stores that havemore competitors (are located closer together on the store dimension) have smallerdifferences. Also, households tended to have a higher likelihood to make a repeatshopping trip than a switch trip.
The rejection of the exponential intershopping time distribution implies durationdependence. This means that models like the Dirichlet model, which are based onassumptions of duration independence, may lead to biased results. These findings alsohave important implications for management because duration dependence may lead topotential acceleration of shopping trips. Benefits to store owners may be substantialbecause consumers make multiple purchases at a store.
CONCLUSIONS AND MANAGERIAL IMPLICATIONS
This research aims to obtain a better understanding of consumer shopping behavior byderiving a model of consumer store choice dynamics. Store choice dynamics has receivedonly limited attention in the marketing literature. Furthermore, the models used rely onlimiting and rigid assumptions. The Dirichlet model assumes independence of intershop-ping timing and store choice. Results indicate duration dependence in the intershoppingtime distribution, which is in disagreement with the assumptions of the Dirichlet model.The logit model only considers store choice, and empirical evidence shows that shoppingtrip timing and store choice behavior are dependent processes, and that omitting the timingof shopping trips may lead to biased results and different managerial implications.
Implications from the market structure maps also differ substantially between the logitand hazard model. The logit model provides a more stationary representation based onmarket shares, whereas the hazard model provides a dynamic representation derived fromthe timing and switching between stores. Therefore, the logit model may be moreappropriate for the modeling of brand choice data, and the hazard model for store choicedata as manifested by the market structure maps. Due to switching between regular andfill-in trips, the hazard model provides a better spatial representation. Hence, the hazardmodel is a natural candidate to study store choice dynamics.
We proposed a novel hazard model that has several unique components. The modelallows for the dependence of store choice and the timing of shopping trips, durationdependence, and state dependence. Our model includes a market structure analysisshowing the competitive retail structure. The market structure analysis utilizes latent
342 Journal of Retailing Vol. 76, No. 3 2000

attributes that are both specific to stores and store chains. Furthermore, we incorpo-rate heterogeneity using a latent class model, identifying different segments of shoppers.
In addition, our model provides important insights into consumer shopping behavior notobtained from other models. Analysis identified two different segments, which differ intheir shopping behavior. Although both segments revealed significant switching betweenstores and chains, the nature of switching varied. For segment one, we observed statedependence in store switching, whereas for segment two, switching was zero-order. Theinternal market structure analysis revealed a competitive market structure based on pricingstrategies and spatial competition between stores.
In general, managers can use these results to determine the positioning strategy of theirmajor competitors or for altering positioning strategies to increase the competitiveness ofthe store or chain.
Finally, the purchase timing distribution offered information about the timing ofshopping trips. We observed significant differences between the intershopping times fordifferent stores and for switchers versus repeat shoppers. The different segments ofshoppers also differed in the timing of shopping trips, and we observed asymmetry in thetiming for switching trips. These results provide important information to retail manage-ment who focus on increasing store traffic. This is especially important for shoppingbehavior as consumers make multiple purchases during a trip.
Acknowledgments: The authors are grateful to A.C. Nielsen Inc. for providing the data. Wealso thank Frank Bass, Adam Finn, Paul Messinger, the participants of seminar series at theUniversity of Alberta, the Chinese University of Hong Kong, the Hong Kong University ofScience and Technology, the anonymous reviewers, and especially the editor for helpfulsuggestions. Funding for this research has been received from the Pearson Fellowship and theCentral Research Fund at the University of Alberta, and the Social Sciences and HumanitiesResearch Council of Canada.
NOTES
1. Wrigley and Dunn (1985), therefore, extend this model by including independent variablesas a function of one of the parameters of the Dirichlet distribution.
2. Other articles have estimated nested logit models. In these, brand choice is nested withinthe purchase incidence decision (Bucklin and Lattin, 1992; Kahn and Schmittlein, 1992).
3. Market structure models have also incorporated state dependence and exogenous variables,but these models do not estimate switching matrices. For a review of these models see Elrod (1991)and Elrod and Keane (1995). To the best of our knowledge, these models have not been applied tothe analysis of store choice.
4. There have been several other, more descriptive articles that studied grocery-shoppingbehavior. Kahn and Schmittlein (1989) studied household shopping trip behavior, distinguishingbetween major and fill-in trips. Popkowski Leszczyc and Timmermans (1997) studied the effects ofconsumer demographics on repeat trips, store loyalty, shopping frequency and fill-in trips, whereasBawa and Ghosh (1999) also considered shopping trip frequency and expenditure per trip as afunction of consumer demographics.
Consumer Store Choice Dynamics 343

5. Bell and Lattin (1998) have studied the effect of marketing mix variables on store choice,by considering the purchase of a basket of goods.
6. Kim and Park (1997) observed that shoppers are heterogeneous in terms of their shoppingtrip regularity and shopping frequency. They found that 70% of shoppers visit grocery stores withrandom intervals and 30% with relatively fixed intervals. The “routine” shoppers tended to shop lessoften, and were more loyal.
7. An alternative specification is the proportional hazard model. In this model, the covariatesproportionally shift the hazard function up or down, whereas in the accelerated time model thecovariates increase or decrease the time until a shopping trip is made. Because we are interested instudying the impact of explanatory variables on store choice and on the timing of shopping trips, thisvery property makes the accelerated time model most appropriate.
REFERENCES
Bawa, Kapil and Avijt Ghosh. (1999). “A Model of Household Grocery Shopping Behavior,”Marketing Letters,10 (2): 149–60.
Bell, David R. and James M. Lattin. (1998). “Shopping Behavior and Consumer Preference for StorePrice Format: Why ‘Large Basket’ Shoppers Prefer EDLP,”Marketing Science,17 (1): 66–88.
Blattberg, Robert C. and Kenneth J. Wisniewski. (1987). “How Retail Promotions Work: EmpiricalResults,” University of Chicago, working paper # 42.
Bucklin, Randolph E. and James M. Lattin. (1992). “A Model of Product Category CompetitionAmong Grocery Retailers,”Journal of Retailing, 68 (3): 271–93.
Burnett, P. (1973). “The Dimensions of Alternatives in Spatial Choice Processes,”GeographicalAnalysis,5: 181–204.
Chintagunta, Pradeep K. (1998). “Inertia and Variety Seeking in a Model of Brand-PurchaseTiming,” Marketing Science, 17 (3): 253–70.
. (1994). “Heterogeneous Logit Model Implications for Brand Positioning,”Journal ofMarketing Research, 3 (2): 304–311.
Cox, D. R. and D. Oakes. (1988).Analysis of Survival Data. London: Chapman and Hall.Elrod, Terry. (1988). “Choice Map: Inferring a Product Market Map from Panel Data,”Marketing
Science,7 (1): 21–40.Elrod, Terry. (1991). “Internal Analysis of Market Structure: Recent Developments and Future
Prospects,”Marketing Letters,2: 253–266., and Michael P. Keane. (1995). “A Factor Analytic Model for Representing the Market
Structure in Panel Data,”Journal of Marketing Research, 32: 1–16.Erdem, Tulin. (1996). “A Dynamic Analysis of Market Structure Based on Panel Data,” Marketing
Science,15 (4): 359–378.Fotheringham, S. A. (1988). “Consumer Store Choice and Choice Set Definition,”Marketing
Science,7: 299–310.Gonul, Fusun F. and Kannan Srinivasan. (1993). “Consumer Purchase Behavior in a Frequently
Bought Product Category: Estimation Issues and Managerial Insights from a Hazard FunctionModel with Heterogeneity,”Journal of the American Statistical Association,88 (424): 1219–27.
Grover, Raj and V. Srinivasan. (1987). “Simultaneous Approach to Market Segmentation andMarket Structuring,”Journal of Marketing Research,24 (May): 139–53.
Grover, Rajiv and Vithala R. Rao. (1988). “Inferring Competitive Market Structure Based on aModel of Interpurchase Intervals,”International Journal of Research in Marketing,5: 55–72.
344 Journal of Retailing Vol. 76, No. 3 2000

Gupta, Sunil. (1991). “Stochastic Models of Interpurchase Time with Time Dependent Covariates,”Journal of Marketing Research,28 (February): 1–15.
Heckman, James J. (1981). “Heterogeneity and State Dependence.” Pp. 91–139 in S. Rosen (Ed.),Studies in Labor Markets. Chicago: University of Chicago Press.
Hoch, Stephen J., Xavier Dre`ze and Mary E. Purk. (1994). “EDLP, Hi-Lo, and Margin Arithmetic,”Journal of Marketing,58 (October): 16–27.
Howard, Ronald A. (1964). “System Analysis of Semi-Markov Processes,”IEEE Transactions onMilitary Electronics,114–124.
Kahn, Barbara E. and David C. Schmittlein. (1989). “Shopping Trip Behavior: An EmpiricalInvestigation,”Marketing Letters,1 (1): 55–69.
and . (1992). “The Relationship Between Purchases Made on Promotion andShopping Trip Behavior,”Journal of Retailing, 68 (Fall), 294–315.
Kalbfleisch, J. D. and Ross L. Prentice. (1980).The Statistical Analysis of Failure Time Data. NewYork: John Wiley & Sons.
Kamakura, Wagner and G. J. Russell. (1989). “A Probabilistic Choice Model for Market Segmen-tation and Elasticity Structure,”Journal of Marketing Research,26: 379–390.
Kau, Ah Keng and A. S. C. Ehrenberg. (1984). “Patterns of Store Choice,”Journal of MarketingResearch, 21 (November): 399–409.
Kim, Byung–Do and Kyungdo Park. (1997). “Studying Patterns of Consumer’s Grocery ShoppingTrip,” Journal of Retailing,73 (4): 501–517.
Kumar, V. and Robert P. Leone. (1988). “Measuring the Effects of Retail Store Promotions onBrand and Store Substitution,”Journal of Marketing Research, vol. 25 (May): 178–85.
Lawless, J. F. (1982).Statistical Models and Methods for Lifetime Data, New York: John Wiley & Sons.Popkowski Leszczyc and T. L. Peter. (1992). “Investigating the Effects of nobserved Heterogeneity
in Stochastic Models of Consumer Choice: A Hazard Model Approach,” Doctoral Dissertation,University of Texas at Dallas.
and Frank M. Bass (1998). “Determining the Effects of Observed and Unobserved Heter-ogeneity on Consumer Brand Choice,”Applied Stochastic Models and Data Analysis,14: 95–115.
and Harry J. P. Timmermans. (1997). “Store Switching Behavior,”Marketing Letters,8 (2):193–204.
Sinha, Ashish. (2000). “Understanding Supermarket Competition Using Choice Maps,”MarketingLetters,11 (1): 21–35.
Uncles, Mark D. and Andrew S. C. Ehrenberg. (1988). “Patterns of Store Choice: New Evidencefrom the USA.” Pp. 272–299 in Neil Wrigley (Eds.),Store Choice, Store Location and MarketAnalysis. London: Routledge.
and Kathy A. Hammond. (1995). “Grocery Store Patronage,” International Review ofRetail, Distribution and Consumer Research, 5 (3), 287–302.
Vilcassim, Naufel J. and Dipak C. Jain. (1991). “A Semi-Markov Model of Purchase Timing andBrand Switching Incorporating Explanatory Variables and Unobserved Heterogeneity,”Journalof Marketing Research,28 (February): 29–41.
Wittink, Dick R., Michael J. Addona, William J. Hawkes and John C. Porter. (1987). “SCAN*PRO:A Model of Promotional Activities on Brand Sales, Based on Store-Level Scanner Data,”unpublished working paper.
Wrigley, N. and R. Dunn. (1984). “Stochastic Panel-Data Models of Urban Shopping Behaviour: 2.Multistore Purchasing Patterns and the Dirichlet Model,”Environment and Planning,A16:759–778.
and . (1985). “Stochastic Panel-Data Models of Urban Shopping Behaviour: 4.Incorporating Independent Variables into the NBD and Dirichlet Models,”Environment andPlanningA 17: 319–333.
Consumer Store Choice Dynamics 345